i.c. engines. stepped pyrolysis of biomass and its
TRANSCRIPT

Page 1/21
Production of Hydrogen and Methane Rich Gas byStepped Pyrolysis of Biomass and Its Utilization inI.C. Engines.BRIJESH Kumar PRAJAPATI
IIT (ISM): Indian Institute of TechnologyShalini Gautam ( [email protected] )
IIT (ISM): Indian Institute of Technology https://orcid.org/0000-0003-4778-1388Amrit Anand
IIT (ISM): Indian Institute of TechnologyPreetam Singh
IIT BHU: Indian Institute of Technology BHU Varanasi
Research Article
Keywords: Bio-HCNG, Ultimate Analysis, Pyrolysis, Gas Chromatography, I.C. engines
Posted Date: May 17th, 2021
DOI: https://doi.org/10.21203/rs.3.rs-471934/v1
License: This work is licensed under a Creative Commons Attribution 4.0 International License. Read Full License

Page 2/21
AbstractAutomobile industries are majorly based on petroleum-based fuels like petrol and diesel that createenvironmental hazards, a high carbon footprint, and creating serious health issues. To reduce theproblem associated with fossil fuel utilization, the world is focusing on CNG-based energy solutions anddeveloping the infrastructures for CNG. There is a need to transfer towards hydrogen fuel-basedinfrastructure in near future. The current focus to introduce a fraction of hydrogen with CNG in theexisting fuel system is initiated here. Therefore, the utilization of biomass is taken into account for theproduction of high hydrogen-containing fuel to cut down the carbon footprint and environmental issues.Biomass residues such as Sun hemp, Pigeon pea, Mustard stem, Wheat straw, Dhaincha, and Vantulsiwere slow pyrolyzed in a stepped manner to produce a hydrogen-rich clean fuel. Product gas (hydrogen-rich CNG i.e., H-CNG) obtain by this pyrolysis process contains almost 40%-55% hydrogen and 10%-25%methane balanced with oxides of carbon depending on different biomass feedstocks. This study is alsofocused on the performance of 2kva HONDA Genset in terms of its running duration when obtained Bio-HCNG gas is used as fuel and a correlation is also developed between H2, CH4, ΔH (Change in Hydrogenwt. % during the process) and D (Duration for which Genset will run in minutes) i.e., D = -6.25 + 0.996ΔH +0.3889CG for model 1 & D = -9.20 + 0.090ΔH + 0.6099H2 + 0.1893CH4 for model 2.
1. IntroductionEnergy is the lifeblood of human society; imagining the world without a continuous supply of energy isimpossible; currently, the major portion of energy demand ful�lls by fossil fuels. However, the continuoussupply of fossil fuels is becoming a challenge in recent years resulting in a continuous price rise(Edwards et al. 2007; Pawar et al. 2013). Further, the exhausts resulting from the combustion of thesefossil fuels are very dangerous, for human beings and the environment leaving a huge carbon footprintbehind (Reşito lu et al. 2015). The inter-related problems of energy and the environment are one of the biggest challenges the world is facing today.Energy sustainability and the decreasing carbon footprint is the biggest challenge, that must be attainedand recti�ed in an accelerated way. The thermochemical conversion route is a good solution to usebiomass energy in the technical application (Chen et al. 2003) and to overcome the environmentalpollution due to exhaust of internal combustion (IC) engines and industries, the world is moving towardsCNG and HCNG (a mixture of Hydrogen and CNG) (Lang et al. 2011; Jiang et al. 2012; Abuadala andDincer 2012).
Hydrogen has many positive characteristics while using in internal combustion engines like better�ammability, improve the performance of engines due to these reasons HCNG has more advantages overCNG. (Moreno et al. 2012). Emission (Exhaust) of the hydrogen fuel system is water vapor which doesnot have any adverse environmental effect, so it can be adopted as a future fuel because of its differentcharacteristics like rapid burning speed, no emissions of greenhouse gases, higher energy density, lowminimum ignition energy, and a very high octane number (Ingersoll 1996; Mu et al. 2006; Balat and Kirtay2010; Luque et al. 2011).

Page 3/21
The immediate replacement of fossil fuel systems with a pure hydrogen system is a gigantic task andmust be attained in a stepwise manner in the near future. One of the alternatives is to replace aproportion of hydrogen with methane in a stepwise manner so that smooth transfer from petroleum-based technology to hydrogen-based technology can be done (Nanthagopal et al. 2011). Manyconventional and established ways are there to obtain H2 and CH4 mixture, but they can only beenvironment friendly if extracted from renewable energy sources like biomass other than fossil fuels.Hydrogen can be obtained from syngas, methane reforming, and dark fermentation processes whosemain gaseous component is hydrogen. However, methane can be obtained from the anaerobic digestionprocess (Liu et al. 2018).
Agricultural or forestry wastes can be considered as a potential source of renewable energy. Theestimation of Bio-waste produced each year is about 120 billion tons, the energy capacity of which is �vetimes the total current energy consumption in the world, is formed each year using photosynthesis, only1% of the total energy capacity has been used as energy, which can supply 14% of total energyconsumption in the world, however, most of the biomass waste goes under bacterial decomposition orcombustion which results in GHG emissions into the atmosphere (Wengjie Wang).
In the literature (Luo et al. 2011), (David et al. 2019) it is reported that researchers follow a two-stageanaerobic digestion process to get Bio-HCNG in different proportions. Sometimes hydrogen and methaneare produced separately, and to get HCNG different appropriate proportion of hydrogen and methane ismixed. The main routes to produce hydrogen from agricultural and forestry residues are namely thermo-chemical and biochemical processes. Thermo-chemical routes can be adopted for continuous and rapidutilization of biomass. Thermo-chemical routes are gasi�cation (Chang et al. 2011), pyrolysis of bio-oil(Xu et al. 2010), steam reforming of biomass-derived higher alkanes and alcohols (Seyedeyn-Azad et al.2011), and aqueous phase reforming of oxygenated hydrocarbons (Chang et al.) The main route ofgetting methane from biowastes is anaerobic digestion.
Gasi�cation is a process where hydrocarbons undergo partial combustion and the main product issynthesis gas. Slow pyrolysis is a process in which bio-organic materials undergo thermal degradation ina completely oxygen-free atmosphere. At the end of biomass pyrolysis one can get solid (biochar), liquid(bio-oil), and bio-gas [a mixture of H2, CO, CH4, CO2, and lower hydrocarbon of (C1 –C3)] (Karagöz 2009).Biomass structures also de�ne the proportion of different pyrolytic products and the composition of thegaseous product. The heating rate also changes the composition of different pyrolytic products(Debdoubi et al. 2006). As lignin is responsible for high H2 and CH4 formation, hemicellulose isresponsible for the high CO2 emission, and cellulose is responsible for high CO production (Hlavsová etal. 2014). The content of hydrogen (H2) is dependent on the temperature of pyrolysis and increases asthe latter increases, (Li et al. 2004; Domínguez et al. 2007; Dufour et al. 2009; Neves et al. 2011). Theconversion of raw biomass to the gaseous product during the pyrolysis process is high (Zhao et al.2001). Unfortunately, the pyrolysis process has been adopted to produce liquid fuel from biomass, not agaseous fuel. The gas yield from conventional pyrolysis process is very low, generally, less than 40 by

Page 4/21
wt.% and besides corrosion is a serious issue to downstream equipment, like a gas turbine/engine,caused by the high content of higher hydrocarbons vapor (Tar) contained in the gas phase, these are thereasons which supports the above approach (Buhre and Andries, 2000). However, pyrolysis gas is moreadvantageous, has a higher heating value in compared with conventional gasi�cation gas, and thereforecan be applied well to the downstream gas turbine/combustion engines to generate power or used forother civil purposes (Chen et al. 2003). This work indicates the potentiality and utilization of obtainedpyrolytic gases for different purposes from different biomasses.
The �nal goal of the present work is to compare the composition, the process, and yield of gaseousproducts w.r.t. temperature during the stepped pyrolysis of different agricultural residues in a �xed bedreactor. It also emphasizes the potential utilization in downstream equipment of gases evolved during thepyrolysis process in a 2kva HONDA petrol Genset. This paper explores the method to produce high yieldhydrogen and methane or HCNG in a single process from different agricultural waste.
2. Material And Methods2.1 Sample collection and Preparation
The raw material used for this present study were agricultural waste like Pigeon pea, sun hemp, mustardstem, wheat straw, dhaincha (sesbania bispinosas), and forestry waste like vantulsi (OcimumGratissimum) were used as biomass feed. These samples are abbreviated as PP, SH, MS, WS, DH, and VTrespectively. These samples were collected from the village area of Varanasi and the forestry area of theMirzapur district of Uttar Pradesh, India. The biomass samples were �rst dried in a normal atmospherefor 5-10 days and then chopped and milled in the size range of <2 inches. Then the sample was oven-dried at 105˚C for 24 hours. The biomass samples were prepared in the size range of -18#+72# andutilized for different analyses.
2.2 Reactor Setup and testing: Reactor design/set-up and attached testing facility layout are given belowFigure 1. shows the �ow chart of the test reactor.
The biomass conversion was performed under anaerobic conditions in our designed pyrolysis reactor.The reactor set up consists of a quartz reactor, a tripod sample holder is there which holds the sampleinside the heating zone, and a furnace with a PID controller, in addition to this there is a toggle valve atthe bottom of the reactor which facilitates the �ow of nitrogen inside the reactor to maintain the oxygen-free environment. Setup is also provided with an electric resistance furnace for indirect heating the chargeand a pressure regulator are there to show and control the pressure inside the reactor. A condenser is alsoattached at the outlet of the reactor to separate condensable (Bio-oil + water) from non-condensable gas.Non-condensable gas is collected in a gas collector, and intermediate gas sampling is carried out to getthe composition of product gas with temperature.
2.3 Experimental Procedure

Page 5/21
Pyrolysis is the process in which biomass decomposes into valuable cleaner fuel under anaerobicconditions at elevated temperatures in a vertical reactor. In this process, the biomass samples of <2inches size are fed into the reactor. The test sample was kept in the reactor and N2 gas was purged insidethe reactor to maintain an inert environment. Product gases were analyzed by gas chromatography (G.C.)(MM TECH, M 2012) equipped with a molecular sieve pack column and thermal conductivity detector(TCD). The analysis was carried out using (N 2000) software attached with the instrument. Once the inertatmosphere is achieved in the reactor, nitrogen purging is stopped and heating of the reactor starts till thetemperature of the reactor reaches up to 150˚C @ 15˚C/minute. Once the pressure inside the reactorreached up to 1.1bar at 150˚C, the valve is opened to remove the exhaust that mostly contains moisture.Valve closed and again further N2 is purged in the reactor to maintain an inert atmosphere. Heating thereactor resumed from 150˚C to 800˚C @ 25˚C/minute. At approximately, 400˚C when the pressure reaches1.2 bar, the valve was opened for sampling to examined the gas mixture through G.C. A very high CO2
was detected at this point. The valve was opened to release the exhaust and maintain the atmosphericpressure of the reactor. The valve was closed again. When the temperature reaches 600˚C and thepressure was 1.2 bar, the valve was opened again to examine gas content. The formation of H2, CH4, andCO2 wherever very little of CO was detected at this moment. After that, samples were taken at 700˚C,800˚C, and at 5 minutes after reaching 800˚C at a pressure close to 1.3 bar. The concentration of H2, CH4
was found to increase with temperature. Thus, during the pyrolysis process, the biomass was convertedinto valuable H2 and CH4 (the major component). During the study, the product exhaust gas mixture waspassed through condensers to make the gas-liquid or tar free.
3. Results And Discussion3.1 Proximate analysis of biomass samples
Proximate analysis of the biomass samples was carried out as per ASTM standard E871-82, E1755-01,and E872-82 (Suman and Gautam 2017), biomass char was also prepared following ASTM standardsD1762-84 (Suman and Gautam 2017), the result of proximate analysis is given in Table 1.
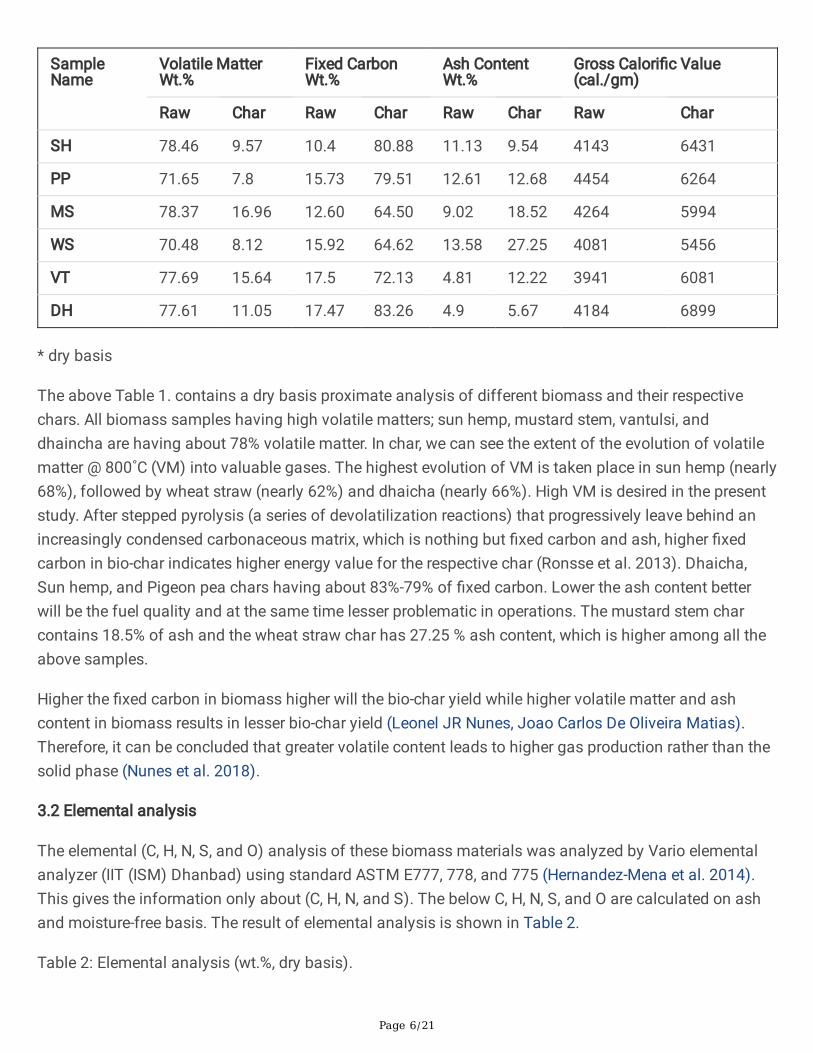
Table 1: Proximate analysis and GCV of biomass and char (*db).
Page 6/21
SampleName
Volatile MatterWt.%
Fixed CarbonWt.%
Ash ContentWt.%
Gross Calori�c Value(cal./gm)
Raw Char Raw Char Raw Char Raw Char
SH 78.46 9.57 10.4 80.88 11.13 9.54 4143 6431
PP 71.65 7.8 15.73 79.51 12.61 12.68 4454 6264
MS 78.37 16.96 12.60 64.50 9.02 18.52 4264 5994
WS 70.48 8.12 15.92 64.62 13.58 27.25 4081 5456
VT 77.69 15.64 17.5 72.13 4.81 12.22 3941 6081
DH 77.61 11.05 17.47 83.26 4.9 5.67 4184 6899
* dry basis
The above Table 1. contains a dry basis proximate analysis of different biomass and their respectivechars. All biomass samples having high volatile matters; sun hemp, mustard stem, vantulsi, anddhaincha are having about 78% volatile matter. In char, we can see the extent of the evolution of volatilematter @ 800˚C (VM) into valuable gases. The highest evolution of VM is taken place in sun hemp (nearly68%), followed by wheat straw (nearly 62%) and dhaicha (nearly 66%). High VM is desired in the presentstudy. After stepped pyrolysis (a series of devolatilization reactions) that progressively leave behind anincreasingly condensed carbonaceous matrix, which is nothing but �xed carbon and ash, higher �xedcarbon in bio-char indicates higher energy value for the respective char (Ronsse et al. 2013). Dhaicha,Sun hemp, and Pigeon pea chars having about 83%-79% of �xed carbon. Lower the ash content betterwill be the fuel quality and at the same time lesser problematic in operations. The mustard stem charcontains 18.5% of ash and the wheat straw char has 27.25 % ash content, which is higher among all theabove samples.
Higher the �xed carbon in biomass higher will the bio-char yield while higher volatile matter and ashcontent in biomass results in lesser bio-char yield (Leonel JR Nunes, Joao Carlos De Oliveira Matias).Therefore, it can be concluded that greater volatile content leads to higher gas production rather than thesolid phase (Nunes et al. 2018).
3.2 Elemental analysis
The elemental (C, H, N, S, and O) analysis of these biomass materials was analyzed by Vario elementalanalyzer (IIT (ISM) Dhanbad) using standard ASTM E777, 778, and 775 (Hernandez-Mena et al. 2014).This gives the information only about (C, H, N, and S). The below C, H, N, S, and O are calculated on ashand moisture-free basis. The result of elemental analysis is shown in Table 2.
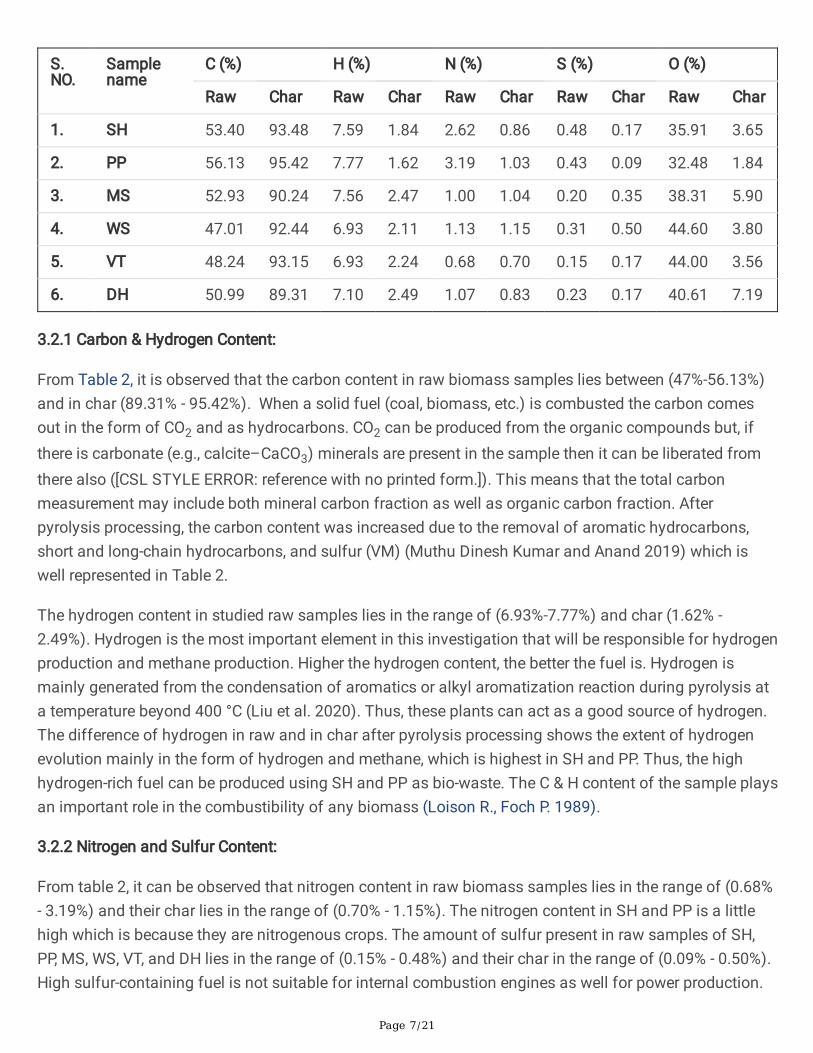
Table 2: Elemental analysis (wt.%, dry basis).
Page 7/21
S.NO.
Samplename
C (%) H (%) N (%) S (%) O (%)
Raw Char Raw Char Raw Char Raw Char Raw Char
1. SH 53.40 93.48 7.59 1.84 2.62 0.86 0.48 0.17 35.91 3.65
2. PP 56.13 95.42 7.77 1.62 3.19 1.03 0.43 0.09 32.48 1.84
3. MS 52.93 90.24 7.56 2.47 1.00 1.04 0.20 0.35 38.31 5.90
4. WS 47.01 92.44 6.93 2.11 1.13 1.15 0.31 0.50 44.60 3.80
5. VT 48.24 93.15 6.93 2.24 0.68 0.70 0.15 0.17 44.00 3.56
6. DH 50.99 89.31 7.10 2.49 1.07 0.83 0.23 0.17 40.61 7.19
3.2.1 Carbon & Hydrogen Content:
From Table 2, it is observed that the carbon content in raw biomass samples lies between (47%-56.13%)and in char (89.31% - 95.42%). When a solid fuel (coal, biomass, etc.) is combusted the carbon comesout in the form of CO2 and as hydrocarbons. CO2 can be produced from the organic compounds but, ifthere is carbonate (e.g., calcite–CaCO3) minerals are present in the sample then it can be liberated fromthere also ([CSL STYLE ERROR: reference with no printed form.]). This means that the total carbonmeasurement may include both mineral carbon fraction as well as organic carbon fraction. Afterpyrolysis processing, the carbon content was increased due to the removal of aromatic hydrocarbons,short and long-chain hydrocarbons, and sulfur (VM) (Muthu Dinesh Kumar and Anand 2019) which iswell represented in Table 2.
The hydrogen content in studied raw samples lies in the range of (6.93%-7.77%) and char (1.62% -2.49%). Hydrogen is the most important element in this investigation that will be responsible for hydrogenproduction and methane production. Higher the hydrogen content, the better the fuel is. Hydrogen ismainly generated from the condensation of aromatics or alkyl aromatization reaction during pyrolysis ata temperature beyond 400 °C (Liu et al. 2020). Thus, these plants can act as a good source of hydrogen.The difference of hydrogen in raw and in char after pyrolysis processing shows the extent of hydrogenevolution mainly in the form of hydrogen and methane, which is highest in SH and PP. Thus, the highhydrogen-rich fuel can be produced using SH and PP as bio-waste. The C & H content of the sample playsan important role in the combustibility of any biomass (Loison R., Foch P. 1989).
3.2.2 Nitrogen and Sulfur Content:
From table 2, it can be observed that nitrogen content in raw biomass samples lies in the range of (0.68%- 3.19%) and their char lies in the range of (0.70% - 1.15%). The nitrogen content in SH and PP is a littlehigh which is because they are nitrogenous crops. The amount of sulfur present in raw samples of SH,PP, MS, WS, VT, and DH lies in the range of (0.15% - 0.48%) and their char in the range of (0.09% - 0.50%).High sulfur-containing fuel is not suitable for internal combustion engines as well for power production.

Page 8/21
The low S & N containing biomass consider as a good fuel because there will be a low formation ofsulfur and nitrogen oxides during the thermochemical conversion process (Enweremadu and Ojediran2004). That is an indication that the biomass samples used in this study will not pollute the atmosphere.The sulfur-containing fuel affects adversely on the metal quality due to its corrosive nature towardsmetal, because of this reason sulfur-containing fuels are not �t for I.C. engines (Loison R., Foch P. 1989).Therefore, the biomass used in this work can reduce the corrosion severity impact on the equipment useand can reduce the cost for maintenance.
3.2.3 Oxygen Content:
From Table 2, the amount of oxygen present in raw samples is in the range of (32.48% - 44.60%) and theirchar in the range of (1.84% - 7.19%). Higher oxygen content was found in WS, VT, followed by DHwhereas SH and PP have a relatively lower percentage. The thermal decomposition of the oxygenfunctionality is responsible for the formation of Carbon dioxide and carbon monoxide, which is present inthe molecular structure of biomass (Nunes et al. 2018). Thus, for better applicability as a suitable fuelsource, the oxygen content and conversion should be less. In the case of SH and PP having lesser oxygenconversion took place, thus making them a better alternative as bio-waste to produce high hydrogen-containing fuel.
3.3 Calori�c values:
The combustion of a substance gives energy in the form of heat which can be used for differentpurposes (the blast furnace, power production, small furnaces, etc.). Biomass consist of volatile matterand �xed carbon as the main source are responsible for high calori�c values. Calori�c values of differentbiomass samples were tested in bomb calorimeter [IIT (ISM) Dhanbad] according to (ASTM D4809-00)standard test method (Suman et al. 2017).
The calori�c value of raw samples lies in the range of (3941 kcal/kg – 4454 kcal/kg) and their GCV in therange of (5456 kcal/kg – 6899 kcal/gm). well-represented in Table 1. Calori�c value is the result of thedifferent combustible elements present in the studied samples like (hydrogen & carbon) majorly. Thecalori�c value also can be calculated by using the below equation developed by Sheng and Azevedo
CV (MJ/kg) = -1.3675 + 0.3137*C + 0.7009*H + 0.0318*O …………. eq. (1) (Sheng and Azevedo 2005).
From this equation, it is seen that hydrogen is more responsible for calori�c value than carbon. so highhydrogen is desirable in a fuel. Raw PP has the highest hydrogen content nearly 8% that eventuallyvisualized in its overall highest calori�c value. On the other hand, the calori�c values of chars are theresult of carbon combustion. The higher the carbon content, the higher will be the calori�c values of char.DH char is having a high calori�c value of about 6900 kcal/kg, this is the result of a high �xed carbonpresence in DH.
3.4 Thermogravimetric analysis:

Page 9/21
The ASTM E1131-03 standard method was being followed for TGA by using a computerized NETZSCHSAT 449F3 TG analyzer [IIT (ISM) Dhanbad]. The temperature program used for the TGA shown in Figure2, starts at room temperature to 105°C and is further allowed to go up to 800°C with an increment rate of25°C/min in a nitrogenous environment.
The main components of all biomass are lignin, hemicelluloses, cellulose, and extractives. Theirconcentrations vary in different biomass samples depending on their growth conditions as well as fromspecies to species. These components decompose during pyrolysis and produce different condensable(bio-oil and tar) and non-condensable (gases) parts.
From the Table 3, the whole TGA is divided into 5 zones which interpret the decomposition of eachcomponent as below.
Table 3: Volatiles released (wt. %) during biomass pyrolysis in TGA
SAMPLENAME
MOISTURE ZONE-I<100
Volatiles released (%)
Temperature range (˚C)
ZONE-II
100 – 300
ZONE-III
300-400
ZONE-IV
400-600
ZONE-V
>600
TOTAL
SH 15 9 51 5 3 83
PP 12 19 27 11 7 76
MS 10 13 42 9 3 77
WS 11 11 30 10 5 67
DH 10.5 10.5 33 10 9 73
VT 15 26 20 8 6 75
Zone I: <100˚C mainly moisture evolution takes place in this zone.
Zone II: 100˚C-300˚C extractives start decomposing.
Zone III: 300˚C-400˚C predominantly hemicelluloses decomposition.
Zone IV: 400˚C-600˚C mainly cellulose and lignin decomposition.
Zone V: >600˚C mainly lignin decomposition (Raveendran et al. 1996).
Oxygen concentration is higher in the case of hemicelluloses and cellulose as compare to lignin, andfrom the above table, it is evident that at lower temperature hemicelluloses and cellulose decomposedand lignin decomposed at the higher temperature.
Page 10/21
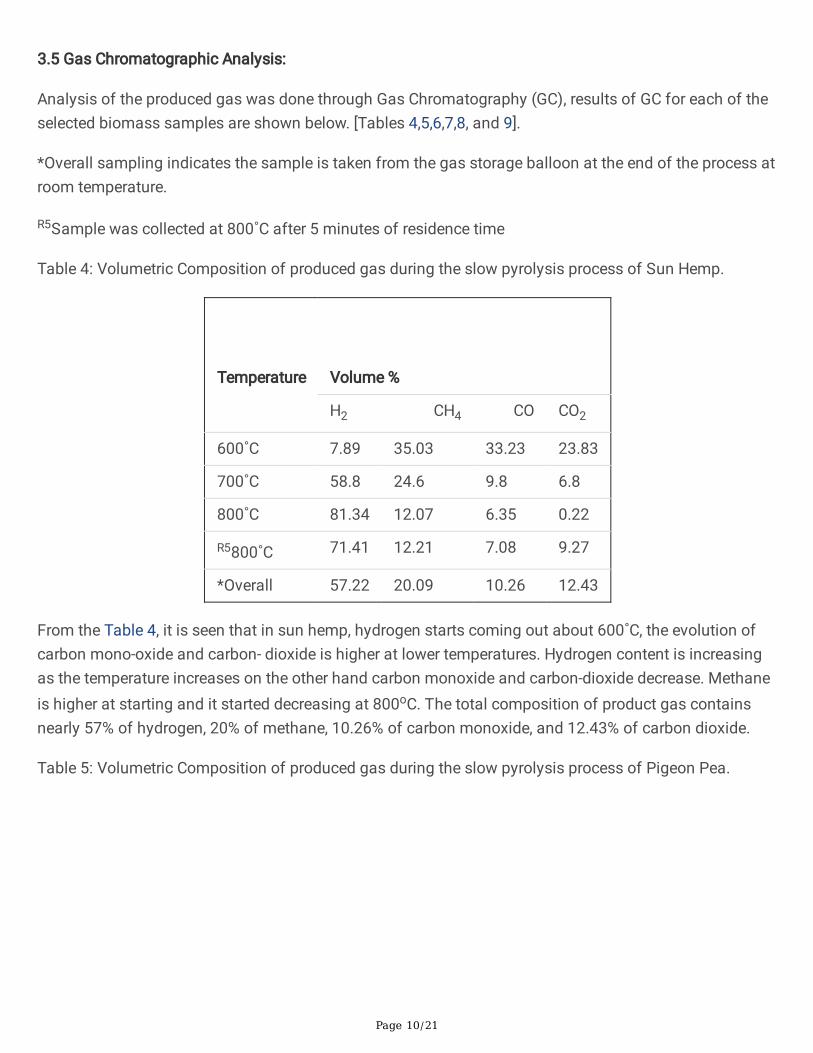
3.5 Gas Chromatographic Analysis:
Analysis of the produced gas was done through Gas Chromatography (GC), results of GC for each of theselected biomass samples are shown below. [Tables 4,5,6,7,8, and 9].
*Overall sampling indicates the sample is taken from the gas storage balloon at the end of the process atroom temperature.
R5Sample was collected at 800˚C after 5 minutes of residence time
Table 4: Volumetric Composition of produced gas during the slow pyrolysis process of Sun Hemp.
Temperature
Volume %
H2 CH4 CO CO2
600˚C 7.89 35.03 33.23 23.83
700˚C 58.8 24.6 9.8 6.8
800˚C 81.34 12.07 6.35 0.22
R5800˚C 71.41 12.21 7.08 9.27
*Overall 57.22 20.09 10.26 12.43
From the Table 4, it is seen that in sun hemp, hydrogen starts coming out about 600˚C, the evolution ofcarbon mono-oxide and carbon- dioxide is higher at lower temperatures. Hydrogen content is increasingas the temperature increases on the other hand carbon monoxide and carbon-dioxide decrease. Methaneis higher at starting and it started decreasing at 800oC. The total composition of product gas containsnearly 57% of hydrogen, 20% of methane, 10.26% of carbon monoxide, and 12.43% of carbon dioxide.
Table 5: Volumetric Composition of produced gas during the slow pyrolysis process of Pigeon Pea.

Page 11/21
Temperature
Volume %
H2 CH4 CO CO2
600˚C 12.8 54.2 16.8 16.2
700˚C 50.8 32.2 11.4 5.6
800˚C 47.08 30.5 10.3 12.12
R5800˚C 52.49 31.3 7.14 9.07
*Overall 52.45 18.82 11.50 15.85
As evident from Table 5, at 600˚C, the hydrogen is 12.8%, methane is 54.2%, carbon mono-oxide 16.8%and CO2 is 16.2%. At 700˚C, hydrogen increases, and the CH4 also decreases but not much, on the otherhand, the concentration of CO and CO2 decreases signi�cantly. Gas composition evolving at furthertemperatures like at 800˚C and 5 minutes after reaching 800˚C are almost the same as previously. Theoverall composition obtained from the product gas of pigeon pea was found close to 52.45 % H2, 18.82%CH4, 11.50% CO and approximately 16% CO2 and it is better than coal gas. H2 composition increasesfrom top to bottom w.r.t the increase in temperature. This may be because of the decomposition of ligninat higher temperatures which restricts the decomposition of bonds at lower temperatures.
Table 6: Volumetric Composition of produced gas during the slow pyrolysis process of Mustard Stem
Temperature
Volume %
H2 CH4 CO CO2
600˚C 23.6 5.4 35.9 35.1
700˚C 29.05 23.39 23.33 18.21
800˚C 51.3 23.03 12.62 13.05
R5800˚C 55.08 30.02 8.88 6.02
*Overall 52.53 25.65 4.03 17.39
From the Table 6, it is seen that the evolution of H2 is signi�cant at 600˚C its concentration is about23.6%, methane concentration is very less like about 5%, CO, and CO2 are high in concentration. At highertemperatures concentration of H2 increases and CH4 also increases but CO and CO2 decrease. The �nalcomposition of H2 is about 52 %, CH4 nearly 25%, CO is about 4% and CO2 is about 17%.
Table 7:Volumetric Composition of produced gas during the slow pyrolysis process of Wheat Straw

Page 12/21
Temperature
Volume %
H2 CH4 CO CO2
600˚C 27.9 43.6 12.8 14.9
700˚C 67.03 16.4 2.49 13.98
800˚C 77.91 13.3 2.16 6.55
R5800˚C 76.3 18.5 1.8 3.26
*Overall 51.29 19.9 9.98 19.83
From the Table 7, we can see that the production of H2 and CH4 starts at a relatively lower temperature.The concentration of H2 is 27%, CH4 is 43%, CO is 12% and CO2 is 15% at 600˚C. At higher temperatureslike at 700˚C, the concentration of hydrogen increases signi�cantly and the concentration of methane,carbon mono-oxide, and carbon dioxide are decreasing. At further temperatures, the concentration ofevolving gas is almost the same as at 700˚C. The �nal gas composition of gas produced during thepyrolysis of wheat straw is H2 51%, CH4 is about 20%, CO is about 10%and 19% CO2.
Table 8: Volumetric Composition of produced gas during the slow pyrolysis process of Dhaicha
Temperature Volume %
H2 CH4 CO CO2
600˚C 29.39 27.27 12.39 20.07
700˚C 53.57 27.07 2.38 14.41
800˚C 60.08 25.59 3.85 9.99
R5800˚C 67.2 19.5 4.15 9.15
*Overall 49.95 20.56 9.1 20.39
Table 8, shows that the concentration of H2 and CH4 at 600˚C is in a signi�cant amount, and CO, CO2 arerelatively low. At higher temperatures, H2 concentration is increasing from 29% to 67 % but in the case ofmethane, it is almost the same at a higher temperature to about 25%. The concentration of CO and CO2 isdecreasing to 9%. The overall composition of H2 is 49%, CH4 is 20%, CO is 9% and CO2 is 20%.
Table 9:Volumetric Composition of produced gas during the slow pyrolysis process of Vantulasi

Page 13/21
Temperature Volume %
H2 CH4 CO CO2
600˚C 34.6 7.6 1.33 55.97
700˚C 52.8 19.5 9.2 28.5
800˚C 58.6 19.7 9.2 12.12
R5800˚C 60.34 22.83 3.98 12.35
*Overall 38.12 8.46 1.25 51.8
From the Table 9, we can see that hydrogen content is 34.6%, methane is 7%, carbon mono-oxide is veryless than 1.33% and CO2 is 55% which is high in concentration at 600˚C. At higher temperatures yieldingof hydrogen, methane, carbon monoxide, and carbon-dioxide is increasing but carbon dioxide decreases.The overall volumetric concentration of the gaseous sample is H2 38%, methane 8%, carbon mono-oxide1.25%, and very high carbon dioxide 51.8%.
4. Application of BIO-HCNG in a 2kva petrol Genset for power production
As we can see in Figure 3, that the color of the �ame is very light blue which indicates the gaseousmixture is rich in hydrogen and methane which is highly suitable for the internal combustion engines forthe transportation sector. ([CSL STYLE ERROR: reference with no printed form.])
A 2kva HONDA petrol Genset is modi�ed for gaseous fuel to utilize the available hydrogen-rich mixture ofgaseous fuel from the process. Genset was functioning from the non-condensable gases of the pyrolysisprocess. As the mixture was hydrogen-rich the Genset creates lesser sound and shows smoothfunctioning as compared to gasoline fuel. The generator was subjected to full load (1 exhaust of 1kva, 1cooler of 0.2kva, 1 pump of 0.7kva) at a time.
Table 10, shows the duration of electricity produced using different biomass samples as input (2.5kgbiomass) to the reactor and using hydrogen-rich mixture gas as fuel to the generator.
Table 10: Running duration of Genset (in minutes) using produced H2 rich mixture of gases from differentbiomass samples.
Sample Name SH PP MS WS DH VT
Duration (minute) 30 27 28 26 26 16
5. Mathematical Analysis
Mathematical analysis is done to obtain correlations MODEL-1, between running time of Genset to nethydrogen (from raw to char composition) as well as the cumulative percentage of Hydrogen percent and

Page 14/21
Methane percent, and MODEL-2 between running time of Genset to net Hydrogen (from raw to charcomposition) as well as hydrogen percent, and Methane percent of product gas. The derived model isshown in Table 11.
Data from Table 2, Tables 4 to 9, and Table 10 are used to develop a correlation for estimating therunning duration of 2 kva Genset. The correlation was developed using the least square regressionanalysis in MINITAB 19.2020 software. Some assumptions like constant heating rate and were made toobtain the relation.
Table 11: Derived MODEL-1 and MODEL-2 based on different parameters (ΔH, CG, H2, and CH4).
SOURCE
MODEL-1 MODEL-2
P-VALUE
V.I.F. Regression Eq. P-VALUE
V.I.F. Regression Eq.
Regression 0.002 -
D = -6.25 + 0.996ΔH+ 0.3889CG
0.004 -
D = -9.20 + 0.090ΔH +0.6099H2 + 0.1893CH4
ΔH 0.186 1.32 0.851 2.62
CG 0.001 1.32 - -
H2 - - 0.015 7.72
CH4 - - 0.107 4.92
i.e.,
ΔH = Change in hydrogen wt.% during the pyrolysis process.
CG = Cumulative volumetric gas % of (H2 & CH4) obtained from Gas Chromatography.
H2 = Volumetric gas % of hydrogen reported in Gas Chromatography.
CH4 = Volumetric gas % of methane reported in Gas Chromatography.
5.1 Model Summary
From the regression analysis, I get R- square value = 0.985 for model-1 and R-square =0.997 for Model-2As the value of R-square is greater than 0.95 then it shows a good correlation between dependent andindependent variables (Gautam 2017).
5.2 Analysis of variance.
If the value of P indicates the effect of the independent variable on the dependent variable, the lower thep-value higher the impact on the dependent variable. from the below table10, we can see in model-1 thatthe P-value for both independent variables is very close to zero, which means both independent variables

Page 15/21
contribute signi�cantly in the regression eq.1 obtained from the model-1. But in the case of model-2, thevalue of ΔH having a lesser effect on model-2 as compare to H2 and CH4.
When we are looking for VIF (variance in�ation factor) it should be closer to 1. Higher the value indicatesthe multicollinearity, in the case of MODEL-1 it is 1.32 for both the variable which is very close to1(desirable) but in the case of MODEL-2, it is 2.62, 7.72, and 4.92 for different variables which are veryhigh (undesirable).
5.2 Residual plots for Duration
From the below Figure 4(a) it is seen that the data are very close to the �tted line, and the line representsthe equation of regression. From Figure 4(b), the histogram shows the data are normally distributedwhich means the regression equation holds for the value beyond the table. In the case of Figure 4(a¢) thedata shows relatively more deviation from �tted line, and from Figure 4(b¢) it is seen that the data is notdistributed normally.
4. ConclusionThe biomass like the stem of sun hemp, pigeon pea, mustard stem, wheat straw, vantulsi, and dhainchawas categorized as high hydrogen content crops and results in hydrogen-rich product gas during steppedpyrolysis. Whereas hydrogen and methane production was directly proportional to temperature; however,higher temperature ranges contributed more towards hydrogen and methane production. Typically, non-condensable Bio-gases contained 40%-55% hydrogen, 8%-25% methane along with 1%-12% carbon mono-oxide and carbon dioxide depending on different biomass samples. As the samples were pyrolyzed in astepped (temperature-wise) manner, the oxygen functionality evolved in the initial stages which reducesthe concentration of CO and CO2 in the product gas. Eventually, increase in the concentration of Hydrogenand Methane in the product gases. Gas chromatography of product gas, it was seen that sun hemphaving the highest (57.22%) hydrogen, and mustard stem having the highest (25.65%) methane amongall 6 biomass samples. High hydrogen and methane-containing fuel can be considered as a goodgaseous fuel. The potential utilization of pyrolytic gas as hydrogen-rich fuel in I.C. engine, among all thesamples Sun hemp product gas performed highest 12 minutes/kg in 2kva HONDA petrol Genset. Amathematical correlation between net hydrogen (wt. %), hydrogen gas (vol.%) and methane gas (vol. %) isdeveloped and found that the MODEL-1 (D = -6.25 + 0.996ΔH + 0.3889CG) is well-�tted over MODEL-2 (D= -9.20 + 0.090ΔH + 0.6099H2 + 0.1893CH4).
DeclarationsAcknowledgments
Author Brijesh Kumar Prajapati thank Dept. of FMME IIT (ISM) DHANBAD and Dept. Ceramic EngineeringIIT (BHU) for providing a research facility for carrying out this experimental work.

Page 16/21
This research did not receive any speci�c grant from funding agencies in the public, commercial, or not-for-pro�t sectors.
ReferencesAbuadala A, Dincer I (2012) A review on biomass-based hydrogen production and potential applications.Int J Energy Res 36:415–455. https://doi.org/10.1002/er.1939
Balat M, Kirtay E (2010) Major technical barriers to a “hydrogen economy.” Energy Sources, Part ARecover Util Environ Eff 32:863–876. https://doi.org/10.1080/15567030802606293
Buhre B, Andries J (2000) “Biomass-based, small-scale,distributed generation of electricity and heat usingintegrated gas turbine-fuel cell systems”
Chang AC-C, Louh RF, Wong D, et al Hydrogen production by aqueous-phase biomass reforming overcarbon textile supported Pt–Ru bimetallic catalysts. Int J Hydrogen Energy 36:8794–8799
Chang ACC, Chang HF, Lin FJ, et al (2011) Biomass gasi�cation for hydrogen production. In: InternationalJournal of Hydrogen Energy. pp 14252–14260
Chen G, Andries J, Luo Z, Spliethoff H (2003) Biomass pyrolysis/gasi�cation for product gas production:the overall investigation of parametric effects
David B, Federico B, Cristina C, et al (2019) Biohythane Production From Food Wastes. In: Biohydrogen.Elsevier, pp 347–368
Debdoubi A, El Amarti A, Colacio E, et al (2006) The effect of heating rate on yields and compositions ofoil products from esparto pyrolysis. Int J Energy Res 30:1243–1250. https://doi.org/10.1002/er.1215
Domínguez A, Menéndez JA, Fernández Y, et al (2007) Conventional and microwave induced pyrolysis ofcoffee hulls for the production of a hydrogen rich fuel gas. J Anal Appl Pyrolysis 79:128–135.https://doi.org/10.1016/j.jaap.2006.08.003
Dufour A, Girods P, Masson E, et al (2009) Synthesis gas production by biomass pyrolysis: Effect ofreactor temperature on product distribution. Int J Hydrogen Energy 34:1726–1734.https://doi.org/10.1016/j.ijhydene.2008.11.075
Edwards P., Kuznetsov V., David WI. (2007) Hydrogen energy. Philos Trans R Soc A Math Phys Eng Sci365:1043–1056. https://doi.org/10.1098/rsta.2006.1965
Enweremadu CC, Ojediran JO (2004) Evaluation of energy potential in husks from SOY-BEAN andCOWPEA. unde�ned

Page 17/21
Gautam S (2017) Effect of washing and stamping on coke making of a low-grade Indian coal: correlationbetween various properties. Ironmak Steelmak 44:505–512.https://doi.org/10.1080/03019233.2016.1217115
Hernandez-Mena LE, Pecora AAB, Beraldo AL (2014) Slow pyrolysis of bamboo biomass: Analysis ofbiochar properties. Chem Eng Trans 37:115–120. https://doi.org/10.3303/CET1437020
Hlavsová A, Corsaro A, Raclavská H, et al (2014) Syngas production from pyrolysis of nine compostsobtained from nonhybrid and hybrid perennial grasses. Sci World J 2014:.https://doi.org/10.1155/2014/723092
Ingersoll J (1996) Natural Gas Vehicles. Fairmont, Lilburn
Jiang H, Wu Y, Fan H, Ji J (2012) Hydrogen Production from Biomass Pyrolysis in Molten Alkali. AASRIProcedia 3:217–223. https://doi.org/10.1016/j.aasri.2012.11.036
Karagöz S (2009) Energy production from the pyrolysis of waste biomasses. Int J Energy Res 33:576–581. https://doi.org/10.1002/er.1493
Lang Y, Arnepalli RR, Tiwari A (2011) A review on hydrogen production: Methods, materials andnanotechnology. In: Journal of Nanoscience and Nanotechnology. J Nanosci Nanotechnol, pp 3719–3739
Leonel JR Nunes, Joao Carlos De Oliveira Matias JPDSC Torrefaction of Biomass for EnergyApplications: From Fundamentals to ... - Leonel JR Nunes, Joao Carlos De Oliveira Matias, Joao Paulo DaSilva Catalao - Google Books
Li S, Xu S, Liu S, et al (2004) Fast pyrolysis of biomass in free-fall reactor for hydrogen-rich gas. In: FuelProcessing Technology. pp 1201–1211
Liu P, Wang Y, Zhou Z, et al (2020) Effect of carbon structure on hydrogen release derived from differentbiomass pyrolysis. Fuel 271:. https://doi.org/10.1016/j.fuel.2020.117638
Liu Z, Si B, Li J, et al (2018) Bioprocess engineering for biohythane production from low-grade wastebiomass: technical challenges towards scale up. Curr. Opin. Biotechnol. 50:25–31
Loison R., Foch P. BA (1989) Coke Quality and Production. Butterworth & CO.
Luo G, Xie L, Zhou Q, Angelidaki I (2011) Enhancement of bioenergy production from organic wastes bytwo-stage anaerobic hydrogen and methane production process. Bioresour Technol 102:8700–8706.https://doi.org/10.1016/j.biortech.2011.02.012
Luque R, Campelo J, Clark J (2011) Handbook of biofuels production: Processes and technologies

Page 18/21
Moreno F, Muñoz M, Arroyo J, et al (2012) E�ciency and emissions in a vehicle spark ignition enginefueled with hydrogen and methane blends. Int J Hydrogen Energy 37:11495–11503.https://doi.org/10.1016/j.ijhydene.2012.04.012
Mu Y, Wang G, Yu H-Q (2006) Kinetic modeling of batch hydrogen production process by mixed anaerobiccultures. Bioresour Technol 97:1302–1307. https://doi.org/10.1016/j.biortech.2005.05.014
Muthu Dinesh Kumar R, Anand R (2019) Production of biofuel from biomass downdraft gasi�cation andits applications. In: Advanced Biofuels: Applications, Technologies and Environmental Sustainability.Elsevier, pp 129–151
Nanthagopal K, Subbarao R, Elango T, et al (2011) Hydrogen enriched compressed natural gas (HCNG)-afuturistic fuel for internal combustion engines. Therm Sci 15:1145–1154
Neves D, Thunman H, Matos A, et al (2011) Characterization and prediction of biomass pyrolysisproducts. Prog. Energy Combust. Sci. 37:611–630
Nunes LJR, De Oliveira Matias JC, Da Silva Catalão JP (2018) Introduction. In: Torrefaction of Biomassfor Energy Applications. Elsevier, pp 1–43
Pawar SS, Nkemka VN, Zeidan AA, et al (2013) Biohydrogen production from wheat straw hydrolysateusing Caldicellulosiruptor saccharolyticus followed by biogas production in a two-step uncoupledprocess. Int J Hydrogen Energy 38:9121–9130. https://doi.org/10.1016/j.ijhydene.2013.05.075
Raveendran K, Ganesh A, Khilar KC (1996) Pyrolysis characteristics of biomass and biomasscomponents. Fuel 75:987–998. https://doi.org/10.1016/0016-2361(96)00030-0
Reşito lu IA, Altinişik K, Keskin A (2015) The pollutant emissions from diesel-engine vehicles and exhaustaftertreatment systems. Clean Technol. Environ. Policy 17:15–27
Ronsse F, van Hecke S, Dickinson D, Prins W (2013) Production and characterization of slow pyrolysisbiochar: in�uence of feedstock type and pyrolysis conditions. GCB Bioenergy 5:104–115.https://doi.org/10.1111/gcbb.12018
Seyedeyn-Azad F, Salehi E, Abedi J, Harding T (2011) Biomass to hydrogen via catalytic steam reformingof bio-oil over Ni-supported alumina catalysts. Fuel Process Technol 92:563–569.https://doi.org/10.1016/j.fuproc.2010.11.012
Sheng C, Azevedo JLT (2005) Estimating the higher heating value of biomass fuels from basic analysisdata. Biomass and Bioenergy 28:499–507. https://doi.org/10.1016/j.biombioe.2004.11.008
Suman S, Gautam S (2017) Pyrolysis of coconut husk biomass: Analysis of its biochar properties. EnergySources, Part A Recover Util Environ Eff 39:761–767. https://doi.org/10.1080/15567036.2016.1263252

Page 19/21
Suman S, Panwar DS, Gautam S (2017) Surface morphology properties of biochars obtained fromdifferent biomass waste. Energy Sources, Part A Recover Util Environ Eff 39:1007–1012.https://doi.org/10.1080/15567036.2017.1283553
Wengjie Wang SD A potential renewable energy resource development and utilization of biomass energy
Xu Q, Lan P, Zhang B, et al (2010) Hydrogen production via catalytic steam reforming of fast pyrolysisbio-oil in a �uidized-bed reactor. Energy and Fuels 24:6456–6462. https://doi.org/10.1021/ef1010995
Zhao Z, Huang H, Wu C, et al (2001) Biomass Pyrolysis in an Argon/Hydrogen Plasma Reactor. Eng LifeSci 1:197. https://doi.org/10.1002/1618-2863(200111)1:5<197::aid-elsc197>3.0.co;2-8
Ultimate analysis, Coal Analysis, Kentucky Geological Survey, University of Kentucky.https://www.uky.edu/KGS/coal/coal-analyses-ultimate.php. Accessed 20 Dec 2020a
Hydrogen Properties | Hydrogen Tools. https://h2tools.org/hyarc/hydrogen-properties. Accessed 15 Oct2020b
Figures
Figure 1
Flow chart of the pyrolysis process.

Page 20/21
Figure 2
TGA of MS, SH, WS, DH, PP, and VT Samples
Figure 3
Flame of hydrogen and methane-rich produced gas from the stepped pyrolysis of biomass.

Page 21/21
Figure 4
This �gure consists of the normal probability plot and histogram for MODEL-1, denoted by (4a, 4b) andfor MODEL-2 denoted by (4a', 4b')