modelling product composition in slow pyrolysis...
TRANSCRIPT
MODELLING PRODUCT COMPOSITION IN SLOW PYROLYSIS OF WOOD
Avdhesh K. Sharma, M.R. Ravi and S. KohliMechanical Engineering Department, Indian Institute of Technology, Delhi110016
Email: [email protected]
Abstract
Pyrolysis product composition has been modeled at low heating rates (< 100oC/min) for woody biomass materials to predict char yield, simplified composition of volatile species and heat of pyrolysis. The thermal decomposition of biomass has been described on the basis of decomposition of its three main constituents, viz., cellulose, hemicellulose and lignin. Complete elemental balance along with data from the literature on CO/CO2, H2O/CO2 and Lighthydrocabon/CO2 ratios have been used for determining the product composition as a function of temperature. Model predictions are validated against data from published literature. Model has been used to illustrate the effect of temperature on the product composition for pyrolysis of different biomass materials. Model predictions show that the pyrolysis process changes from endothermic to exothermic with increase in temperature, with the reversal in heat of pyrolysis occurring when the tar yield falls to zero.
Keywords: Pyrolysis, Biomass, Volatile Composition, Cellulose, Hemicellulose, Lignin.
Nomenclature
n number of moles Y mass fraction 0fh enthalpy of formation at ref. state(kJ/kg) hhv high heating value(kJ/kg)
ME methane equivalent (light hydrocarbons) ƒchar fraction of char Δho heat of reaction at reference temp
Subscriptvol volatiles DB dry biomasscl cellulose hc hemicelluloselg lignin pyr pyrolysis
Introduction
Pyrolysis is a thermochemical process preceding the gasification or combustion of solid fuels. When lignocellulosic material is exposed to hot environment, it undergoes thermal decomposition and gets converted into volatile gases, char and ash residues. These products of pyrolysis have wide industrial and domestic applications. The volatile gases can be cracked and partially combusted in reduced air supply to make producer gas, which in turn
can be used for power generation or process heating. The volatiles can also be used to produce methanol. The tarry liquid (pyrolysis oil or biooil) can be upgraded to highgrade hydrocarbon liquid fuels for IC engine applications. The char can be used as reducing agent in metallurgical industry or as domestic cooking fuel [1]. The products of pyrolysis are far too many. Roberts and Clough [2] put this number at over 100 while according to Emmons and Atreya [3] the number of species in volatiles released from pyrolysis exceeds 200.
In order to model gasification and flaming combustion of volatiles in wood combustion, it is necessary to express the complex mixture of the volatile matter evolving from wood pyrolysis and subsequently by the cracking of these volatiles, in terms of a few simple gaseous constituents. These gaseous constituents should on one hand satisfy the atomic balance of the various elements present in the parent material, and on the other, they should also accurately reflect the energetics of pyrolysis and subsequent combustion. In literature, certain researchers have chosen to study the volatile constituents in terms of CO, CO2, H2, H2O, tar and light hydrocarbons. Boroson et al. [4] and Thunman et al. [5] are the most notable amongst these. Boroson et al [4] carried out experiments to determine the products of primary and secondary wood pyrolysis for three different temperatures. Their main objective was to use the experimental data to develop a kinetic model to predict rates of evolution of various species as a function of temperature.
Thunman et al. [5] used a set of equations including the enthalpy balance for various species to solve for the mass fractions of different species in the pyrolysis products. To close the system of equations, they had to use the experimental data for the ratio of CO/CO2 and total hydrocarbons (THC)/CO2. While they did carry out their own experiments as well, they chose to curvefit the data of Di Blasi et al. [6]. Unfortunately the fitted curves differed from the experimental data of Thunman et al. [5] by an order of magnitude but no explanation was provided for this difference. Hence the curvefitted equations could not be used in the present work. The model developed by Thunman et al [5] could also not be used since the paper stated that their system of equations is stiff and can result in unrealistic solutions. They did not present any solution for these equations but instead, presented a sensitivity analysis of the predictions with respect to different parameters.
Fortunately, the plots of experimental data in Boroson et al. [4] and Thunman et al. [5] of the CO/CO2, H2/CO2 and THC/CO2 ratios are in reasonable agreement with each other. In the present work, the data from former are used by fitting curves since the data were available in the form of tables while in latter, the results are presented in the form of charts, from which the data points are difficult to read accurately.
While this paper focuses on modeling of volatile composition, there are a large number of other papers on modeling of pyrolysis which focus mainly on the rate of evolution of volatiles during pyrolysis following several mechanisms: global single step, twostep sequential and parallel competing reactions [1,713]. Di Blasi [13] presents a comparative

evaluation of various mechanisms that exist for kinetics of pyrolysis. Di Blasi [14] uses such a mechanism to obtain composition of volatile matter obtained by twostage pyrolysis (Biomass volatiles gases). An examination of atomic balance in this work shows that→ → the final products of pyrolysis do not have the same atomic composition as the original reactant wood, owing to inconsistency between the empirical formulae for tar and wood, and the percentage composition of gaseous yield in each stage of pyrolysis, which were taken from different sources.
To the knowledge of the authors, no single work presented in the literature combines the consistency of atomic balance, use of reliable empirical data to account for temperature dependence of gas composition at the end of the pyrolysis and the energetics of the pyrolysis reactions (values of the heat of pyrolysis). The present work, thus, is an effort in combining the relevant models and data available in literature to formulate a consistent and simple model for representing the product compositions of pyrolysis in terms of a few species, for use in biomass gasification and combustion models. This model also has the advantage of being compatible with any global kinetic expression that gives the rate of mass loss of wood: since the predictions of the present model are for unit quantity of wood pyrolysed. The gas composition predicted by the present model has been found to be in reasonable agreement with the literature. The values of heat of pyrolysis predicted by the present model are also in the same range as those found in the literature.
Modelling Composition of Volatiles
The present work aims at developing a model to predict a simplified composition of pyrolysis products as a function of temperature for use in gasification and wood combustion models, where the pyrolysis process is slow. For modeling of thermal degradation of biomass, the present approach considers the fuel to be composed of three main chemical constituents cellulose, hemicellulose and lignin. On dry ashfree basis, the mass fractions of these constituents are related as
Y Y Y hccl 1lg =++ (1)
On heating, these constituents become unstable leading to their thermal decomposition, which is considered to take place in two stages viz., primary and secondary stages. During the primary decomposition, each constituent of biomass decomposes into char and volatiles, while in the secondary decomposition, the volatiles breakup into various lighter hydrocarbons. The overall pyrolysis products (volatiles and solid residues) are the combination of the products from pyrolysis of each of the three major constituents, viz., cellulose, hemicellulose and lignin.
The relative quantities of char and volatiles are strongly dependent on the heating rate and the temperature range of the pyrolysis zone [7]. At temperature above 700°C and very rapid
heating rate of the order of 1000°C/min or above, there is little char formation. On the other hand, slow heating rate enhances char formation. However, as reported by Zaror and Pyle [7], at heating rates below 100oC/min, the char yield from biomass pyrolysis is relatively insensitive to heating rate and temperature. Thus, in the present work, which is essentially for slow pyrolysis processes, the char residue has been assumed to be invariant with temperature and heating rates. If the fraction of char that can be obtained from cellulose, hemicellulose and lignin are ƒchar,cl ƒchar,hc and ƒchar,lg respectively, the total char yield from the thermal decomposition of unit mass of dry ashfree biomass can be expressed as
fY fYfYY charhccharhcclcharclchar lg,lg,, ++= (2)
The fraction of volatiles from dry and ashfree biomass can then be obtained as
charvol YY −= 1 (3)
Volatiles released during primary decomposition of wood are unstable, and they break up into a large number of gaseous species and tar. As already mentioned, for computation of combustion or gasification process, it is desirable to identify the equivalent composition of volatiles in terms of a handful of species. Following Thunman et al. [5], the present work considers the volatiles to be composed of 6 species viz., CO, CO2, H2, H2O, light hydrocarbons (ME), and heavy hydrocarbons (tar). Ragland et al. [15] also suggested that light hydrocarbons are primarily methane. In the present work, light hydrocarbons have been modeled as methane and ethylene in the mass ratio 3:1 giving rise to an equivalent empirical formula of C1.16H4. Hydrocarbons other than light hydrocarbons are considered under a single category called heavy hydrocarbons or tar. Lewellen et al. [16] considered tar as levoglucosan (C6H10O5) which vaporizes and decomposes with increase in temperature. Ragland et al. [15] and Thunman et al. [5] suggest the chemical formula of tar as C6H6.2O0.2, which is used in the present work.
For elemental balance, the composition of char is also important. Shafizadeh [17] reported that the hydrogen and oxygen content in the char decrease sharply as temperature increases. Ragland et al [15] quoted that char contains little hydrogen at temperature above 700°C. In the present work, char is assumed to be pure carbon.
Thus, the process of pyrolytic decomposition can be represented as
C6HHBOOB = nchar, ashfree C + nCOCO + nCO2 CO2 + nH2 H2 + nH2O H2O + nME C1.16H4 + nTAR C6H6.2O0.2 (4)
Here, C6HHBOOB is the chemical formula of the dry and ashfree biomass and n represents the number of moles of a given species involved in the process. The chemical formula of any
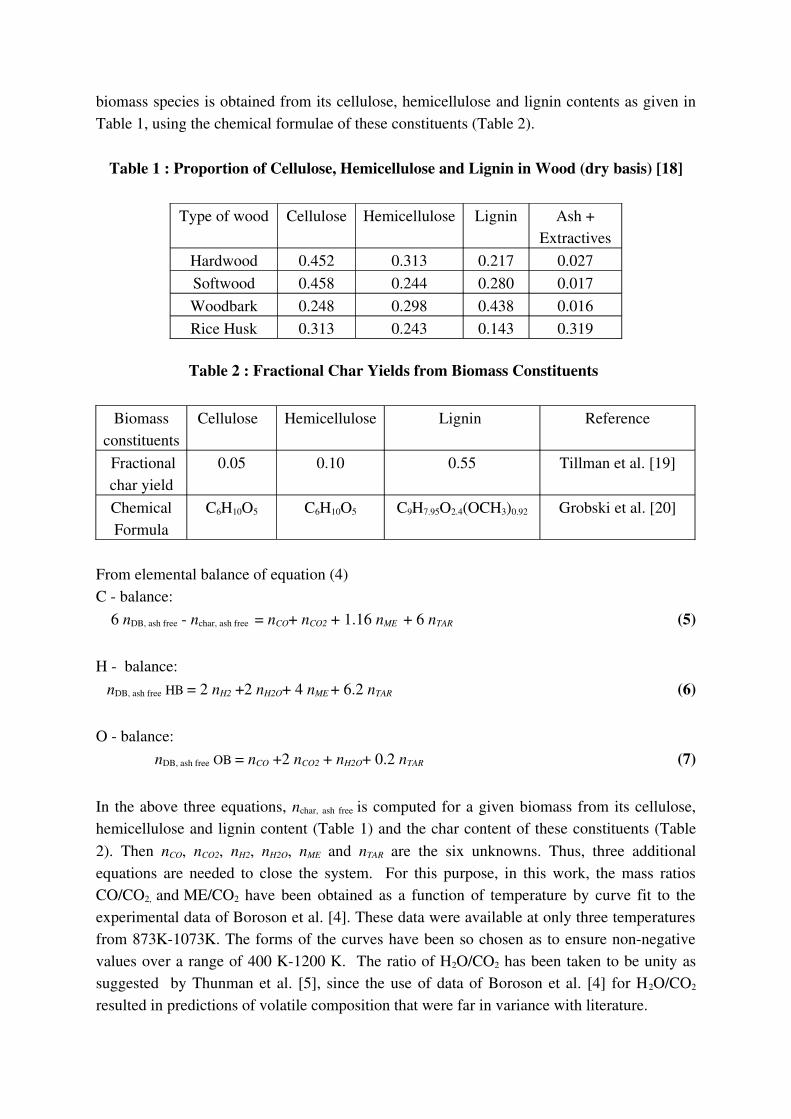
biomass species is obtained from its cellulose, hemicellulose and lignin contents as given in Table 1, using the chemical formulae of these constituents (Table 2).
Table 1 : Proportion of Cellulose, Hemicellulose and Lignin in Wood (dry basis) [18]
Type of wood Cellulose Hemicellulose Lignin Ash + Extractives
Hardwood 0.452 0.313 0.217 0.027Softwood 0.458 0.244 0.280 0.017Woodbark 0.248 0.298 0.438 0.016Rice Husk 0.313 0.243 0.143 0.319
Table 2 : Fractional Char Yields from Biomass Constituents
Biomass constituents
Cellulose Hemicellulose Lignin Reference
Fractional char yield
0.05 0.10 0.55 Tillman et al. [19]
Chemical Formula
C6H10O5 C6H10O5 C9H7.95O2.4(OCH3)0.92 Grobski et al. [20]
From elemental balance of equation (4) C balance: 6 nDB, ash free nchar, ash free = nCO+ nCO2 + 1.16 nME + 6 nTAR (5)
H balance: nDB, ash free HB = 2 nH2 +2 nH2O+ 4 nME + 6.2 nTAR (6)
O balance: nDB, ash free OB = nCO +2 nCO2 + nH2O+ 0.2 nTAR (7)
In the above three equations, nchar, ash free is computed for a given biomass from its cellulose, hemicellulose and lignin content (Table 1) and the char content of these constituents (Table 2). Then nCO, nCO2, nH2, nH2O, nME and nTAR are the six unknowns. Thus, three additional equations are needed to close the system. For this purpose, in this work, the mass ratios CO/CO2, and ME/CO2 have been obtained as a function of temperature by curve fit to the experimental data of Boroson et al. [4]. These data were available at only three temperatures from 873K1073K. The forms of the curves have been so chosen as to ensure nonnegative values over a range of 400 K1200 K. The ratio of H2O/CO2 has been taken to be unity as suggested by Thunman et al. [5], since the use of data of Boroson et al. [4] for H2O/CO2
resulted in predictions of volatile composition that were far in variance with literature.
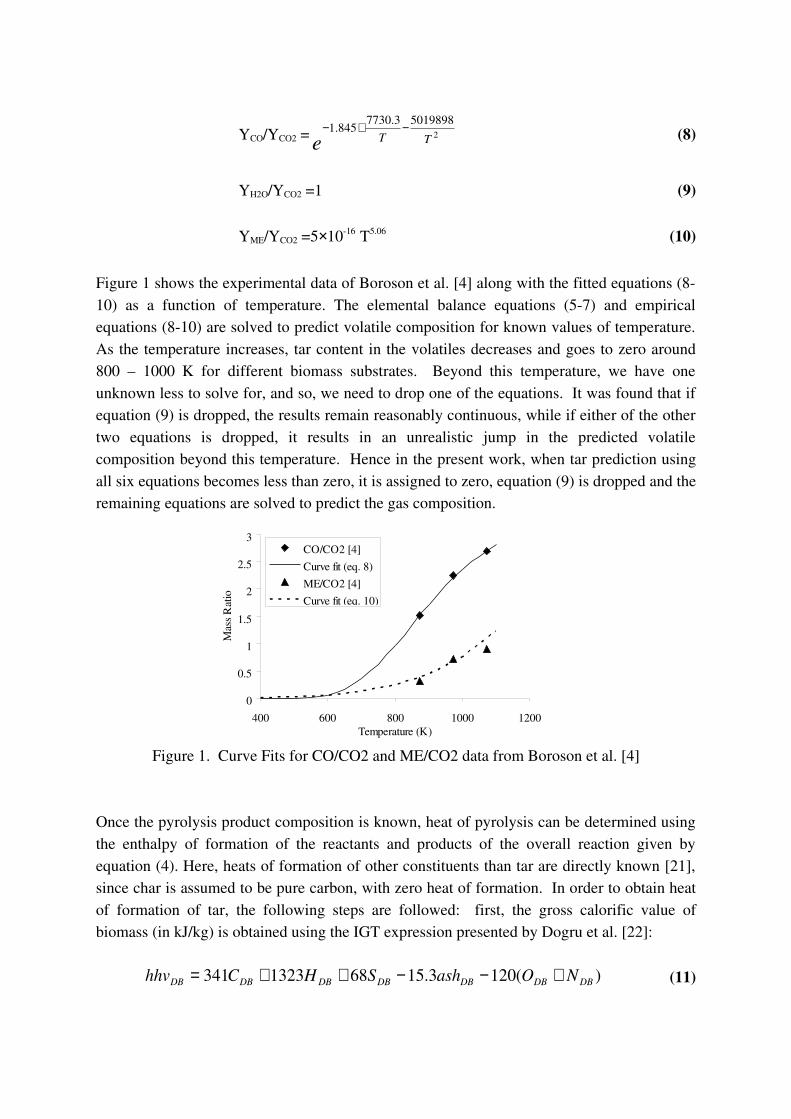
YCO/YCO2 = 250198983.7730845.1
TTe−+− (8)
YH2O/YCO2 =1 (9)
YME/YCO2 =5×10¹⁶ T5.06 (10)
Figure 1 shows the experimental data of Boroson et al. [4] along with the fitted equations (810) as a function of temperature. The elemental balance equations (57) and empirical equations (810) are solved to predict volatile composition for known values of temperature. As the temperature increases, tar content in the volatiles decreases and goes to zero around 800 – 1000 K for different biomass substrates. Beyond this temperature, we have one unknown less to solve for, and so, we need to drop one of the equations. It was found that if equation (9) is dropped, the results remain reasonably continuous, while if either of the other two equations is dropped, it results in an unrealistic jump in the predicted volatile composition beyond this temperature. Hence in the present work, when tar prediction using all six equations becomes less than zero, it is assigned to zero, equation (9) is dropped and the remaining equations are solved to predict the gas composition.
0
0.5
1
1.5
2
2.5
3
400 600 800 1000 1200Temperature (K)
Mas
s Rati
o
CO/CO2 [4]Curve fit (eq. 8)ME/CO2 [4]Curve fit (eq. 10)
Figure 1. Curve Fits for CO/CO2 and ME/CO2 data from Boroson et al. [4]
Once the pyrolysis product composition is known, heat of pyrolysis can be determined using the enthalpy of formation of the reactants and products of the overall reaction given by equation (4). Here, heats of formation of other constituents than tar are directly known [21], since char is assumed to be pure carbon, with zero heat of formation. In order to obtain heat of formation of tar, the following steps are followed: first, the gross calorific value of biomass (in kJ/kg) is obtained using the IGT expression presented by Dogru et al. [22]:
)(1203.15681323341 DBDBDBDBDBDBDB NOashSHChhv +−−++= (11)
where CDB, HDB, SDB, ashDB, ODB and NDB are the massbased percentage compositions of C, H, S, ash, O and N in dry biomass respectively. It has been reported by Ragland et al. [15] that the higher heating values of different wood species on a moisturefree basis vary by less than 15%, and hence, the above expression is expected to reflect the energetics of biomass combustion fairly well. Since this heat of combustion can be partitioned among the char, gases and tar produced by pyrolysis, and since the heat of combustion of the char and gas constituents are well documented in combustion texts [21], the heat of combustion of tar can be computed. Knowing the atomic composition of tar (C6H6.2O0.2) and the stoichiometric equation for its complete oxidation, the heat of formation of tar can be computed. Ragland et al. [15] computed the heating values of methane equivalent and tar using the above methodology for a typical wood composition and reported the heating values of both to be 41 MJ/kg. Then, the heat of pyrolysis can be computed using the expression
( ) ( ) ( )i
of
i
iivolchar
ofcharDB
of
opyr hYYhYhh ∑
=
=
++−=∆6
1 (12)
Here i =1 to 6 correspond respectively to CO, CO2, H2,, H2O, ME and Tar. It must be noted here that this method is likely to produce heats of combustion and heating values over a range around this value, although in the model their chemical composition is assumed fixed.
Results and Discussion
The above model predicts species concentrations in volatile matter and char yield at known values of temperature for a given biomass. The model needs the percentages of cellulose, hemicellulose and lignin in biomass as input. It uses the fraction of char obtained due to the breakup of each of these three constituents from Table 2, while the species concentrations in volatile matter are determined as described above.
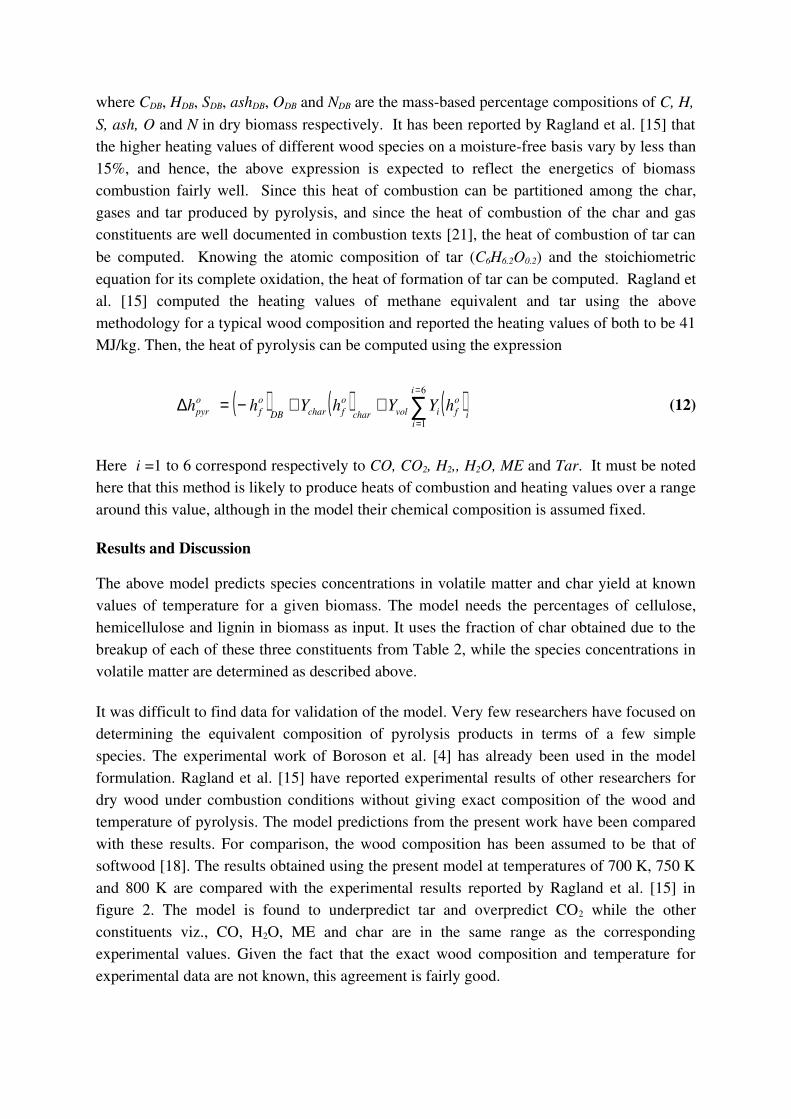
It was difficult to find data for validation of the model. Very few researchers have focused on determining the equivalent composition of pyrolysis products in terms of a few simple species. The experimental work of Boroson et al. [4] has already been used in the model formulation. Ragland et al. [15] have reported experimental results of other researchers for dry wood under combustion conditions without giving exact composition of the wood and temperature of pyrolysis. The model predictions from the present work have been compared with these results. For comparison, the wood composition has been assumed to be that of softwood [18]. The results obtained using the present model at temperatures of 700 K, 750 K and 800 K are compared with the experimental results reported by Ragland et al. [15] in figure 2. The model is found to underpredict tar and overpredict CO2 while the other constituents viz., CO, H2O, ME and char are in the same range as the corresponding experimental values. Given the fact that the exact wood composition and temperature for experimental data are not known, this agreement is fairly good.
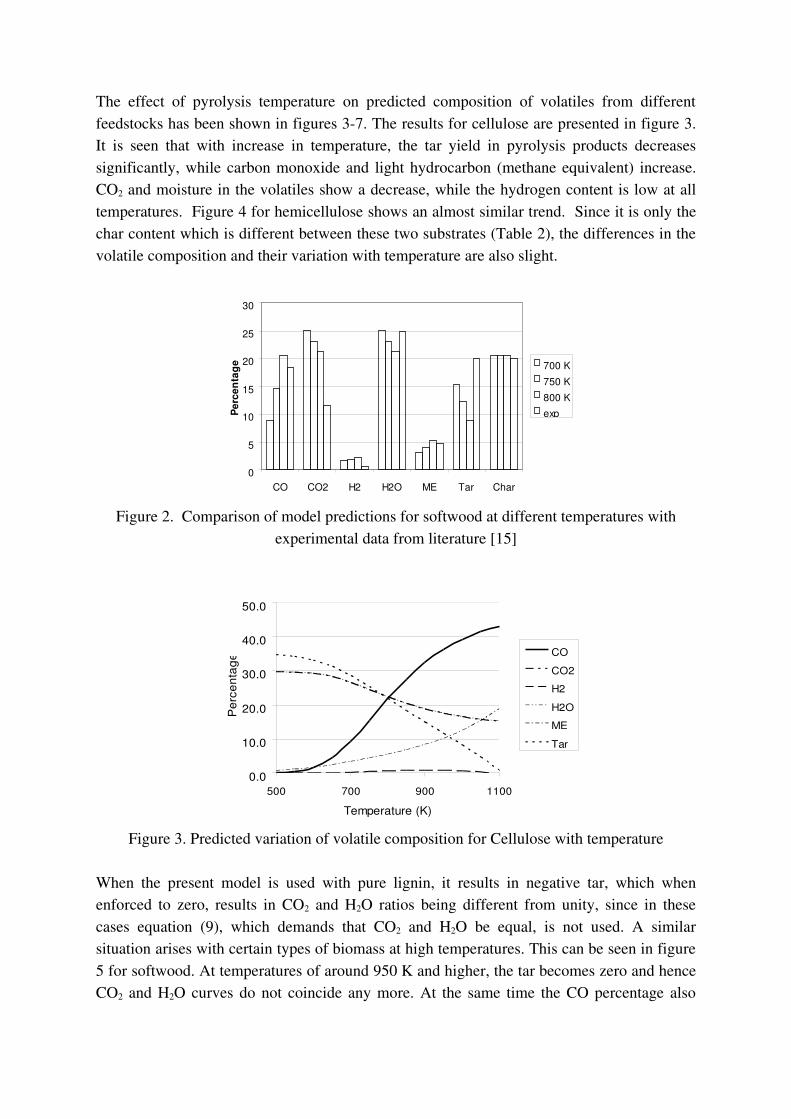
The effect of pyrolysis temperature on predicted composition of volatiles from different feedstocks has been shown in figures 37. The results for cellulose are presented in figure 3. It is seen that with increase in temperature, the tar yield in pyrolysis products decreases significantly, while carbon monoxide and light hydrocarbon (methane equivalent) increase. CO2 and moisture in the volatiles show a decrease, while the hydrogen content is low at all temperatures. Figure 4 for hemicellulose shows an almost similar trend. Since it is only the char content which is different between these two substrates (Table 2), the differences in the volatile composition and their variation with temperature are also slight.
0
5
10
15
20
25
30
CO CO2 H2 H2O ME Tar Char
Perc
enta
ge 700 K750 K800 Kexp
Figure 2. Comparison of model predictions for softwood at different temperatures with experimental data from literature [15]
0.0
10.0
20.0
30.0
40.0
50.0
500 700 900 1100
Temperature (K)
Perc
enta
ge
COCO2H2H2OMETar
Figure 3. Predicted variation of volatile composition for Cellulose with temperature
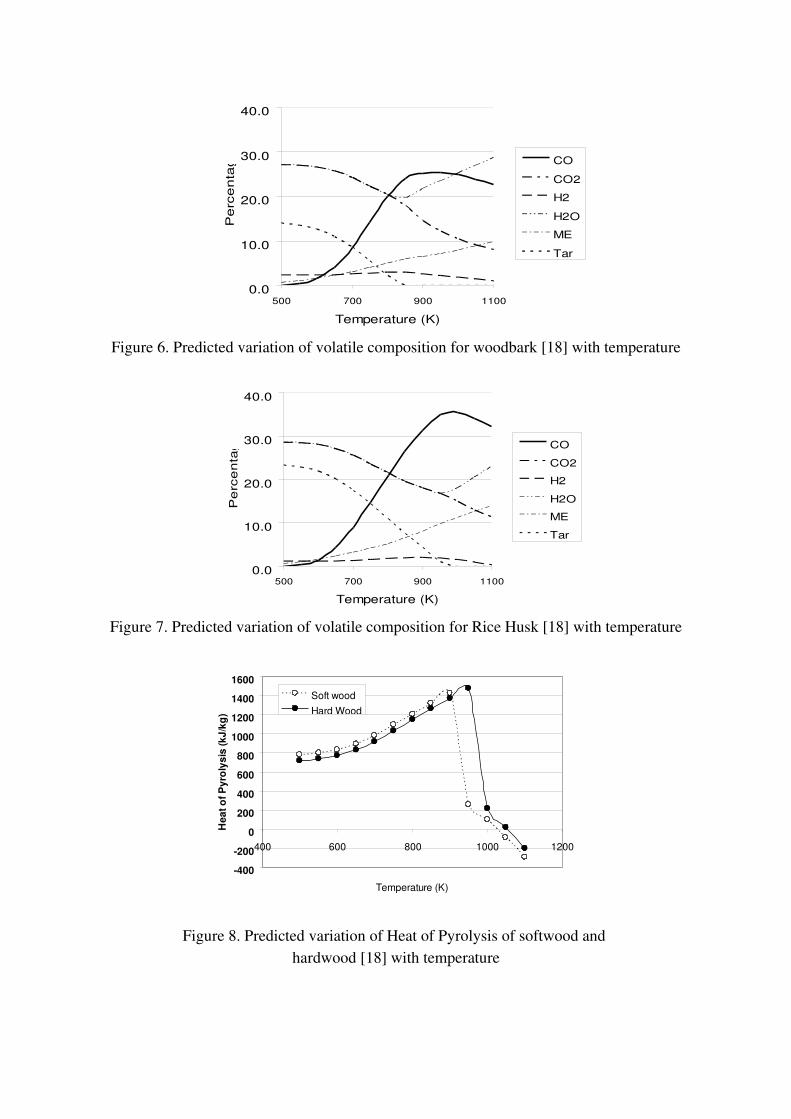
When the present model is used with pure lignin, it results in negative tar, which when enforced to zero, results in CO2 and H2O ratios being different from unity, since in these cases equation (9), which demands that CO2 and H2O be equal, is not used. A similar situation arises with certain types of biomass at high temperatures. This can be seen in figure 5 for softwood. At temperatures of around 950 K and higher, the tar becomes zero and hence CO2 and H2O curves do not coincide any more. At the same time the CO percentage also
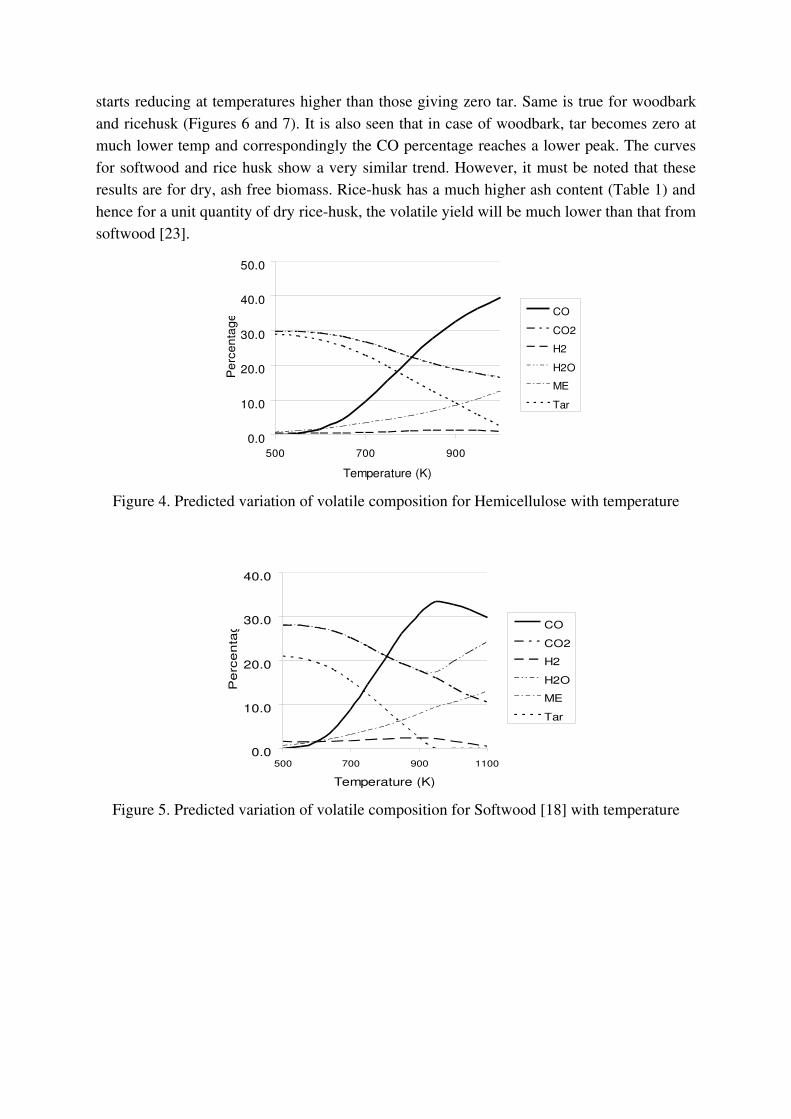
starts reducing at temperatures higher than those giving zero tar. Same is true for woodbark and ricehusk (Figures 6 and 7). It is also seen that in case of woodbark, tar becomes zero at much lower temp and correspondingly the CO percentage reaches a lower peak. The curves for softwood and rice husk show a very similar trend. However, it must be noted that these results are for dry, ash free biomass. Ricehusk has a much higher ash content (Table 1) and hence for a unit quantity of dry ricehusk, the volatile yield will be much lower than that from softwood [23].
0.0
10.0
20.0
30.0
40.0
50.0
500 700 900
Temperature (K)
Perc
enta
ge
COCO2H2H2OMETar
Figure 4. Predicted variation of volatile composition for Hemicellulose with temperature
0.0
10.0
20.0
30.0
40.0
500 700 900 1100
Temperature (K)
Per
cent
age CO
CO2H2H2OMETar
Figure 5. Predicted variation of volatile composition for Softwood [18] with temperature
0.0
10.0
20.0
30.0
40.0
500 700 900 1100
Temperature (K)
Per
cent
age CO
CO2H2H2OMETar
Figure 6. Predicted variation of volatile composition for woodbark [18] with temperature
0.0
10.0
20.0
30.0
40.0
500 700 900 1100
Temperature (K)
Per
cent
age CO
CO2H2H2OMETar
Figure 7. Predicted variation of volatile composition for Rice Husk [18] with temperature
400200
0200400
600800
1000
120014001600
400 600 800 1000 1200
Temperature (K)
Hea
t of P
yrol
ysis
(kJ/
kg)
Soft woodHard Wood
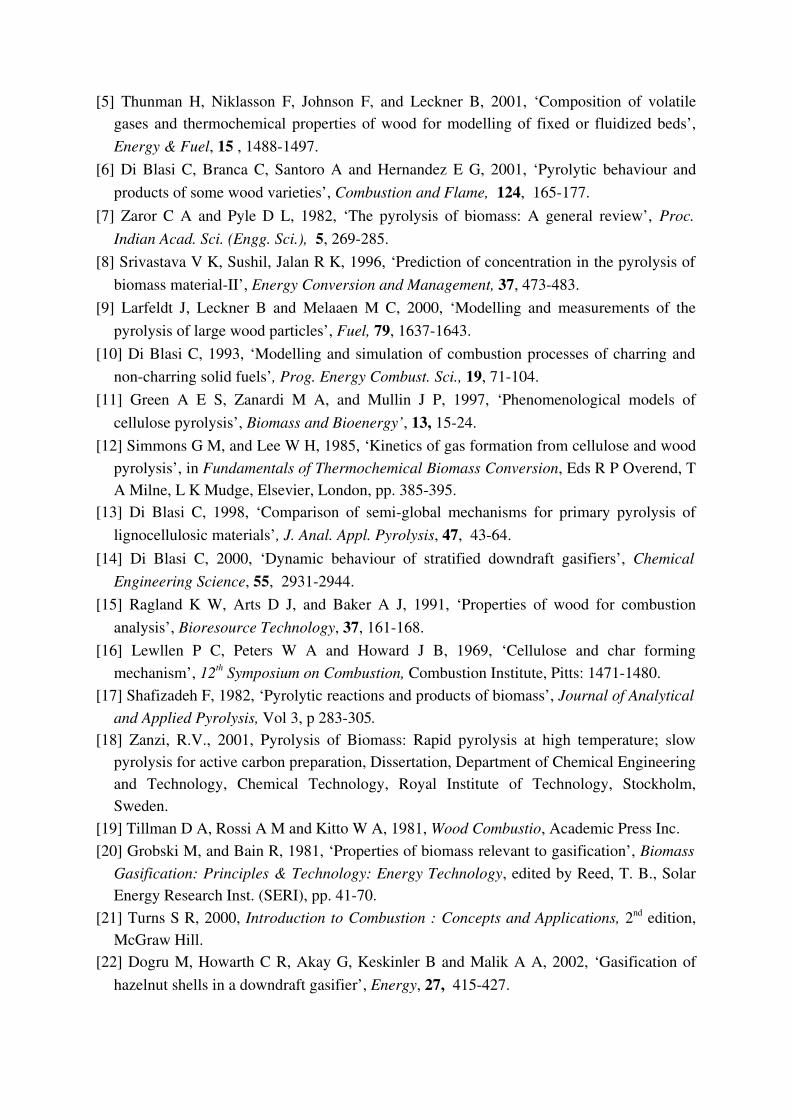
Figure 8. Predicted variation of Heat of Pyrolysis of softwood and hardwood [18] with temperature
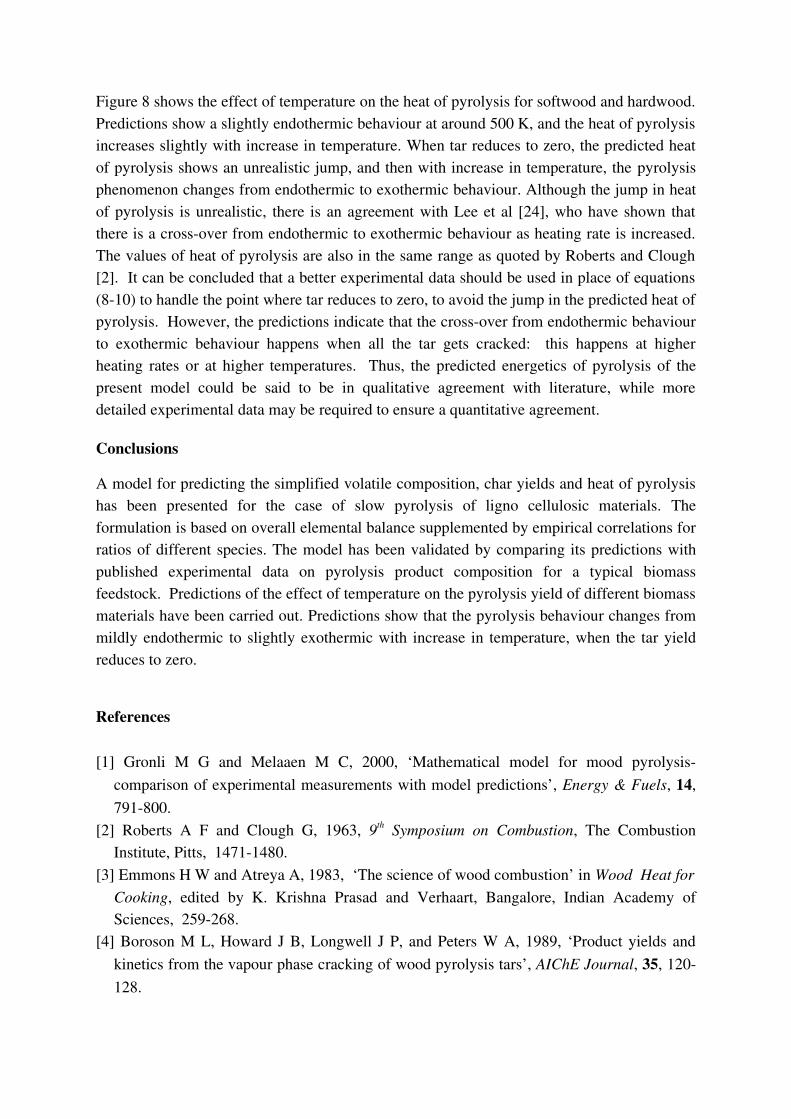
Figure 8 shows the effect of temperature on the heat of pyrolysis for softwood and hardwood. Predictions show a slightly endothermic behaviour at around 500 K, and the heat of pyrolysis increases slightly with increase in temperature. When tar reduces to zero, the predicted heat of pyrolysis shows an unrealistic jump, and then with increase in temperature, the pyrolysis phenomenon changes from endothermic to exothermic behaviour. Although the jump in heat of pyrolysis is unrealistic, there is an agreement with Lee et al [24], who have shown that there is a crossover from endothermic to exothermic behaviour as heating rate is increased. The values of heat of pyrolysis are also in the same range as quoted by Roberts and Clough [2]. It can be concluded that a better experimental data should be used in place of equations (810) to handle the point where tar reduces to zero, to avoid the jump in the predicted heat of pyrolysis. However, the predictions indicate that the crossover from endothermic behaviour to exothermic behaviour happens when all the tar gets cracked: this happens at higher heating rates or at higher temperatures. Thus, the predicted energetics of pyrolysis of the present model could be said to be in qualitative agreement with literature, while more detailed experimental data may be required to ensure a quantitative agreement.
Conclusions
A model for predicting the simplified volatile composition, char yields and heat of pyrolysis has been presented for the case of slow pyrolysis of ligno cellulosic materials. The formulation is based on overall elemental balance supplemented by empirical correlations for ratios of different species. The model has been validated by comparing its predictions with published experimental data on pyrolysis product composition for a typical biomass feedstock. Predictions of the effect of temperature on the pyrolysis yield of different biomass materials have been carried out. Predictions show that the pyrolysis behaviour changes from mildly endothermic to slightly exothermic with increase in temperature, when the tar yield reduces to zero.
References
[1] Gronli M G and Melaaen M C, 2000, ‘Mathematical model for mood pyrolysis comparison of experimental measurements with model predictions’, Energy & Fuels, 14, 791800.
[2] Roberts A F and Clough G, 1963, 9th Symposium on Combustion, The Combustion Institute, Pitts, 14711480.
[3] Emmons H W and Atreya A, 1983, ‘The science of wood combustion’ in Wood Heat for Cooking, edited by K. Krishna Prasad and Verhaart, Bangalore, Indian Academy of Sciences, 259268.
[4] Boroson M L, Howard J B, Longwell J P, and Peters W A, 1989, ‘Product yields and kinetics from the vapour phase cracking of wood pyrolysis tars’, AIChE Journal, 35, 120128.
[5] Thunman H, Niklasson F, Johnson F, and Leckner B, 2001, ‘Composition of volatile gases and thermochemical properties of wood for modelling of fixed or fluidized beds’, Energy & Fuel, 15 , 14881497.
[6] Di Blasi C, Branca C, Santoro A and Hernandez E G, 2001, ‘Pyrolytic behaviour and products of some wood varieties’, Combustion and Flame, 124, 165177.
[7] Zaror C A and Pyle D L, 1982, ‘The pyrolysis of biomass: A general review’, Proc. Indian Acad. Sci. (Engg. Sci.), 5, 269285.
[8] Srivastava V K, Sushil, Jalan R K, 1996, ‘Prediction of concentration in the pyrolysis of biomass materialII’, Energy Conversion and Management, 37, 473483.
[9] Larfeldt J, Leckner B and Melaaen M C, 2000, ‘Modelling and measurements of the pyrolysis of large wood particles’, Fuel, 79, 16371643.
[10] Di Blasi C, 1993, ‘Modelling and simulation of combustion processes of charring and noncharring solid fuels’, Prog. Energy Combust. Sci., 19, 71104.
[11] Green A E S, Zanardi M A, and Mullin J P, 1997, ‘Phenomenological models of cellulose pyrolysis’, Biomass and Bioenergy’, 13, 1524.
[12] Simmons G M, and Lee W H, 1985, ‘Kinetics of gas formation from cellulose and wood pyrolysis’, in Fundamentals of Thermochemical Biomass Conversion, Eds R P Overend, T A Milne, L K Mudge, Elsevier, London, pp. 385395.
[13] Di Blasi C, 1998, ‘Comparison of semiglobal mechanisms for primary pyrolysis of lignocellulosic materials’, J. Anal. Appl. Pyrolysis, 47, 4364.
[14] Di Blasi C, 2000, ‘Dynamic behaviour of stratified downdraft gasifiers’, Chemical Engineering Science, 55, 29312944.
[15] Ragland K W, Arts D J, and Baker A J, 1991, ‘Properties of wood for combustion analysis’, Bioresource Technology, 37, 161168.
[16] Lewllen P C, Peters W A and Howard J B, 1969, ‘Cellulose and char forming mechanism’, 12th Symposium on Combustion, Combustion Institute, Pitts: 14711480.
[17] Shafizadeh F, 1982, ‘Pyrolytic reactions and products of biomass’, Journal of Analytical and Applied Pyrolysis, Vol 3, p 283305.
[18] Zanzi, R.V., 2001, Pyrolysis of Biomass: Rapid pyrolysis at high temperature; slow pyrolysis for active carbon preparation, Dissertation, Department of Chemical Engineering and Technology, Chemical Technology, Royal Institute of Technology, Stockholm, Sweden.
[19] Tillman D A, Rossi A M and Kitto W A, 1981, Wood Combustio, Academic Press Inc. [20] Grobski M, and Bain R, 1981, ‘Properties of biomass relevant to gasification’, Biomass
Gasification: Principles & Technology: Energy Technology, edited by Reed, T. B., Solar Energy Research Inst. (SERI), pp. 4170.
[21] Turns S R, 2000, Introduction to Combustion : Concepts and Applications, 2nd edition, McGraw Hill.
[22] Dogru M, Howarth C R, Akay G, Keskinler B and Malik A A, 2002, ‘Gasification of hazelnut shells in a downdraft gasifier’, Energy, 27, 415427.
[23] Iyer P V R, Rao T R and Grover P D, 2002, Biomass: ThermoChemical Characterisation, MNES sponsored GARP, IIT Delhi.
[24] Lee C K, Chaiken R F , Singer J M, 1976, ‘Charring pyrolysis of wood in fires by laser simulation’, In Proceedings of the Sixteenth Symposium (International) on Combustion. Pittsburg: The Combustion Institute, pp 14591470.