investigation of carbonisation of wheat stems from central europe during slow pyrolysis at different...
TRANSCRIPT
International Journal of Environmental & Agriculture Research (IJOEAR) ISSN:[2454-1850] [Vol-3, Issue-1, January- 2017]
Page | 30
Investigation of carbonisation of wheat stems from central
Europe during slow pyrolysis at different temperatures Annett Dorner-Reisel
1, Yvonne Joseph
2, Viola Matner
3, Volker Klemm
4,
Stefan Svoboda5
1,3Department of Mechanical Engineering, University of Applied Sciences Schmalkalden, Germany
2Institute for Electronic and Sensor Materials, Technical University Freiberg, Germany
4Institute for Materials Science, Technical University Freiberg, Germany
5Department of Electrical Engineering, University of Applied Sciences Schmalkalden, Germany
Abstract— Slow pyrolysis of wheat stems from south-west Thuringia in Central Germany favours the interaction of lignin,
cellulose and hemicellulose. As a result, after low pyrolysis temperatures of 600 °C, 800 °C or 1000 °C crystallinity of bio-
carbon is pronounced. As shown by Raman spectroscopy, with increasing pyrolysis temperature, the intensity ratio ID/IG of
D band to G band increases. This gives evidence of a growing amount of aromatic graphitic rings with a lot of disorder in
the carbonaceous biogenetic material. With increasing pyrolysis temperature more 6-fold, still defective carbon rings form
out of the amorphous sp2-C-C matrix. High resolution transmission electron microscopy identifies parallel layers of
crystalline carbon that are oriented in bands after pyrolysis at 800 °C. This degree of order after a relatively low pyrolysis
temperature is excellent. For many applications, regulated and oriented crystallinity is essential. Steering the orientation
and fraction of crystalline bio-carbon could be favourable for producing carbon fibres of higher quality from suitable
biomass. By regulating the composition of lignin to cellulose, hemicelluose or other substances, the bio-carbon crystallinity
could be adjusted.
Keywords— carbonation, wheat stems, pyrolysis, Central Europe.
I. INTRODUCTION
Pyrolysis products obtained from natural sources provide bioenergy and carbons with advantageous structural configurations.
Such carbons are mainly composed of aromatic carbon with several degrees of aromaticity (Mohanty et al., 2013). There are
plenty of highly sophisticated applications for carbon materials from biological sources. The pyrolysis conditions as well as
the selected biomass type and composition influence the suitable applications strongly.
Pyrolysis of biomass for biochar as a soil remediation usually demands lower pyrolysis temperatures around 300 °C until
600 °C or slowly higher. Such biochars significantly increases seed emergence, soil and crop productivity (Anawar et al.,
2015; Mohanty et al. 2013). Properties like high surface area, high porosity, variable charge, and presence of special
functional groups increase soil water-holding capacity, pH, cation exchange capacity (CEC), surface sorption capacity, base
saturation, and crop resistance to disease, which varies with pyrolysis conditions or biomass type (Singh et al., 2010).
Biochar strongly sorbs salts (Thomas et al., 2013) and ameliorates salt stress effects on plants in contaminated soils or
agricultural areas recovered from marine water in cost region. It was shown, that the addition of biochar to soil increases the
availability of P and Zn, and total N concentration, and hereby, it increases crop yields (Blackwell et al., 2010).
Carbonisation at higher temperatures effects high performance functional and/or extraordinary mechanical properties. In
example, multiwalled carbon nanotubes (MWCNTs) synthesis is promoted by selected bio-carbon, like bamboo charcoals,
which contained Mg2SiO4 calcium silicate, responsible for the nucleation and growth of MCNTs at 1200-1400 °C (Zhu et al.,
2012).
In most cases, an additional chemical treatment or thermo-mechanical pre-treatment before or during the pyrolysis is
essential. Wu et al. (Wu et al., 2015) suggest an one-step carbonisation of alkali-treated wheat for the synthesis of three-
dimensionally (3D) interconnected honeycomb-like porous carbon foam (HPC). The HPC electrode exhibits a high specific
capacitance, outstanding electrochemical stability, and delivers an ultrahigh energy density much higher than most carbon-
based supercapacitors. While wheat grains are produced for human feeding mostly, wheat straw is annually generated in
abundance worldwide 529 million tons/year (Buranov et al., 2008). North America is the largest producer with 15 % of
global wheat production after Asia with 43 % and Europe with 32 % (Kim and Dale, 2004).

International Journal of Environmental & Agriculture Research (IJOEAR) ISSN:[2454-1850] [Vol-3, Issue-1, January- 2017]
Page | 31
The present study focuses on investigation of pyrolytic carbon of wheat straw from Germany. It clarifies microstructure by
SEM and Raman spectroscopy after pyrolysis at different temperatures. Due to the relatively high pyrolysis temperatures, the
intended applications of the produced biogenic cellular wheat straw carbon is envisaged in several areas including structural
(lightweight design) and functional advantages (adsorption of gases or catalytic effects).
II. EXPERIMENTAL METHODS
2.1 Sampling pre-treatment of biomass
In the present study, wheat straw from a selected agricultural region was chosen. The sampling were done from own 1 m x 1
m x 1 m bale of straw after harvesting and cutting. The origin of straw was an agricultural area in central Germany, south-
west of German federal state Thuringia near the city D-36448 Bad Liebenstein (figure 1). It was taken statistically from three
different positions of a bale of straw. Following sampling, straw were dried three days at around 50°C in recirculating air.
The straws were cut into smaller sizes of several millimetres and filled in ceramic specimen holder.
FIGURE 1: SAMPLING OF WHEAT STRAW
2.2 Macroscopic characterisation
As the diameter varies other the stem length, an averaged thickness should give information in comparison to other batches
of stems from other areas or different harvests over the years.
Stem thickness were measured in a stereomicroscope at 40x magnification. Each stem were measured some millimetres from
the top, the end and in the middle of the stem. The average value of the three thickness was calculated. This average stem
thickness was determined by measuring in the stereomicroscope at least 60 stems. Stem sampling from batches and position
selection was done statistically.
Figure 1b: Typical wheat
stem

International Journal of Environmental & Agriculture Research (IJOEAR) ISSN:[2454-1850] [Vol-3, Issue-1, January- 2017]
Page | 32
2.3 Thermal treatment of biomass
The wheat stem biomass was pyrolysed in a high vacuum oven of the company THERMAL TECHNOLOGY GmbH. 110-
130 mg biomass were placed in alumina crucibles for every thermal treatment. The oven interior was heated up with a rate of
6.5 K/min under 0.01 to 0.001 mbar. There was a temporary pressure increase between 350 °C and 450 °C up to 0.1 mbar
due to the evaporation of volatile fragments during the thermal decomposition. The top temperatures of 600 °C, 800 °C or
1000 °C were hold for 2 hours. Finally, there was a free cooling down to room temperature. After reaching 350 °C, the oil
diffusion pump was turned off. The slow pyrolysis is especially mild for preserving the wheat stems microstructure.
2.4 Investigation of morphology and microstructure by Scanning Electron Microscopy (SEM)
The morphology of the wheat stems before and after pyrolysis was investigated through scanning electron microscopy using
ZEISS EVO Series SEM EVO 50. Typical features like cell diameters in the natural wheat stem and the heat treated wheat
stem were measured in the SEM. Because volume or linear shrinkage is complicated to be measured exactly due to the low
strength of the pyrolysed biomass, as an alternative value for volume shrinkage, the reduction in cell size diameter is used. 30
parenchyma cells of wheat stem cross-sections were measured using scanning electron microscopy at a magnification of
1000 on fractured cross-sections. The mean value and the standard deviation were compared.
2.5 High resolution transmission electron spectroscopy (HR-TEM)
For high resolution transmission electron microscopy, a Jeol JEM 2010 FEF with accelerating voltage of 200 kV was used.
Before the nanostructure of the thermal treated wheat stems can be characterised by HR-TEM, the samples needed to be
prepared by mechanical and ion thinning.
2.6 Raman spectroscopy
A Renishaw inVia Raman microscope equipped with 532 nm laser diode and back scattering configuration was used to
analyse the biogenic carbon samples after pyrolysis. The spectral resolution was 4 cm-1
with 10 % laser power. A total
exposure time of 1 s was chosen. For curve-fitting, the WiRE Raman software (version 3.2) was used.
III. RESULTS
3.1 Stereomicroscopy
Using stereomicroscopy the thickness of stems and general features can be documented. Wheat stems of batch H1 from the
region of south-west Thuringia in Germany summer and the harvest 2015 revealed a smooth and strong yellowish surface.
No grey sprinkles or affections were visible in the stereomicroscope. Some impression of the straw is given in figure 1b,
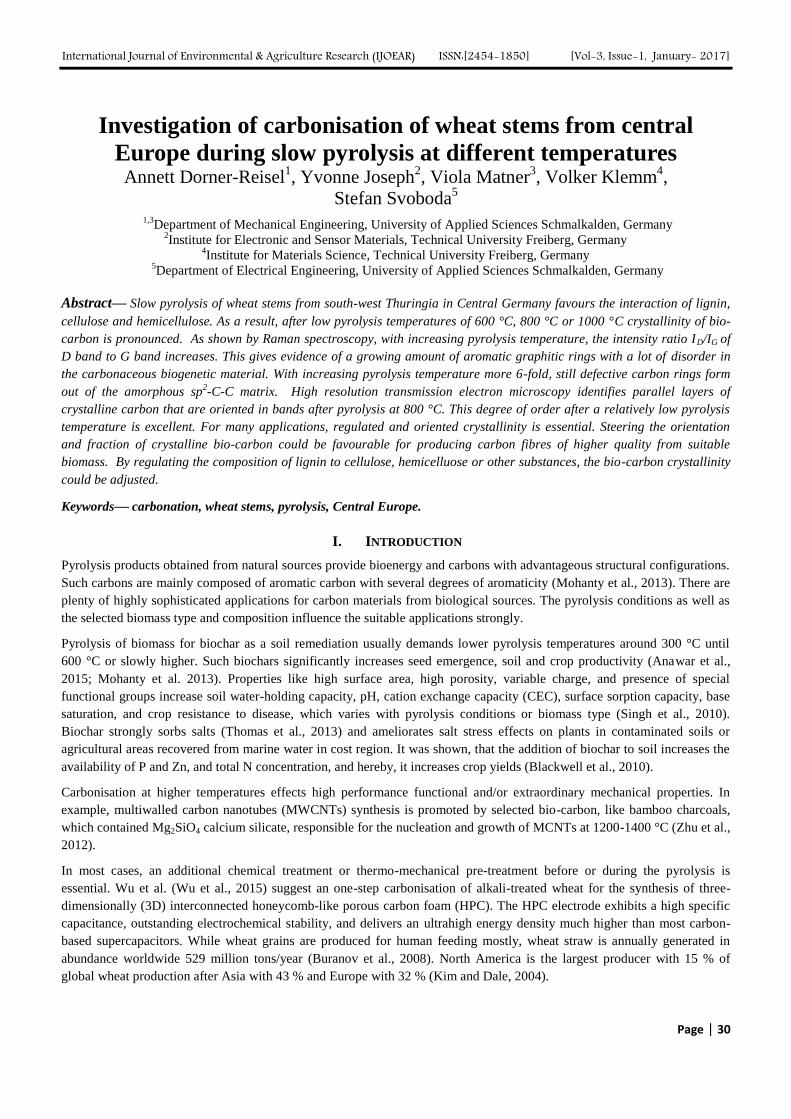
which shows an intact stem section. Also figure 3 show representative stems, which were already cutty. The average
thickness of wheat stems is 5.0 ±1.3 mm. A classification of wheat stems thickness can be seen in figure 2.
FIGURE 2. THICKNESS OF WHEAT STEMS OF BATCH H1: SAMPLING OF WHEAT STRAW FROM CENTRAL
GERMANY, SOUTH-WEST OF GERMAN FEDERAL STATE THURINGIA NEAR THE CITY D-36448 BAD
LIEBENSTEIN
International Journal of Environmental & Agriculture Research (IJOEAR) ISSN:[2454-1850] [Vol-3, Issue-1, January- 2017]
Page | 33
FIGURE 3. WHEAT STEMS AFTER CUTTING (BEFORE PYROLYSIS)
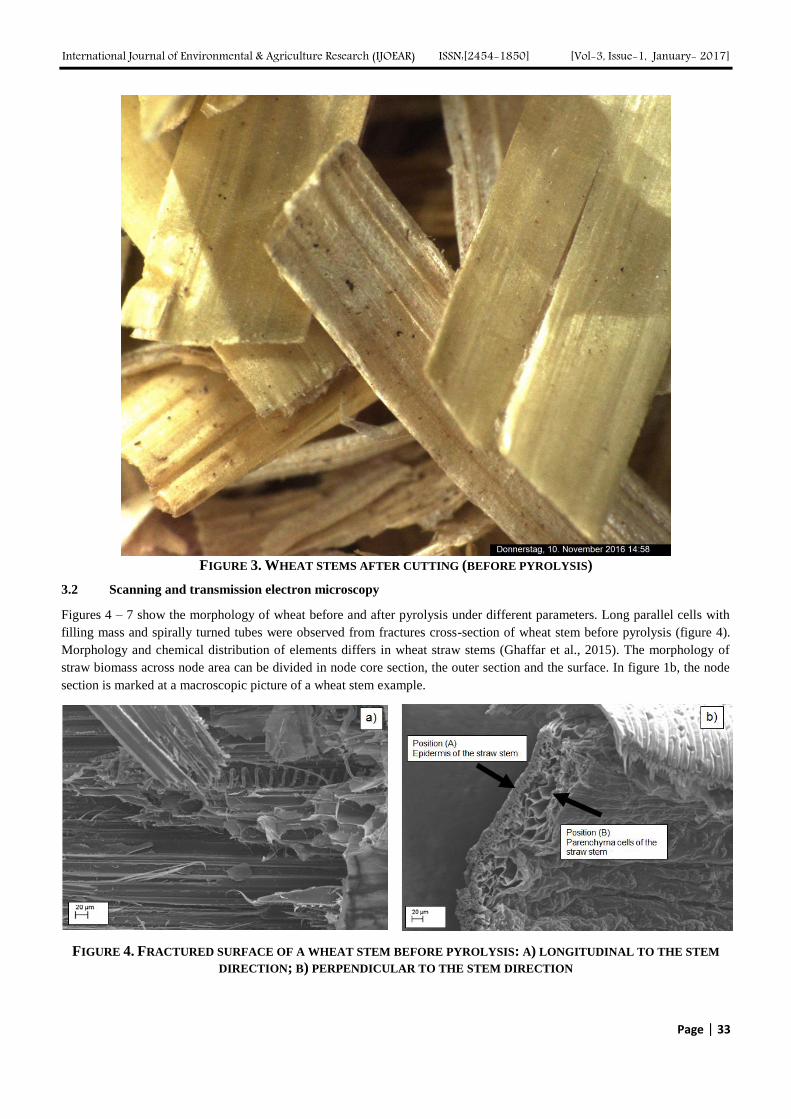
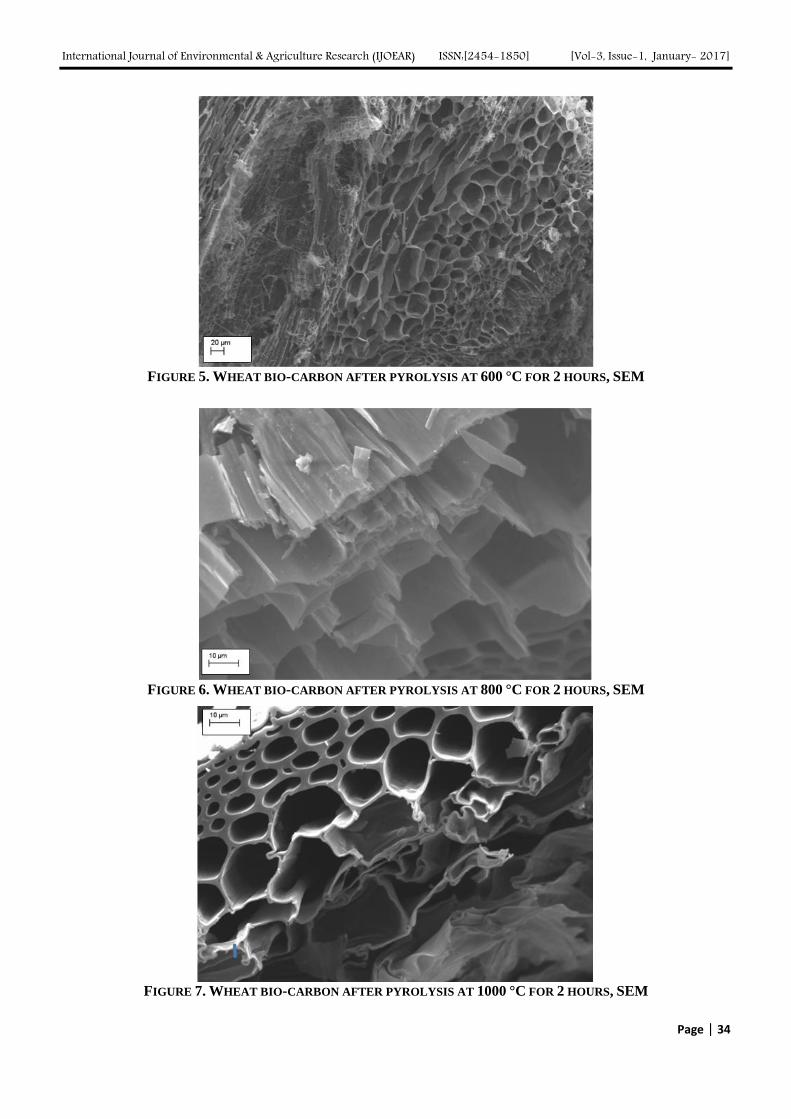
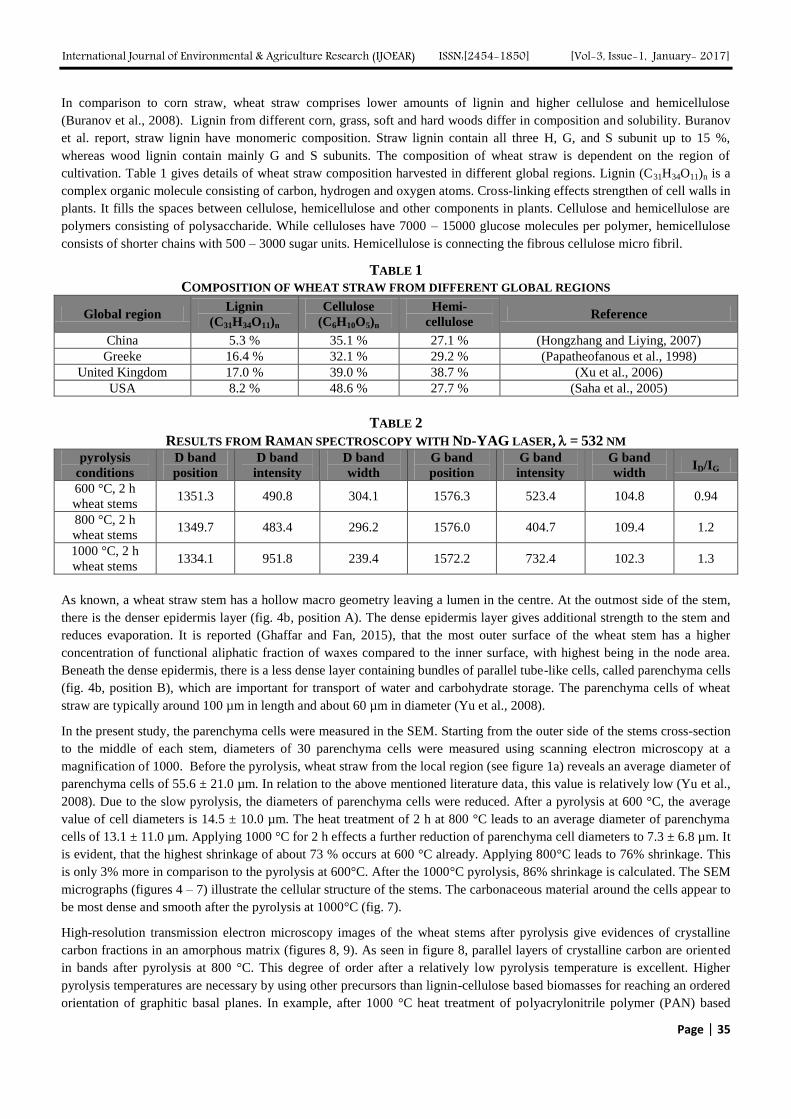
3.2 Scanning and transmission electron microscopy
Figures 4 – 7 show the morphology of wheat before and after pyrolysis under different parameters. Long parallel cells with
filling mass and spirally turned tubes were observed from fractures cross-section of wheat stem before pyrolysis (figure 4).
Morphology and chemical distribution of elements differs in wheat straw stems (Ghaffar et al., 2015). The morphology of
straw biomass across node area can be divided in node core section, the outer section and the surface. In figure 1b, the node
section is marked at a macroscopic picture of a wheat stem example.
FIGURE 4. FRACTURED SURFACE OF A WHEAT STEM BEFORE PYROLYSIS: A) LONGITUDINAL TO THE STEM
DIRECTION; B) PERPENDICULAR TO THE STEM DIRECTION
International Journal of Environmental & Agriculture Research (IJOEAR) ISSN:[2454-1850] [Vol-3, Issue-1, January- 2017]
Page | 34
FIGURE 5. WHEAT BIO-CARBON AFTER PYROLYSIS AT 600 °C FOR 2 HOURS, SEM
FIGURE 6. WHEAT BIO-CARBON AFTER PYROLYSIS AT 800 °C FOR 2 HOURS, SEM
FIGURE 7. WHEAT BIO-CARBON AFTER PYROLYSIS AT 1000 °C FOR 2 HOURS, SEM
International Journal of Environmental & Agriculture Research (IJOEAR) ISSN:[2454-1850] [Vol-3, Issue-1, January- 2017]
Page | 35
In comparison to corn straw, wheat straw comprises lower amounts of lignin and higher cellulose and hemicellulose
(Buranov et al., 2008). Lignin from different corn, grass, soft and hard woods differ in composition and solubility. Buranov
et al. report, straw lignin have monomeric composition. Straw lignin contain all three H, G, and S subunit up to 15 %,
whereas wood lignin contain mainly G and S subunits. The composition of wheat straw is dependent on the region of
cultivation. Table 1 gives details of wheat straw composition harvested in different global regions. Lignin (C31H34O11)n is a
complex organic molecule consisting of carbon, hydrogen and oxygen atoms. Cross-linking effects strengthen of cell walls in
plants. It fills the spaces between cellulose, hemicellulose and other components in plants. Cellulose and hemicellulose are
polymers consisting of polysaccharide. While celluloses have 7000 – 15000 glucose molecules per polymer, hemicellulose
consists of shorter chains with 500 – 3000 sugar units. Hemicellulose is connecting the fibrous cellulose micro fibril.
TABLE 1
COMPOSITION OF WHEAT STRAW FROM DIFFERENT GLOBAL REGIONS
Global region Lignin
(C31H34O11)n
Cellulose
(C6H10O5)n
Hemi-
cellulose Reference
China 5.3 % 35.1 % 27.1 % (Hongzhang and Liying, 2007)
Greeke 16.4 % 32.1 % 29.2 % (Papatheofanous et al., 1998)
United Kingdom 17.0 % 39.0 % 38.7 % (Xu et al., 2006)
USA 8.2 % 48.6 % 27.7 % (Saha et al., 2005)
TABLE 2
RESULTS FROM RAMAN SPECTROSCOPY WITH ND-YAG LASER, = 532 NM pyrolysis
conditions
D band
position
D band
intensity
D band
width
G band
position
G band
intensity
G band
width ID/IG
600 °C, 2 h
wheat stems 1351.3 490.8 304.1 1576.3 523.4 104.8 0.94
800 °C, 2 h
wheat stems 1349.7 483.4 296.2 1576.0 404.7 109.4 1.2
1000 °C, 2 h
wheat stems 1334.1 951.8 239.4 1572.2 732.4 102.3 1.3
As known, a wheat straw stem has a hollow macro geometry leaving a lumen in the centre. At the outmost side of the stem,
there is the denser epidermis layer (fig. 4b, position A). The dense epidermis layer gives additional strength to the stem and
reduces evaporation. It is reported (Ghaffar and Fan, 2015), that the most outer surface of the wheat stem has a higher
concentration of functional aliphatic fraction of waxes compared to the inner surface, with highest being in the node area.
Beneath the dense epidermis, there is a less dense layer containing bundles of parallel tube-like cells, called parenchyma cells
(fig. 4b, position B), which are important for transport of water and carbohydrate storage. The parenchyma cells of wheat
straw are typically around 100 µm in length and about 60 µm in diameter (Yu et al., 2008).
In the present study, the parenchyma cells were measured in the SEM. Starting from the outer side of the stems cross-section
to the middle of each stem, diameters of 30 parenchyma cells were measured using scanning electron microscopy at a
magnification of 1000. Before the pyrolysis, wheat straw from the local region (see figure 1a) reveals an average diameter of
parenchyma cells of 55.6 ± 21.0 µm. In relation to the above mentioned literature data, this value is relatively low (Yu et al.,
2008). Due to the slow pyrolysis, the diameters of parenchyma cells were reduced. After a pyrolysis at 600 °C, the average
value of cell diameters is 14.5 ± 10.0 µm. The heat treatment of 2 h at 800 °C leads to an average diameter of parenchyma
cells of 13.1 ± 11.0 µm. Applying 1000 °C for 2 h effects a further reduction of parenchyma cell diameters to 7.3 ± 6.8 µm. It
is evident, that the highest shrinkage of about 73 % occurs at 600 °C already. Applying 800°C leads to 76% shrinkage. This
is only 3% more in comparison to the pyrolysis at 600°C. After the 1000°C pyrolysis, 86% shrinkage is calculated. The SEM
micrographs (figures 4 – 7) illustrate the cellular structure of the stems. The carbonaceous material around the cells appear to
be most dense and smooth after the pyrolysis at 1000°C (fig. 7).
High-resolution transmission electron microscopy images of the wheat stems after pyrolysis give evidences of crystalline
carbon fractions in an amorphous matrix (figures 8, 9). As seen in figure 8, parallel layers of crystalline carbon are oriented
in bands after pyrolysis at 800 °C. This degree of order after a relatively low pyrolysis temperature is excellent. Higher
pyrolysis temperatures are necessary by using other precursors than lignin-cellulose based biomasses for reaching an ordered
orientation of graphitic basal planes. In example, after 1000 °C heat treatment of polyacrylonitrile polymer (PAN) based

International Journal of Environmental & Agriculture Research (IJOEAR) ISSN:[2454-1850] [Vol-3, Issue-1, January- 2017]
Page | 36
carbon fibres represent homogeneous microstructure with randomly oriented small crystallites only (Musiol et al., 2016).
Other research groups report, that little to no crystallinity in lignin-based carbon materials can be observed after pyrolysis
(Meek et al., 2016). They point out that a fundamentally different microstructure develops for example in lignin-based
carbon fibres compared to PAN based fibres. In the present study, the lignin was not separated from the cellulose nor
hemicellulose, but the whole biomass of wheat stems were used and heat treated at this stage. Both biomass decomposition
and biomass pyrolysis are strongly determined by the cellulose-lignin interactions (Wu et al., 2016), hereby the mixing
method had the strongest influence, followed by temperature and mixing ratio. All this impacts are essential for the
properties of the subsequent biocarbon product. Functional and mechanical properties of carbon materials are directly related
to the concentration of point defects, consisting vacancies, interstitial atoms, and impurities, as well as the crystalline
perfection and orientation. Without any additional measures, a strip-like orientation of crystalline graphitic regions is
achieved by wheat stems pyrolysis at 800oC. In figure 9, a higher degree of crystallinity, but an overlapping of the curved
crystalline bands is visible.
FIGURE 8. WHEAT BIO-CARBON AFTER PYROLYSIS
AT 800 °C FOR 2 HOURS: ORIENTED SMALLER
GRAPHITIC BANDS, HR-TEM
FIGURE 9. WHEAT BIO-CARBON AFTER PYROLYSIS
AT 800 °C FOR 2 HOURS: BROAD GRAPHITIC
OVERLAPPING BANDS, HR-TEM
3.3 Raman spectroscopy
For biochar, which were heat treated in N2 atmosphere up to 450 °C, different Raman bands can be identified and used for
curve fittings (Mohanty et al. 2013, Keown et al. 2008). The bands at 1185 cm-1
(S band) and 1230 cm-1
(SL) are indicative
for aryl-alkyl ether bonding.
For biochar, which is exposed low temperature up to 500 °C, bands between 1300 cm-1
and 1465 cm-1
would be indicative
for methylene or methyl groups, i.e. presence of methylium cation (CH3 +) and C-C or C-N vibrations.
Single crystalline graphite shows own Raman band around 1580 cm-1
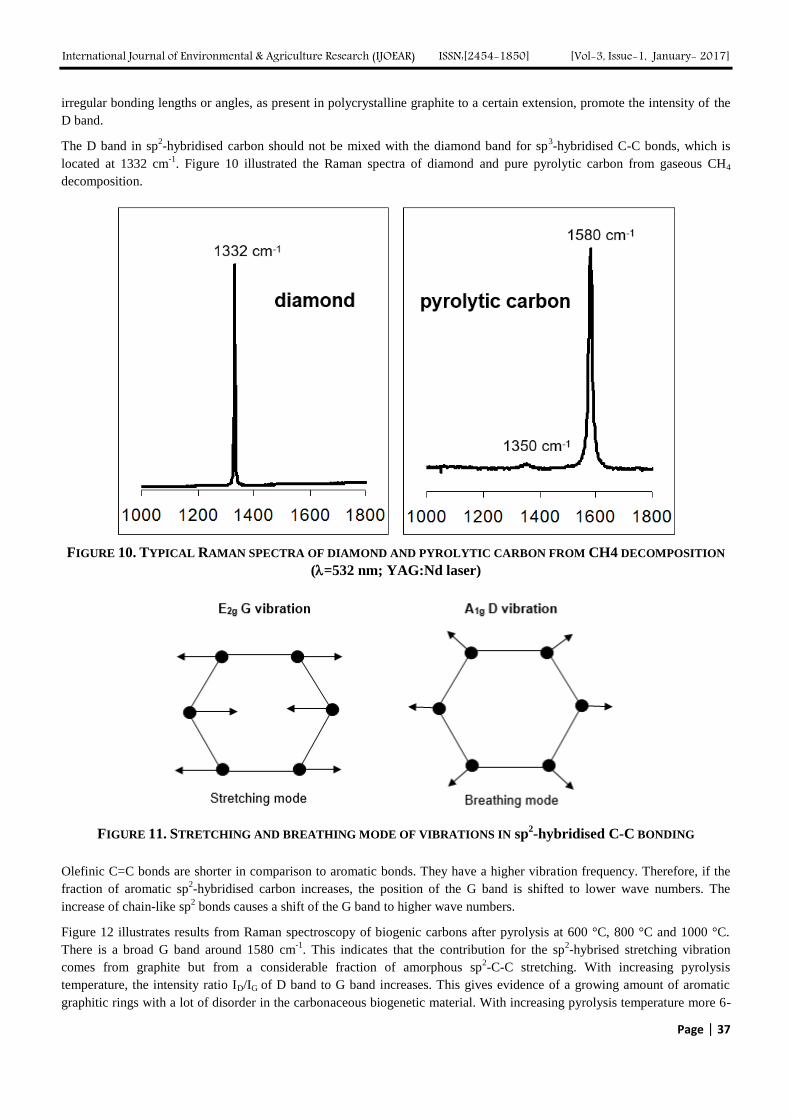
, the G band (Tuinstra et al. 1970). The letter “G”
stands for graphite. The G band is caused by sp2-hybridised C-C stretching vibration (Figures 10, 11). It is does not indicate
aromatic carbon rings.
Pyrolysis of lignin during the combustion of wood or charcoal production yields a range of products. The aromatic sixfold
rings from the lignin structure form characteristic methoxy-substituted phenols during pyrolysis.
Sp2-hybridised polycrystalline graphite, like pyrolytic carbon, charcoal, soot or glassy carbon, show a D band at around 1350
cm-1
as well. The D modus is forbidden in perfect graphite. However, the selection rules are opened for disordered graphite.
The intensity of that Raman band around 1350 cm-1
grows with increasing fraction of disordered graphite and reduced
crystallite size of graphite. The origin of the symbol “D” for D band comes from the name disordered carbon. Defects like
International Journal of Environmental & Agriculture Research (IJOEAR) ISSN:[2454-1850] [Vol-3, Issue-1, January- 2017]
Page | 37
irregular bonding lengths or angles, as present in polycrystalline graphite to a certain extension, promote the intensity of the
D band.
The D band in sp2-hybridised carbon should not be mixed with the diamond band for sp
3-hybridised C-C bonds, which is
located at 1332 cm-1
. Figure 10 illustrated the Raman spectra of diamond and pure pyrolytic carbon from gaseous CH4
decomposition.
FIGURE 10. TYPICAL RAMAN SPECTRA OF DIAMOND AND PYROLYTIC CARBON FROM CH4 DECOMPOSITION
(=532 nm; YAG:Nd laser)
FIGURE 11. STRETCHING AND BREATHING MODE OF VIBRATIONS IN sp
2-hybridised C-C BONDING
Olefinic C=C bonds are shorter in comparison to aromatic bonds. They have a higher vibration frequency. Therefore, if the
fraction of aromatic sp2-hybridised carbon increases, the position of the G band is shifted to lower wave numbers. The
increase of chain-like sp2 bonds causes a shift of the G band to higher wave numbers.
Figure 12 illustrates results from Raman spectroscopy of biogenic carbons after pyrolysis at 600 °C, 800 °C and 1000 °C.
There is a broad G band around 1580 cm-1
. This indicates that the contribution for the sp2-hybrised stretching vibration
comes from graphite but from a considerable fraction of amorphous sp2-C-C stretching. With increasing pyrolysis
temperature, the intensity ratio ID/IG of D band to G band increases. This gives evidence of a growing amount of aromatic
graphitic rings with a lot of disorder in the carbonaceous biogenetic material. With increasing pyrolysis temperature more 6-

International Journal of Environmental & Agriculture Research (IJOEAR) ISSN:[2454-1850] [Vol-3, Issue-1, January- 2017]
Page | 38
fold, still defective carbon rings form out of the amorphous sp2-C-C matrix. Figure 13 show the ID/IG ratio and the shift of the
D band position in dependence on the pyrolysis temperature. In general, Raman spectroscopy of the bio-carbons confirm the
above stated findings of an appropriate carbonaceous crystallinity at already low pyrolysis temperatures. Also, a relatively
low degree of disorder is observed.
FIGURE 12. RAMAN SPECTRA OF BIO-CARBON FROM WHEAT STEM PYROLYSIS AT 600 °C, 800 °C, 1000 °C
FIGURE 13. D BAND POSITION AND ID/IG RATIO
V. CONCLUSIONS
Wheat stems contain cellulose, hemicellulose, lignin, and maybe residues from the soil. In the present study, wheat stems of
south-west Thuringia in Central Germany were characterized and pyrolysed at 600 °C, 800 °C and 1000 °C top temperatures.
Raman spectroscopy confirm a good crystallinity of carbon already after heating up to 600 °C. In addition, most of the
shrinkage, namely 73 %, is reached at 600 °C already. Furthermore, HR-TEM images give evidence of crystalline carbon
fractions in an amorphous matrix. Parallel layers of crystalline carbon are oriented in bands after pyrolysis. There is a good
orientation of the graphites basal planes. This result is surprising, because lignin is known to retard crystallisation and tends
to convert into amorphous carbon. Apparently, the co-pyrolysis or interaction of lignin with cellulose and/or hemicellulose
seems to be favourable for improving carbon fraction in crystalline structures. In Steering the orientation and fraction of
crystalline bio-carbon could be favourable for producing carbon fibres of higher quality from suitable biomass.
International Journal of Environmental & Agriculture Research (IJOEAR) ISSN:[2454-1850] [Vol-3, Issue-1, January- 2017]
Page | 39
ACKNOWLEDGEMENTS
The authors would like to acknowledge the Thüringer Ministerium für Wirtschaft, Wissenschaft und Digitale Gesellschaft
TMWWDG, as well as, the Europäische Strukturfond ESF, which funded the project BUNT 2015-0092.
REFERENCES
[1] Anawar H R, Akter F, Solaiman Z M et al. (2015) Biochar: An Emerging Panacea for Remediation of Soil Contaminants from
Mining, Industry and Sewage Wastes. Pedosphere 25(5): 654–665
[2] Blackwell P, Krull E, Butler G, et al. (2010) Effect of banded biochar on dryland wheat production and fertiliser use in south-western
Australia: An argonomic and economic perspective. Aust. J. Soil Res. 48: 531-545
[3] Buranov A U, Mazza G (2008) Lignin in straw of herbaceous crops. Industrial Crops and Products. 28: 237-259
[4] Ghaffar S H, Fan M (2015) Revealing the morphology and chemical distribution of nodes in wheat straw. Biomass and Bioenergy 77:
123-134
[5] Hongzhang C, Liying L (2007) Unpolluted fractionation of wheat straw by steam explosion and ethanol extraction. Biores. Technol.
98:666-676
[6] Keown D M, Li X, Hayashi J et al. (2008) Evolution of biomass char structure during oxidation in O2 as revealed with FT-Raman
spectroscopy. Fuel Processing Technology 89: 1429-1435
[7] Kim S, Li X, Dale B E (2004) Global potential bioethanol production from wasted crops and crop residues. Biomass Bioenergy 26:
361-375
[8] Meek, N, Penumadu, D., Hosseinaei, O, et al. (2016) Synthesis and characterization of lignin carbon fiber and composites.
Composites and Technology 137: 60-68
[9] Mohanty P, Nanda S, Pant K K et al. (2013) Evaluation of the physiochemical development of biochars obtained from pyrolysis of
wheat, timothy grass and pinewood: Effects of heating rates. J Anal & Applied Pyrolysis 104: 485–493
[10] Musiol, P, Szatkowski, P, Gubernat, M, et al. (2016) Comparative study of structure and microstructure of PAN-based nano- and
micro-carbon fibers. Ceramics International 42: 11603-11610
[11] Papatheofanous M G, Billa E, Koullas D P et al. (1998) Optimization multisteps mechanical-chemical fractionation of wheat straw
components. Ind. Crops Prod. 7: 249-256
[12] Saha B C, Iten L B, Cotta M A et al. (2005) dilute acid pretreatment, enzymatic saccharification and fermentation of wheat straw to
ethanol. Process Biochem. 40: 3693-3700
[13] Singh B Cowie A L, (2008) A novel approach, using 13C natural abundance, for measuring decomposition of biochars in soil.
Occasional Report No. 21. Fertilizer and Lime Research Centre, Massey University, Palmerston North, pp. 549
[14] Thomas S C, Frye S, Gale N et al. (2013) Biochar mitigates negative effects of salt additions on two herbaceaous plant species. J
Environ Manage 129: 62-68
[15] Tuinstra F, Koenig J L (1970) Raman spectroscopy of graphite. J Chem Phys 53: 1126-1130
[16] Wu, S, Shen, D, Hu, J. et al. (2016) Cellulose-hemicellulose interactions during fast pyrolysis with different temperatures and mixing
methods, Biomass and Bioenergy 95: 55-63
[17] Xu F, Sun J, Sun R et al. (2006) Comparative study of organosolv lignins from wheat straw. Ind. Crops Prod. 23: 180-193
[18] Yu H, Liu R, Shen D et al. (2008) Arrangement of cellulose microfibrils in the wheat straw cell wall. Carbohydrate Polymers 72: 122-
127
[19] Zhu J, Ji J, Kwong L F et al. (2012) Synthesis of multiwalled carbon nanotubes from bamboo charcoal and the roles of minerals on
their growth. Biomass and Bioenergy 36: 12-19