ice sheets and sea level: thinking outside the box · ice sheets and sea level: thinking outside...
TRANSCRIPT

Ice Sheets and Sea Level: Thinking Outside the Box
Michiel R. Van den Broeke • Jonathan Bamber •
Jan Lenaerts • Eric Rignot
Received: 14 January 2011 / Accepted: 31 May 2011 / Published online: 22 June 2011� The Author(s) 2011. This article is published with open access at Springerlink.com
Abstract Until quite recently, the mass balance (MB) of the great ice sheets of Greenland
and Antarctica was poorly known and often treated as a residual in the budget of oceanic
mass and sea level change. Recent developments in regional climate modelling and remote
sensing, especially altimetry, gravimetry and InSAR feature tracking, have enabled us to
specifically resolve the ice sheet mass balance components at a near-annual timescale. The
results reveal significant mass losses for both ice sheets, caused by the acceleration of
marine-terminating glaciers in southeast, west and northwest Greenland and coastal West
Antarctica, and increased run-off in Greenland. At the same time, the data show that
interannual variability is very significant, masking the underlying trends.
Keywords Greenland � Antarctica � Mass balance � Sea level
Surveys of Geophysics, proceedings of the ISSI workshop on the Earth’s Cryosphere and Sea Level Change,March 22–26, Bern, Switzerland.
M. R. Van den Broeke (&) � J. LenaertsInstitute for Marine and Atmospheric Research, Utrecht University, Utrecht, The Netherlandse-mail: [email protected]
J. Lenaertse-mail: [email protected]
J. BamberBristol Glaciology Centre, School of Geographical Sciences, University of Bristol, Bristol, UKe-mail: [email protected]
E. RignotDepartment of Earth System Science, University of California, Irvine, CA, USAe-mail: [email protected]
E. RignotJet Propulsion Laboratory, Pasadena, CA, USA
123
Surv Geophys (2011) 32:495–505DOI 10.1007/s10712-011-9137-z

1 Introduction
The large ice sheets of Antarctica (AIS) and Greenland (GrIS) represent the largest fresh-
water sources on Earth, larger by two orders of magnitude than all other glaciers and ice caps
combined, and sufficient to increase global sea level by about 70 m. Until quite recently, the
mass balance (MB) of the AIS and GrIS and hence their contribution to sea level rise (SLR)
was poorly known. Over the twentieth century, during which sea level rose by about
1.7 mm year-1, their contribution to SLR was assumed to be small (Church et al. 2001).
For the period 1993–2003, based on satellite altimetry, Bindoff et al. (2007) estimated
the rate of SLR to be 3.1 ± 0.4 mm year-1, i.e. almost twice the rate of the twentieth
century. Thermal expansion of the upper ocean layers amounted to 1.6 ± 0.3 mm year-1.
If for simplicity we neglect the contribution from other sources (e.g., deep ocean warming,
storage of ground water and water in artificial basins), this leaves a land ice contribution of
1.5 ± 0.3 mm year-1. Of this, 0.8 ± 0.2 mm year-1 is attributed to the melting of small
glaciers and ice caps (GIC, Lemke et al. 2007). The residual of 0.7 ± 0.5 mm year-1 is
ascribed to mass loss from the AIS and GrIS.
For the more recent period 2003–2008, for which many more data are available, con-
siderable uncertainties remain with respect to the oceanic mass budget (Willis et al. 2008;
Nicholls and Cazenave 2010). Using altimetry and satellite gravimetry data from GRACE
over the period 2003–2008, Cazenave et al. (2009) estimate the rate of SLR to be
2.5 ± 0.4 mm year-1, i.e. a 20% decrease compared to 1993–2003. This decrease was
explained by a reduction in the contribution of thermal expansion, to 0.4 ± 0.1 mm year-1
(Willis et al. 2008), indicating that the contribution of land ice to SLR had increased to
2.1 ± 0.3 mm year-1. Meier et al. (2007) estimate that GIC in 2006 contributed
1.1 ± 0.2 mm year-1 to SLR. If we assume this value to be the representative for
2003–2008, this leaves a contribution of 1.0 ± 0.4 mm year-1 for the AIS and GrIS. Both
for GIC and the AIS/GrIS, this represents a &40% increase in mass loss compared to the
period 1993–2003.
In spite of the insight it yields, it is unsatisfactory to treat the contribution of the AIS
and GrIS to SLR as a residual. Firstly, all components of the sea level budget have large
uncertainties, enhancing the uncertainty in the residual. Secondly, it is imperative that we
partition the ice sheet mass loss into an ice dynamic (glacier acceleration) and surface
(snowfall/run-off) component; only then will it be possible to model the physical processes
responsible for ongoing mass losses and make predictions. Thirdly, we must resolve the
temporal (interannual) variability of the AIS and GrIS mass balance, to explain interannual
variations in SLR. In this survey, we present some recent advances and results in this field.
2 Methods to Determine Ice Sheet Mass Balance
The contributions of the AIS and GrIS to SLR depend on their mass balance (MB, Gt
year-1), defined as the temporal change of ice sheet mass (qM/qt). Neglecting basal
melting of grounded ice, MB is governed by the difference between surface mass balance
(SMB) and the ice discharge across the grounding line, including the effects of grounding
line migration (D):
MB ¼ oM=ot ¼ SMB� D ð1ÞSurface mass balance (SMB, Gt year-1) is the sum of accumulation by precipitation
(snow and rain) and ablation by sublimation and run-off. Run-off, in turn, is determined by
496 Surv Geophys (2011) 32:495–505
123

the liquid water balance (LWB), the sum of sources (water vapour condensation, rainfall
and ice and snow melt) and sinks (refreezing and capillary retention) of liquid water.
Recent developments in remote sensing and regional climate modelling offer three
methods to estimate ice sheet MB, each with their advantages and disadvantages. These
three methods are briefly discussed below.
2.1 Satellite Altimetry
Remotely sensed elevation changes from radar/laser altimetry yield changes in ice sheet
volume, i.e. this technique does not discriminate between the different processes responsible
for mass loss. Moreover, converting volume to mass changes can be problematic, because
they are caused by changes in ice dynamics and firn densification rate as well as decadal
changes in accumulation, the latter representing a major source for short-term ice sheet
elevation changes (McConnell et al. 2000; Helsen et al. 2008). These processes cannot be
isolated based on elevation change measurements alone, and a separate estimate must be
made for firn densification and accumulation variability. This requires a firn densification
model forced by high-resolution (in time and space) atmospheric re-analyses, which can only
be done for the period with reliable atmospheric forcing data, i.e. after 1978 in Greenland and
1980 in Antarctica (Van de Berg et al. 2005). This excludes an assessment of the role of longer
time scale variations in snowfall, which are known to exist. Radar altimeters have a pene-
tration depth in snow that depends on (time varying) snow structure and density (Thomas et al.
2008). Until the launch of Cryosat-2 in 2010, the narrow, fast flowing outlet glaciers, which
are expected to react most rapidly to environmental changes, were not adequately resolved.
The laser altimeter onboard ICESat captures changes in these glaciers in detail (Pritchard
et al. 2009), but unfortunately has limited coverage and life span and is sensitive to clouds,
prohibiting continuous time series in high-accumulation (i.e. frequently overcast) areas.
2.2 Satellite Gravimetry
This method uses data of the Gravity Recovery and Climate Experiment (GRACE) sat-
ellites. GRACE has caused a small revolution in climate and sea level research by showing
beyond a doubt that the large ice sheets are losing mass (Velicogna and Wahr 2006a, b;
Wouters et al. 2008; Velicogna 2009; Chen et al. 2009). Moreover, the method is com-
pletely independent of the other two methods, making it a suitable verification and cali-
bration tool. Drawbacks are that no distinction is made between the different processes
responsible for mass loss, and the uncertainties arising from the short time period over
which the trends have been calculated (2003–2009, i.e. 7 years). Moreover, multiple
corrections must be applied to obtain mass changes, each introducing additional uncer-
tainties. In Antarctica, the most important correction is that for upward motion of the
Earth’s crust following deglaciation (Glacial Isostatic Adjustment or GIA). The GIA
correction is relatively small over Greenland, for which good agreement with the mass
budget method is found (Van den Broeke et al. 2009) but large and relatively poorly
constrained over Antarctica (Riva et al. 2009).
2.3 The Mass Budget Method
This method relies on an accurate determination of mass input (SMB) and mass output (D).
The major advantage of the mass budget method is that individual MB components (SMB,
Surv Geophys (2011) 32:495–505 497
123
LWB and D) are quantified, per drainage basin and year, providing insight into the physical
processes that determine ice sheet mass changes. Because MB represents the difference
between two large terms (SMB and D), the method is very sensitive to uncertainties in the
individual components. This prohibited its use over the full ice sheet surface until recently.
Using remotely sensed ice velocities/thicknesses and elevation data, and improved SMB
fields, ice sheet-wide MB assessments using the mass budget method are now feasible
(Rignot and Kanagaratnam 2006; Rignot et al. 2008a, b; Van den Broeke et al. 2009;
Rignot et al. 2011).
In addition to SMB compilations based on spatial interpolation of observations (Arthern
et al. 2006; Bales et al. 2009; Burgess et al. 2010), regional climate models (RCMs) have
recently also started to provide reliable SMB fields (Van de Berg, et al. 2006; Fettweis
2007; Ettema et al. 2009). RCMs explicitly resolve physical atmospheric processes leading
to snowfall and melt, and run at higher resolution than global models, typically 10–30 km
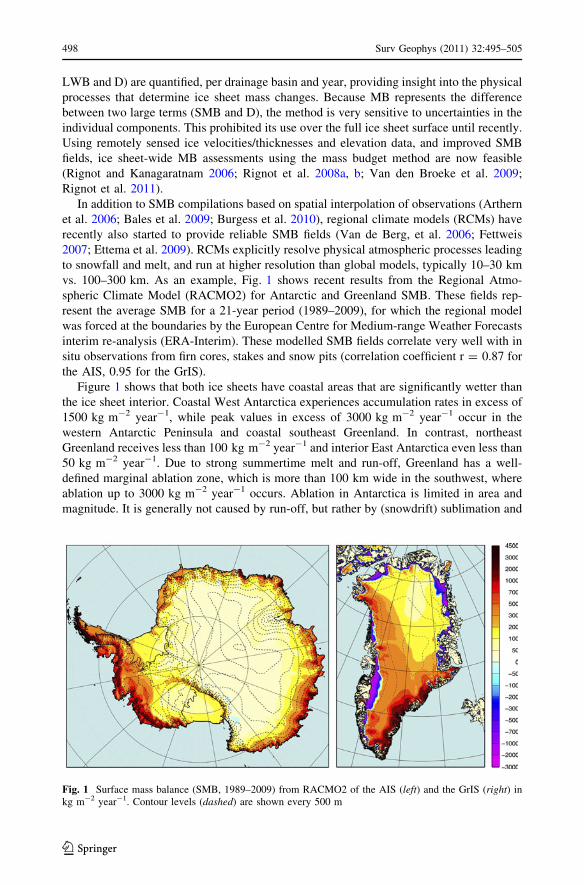
vs. 100–300 km. As an example, Fig. 1 shows recent results from the Regional Atmo-
spheric Climate Model (RACMO2) for Antarctic and Greenland SMB. These fields rep-
resent the average SMB for a 21-year period (1989–2009), for which the regional model
was forced at the boundaries by the European Centre for Medium-range Weather Forecasts
interim re-analysis (ERA-Interim). These modelled SMB fields correlate very well with in
situ observations from firn cores, stakes and snow pits (correlation coefficient r = 0.87 for
the AIS, 0.95 for the GrIS).
Figure 1 shows that both ice sheets have coastal areas that are significantly wetter than
the ice sheet interior. Coastal West Antarctica experiences accumulation rates in excess of
1500 kg m-2 year-1, while peak values in excess of 3000 kg m-2 year-1 occur in the
western Antarctic Peninsula and coastal southeast Greenland. In contrast, northeast
Greenland receives less than 100 kg m-2 year-1 and interior East Antarctica even less than
50 kg m-2 year-1. Due to strong summertime melt and run-off, Greenland has a well-
defined marginal ablation zone, which is more than 100 km wide in the southwest, where
ablation up to 3000 kg m-2 year-1 occurs. Ablation in Antarctica is limited in area and
magnitude. It is generally not caused by run-off, but rather by (snowdrift) sublimation and
Fig. 1 Surface mass balance (SMB, 1989–2009) from RACMO2 of the AIS (left) and the GrIS (right) inkg m-2 year-1. Contour levels (dashed) are shown every 500 m
498 Surv Geophys (2011) 32:495–505
123

erosion, limiting ablation to regions where these processes are active (Van den Broeke
et al. 2006b; Lenaerts et al. 2010). Because observations are very sparse in coastal, high-
accumulation/high-ablation areas (Van den Broeke et al. 2006a), compilations that rely on
interpolation of available observations tend to under/overestimate SMB in coastal Ant-
arctica/Greenland and therewith ice sheet SMB. This favours the use of modelled
(‘dynamically downscaled’) SMB fields in the mass budget method. The SMB numbers
presented in this paper refer to the conterminous, grounded ice sheet.
Ice discharge (D) is quantified using feature tracking from satellite imaging radar to
obtain the flow speed of the narrow glaciers through the flux gates at the ice sheet
grounding line (Rignot et al. 2008a, b). Satellite altimetry is used to accurately delineate
the ice drainage basins as well as to obtain the elevation/thickness of the outlet glacier at
the grounding line (Bamber et al. 2001, 2010). In Antarctica, where a floatation criterion is
used to determine ice thickness at the grounding line for most glaciers (Rignot et al.
2008b), a correction must be applied for the density of the firn mantle that covers the ice.
This can be achieved by using output of a regional atmospheric climate model in com-
bination with a steady-state firn compaction model (Van den Broeke 2008; Van den Broeke
et al. 2008). For the GrIS, where glacier tongues experience significant ablation in summer,
this correction is less important. Finally, if the grounding line is migrating, as is currently
the case in coastal West Antarctica, this represents a mass flux that must also be estimated
(Rignot et al. 2011).
3 Application of the Mass Budget Method to the AIS and GrIS
Owing to the availability of improved SMB and D estimates, recent studies have applied
the mass budget method to the AIS (Fig. 2a) and GrIS (Fig. 2b) for the period 1989–2009.
Before 1980, re-analysis products are unreliable in the SH, and no SMB estimates are
available for the AIS prior to that year (Van de Berg et al. 2005), while no accurate
discharge observations are currently available before 1992 (Rignot et al. 2011). The SMB
of the AIS does not show a significant trend, in line with earlier studies (Monaghan et al.
2006). A notable feature in Fig. 2a is the large interannual variability in SMB, with year-
to-year changes as large as 300 Gt year-1. However, the standard deviation of 121 Gt
year-1 represents just 6% of the 1989–2009 average SMB over the grounded ice sheet
(2083 Gt year-1); this demonstrates that, even though the relative interannual variability is
small, the variability in terms of absolute mass is very significant for the AIS, obscuring
mass trends.
Estimates of total AIS discharge (D) are available for the years 1992, 1996, 2000, 2003,
2004 and annually since 2006 and include the estimated effect of inland migration of the
grounding line in coastal West Antarctica (Rignot et al. 2011). For the years without
discharge data, a linear interpolation between data points was applied, assuming slowly
changing D. Here, we assume constant discharge between 1989 and 1992. The increase in
discharge is mainly caused by the acceleration of glaciers in coastal West Antarctica,
which still continues (Rignot 2008), and acceleration of glaciers in the Antarctic Peninsula
mainly prior to 2005 (Pritchard and Vaughan 2007). Compared to 1992, discharge from the
AIS has increased by 173 Gt year-1 or 8% in 2009; as a result, MB has been persistently
negative since 1994, except for 3 years with high snowfall (1998, 2001 and 2005).
For the GrIS, reliable SMB time series date back as far as 1958, owing to much better
observational coverage in the northern hemisphere (Ettema et al. 2009). However, reliable
estimates of D are only available for years 1992, 1996, 2000 and annually since 2004
Surv Geophys (2011) 32:495–505 499
123
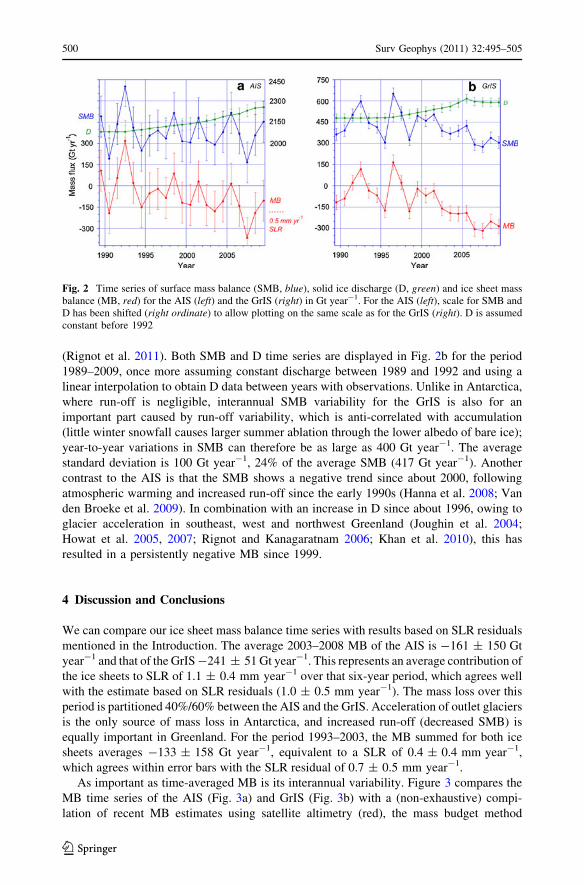
(Rignot et al. 2011). Both SMB and D time series are displayed in Fig. 2b for the period
1989–2009, once more assuming constant discharge between 1989 and 1992 and using a
linear interpolation to obtain D data between years with observations. Unlike in Antarctica,
where run-off is negligible, interannual SMB variability for the GrIS is also for an
important part caused by run-off variability, which is anti-correlated with accumulation
(little winter snowfall causes larger summer ablation through the lower albedo of bare ice);
year-to-year variations in SMB can therefore be as large as 400 Gt year-1. The average
standard deviation is 100 Gt year-1, 24% of the average SMB (417 Gt year-1). Another
contrast to the AIS is that the SMB shows a negative trend since about 2000, following
atmospheric warming and increased run-off since the early 1990s (Hanna et al. 2008; Van
den Broeke et al. 2009). In combination with an increase in D since about 1996, owing to
glacier acceleration in southeast, west and northwest Greenland (Joughin et al. 2004;
Howat et al. 2005, 2007; Rignot and Kanagaratnam 2006; Khan et al. 2010), this has
resulted in a persistently negative MB since 1999.
4 Discussion and Conclusions
We can compare our ice sheet mass balance time series with results based on SLR residuals
mentioned in the Introduction. The average 2003–2008 MB of the AIS is -161 ± 150 Gt
year-1 and that of the GrIS -241 ± 51 Gt year-1. This represents an average contribution of
the ice sheets to SLR of 1.1 ± 0.4 mm year-1 over that six-year period, which agrees well
with the estimate based on SLR residuals (1.0 ± 0.5 mm year-1). The mass loss over this
period is partitioned 40%/60% between the AIS and the GrIS. Acceleration of outlet glaciers
is the only source of mass loss in Antarctica, and increased run-off (decreased SMB) is
equally important in Greenland. For the period 1993–2003, the MB summed for both ice
sheets averages -133 ± 158 Gt year-1, equivalent to a SLR of 0.4 ± 0.4 mm year-1,
which agrees within error bars with the SLR residual of 0.7 ± 0.5 mm year-1.
As important as time-averaged MB is its interannual variability. Figure 3 compares the
MB time series of the AIS (Fig. 3a) and GrIS (Fig. 3b) with a (non-exhaustive) compi-
lation of recent MB estimates using satellite altimetry (red), the mass budget method
Fig. 2 Time series of surface mass balance (SMB, blue), solid ice discharge (D, green) and ice sheet massbalance (MB, red) for the AIS (left) and the GrIS (right) in Gt year-1. For the AIS (left), scale for SMB andD has been shifted (right ordinate) to allow plotting on the same scale as for the GrIS (right). D is assumedconstant before 1992
500 Surv Geophys (2011) 32:495–505
123

(black) and GRACE (green). Until recently, review articles on ice sheet mass balance listed
results of the above methods in a regular table (Rignot and Thomas 2002; Shepherd and
Wingham 2007), but since the launch of GRACE in 2002, the number of mass balance
estimates has grown rapidly. That is why the box plot has taken over as the preferred
method to present estimates of ice sheet mass balance (Cazenave 2006). The box colour
usually denotes the method used; the horizontal dimension covers the time period over
which mass balance has been averaged, and the vertical dimension represents the uncer-
tainty. If two boxes cover the same period but do not vertically overlap, the uncertainty has
obviously been underestimated in one or both studies. The blue boxes represent 1993–2003
estimates as published in IPCC AR4 (Bindoff et al. 2007). Most MB estimates based on
altimetry date from before 2003, and are based on ERS1/2 radar altimetry data, the
exception being recent studies based on laser altimetry from GLAS onboard ICESat
(2003–2009). Gravimetry estimates start in early 2003, following the launch of the
GRACE satellites.
For both ice sheets, the general picture that emerges from the boxes in Fig. 3 is that of
near balance to modest mass losses in the 1990s, increasing to more substantial mass losses
after 2000. Annual MB values from Fig. 2 are plotted as black dashed lines. In general,
these curves nicely connect the various boxes, confirming many of the earlier studies and
partly explaining the differences among studies in terms of interannual MB variability. The
black lines show that MB can vary substantially within a single box, which means that the
choice of the averaging period is critical for the obtained average MB value and is not
necessarily representative for a longer period. The box plot has the undesirable charac-
teristic to hide the interannual variability, providing a too static picture of ice sheet mass
balance. To do justice to the important interannual variability in MB, we suggest either to
Fig. 3 Recent mass balance estimates (Gt year-1) for the AIS (left) and the GrIS (right), based on altimetry(red), GRACE (green) and the mass budget method (black). MB data from Fig. 2 are plotted as blackdashed lines with uncertainty margins. Data sources AIS (left): Wingham et al. (1998); Rignot and Thomas(2002); Davis et al. (2005); Zwally et al. (2005); Velicogna and Wahr (2006b); Ramillien et al. (2006);Wingham et al. (2006); Chen et al. (2006b); Bindoff et al. (2007); Helsen et al. (2008); Rignot et al. (2008b);Chen et al. (2009); Data sources GrIS (right): Krabill et al. (2000); Krabill et al. (2004); Velicogna andWahr (2005); Thomas et al. (2006); Rignot and Kanagaratnam (2006); Ramillien et al. (2006); Chen et al.(2006a); Luthke et al. (2006); Bindoff et al. (2007); Wouters et al. (2008); Rignot et al. (2008a); Cazenaveet al. (2009); Velicogna (2009); Schrama and Wouters (2011)
Surv Geophys (2011) 32:495–505 501
123

calculate averages over a sufficiently long period ([10 years) or, better, to try to present
MB at an annual resolution.
The latter is also the preferred option when closing the sea level budget. For example,
our results show that the combined contribution of the AIS and GrIS to SLR was negative
in 1992 (-1.2 mm) and 1996 (-0.4 mm), while in, e.g., 2007 it was positive and very
large at almost 2 mm. Fig. 4 shows the cumulative contributions of the AIS and GrIS to
SLR since 1989. Although the long-term trend is clearly positive and appears to be
accelerating (Rignot et al. 2011), the year-to-year contributions to cumulative SLR are very
variable. Taking these interannual variations into account will further help to explain and
close the observed rate of global SLR.
Open Access This article is distributed under the terms of the Creative Commons Attribution Noncom-mercial License which permits any noncommercial use, distribution, and reproduction in any medium,provided the original author(s) and source are credited.
References
Arthern RJ, Winebrenner DP, Vaughan DG (2006) Antarctic snow accumulation mapped using polarizationof 4.3-cm wavelength microwave emission. J Geophys Res 111:D06107. doi:10.1029/2004JD005667
Bales RC, Guo Q, Shen D, McConnell JR, Du G, Burkhart JF, Spikes VB, Hanna E, Cappelen J (2009)Annual accumulation for Greenland updated using ice core data developed during 2000–2006 andanalysis of daily coastal meteorological data. J Geophys Res 114:D06116. doi:10.1029/2008JD011208
Bamber JL, Ekholm S, Krabill WB (2001) A new, high-resolution digital elevation model of Greenland fullyvalidated with airborne altimeter data. J Geophys Res 106:6733–6745
Bamber JL, Gomez-Dans JL, Griggs JA (2010) A new 1 km digital elevation model of the Antarctic derivedfrom combined satellite radar and laser data, Part 1: data and methods. The Cryosphere 3:101–111
Bindoff NL, Willebrand J, Artale V, Cazenave A, Gregory JM, Gulev S, Hanawa K, Le Quere KC, LevitusS, Nojiri Y, Shum CK, Talley LD, Unnikrishnan AS (2007) Observations: oceanic climate change and
Fig. 4 Cumulative sea level rise contributions (1989–2009) from the AIS (blue) and the GrIS (green) andtheir sum (red). Dashed lines indicate uncertainty margins
502 Surv Geophys (2011) 32:495–505
123

sea level. In: Solomon S, Qin D, Manning M, Chen Z, Marquis M, Averyt KB, Tignor M, Miller HL(eds) Climate change 2007: the physical science basis. contribution of working group i to the fourthassessment report of the intergovernmental panel on climate change, Cambridge University Press,United Kingdom and New York, USA
Burgess EW, Forster RR, Box JE, Smith LC, Bromwich DH (2010) Greenland ice sheet annually-resolvedaccumulation rates (1958–2007), a spatially calibrated model. J Geophys Res 115:F02004. doi:10.1029/2009JF001293
Cazenave A (2006) How fast are the ice sheets melting? Science 314:1250–1252Cazenave A, Dominh K, Guinehut S, Berthier E, Llovel W, Ramillien G, Ablain M, Larnicol G (2009) Sea
level budget over 2003–2008: a re-evaluation from GRACE space gravimetry, satellite altimetry andArgo. Glob Planet Change 65:83–88. doi:10.1016/j.gloplacha.2008.10.004
Chen JL, Wilson CR, Tapley BD (2006a) Satellite gravity measurements confirm accelerated melting ofGreenland ice sheet. Science 313:1958. doi:10.1126/science.1129007
Chen JL, Wilson CR, Blankenship DD, Tapley BD (2006b) Antarctic mass rates from GRACE. GeophysRes Lett 33:L11502. doi:10.1029/2006GL026369
Chen JL, Wilson CR, Blankenship D, Tapley BD (2009) Accelerated Antarctic ice loss from satellite gravitymeasurements. Nature Geosci 2:859–862
Church JA, Gregory JM, Huybrechts P, Kuhn M, Lambeck K, Nhuan MT, Qin D, Woodworth PL (2001)Changes in sea level. In: Houghton JT, Ding Y, Griggs DJ, Noguer M, Van der Linden PJ, Xiaou D(eds) Climate change 2001: the scientific basis. Cambridge University Press, Cambridge and NewYork, pp 639–694
Davis CH, Li Y, McConnell JR, Frey MM, Hanna E (2005) Snowfall-driven growth in East Antarctic icesheet mitigates recent sea-level rise. Science 308:1898–1901. 10.1126/science.1110662
Ettema J, Van den Broeke MR, van Meijgaard E, van de Berg WJ, Bamber JL, Box JE, Bales RC (2009)Higher surface mass balance of the Greenland ice sheet revealed by high-resolution climate modeling.Geophys Res Lett 36:L12501. doi:10.1029/2009GL038110
Fettweis X (2007) Reconstruction of the 1979–2006 Greenland ice sheet surface mass balance using theregional climate model MAR. The Cryosphere 1:21–40
Hanna E, Huybrechts P, Steffen K, Cappelen J, Huff R, Shuman C, Irvine-Fynn T, Wise S, Griffiths M(2008) Increased runoff from melt from the Greenland ice sheet: a response to global warming.J Climate 21:331–341
Helsen MM, van den Broeke MR, van de Wal RSW, van de Berg WJ, van Meijgaard E, Davis CH, Li Y,Goodwin I (2008) Elevation changes in Antarctica mainly determined by accumulation variability.Science 320:1626–1629. doi: 10.1126/science.1153894, 1626-1629
Howat IM, Joughin I, Tulaczyk S, Gogineni S (2005) Rapid retreat and acceleration of Helheim Glacier, eastGreenland. Geophys Res Lett 32:L22502. doi:10.1029/2005GL024737
Howat IM, Joughin I, Scambos T (2007) Rapid changes in ice discharge from Greenland outlet glaciers.Science 315:1559. doi:10.1126/science.1138478
Joughin I, Abdalati W, Fahnestock M (2004) Large fluctuations in speed on Greenland’s Jakobshavn Isbraeglacier. Nature 432:608–610
Khan SA, Wahr J, Bevis M, Velicogna I, Kendrick E (2010) Spread of ice mass loss into northwestGreenland observed by GRACE and GPS. Geophys Res Lett 37:L06501. doi:10.1029/2010GL042460.10
Krabill W, Abdalati W, Frederick E, Manizade S, Martin C, Sonntag J, Swift R, Thomas R, Wright W,Yungel J (2000) Greenland ice sheet: high-elevation balance and peripheral thinning. Science289:428–429
Krabill W, Hanna E, Huybrechts P, Abdalati W, Cappelen J, Csatho B, Frederick E, Manizade S, Martin C,Sonntag J, Swift R, Thomas R, Yungel J (2004) Greenland ice sheet: increased coastal thinning.Geophys Res Lett 31:L24402. doi:10.1029/2004GL021533
Lemke P, Ren J, Alley RB, Allison I, Carrasco J, Flato G, Fujii Y, Kaser G, Mote P, Thomas RH, Zhang T(2007) Observations: changes in snow, ice and frozen ground. In: Solomon S, Qin D, Manning M,Chen Z, Marquis M, Averyt KB, Tignor M, Miller HL (eds) Climate change 2007: the physical sciencebasis. contribution of working group i to the fourth assessment report of the intergovernmental panel onclimate change, Cambridge University Press, United Kingdom and New York, USA
Lenaerts JTM, van den Broeke MR, Dery SJ, Konig-Langlo G, Ettema J, Kuipers Munneke P (2010)Modelling snowdrift sublimation on an Antarctic ice shelf. The Cryosphere 4:179–190
Luthke S, Zwally H, Abdalati W, Rowlands D, Ray R, Nerem R, Lemoine F, McCarthy J, Chinn D (2006)Recent Greenland mass loss by drainage system from satellite gravity observations. Science314:1286–1289
Surv Geophys (2011) 32:495–505 503
123

McConnell JR, Arthern RJ, Mosley-Thompson E, Davis CH, Bales RC, Thomas R, Burkhart JF, Kyne JD(2000) Changes in Greenland ice sheet elevation attributed primarily to snow accumulation variability.Nature 406:877–879
Meier MF, Dyurgerov MB, Rick UK, O’Neel S, Pfeffer WT, Anderson RS, Anderson SP, Glazovsky AF(2007) Glaciers dominate eustatic sea-level rise in the twentyfirst century. Science 317:1064–1067
Monaghan AJ, Bromwich DH, Fogt RL, Wang S-H, Mayewski PA, Dixon DA, Ekaykin A, Frezzotti M,Goodwin I, Isaksson E, Kaspari SD, Morgan VI, Oerter H, Van Ommen TD, Van der Veen CJ, Wen J(2006) Insignificant change in Antarctic snowfall since the international geophysical year. Science313:827–831
Nicholls RJ, Cazenave A (2010) Sea-level rise and its impact on coastal zones. Science 328:1517–1520Pritchard HD, Vaughan DG (2007) Widespread acceleration of tidewater glaciers on the Antarctic Penin-
sula. J Geophys Res 112:F03S29. doi:10.1029/2006JF000597Pritchard HD, Arthern RJ, Vaughan DG, Edwards LA (2009) Extensive dynamic thinning on the margins of
the Greenland and Antarctic ice sheets. Nature 461:971–975Ramillien G, Lombard A, Cazenave A, Ivins ER, Llubes M, Remy F, Biancale R (2006) Interannual
variations of the mass balance of the Antarctica and Greenland ice sheets from GRACE. Global PlanetChange 53:198–208
Rignot E (2008) Changes in West Antarctic ice stream dynamics observed with ALOS PALSAR data.Geophys Res Lett 35:L12505. doi:10.1029/2008GL033365
Rignot E, Kanagaratnam P (2006) Changes in the velocity structure of the Greenland ice sheet. Science311:986–990
Rignot E, Thomas RH (2002) Mass balance of Polar ice sheets. Science 297:1502–1506Rignot E, Box JE, Burgess E, Hanna E (2008a) Mass balance of the Greenland ice sheet from 1958 to 2007.
Geophys Res Lett 35:L20502. doi:10.1029/2008GL035417Rignot E, Bamber JL, van den Broeke MR, Davis C, Li Y, van de Berg WJ, van Meijgaard E (2008b) Recent
Antarctic mass loss from radar interferometry and regional climate modeling. Nature Geosci2:106–110
Rignot E, Velicogna I, van den Broeke MR, Monaghan A, Lenaerts J (2011) Acceleration of the contributionof the Greenland and Antarctic ice sheets to sea level rise. Geophys Res Lett 38:L05503. doi:10.1029/2011GL046583
Riva REM, Gunter BC, Urban TJ, Vermeersen BLA, Lindenbergh RC, Helsen MM, Bamber JL, van de WalRSW, van den Broeke MR, Schutz BE (2009) Glacial isostatic adjustment over Antarctica fromcombined ICESat and GRACE satellite data. Earth Planet Sci Lett 288:516–523
Schrama EJO, Wouters B (2011) Revisiting Greenland ice sheet mass loss observed by GRACE. J GeophysRes 116:B02407. doi:10.1029/2009JB006847
Shepherd A, Wingham D (2007) Recent sea-level contributions of the Antarctic and Greenland ice sheets.Science 315:1529–1532
Thomas R, Frederick E, Krabill W, Manizade S, Martin C (2006) Progressive increase in ice loss fromGreenland, Geophys Res Lett, L10503
Thomas R, Davis C, Frederick E, Krabill W, Li Y, Manizade S, Martin C (2008) A comparison of Greenlandice-sheet volume changes derived from altimetry measurements. J Glaciol 54: 203-212. 11
Van de Berg WJ, van den Broeke MR, Reijmer CH, van Meijgaard E (2005) Characteristics of the Antarcticsurface mass balance, 1958–2002, using a regional atmospheric climate model. Ann Glaciol 41:97–104
Van den Broeke MR (2008) Depth and density of the Antarctic firn layer. Arct Antarct Alp Res 40:432–438Van den Broeke MR, van de Berg WJ, van Meijgaard E (2006a) Snowfall in coastal West Antarctica much
greater than previously assumed. Geophys Res Lett 33:L02505. doi:10.1029/2005GL025239Van den Broeke MR, van de Berg WJ, van Meijgaard E, Reijmer CH (2006b) Identification of Antarctic
ablation areas using a regional atmospheric climate model. J Geophys Res 111:D18110. doi:10.1029/2006JD007127
Van den Broeke MR, van de Berg WJ, van Meijgaard E (2008) Firn depth correction along the Antarcticgrounding line. Antarctic Sci 20:513–517. doi: 10.1017/S095410200800148X
Van den Broeke MR, Bamber J, Ettema J, Rignot E, Schrama E, van de Berg WJ, van Meijgaard E,Velicogna I, Wouters B (2009) Partitioning recent Greenland mass loss. Science 326:984–986
Van de Berg WJ, van Den Broeke MR, van Meijgaard E (2006b) Reassessment of the Antarctic surfacemass balance using calibrated output of a regional atmospheric climate model. J Geophys Res111:D11104. doi:10.1029/2005JD006495
Velicogna I (2009) Increasing rates of ice mass loss from the Greenland and Antarctic ice sheets revealed byGRACE. Geophys Res Lett 36:L19503. doi:10.1029/2009GL040222
Velicogna I, Wahr J (2005) Greenland mass balance from GRACE. Geophys Res Lett 32(18):L18505. doi:10.1029/2005GL023955
504 Surv Geophys (2011) 32:495–505
123

Velicogna I, Wahr J (2006a) Acceleration of Greenland ice mass loss in spring 2004. Nature 443:329–331Velicogna I, Wahr J (2006b) Measurements of time-variable gravity show mass loss in Antarctica. Science
311:1754. doi:10.1126/science.1123785Willis JK, Chambers DP, Nerem RS (2008) Assessing the globally averaged sea level budget on seasonal to
interannual timescales. J Geophys Res 113:C06015. doi:10.1029/2007JC004517Wingham DJ, Ridout AJ, Scharroo R, Arthern RJ, Shum CK (1998) Antarctic elevation change from 1992 to
1996. Science 282:456. doi:10.1126/science.282.5388.456Wingham DJ, Shepherd A, Muir A, Marshall GJ (2006) Mass balance of the Antarctic ice sheet. Phil Trans
R Soc A 364:1627–1635. doi:10.1098/rsta.2006.1792Wouters B, Chambers D, Schrama EJO (2008) GRACE observes small scale mass loss in Greenland.
Geophys Res Lett 35:L20501. doi:10.1029/2008GL034816Zwally HJ, Giovinetto MB, Li J, Cornejo HG, Beckley MA, Brenner AC, Saba JL, Yi D (2005) Mass
changes of the Greenland and Antarctic ice sheets and shelves and contributions to sea-level rise:1992–2002. J Glaciol 51:509–527
Surv Geophys (2011) 32:495–505 505
123