idaho mathematics content standards draft
TRANSCRIPT

IDAHO STATE DEPARTMENT OF EDUCATION CONTENT AND CURRICULUM| MATHEMATICS
650 W STATE STREET, 2ND FLOOR BOISE, IDAHO 83702
208 332 6800 OFFICE WWW.SDE.IDAHO.GOV
Idaho Content Standards Mathematics
January 3, 2022

CREATED 12/02/2021 DRAFT 7 – Idaho Content Standards/ Mathematics / SDE / 2
In March of 2020, the Idaho Legislature directed the State Board of Education to replace the present Idaho Content Standards in Mathematics. They wanted standards which work for students, parents, and educators. Specifically, the legislators asked that new standards address the following issues in mathematics:
a. Explicitly state grade levels at which students should demonstrate mastery of addition, subtraction, multiplication, and division facts. Integrate these basics with critical thinking and real-life problem solving throughout the standards to ensure more connections to science, business, and other related disciplines.
b. Reduce the number of standards, use less complex verbiage, and prioritize the more important concepts without marginalizing the accuracy of the standards.
c. Ensure the standards are age and grade level-appropriate especially in the early grades, emphasizing the concrete nature of young minds.
d. Make certain that standards requiring problem solving are age appropriate and do not exceed the knowledge standards accepted for each grade level.
The Superintendent’s Office of Public Instruction worked with a variety of stakeholders to accept nominations for working group members. The working group was comprised of twenty-four members representing a cross-section of grade levels and roles. These committees included community members, mathematics consultants, and mathematics educators across all grade levels from kindergarten to four-year colleges. The time and effort they put into this revision was invaluable. Throughout the process of the revision of the standards, the working group received public comments that the revision committees took into consideration. The working group appreciates those who took time to share their thoughts on the revisions. We hope that the changes to these standards allow them to be useful for all stakeholders, including educators, families, students, and community members. We hope that they bring Idaho into a new chapter of statewide success in mathematics.
Respectfully submitted by,
The Mathematics Standards Working Group Members
Adam Uptmor, Administrator Corey Friis, Teacher Jordan Hagen, Teacher Kacey Diemert, Higher Education Melanie Blad, Teacher Sen. David Lent, Legislator Brandi Griggs, Community Member
Erin Corwine, Teacher Justin Pickens, Teacher Kelli Rich, Teacher Kathryn Atkinson, Teacher Kenn Roberts, Community Member Katie Bösch-Wilson, Teacher Michele Carney, Higher Education
Rep. Ryan Kerby, Legislator Ann Abbott, Higher Education Hem Acharya, Teacher Shannon Murray, Higher Education Sen. Janie Ward-Engelking, Legislator Levi Jaynes, Administrator Cathy Carson, Higher Education

CREATED 12/02/2021 DRAFT 7 – Idaho Content Standards/ Mathematics / SDE / 3
TABLE OF CONTENTS
Preamble .............................................................................................................................. 8
Focus............................................................................................................................................ 8
Coherence ................................................................................................................................... 8
Rigor ............................................................................................................................................ 8
A Special Note about Procedural Skill and Fluency ..................................................................... 9
What the Idaho Content Standards in Mathematics Do ........................................................... 10
Organization of the Kindergarten to Grade Eight Content Standards .................................... 11
Format for Each Grade Level ..................................................................................................... 12
Standards Identifiers/Coding .................................................................................................... 12
Kindergarten ....................................................................................................................... 13
Kindergarten Overview ............................................................................................................. 15
Kindergarten Standards for Mathematical Practice ................................................................. 16
Counting and Cardinality – K.CC ................................................................................................ 19
Operations and Algebraic Thinking – K.OA ............................................................................... 19
Number and Operations in Base Ten – K.NBT .......................................................................... 20
Measurement and Data – K.MD ............................................................................................... 20
Geometry – K.G ......................................................................................................................... 21
First Grade .......................................................................................................................... 22
First Grade Overview ................................................................................................................. 24
First Grade Standards for Mathematical Practice ..................................................................... 25
Operations and Algebraic Thinking – 1.OA ............................................................................... 28
Number and Operations in Base Ten – 1.NBT .......................................................................... 29
Measurement and Data – 1.MD ................................................................................................ 30
Geometry – 1.G ......................................................................................................................... 31
Second Grade ...................................................................................................................... 32
Focus in the Standards .............................................................................................................. 32
Second Grade Overview ............................................................................................................ 34

CREATED 12/02/2021 DRAFT 7 – Idaho Content Standards/ Mathematics / SDE / 4
Second Grade Standards for Mathematical Practice ................................................................ 35
Operations and Algebraic Thinking – 2.OA ............................................................................... 38
Number and Operations in Base Ten – 2.NBT .......................................................................... 38
Measurement and Data – 2.MD ................................................................................................ 40
Geometry – 2.G ......................................................................................................................... 41
Third Grade ......................................................................................................................... 42
Third Grade Overview ............................................................................................................... 44
Third Grade Standards for Mathematical Practice ................................................................... 46
Operations and Algebraic Thinking – 3.OA ............................................................................... 49
Number and Operations in Base Ten – 3.NBT .......................................................................... 50
Number and Operations – Fractions – 3.NF.............................................................................. 50
Measurement and Data – 3.MD ................................................................................................ 51
Geometry – 3.G ......................................................................................................................... 53
Fourth Grade ....................................................................................................................... 54
Fourth Grade Overview ............................................................................................................. 56
Fourth Grade Standards for Mathematical Practice ................................................................. 58
Operations and Algebraic Thinking – 4.OA ............................................................................... 61
Number and Operations in Base Ten – 4.NBT .......................................................................... 62
Number and Operations – Fractions – 4.NF .............................................................................. 63
Measurement and Data – 4.MD ................................................................................................ 65
Geometry – 4.G ......................................................................................................................... 66
Fifth Grade .......................................................................................................................... 68
Fifth Grade Overview ................................................................................................................ 70
Fifth Grade Standards for Mathematical Practice .................................................................... 71
Operations and Algebraic Thinking – 5.OA ............................................................................... 73
Number and Operations in Base Ten – 5.NBT .......................................................................... 73
Number and Operations – Fractions – 5.NF.............................................................................. 75
Measurement and Data – 5.MD ................................................................................................ 77

CREATED 12/02/2021 DRAFT 7 – Idaho Content Standards/ Mathematics / SDE / 5
Geometry – 5.G ......................................................................................................................... 78
Sixth Grade ......................................................................................................................... 80
Sixth Grade Overview ................................................................................................................ 82
Sixth Grade Standards for Mathematical Practice .................................................................... 83
Ratios and Proportional Relationships – 6.RP ........................................................................... 86
The Number System – 6.NS ....................................................................................................... 87
Expressions and Equations – 6.EE ............................................................................................. 89
Geometry – 6.G ......................................................................................................................... 91
Statistics and Probability – 6.SP ................................................................................................ 92
Seventh Grade ..................................................................................................................... 94
Seventh Grade Overview........................................................................................................... 96
Seventh Grade Standards for Mathematical Practice ............................................................... 97
Ratios and Proportional Relationships – 7.RP ......................................................................... 100
The Number System – 7.NS ..................................................................................................... 100
Expressions and Equations – 7.EE ........................................................................................... 102
Geometry – 7.G ....................................................................................................................... 103
Statistics and Probability – 7.SP .............................................................................................. 104
Eighth Grade ..................................................................................................................... 107
Eighth Grade Overview ........................................................................................................... 109
Eighth Grade Standards for Mathematical Practice ............................................................... 110
The Number System – 8.NS ..................................................................................................... 112
Expressions and Equations – 8.EE ........................................................................................... 112
Functions – 8.F ........................................................................................................................ 114
Geometry – 8.G ....................................................................................................................... 115
Statistics and Probability – 8.SP .............................................................................................. 116
Grades 9 – 12 Content Standards by Conceptual Categories ............................................... 117
Content Standards by Conceptual Category Identifiers/Coding ............................................. 117
Grades 9 – 12 Standards for Mathematical Practice .............................................................. 119

CREATED 12/02/2021 DRAFT 7 – Idaho Content Standards/ Mathematics / SDE / 6
Grades 9 – 12 Number and Quantity (N) ................................................................................ 121
Grades 9 – 12 Number and Quantity Overview ...................................................................... 123
The Real Number System - N.RN ............................................................................................. 124
Quantities – N.Q ...................................................................................................................... 124
The Complex Number System – N.CN ..................................................................................... 124
Vector and Matrix Quantities – N.VM..................................................................................... 125
Grades 9 – 12 Algebra (A)........................................................................................................ 128
Grades 9 – 12 Algebra Overview ............................................................................................. 130
Seeing Structure in Expressions – A.SSE ................................................................................. 131
Arithmetic with Polynomials and Rational Expressions – A.APR ............................................ 131
Creating Equations – A.CED .................................................................................................... 132
Reasoning with Equations and Inequalities – A.REI ................................................................ 133
Grades 9 – 12 Functions (F) ..................................................................................................... 136
Grades 9 – 12 Functions Overview .......................................................................................... 138
Interpreting Functions – F.IF ................................................................................................... 139
Building Functions – F.BF ........................................................................................................ 141
Linear, Quadratic, and Exponential Models – F.LE ................................................................. 142
Trigonometric Functions – F.TF ............................................................................................... 143
Grades 9 – 12 Modeling (★).................................................................................................... 145
Grades 9 – 12 Geometry (G) ................................................................................................... 148
Grades 9 – 12 Geometry Overview ......................................................................................... 150
Congruence – G.CO ................................................................................................................. 151
Similarity, Right Triangles, and Trigonometry – G.SRT ........................................................... 152
Circles – G.C ............................................................................................................................. 154
Expressing Geometric Properties with Equations – G.GPE ..................................................... 154
Geometric Measurement and Dimension – G.GMD ............................................................... 155
Modeling with Geometry – G.MG ........................................................................................... 155
Grades 9 – 12 Statistics and Probability (S)............................................................................. 157

CREATED 12/02/2021 DRAFT 7 – Idaho Content Standards/ Mathematics / SDE / 7
Grades 9 – 12 Statistics and Probability Overview ................................................................. 159
Interpreting Categorical and Quantitative Data – S.ID ........................................................... 160
Making Inferences and Justifying Conclusions – S.IC .............................................................. 161
Conditional Probability and the Rules of Probability – S.CP ................................................... 162
Using Probability to Make Decisions – S.MD .......................................................................... 163
References ........................................................................................................................ 165

CREATED 12/02/2021 DRAFT 7 – Idaho Content Standards/ Mathematics / SDE / 8
PREAMBLE
Focus In the past, mathematics standards and curricula were often criticized for covering too much content in each grade level. This created a “shallow” understanding of important math concepts as students moved through the grade levels. The Idaho Content Standards for Mathematics address this by concentrating on major and age-appropriate topics in each grade to allow students to focus their learning at a greater depth.
Coherence Explicit connections of mathematics topics within each grade level and across grade levels results in coherence. Most of these connections happen across grade levels, as the standards support a progression of increasing knowledge and skills.
Thinking across grades: The design of the Idaho Content Standards for Mathematics allows administrators and teachers to connect learning within and across grades. For example, the standards develop fractions and multiplication across elementary grade levels, so that students can build new understanding on foundations that were established in previous years. These topics directly connect to learning in the middle and high school grades as students deepen their knowledge of rational numbers and algebra concepts. Therefore, each standard builds on previous learning and is not a completely new topic.
Linking to major topics: Topics within a grade level are identified as major, additional, or supporting. This can be seen in each grade level overview. This identification allows teachers to make connections between the additional and supporting topics and the major topics. For example, in grade three, bar graphs are not taught in isolation from other topics. Rather, students use information presented in bar graphs to solve problems using the four operations of arithmetic. Each grade level overview shows the major, supporting, and additional topics.
Rigor Rigorous teaching in mathematics is more than increasing the difficulty or complexity of tasks. Incorporating rigor into classroom instruction and student learning means exploring at a greater depth the standards and ideas with which students are grappling. There are three components of rigor, and each is equally important to student mastery: Conceptual Understanding, Procedural Skill and Fluency, and Application.
CREATED 12/02/2021 DRAFT 7 – Idaho Content Standards/ Mathematics / SDE / 9
Conceptual Understanding refers to understanding mathematical concepts, operations, and relations. It is more than knowing isolated facts and methods. Students should be able to understand why a mathematical idea is important and the contexts in which it is useful. Conceptual understanding allows students to connect prior knowledge to new ideas and concepts.
Procedural Skill and Fluency is the ability to apply procedures accurately, efficiently, and flexibly while giving students opportunities to practice basic skills. Students’ ability to solve more complex application tasks is dependent on procedural skill and fluency.
Application provides valuable context for learning and the opportunity to solve problems in a relevant and meaningful way. Through real-world application, students learn to select an efficient method to find a solution, determine whether the solution makes sense by reasoning, and develop critical thinking skills. This may take the form of a word problem or other contextually related problem.
A Special Note about Procedural Skill and Fluency Number sense is a fundamental bridge to algebraic thinking for middle and high school mathematics. As students increase their number sense, they see relationships between numbers, think flexibly, and recognize emerging patterns. They make reasonable estimates, compute fluently, and use visual models to apply procedures for solving problems based on the particular numbers involved. In short, “number sense reflects a deep understanding of mathematics, but it comes about through a mathematical mindset that is focused on making sense of numbers and quantities” (Boaler, 2016, p. 36). While speed is a component of fluency, it is not the only indicator that a student is fluent; rather, fluency can be observed by watching how the student engages with a particular problem. Furthermore, fluency does not require the most efficient strategy. The standards specify grade level appropriate strategies or types of strategies with which students should demonstrate fluency (e.g., 1.OA.C.6 allows students to use strategies such as counting on, making ten, and creating equivalent but easier or known sums). It should also be noted that teachers should expect some procedures to take longer than others (e.g., fluency with the standard algorithm for division, 6.NS.B.2, as compared to fluently adding and subtracting within ten, 1.OA.C.6). Students with a strong number sense develop foundational skills which transfer to nearly all mathematical domains, from measurement and geometry to data and equations. Students continue to strengthen their number sense when they communicate ideas, explain their reasoning, and discuss the thinking of others. Discussing mathematical thinking with peers gives each student the opportunity to internalize a cohesive structure for numbers.
CREATED 12/02/2021 DRAFT 7 – Idaho Content Standards/ Mathematics / SDE / 10
What the Idaho Content Standards in Mathematics Do The standards define what all students are expected to know and be able to do, not how teachers should teach. While the standards focus on what is most essential, they do not describe all that can or should be taught. A great deal is left to the discretion of local school districts, teachers, and curriculum developers. No set of grade-level standards can reflect the great variety of abilities, needs, learning rates, and achievement levels in any given classroom. The standards define neither the support materials that some students may need, nor the advanced materials that others may need access to. It is also beyond the scope of the standards to define the full range of support appropriate for English learners and for students with disabilities. All students must have the opportunity to learn rigorous grade level standards if they are to access the knowledge and skills that will be necessary in their post-high-school lives.
Standards vs. Curriculum
No specific curriculum or strategies are required by the State of Idaho to be used to teach the Idaho Content Standards in Mathematics. Local schools and districts make decisions about what resources will be used to teach the standards.

CREATED 12/02/2021 DRAFT 7 – Idaho Content Standards/ Mathematics / SDE / 11
ORGANIZATION OF THE KINDERGARTEN TO GRADE EIGHT CONTENT STANDARDS
The kindergarten through grade eight content standards in this Framework are organized by grade level. Within each grade level, standards are grouped first by domain. Each domain is further subdivided into clusters of related standards.
• Standards define what students should understand and be able to do. • Clusters are groups of related standards. Note that standards from different clusters
may sometimes be closely related, because mathematics is a connected subject. • Domains are larger groups of related standards. Standards from different domains may
sometimes be closely related. The table below shows which domains are addressed at each grade level:
Progression of K–8 Domains
Grade Level Domain K 1 2 3 4 5 6 7 8
Counting and Cardinality x No data
No data
No data
No data
No data
No data
No data
No data
Operations and Algebraic Thinking x x x x x x No data
No data
No data
Number and Operations in Base Ten x x x x x x No data
No data
No data
Number and Operations – Fractions No data
No data
No data x x x No
data No data
No data
The Number System No data
No data
No data
No data
No data
No data x x x
Ratios and Proportional Relationships No data
No data
No data
No data
No data
No data x x No
data Expressions and Equations No
data No data
No data
No data
No data
No data x x x
Functions No data
No data
No data
No data
No data
No data
No data
No data x
Measurement and Data x x x x x x No data
No data
No data
Geometry x x x x x x x x x
Statistics and Probability No data
No data
No data
No data
No data
No data x x x

CREATED 12/02/2021 DRAFT 7 – Idaho Content Standards/ Mathematics / SDE / 12
Format for Each Grade Level Each grade level is presented in the same format:
• An introduction and description of the focus areas for learning at that grade. • An overview of that grade’s domains and clusters. • The grade-level Standards for Mathematical Practice. • The content standards for that grade (presented by domain, cluster heading, and
individual standard). Standards Identifiers/Coding Each standard has a unique identifier that consists of the grade level (K, 1, 2, 3, 4, 5, 6, 7, or 8), the domain code, cluster code, and the standard number, as shown in the example below. The cluster heading also includes a shape () to describe its focus in relation to the other clusters within the grade level.
The standard highlighted above is identified as 1.G.A.1, identifying it as a grade one (1.) standard in the Geometry domain (G.), and as the first standard in that cluster (A.1). All of the standards use a common coding system.
CREATED 12/02/2021 DRAFT 7 – Idaho Content Standards/ Mathematics / SDE / 13
KINDERGARTEN
In kindergarten, instruction should focus on the following: (1) representing, relating, and operating on whole numbers, initially with sets of objects; and (2) describing shapes and space. More learning time in kindergarten should be devoted to number than to other topics.
1. Students use numbers, including written numerals, to represent quantities and to solve quantitative problems, such as counting objects in a set; counting out a given number of objects; comparing sets or numerals; and modeling simple joining and separating situations with sets of objects, or eventually with equations, such as 5 + 2 = 7 and 7– 2 = 5. (Kindergarten students should see addition and subtraction equations, and student writing of equations in kindergarten is encouraged, but it is not required.) Students choose, combine, and apply effective strategies for answering quantitative questions, including quickly recognizing the cardinalities of small sets of objects, counting and producing sets of given sizes, counting the number of objects in combined sets, or counting the number of objects that remain in a set after some are taken away.
2. Students describe their physical world using geometric ideas (e.g., shape, orientation, spatial relations) and vocabulary. They identify, name, and describe basic two-dimensional shapes, such as squares, triangles, circles, rectangles, and hexagons, presented in a variety of ways (e.g., with different sizes and orientations), as well as three-dimensional shapes, such as cubes, cones, cylinders, and spheres. They use basic shapes and spatial reasoning to model objects in their environment and to construct more complex shapes.
Focus in the Standards
Not all content in a given grade is emphasized equally in the standards. Some clusters require greater emphasis than others based on the depth of the ideas, the time that they take to master, and/or their importance to future mathematics or the demands of college and career readiness. More time in these areas is also necessary for students to meet the Idaho Standards for Mathematical Practice. To say that some things have greater emphasis is not to say that anything in the standards can safely be neglected in instruction. Neglecting material will leave gaps in student skill and understanding and may leave students unprepared for the challenges of a later grade. Students should spend the large majority of their time on the major work of the grade (). Supporting work () and, where appropriate, additional work () can engage students in the major work of the grade.
Geometric and Spatial Thinking
CREATED 12/02/2021 DRAFT 7 – Idaho Content Standards/ Mathematics / SDE / 14
Geometric and spatial thinking are important in and of themselves, because they connect mathematics with the physical world and play an important role in modeling occurrences whose origins are not necessarily physical; for example, as networks or graphs. They are also important because they support the development of number and arithmetic concepts and skills. Thus, geometry is essential for all grade levels for many reasons: its mathematical content; its roles in physical sciences, engineering, and many other subjects; and its strong aesthetic connections.

CREATED 12/02/2021 DRAFT 7 – Idaho Content Standards/ Mathematics / SDE / 15
Kindergarten Overview
Counting and Cardinality
A. Know number names and the count sequence. B. Count to tell the number of objects. C. Compare numbers.
Operations and Algebraic Thinking
A. Understand addition as putting together and adding to, and understand subtraction as taking apart and taking from.
Number and Operations in Base Ten
A. Work with numbers 11 – 19 to gain foundations for place value.
Measurement and Data
A. Describe and compare measurable attributes. B. Classify objects and count the number of objects in each category.
Geometry
A. Identify and describe shapes (squares, circles, triangles, rectangles, hexagons, cubes, cones, cylinders, and spheres). B. Analyze, compare, create, and compose shapes.
Mastery Standards
Mastery standards describe those standards that ask students to be able to perform mathematical calculations accurately, efficiently, and flexibly. For standards related to knowing single-digit facts from memory, this typically involves generating a response within three to five seconds. For kindergarten this standard is:
• K.OA.A.5 Fluently add and subtract within five, including zero.
Standards for Mathematical Practice
1. Make sense of problems and persevere in solving them.
2. Reason abstractly and quantitatively.
3. Construct viable arguments and critique the reasoning of others.
4. Model with mathematics. 5. Use appropriate tools
strategically. 6. Attend to precision. 7. Look for and make use of
structure. 8. Look for and express regularity
in repeated reasoning.
CREATED 12/02/2021 DRAFT 7 – Idaho Content Standards/ Mathematics / SDE / 16
Kindergarten Standards for Mathematical Practice The Standards for Mathematical Practice complement the content standards so that students increasingly engage with the subject matter as they grow in mathematical maturity and expertise throughout the K – 12 education years.
MP.1 Make sense of problems and persevere in solving them. In kindergarten, students begin to build the understanding that doing mathematics involves solving problems and discussing how they solved them. Students explain to themselves the meaning of a problem and look for ways to solve it. Real-life experiences should be used to support students’ ability to connect mathematics to the world. To help students connect the language of mathematics to everyday life, ask students questions such as “How many students are absent?” or have them gather enough blocks for the students at their table. Younger students may use concrete objects or pictures to help them conceptualize and solve problems. They may check their thinking by asking themselves, “Does this make sense?” or they may try another strategy.
MP.2 Reason abstractly and quantitatively. Younger students begin to recognize that a number represents a specific quantity. Then, they connect the quantity to written symbols. Quantitative reasoning entails creating a representation of a problem while attending to the meanings of the quantities. For example, a student may write the numeral 11 to represent an amount of objects counted, select the correct number card 17 to follow 16 on a calendar, or build two piles of counters to compare the numbers 5 and 8. In addition, kindergarten students begin to draw pictures, manipulate objects, or use diagrams or charts to express quantitative ideas. Students need to be encouraged to answer questions such as “How do you know?”, which reinforces their reasoning and understanding and helps students develop mathematical language.
MP.3 Construct viable arguments and critique the reasoning of others. Younger students construct arguments using concrete referents, such as objects, pictures, drawings, and actions. They also begin to develop their mathematical communication skills as they participate in mathematical discussions involving questions like “How did you get that?” and “Why is that true?” They explain their thinking to others and respond to others’ thinking. They begin to develop the ability to reason and analyze situations as they consider questions such as “Are you sure that ___?”, “Do you think that would happen all the time?”, and “I wonder why ___?”
MP.4 Model with mathematics. In early grades, students experiment with representing problem situations in multiple ways, including numbers, words (mathematical language), drawing pictures, using objects, acting

CREATED 12/02/2021 DRAFT 7 – Idaho Content Standards/ Mathematics / SDE / 17
out, making a chart or list, or creating equations. Students need opportunities to connect the different representations and explain the connections. They should be able to use all of these representations as needed. For example, a student may use cubes or tiles to show the different number pairs for five, or place three objects on a ten-frame and then determine how many more are needed to “make a ten.” Students rely on manipulatives (or other visual and concrete representations) while solving tasks and record an answer with a drawing or equation.
MP.5 Use appropriate tools strategically. Younger students begin to consider the available tools (including estimation) when solving a mathematical problem and decide when certain tools might be helpful. For instance, kindergarteners may decide that it might be advantageous to use linking cubes to represent two quantities and then compare the two representations side-by-side, or later, make math drawings of the quantities. Students decide which tools may be helpful to use depending on the problem or task and explain why they use particular mathematical tools.
MP.6 Attend to precision. Kindergarten students begin to develop precise communication skills, calculations, and measurements. Students describe their own actions, strategies, and reasoning using grade level appropriate vocabulary. Opportunities to work with pictorial representations and concrete objects can help students develop understanding and descriptive vocabulary. For example, students describe and compare two- and three-dimensional shapes and sort objects based on appearance. While measuring objects iteratively (repetitively), students check to make sure that there are no gaps or overlaps. During tasks involving number sense, students check their work to ensure the accuracy and reasonableness of solutions. Students should be encouraged to answer questions such as “How do you know your answer is reasonable?”
MP.7 Look for and make use of structure. Younger students begin to discern a pattern or structure in the number system. For instance, students recognize that 3 + 2 = 5 and 2 + 3 = 5. Students use counting strategies, such as counting on, counting all, or taking away, to build fluency with facts to five. Students notice the written pattern in the “teen” numbers—that the numbers start with one (representing one ten) and end with the number of additional ones. Teachers might ask, “What do you notice when ___?”
MP.8 Look for and express regularity in repeated reasoning. In the early grades, students notice repetitive actions in counting, computations, and mathematical tasks. For example, the next number in a counting sequence is one more when counting by ones and ten more when counting by tens (or one more group of ten). Students should be encouraged to answer questions such as “What would happen if ___?” and “There are eight crayons in the box. Some are red and some are blue. How many of each could

CREATED 12/02/2021 DRAFT 7 – Idaho Content Standards/ Mathematics / SDE / 18
there be?” Kindergarten students realize eight crayons could include four of each color (8 =4 + 4), five of one color and three of another (8 = 5 + 3), and so on. For each solution, students repeatedly engage in the process of finding two numbers to join together to equal eight.

CREATED 12/02/2021 DRAFT 7 – Idaho Content Standards/ Mathematics / SDE / 19
Counting and Cardinality – K.CC K.CC.A. Know number names and the count sequence.
1. Count to 100 by ones and by tens.
2. Starting at a given number, count forward within 100 and backward within 20.
3. Write numbers from 0 to 20. Represent a number of objects with a written numeral 0–20 (with 0 representing a count of no objects).
K.CC.B. Count to tell the number of objects.
4. Understand the relationship between numbers and quantities; connect counting to cardinality.
a. When counting objects, say the number names in the standard order, pairing each object with one and only one number name and each number name with one and only one object.
b. Understand that the last number name said tells the number of objects counted. The number of objects is the same regardless of their arrangement or the order in which they were counted.
c. Understand that each successive number name refers to a quantity that is one larger. Recognize the “one more” pattern of counting using objects.
5. Given a group of up to 20 objects, count the number of objects in that group and state the number of objects in a rearrangement of that group without recounting. Given a verbal or written number from zero to 20, count out that many objects.
Clarification: Objects can be arranged in a line, a rectangular array, or a circle. For as many as ten objects, they may be arranged in a scattered configuration.
K.CC.C. Compare numbers.
6. Identify whether the number of objects in one group is greater than, less than, or equal to the number of objects in another group for groups with up to ten objects.
7. Compare two numbers between one and ten presented as written numerals.
Operations and Algebraic Thinking – K.OA K.OA.A. Understand addition as putting together and adding to, and understand subtraction as taking apart and taking from.
CREATED 12/02/2021 DRAFT 7 – Idaho Content Standards/ Mathematics / SDE / 20
1. Represent addition and subtraction of two whole numbers within ten. Use objects, fingers, mental images, drawings, sounds (e.g., claps), acting out situations, verbal explanations, expressions, or equations.
2. Solve addition and subtraction word problems within ten by using physical, visual, and symbolic representations.
Clarification: Students are not expected to independently read word problems.
3. Decompose whole numbers from one to ten into pairs in more than one way by using physical, visual, or symbolic representations.
Example: Decomposing 5 may include 5 = 2 + 3 and 5 = 4 + 1.
4. For a given whole number from one to nine, find the number that makes ten when added to the number by using physical, visual, or symbolic representations.
5. Fluently add and subtract within five, including zero.
Clarification: Fluency is reached when students are proficient, i.e., when they display accuracy, efficiency, and flexibility.
Number and Operations in Base Ten – K.NBT K.NBT.A. Work with numbers 11 – 19 to gain foundations for place value.
1. Compose (put together) and decompose (break apart) numbers from 11 to 19 into ten ones and some further ones, and record each composition or decomposition by using physical, visual, or symbolic representations; understand that these numbers are composed of ten ones and one, two, three, four, five, six, seven, eight, or nine ones.
Example: Recording the decomposition of 18 may look like 18 = 10 + 8.
Measurement and Data – K.MD K.MD.A. Describe and compare measurable attributes.
1. Describe measurable attributes of objects, such as length or weight. Describe several measurable attributes of a single object.
2. Directly compare two objects with a measurable attribute in common, to see which object has “more of”/ “less of” the attribute, and describe the difference.
Example: Directly compare the heights of two children and describe one child as taller/shorter.
K.MD.B. Classify objects and count the number of objects in each category.

CREATED 12/02/2021 DRAFT 7 – Idaho Content Standards/ Mathematics / SDE / 21
3. Classify objects into given categories; count the numbers of objects in each category (up to and including ten) and sort the categories by count.
Geometry – K.G K.G.A. Identify and describe shapes (squares, circles, triangles, rectangles, hexagons, cubes, cones, cylinders, and spheres).
1. Describe objects in the environment using names of shapes, and describe the relative positions of these objects using terms such as “above,” “below,” beside, “in front of,” “behind,” and “next to.”
2. Correctly name shapes regardless of their orientations or overall size.
3. Identify shapes as two-dimensional (lying in a plane, “flat”) or three-dimensional (“solid”).
K.G.B. Analyze, compare, create, and compose shapes.
4. Analyze and compare two- and three-dimensional shapes, in different sizes and orientations, using informal language to describe their similarities, differences, parts, and other attributes.
Examples:
1) Number of sides and vertices/ “corners”
2) Having sides of equal length
5. Model shapes in the world by building shapes from components/materials and drawing shapes.
Clarification: Components/materials may include: sticks, clay balls, marshmallows and/or spaghetti.
6. Compose simple shapes to form larger two-dimensional shapes.
Example: Can you join these two triangles with full sides touching to make a rectangle?
CREATED 12/02/2021 DRAFT 7 – Idaho Content Standards/ Mathematics / SDE / 22
FIRST GRADE
In first grade, instruction should focus on the following: (1) developing understanding of addition and subtraction, as well as strategies for addition and subtraction within 20; (2) developing understanding of whole-number relationships and place value, including grouping in tens and ones; (3) developing understanding of linear measurement and measuring lengths as iterating length units; and (4) reasoning about attributes of, and composing and decomposing geometric shapes.
1. Students develop strategies for adding and subtracting whole numbers based on their prior work with small numbers. They use a variety of models, including discrete objects and length-based models (e.g., cubes connected to form lengths), to model “add-to,” “take-from,” “put-together,” “take-apart,” and “compare” situations to develop meaning for the operations of addition and subtraction, and develop strategies to solve arithmetic problems with these operations. Students understand connections between counting and addition and subtraction (e.g., adding two is the same as counting on two). They use properties of addition to add whole numbers and to create and use increasingly sophisticated strategies based on these properties (e.g., “making tens”) to solve addition and subtraction problems within 20. By comparing a variety of solution strategies, children build their understanding of the relationship between addition and subtraction.
2. Students develop, discuss, and use efficient, accurate, and generalizable methods to add within 100 and subtract multiples of ten. They compare whole numbers (at least to 100) to develop an understanding of and solve problems involving their relative sizes. They think of whole numbers between ten and 100 in terms of tens and ones (especially recognizing the numbers 11 to 19 as composed of a ten and some ones). Through activities that build number sense, they understand the order of the counting numbers and their relative magnitudes.
3. Students develop an understanding of the meaning and processes of measurement, including underlying concepts such as iterating (the mental activity of building up the length of an object with equal-sized units) and the transitivity principle for indirect measurement.1
4. Students compose and decompose plane or solid figures (e.g., put two triangles together to make a quadrilateral) and build understanding of part-whole relationships as well as the properties of the original and composite shapes. As they combine shapes,
1 Students should apply the principle of transitivity of measurement to make indirect comparisons, but they need not use this technical term.

CREATED 12/02/2021 DRAFT 7 – Idaho Content Standards/ Mathematics / SDE / 23
they recognize them from different perspectives and orientations, describe their geometric attributes, and determine how they are alike and different, to develop the background for measurement and for initial understandings of properties such as congruence and symmetry.
Focus in the Standards
Not all content in a given grade is emphasized equally in the standards. Some clusters require greater emphasis than others based on the depth of the ideas, the time that they take to master, and/or their importance to future mathematics or the demands of college and career readiness. More time in these areas is also necessary for students to meet the Idaho Standards for Mathematical Practice. To say that some things have greater emphasis is not to say that anything in the standards can safely be neglected in instruction. Neglecting material will leave gaps in student skill and understanding and may leave students unprepared for the challenges of a later grade. Students should spend the large majority of their time on the major work of the grade (). Supporting work () and, where appropriate, additional work () can engage students in the major work of the grade.
Geometric and Spatial Thinking
Geometric and spatial thinking are important in and of themselves, because they connect mathematics with the physical world and play an important role in modeling occurrences whose origins are not necessarily physical; for example, as networks or graphs. They are also important because they support the development of number and arithmetic concepts and skills. Thus, geometry is essential for all grade levels for many reasons: its mathematical content; its roles in physical sciences, engineering, and many other subjects; and its strong aesthetic connections.

CREATED 12/02/2021 DRAFT 7 – Idaho Content Standards/ Mathematics / SDE / 24
First Grade Overview
Operations and Algebraic Thinking
A. Represent and solve problems involving addition and subtraction. B. Understand and apply properties of operations and the relationship between addition and subtraction. C. Add and subtract within 20. D. Work with addition and subtraction equations.
Number and Operations in Base Ten
A. Extend the counting sequence. B. Understand place value. C. Use place value understanding and properties of operations to add and subtract.
Measurement and Data
A. Measure lengths indirectly and by iterating (repeating) length units. B. Tell and write time. C. Represent and interpret data. D. Work with money.
Geometry
A. Reason with shapes and their attributes.
Mastery Standards
Mastery standards describe those standards that ask students to be able to perform mathematical calculations accurately, efficiently, and flexibly. For standards related to knowing single-digit facts from memory, this typically involves generating a response within three to five seconds. For first grade this standard is:
• 1.OA.C.6 Demonstrate fluency for addition and subtraction within ten, use strategies to add and subtract within 20.
Standards for Mathematical Practice
1. Make sense of problems and persevere in solving them.
2. Reason abstractly and quantitatively.
3. Construct viable arguments and critique the reasoning of others.
4. Model with mathematics. 5. Use appropriate tools
strategically. 6. Attend to precision. 7. Look for and make use of
structure. 8. Look for and express regularity
in repeated reasoning.

CREATED 12/02/2021 DRAFT 7 – Idaho Content Standards/ Mathematics / SDE / 25
First Grade Standards for Mathematical Practice The Standards for Mathematical Practice complement the content standards so that students increasingly engage with the subject matter as they grow in mathematical maturity and expertise throughout the K – 12 education years.
MP.1 Make sense of problems and persevere in solving them. In first grade, students realize that doing mathematics involves solving problems and discussing how they solved them. Students explain to themselves the meaning of a problem and look for ways to solve it. Younger students may use concrete objects or pictures to help them conceptualize and solve problems. They may check their thinking by asking themselves, “Does this make sense?” They are willing to try other approaches.
MP.2 Reason abstractly and quantitatively. Younger students recognize that a number represents a specific quantity. They connect the quantity to written symbols. Quantitative reasoning entails creating a representation of a problem while attending to the meanings of the quantities. In first grade students make sense of quantities and relationships while solving tasks. They represent situations by decontextualizing tasks into numbers and symbols. For example, “There are 60 children on the playground and some children go line up. If there are 20 children still playing, how many
children lined up?” Students translate the situation into the equation: 60 − 20 = and then solve the task. Students also contextualize situations during the problem-solving process. For example, students refer to the context of the task to determine that they need to subtract 20 from 60 because the total number of children on the playground is 20 less than the original number of children playing. Students might also reason about ways to partition two-dimensional geometric figures into halves and fourths.
MP.3 Construct viable arguments and critique the reasoning of others. First graders construct arguments using concrete referents, such as objects, pictures, drawings, and actions. They also practice their mathematical communication skills as they participate in mathematical discussions involving prompts like “How did you get that?”, “Explain your thinking.”, and “Why is that true?” They not only explain their own thinking, but listen to others’ explanations. They decide if the explanations make sense and ask questions. For example, “There are 15 books on the shelf. If you take some books off the shelf and there are now 7 left, how many books did you take off the shelf?” Students might use a variety of strategies to solve the task and then share and discuss their problem-solving strategies with their classmates.
MP.4 Model with mathematics.

CREATED 12/02/2021 DRAFT 7 – Idaho Content Standards/ Mathematics / SDE / 26
In early grades, students experiment with representing problem situations in multiple ways, including numbers, words (mathematical language), drawing pictures, using objects, acting out, making a chart or list, or creating equations. Students need opportunities to connect the different representations and explain the connections. They should be able to use all of these representations as needed. First grade students model real-life mathematical situations with a number sentence or an equation and check to make sure the equations accurately match the problem context. Students use concrete models and pictorial representations while solving tasks and also write an equation to model problem situations. For example, to solve the problem “There are 11 bananas on the counter. If you eat 4 bananas, how many are left?” students could write the equation 11 − 4 = 7. Students also create a story context for an equation such as 13 − 7 = 6.
MP.5 Use appropriate tools strategically. In first grade, students begin to consider the available tools (including estimation) when solving a mathematical problem and decide when certain tools might be helpful. For instance, first graders might decide it would be best to use colored chips to model an addition problem. In first grade students use tools such as counters, place value (base ten) blocks, hundreds number boards, number lines, concrete geometric shapes (e.g., pattern blocks, three-dimensional solids), and virtual representations to support conceptual understanding and mathematical thinking. Students determine which tools are the most appropriate to use. For
example, when solving 12 + 8 = , students explain why place value blocks are more appropriate than counters.
MP.6 Attend to precision. As young children begin to develop their mathematical communication skills, they try to use clear and precise language in their discussions with others and when they explain their own reasoning. In grade one, students use precise communication, calculation, and measurement skills. Students are able to describe their solution strategies to mathematical tasks using grade-level appropriate vocabulary, precise explanations, and mathematical reasoning. When students measure objects iteratively (repetitively), they check to make sure there are no gaps or overlaps. Students regularly check their work to ensure the accuracy and reasonableness of solutions.
MP.7 Look for and make use of structure. First graders begin to discern a pattern or structure. For instance, if students recognize 12 +3 = 15, then they also know 3 + 12 = 15. (Commutative property of addition.) To add 4 + 6 +4, the first two numbers can be added to make a ten, so 4 + 6 + 4 = 10 + 4 = 14. While solving addition problems, students begin to recognize the commutative property; for example, 7 + 4 = 11, and 4 + 7 = 11. While decomposing two-digit numbers, students realize that any

CREATED 12/02/2021 DRAFT 7 – Idaho Content Standards/ Mathematics / SDE / 27
two-digit number can be broken up into tens and ones, e.g., 35 = 30 + 5, 76 = 70 + 6. Grade one students make use of structure when they work with subtraction as a missing addend
problem; for example, 13 − 7 = can be written as 7 + = 13, and can be thought of as “How much more do I need to add to 7 to get to 13?”
MP.8 Look for and express regularity in repeated reasoning. First grade students begin to look for regularity in problem structures when solving mathematical tasks. For example, students add three one-digit numbers by using strategies such as “make a ten” or doubles. Students recognize when and how to use strategies to solve similar problems. For example, when evaluating 8 + 7 + 2, a student may say, “I know that eight and two equals ten, then I add seven to get to 17. It helps if I can make a ten out of two numbers when I start.” Students use repeated reasoning while solving a task with multiple correct answers. For example, students might solve the problem “There are 12 crayons in the box. Some are red and some are blue. How many of each could there be?” Students use repeated reasoning to find pairs of numbers that add up to 12 (e.g., the 12 crayons could include six of each color (6 + 6 = 12), or seven of one color and five of another (7 + 5 = 12)).

CREATED 12/02/2021 DRAFT 7 – Idaho Content Standards/ Mathematics / SDE / 28
Operations and Algebraic Thinking – 1.OA 1.OA.A. Represent and solve problems involving addition and subtraction.
1. Solve addition and subtraction word problems within 20 involving situations of adding to, taking from, putting together, taking apart, and comparing, with unknowns in all positions, by using physical, visual, and symbolic representations.
2. Solve word problems that call for addition of three whole numbers whose sum is less than or equal to 20 by using physical, visual, and symbolic representations.
Clarification: Students are not expected to independently read word problems.
1.OA.B. Understand and apply properties of operations and the relationship between addition and subtraction.
3. Apply properties of operations to add.
Examples:
1) If 8 + 3 = 11 is known, then 3 + 8 = 11 is also known. (Commutative property of addition.)
2) To add 2 + 6 + 4, the second two numbers can be added to make a ten, so 2 + 6 + 4 =2 + 10 = 12. (Associative property of addition.)
Clarification: Students need not use formal terms for these properties.
4. Restate a subtraction problem as a missing addend problem using the relationship between addition and subtraction.
Example: The equation 12 − 7 = ? can be restated as 7+ ? = 12 to determine the difference is 5.
1.OA.C. Add and subtract within 20.
5. Relate counting to addition and subtraction.
Example: When students count on 3 from 4, they should write this as 4 + 3 = 7. When students count on for subtraction, 3 from 7, they should connect this to 7 − 3 = 4. Students write "7 − 3 = ?” and think “I count on 3+ ? = 7.”
6. Demonstrate fluency for addition and subtraction within ten, use strategies to add and subtract within 20.
Clarification: Fluency is reached when students are proficient, i.e., when they display accuracy, efficiency, and flexibility.

CREATED 12/02/2021 DRAFT 7 – Idaho Content Standards/ Mathematics / SDE / 29
Students may use mental strategies such as counting on, making ten, decomposing a number leading to a ten, using the relationship between addition and subtraction, and creating equivalent but easier or known sums.
1.OA.D. Work with addition and subtraction equations.
7. Understand the meaning of the equal sign, and determine if equations involving addition and subtraction are true or false.
Example: Which of the following equations are true and which are false? 6 = 6, 7 = 8 − 1, 5 + 2 = 2 + 5, 4 + 1 = 5 + 2
8. Determine the unknown whole number in an addition or subtraction equation relating three whole numbers, with the unknown in any position.
Example: Determine the unknown number that makes the equation true in each of the equations 8+ ? = 11, 5 = ?−3, 6 + 6 = ?.
Number and Operations in Base Ten – 1.NBT 1.NBT.A. Extend the counting sequence.
1. Starting at a given number, count forward and backwards within 120 by ones. Skip count by twos to 20, by fives to 100, and by tens to 120. In this range, read and write numerals and represent a number of objects with a written numeral.
1.NBT.B. Understand place value.
2. Understand that the two digits of a two-digit number represent amounts of tens and ones. Understand:
a. 10 can be thought of as a bundle of ten ones — called a “ten.”
b. The numbers from 11 to 19 are composed of a ten and one, two, three, four, five, six, seven, eight, or nine ones.
c. The numbers 10, 20, 30, 40, 50, 60, 70, 80, 90 refer to one, two, three, four, five, six, seven, eight, or nine tens (and zero ones).
3. Compare two two-digit numbers based on meanings of the tens and ones digits, recording the results of comparisons with the symbols >, =, and <.
1.NBT.C. Use place value understanding and properties of operations to add and subtract.
4. Add whole numbers within 100 by using physical, visual, and symbolic representations, with an emphasis on place value, properties of operations, and/or the relationship between addition and subtraction.
a. Add a two-digit number and a one-digit number.

CREATED 12/02/2021 DRAFT 7 – Idaho Content Standards/ Mathematics / SDE / 30
b. Add a two-digit number and a multiple of ten.
c. Understand that when adding two-digit numbers, combine like base-ten units such as tens and tens, ones and ones, and sometimes it is necessary to compose a ten.
5. Given a two-digit number, mentally find ten more or ten less than the number, without having to count; explain the reasoning used.
6. Subtract multiples of ten in the range 10 – 90 from multiples of ten in the range 10 – 90 by using physical, visual, and symbolic representations, with an emphasis on place value, properties of operations, and/or the relationships between addition and subtraction; relate the strategy to a written method and explain the reasoning used.
Example: 70 − 40 can be thought of as 7 tens take away 4 tens, or can be rewritten as a missing addend problem: 40+ ? = 70.
Measurement and Data – 1.MD 1.MD.A. Measure lengths indirectly and by iterating (repeating) length units.
1. Order three objects by length; compare the lengths of two objects indirectly by using a third object.
2. Express the length of an object as a whole number of length units by laying multiple copies of a shorter object (the length unit) end to end; understand that the length measurement of an object is the number of same-size length units that span it with no gaps or overlaps.
Clarification: Limit to contexts where the object being measured is spanned by a whole number of length units with no gaps or overlaps. Include use of standard units such as inch-tiles or centimeter tiles.
1.MD.B. Tell and write time.
3. Tell and write time in hours and half-hours using analog and digital clocks.
1.MD.C. Represent and interpret data.
4. Organize, represent, and interpret data with up to three categories; ask and answer questions about the total number of data points, how many in each category, and how many more or less are in one category than in another.
1.MD.D. Work with money.
5. Identify quarters, dimes, and nickels and relate their values to pennies. Find equivalent values (e.g., a nickel is equivalent to five pennies).

CREATED 12/02/2021 DRAFT 7 – Idaho Content Standards/ Mathematics / SDE / 31
Geometry – 1.G 1.G.A. Reason with shapes and their attributes.
1. Compare defining attributes and non-defining attributes of two- and three-dimensional shapes; build and draw shapes that possess defining attributes.
Clarification: The defining attributes of triangles are closed and three-sided versus non-defining attributes of color, orientation, and overall size.
2. Compose two-dimensional (rectangles, squares, trapezoids, triangles, half-circles, and quarter-circles) or three-dimensional shapes (cubes, right rectangular prisms, right circular cones, and right circular cylinders) to create a composite shape, and compose new shapes from the composite shape.
Clarification: Students do not need to learn formal names such as “right rectangular prism.”
3. Partition circles and rectangles into two and four equal shares. Understand for these examples that decomposing into more equal shares creates smaller shares.
a. Describe the shares using the words “halves,” “fourths,” and “quarters,” and use the phrases “half of,” “a fourth of,” and “a quarter of.”
b. Describe the whole as two of, or four of, the shares.

CREATED 12/02/2021 DRAFT 7 – Idaho Content Standards/ Mathematics / SDE / 32
SECOND GRADE
In second grade, instruction should focus on the following: (1) extending understanding of base-ten notation; (2) building fluency with addition and subtraction; (3) using standard units of measure; and (4) describing and analyzing shapes.
1. Students extend their understanding of the base-ten system. This includes ideas of counting in fives, tens, and multiples of hundreds, tens, and ones, as well as number relationships involving these units, including comparing. Students understand multi-digit numbers (up to 1,000) written in base-ten notation, recognizing that the digits in each place represent amounts of thousands, hundreds, tens, or ones (e.g., 853 is 8 hundreds + 5 tens + 3 ones).
2. Students use their understanding of addition to develop fluency with addition and subtraction within 100. They solve problems within 1,000 by applying their understanding of models for addition and subtraction, and they develop, discuss, and use efficient, accurate, and generalizable methods to compute sums and differences of whole numbers in base-ten notation, using their understanding of place value and the properties of operations. They select and accurately apply methods that are appropriate for the context and the numbers involved to mentally calculate sums and differences for numbers with only tens or only hundreds.
3. Students recognize the need for standard units of measure (centimeter and inch) and they use rulers and other measurement tools with the understanding that linear measure involves an iteration of units. They recognize that the smaller the unit, the more iterations they need to cover a given length.
4. Students describe and analyze shapes by examining their sides and angles. Students investigate, describe, and reason about decomposing and combining shapes to make other shapes. Through building, drawing, and analyzing two- and three-dimensional shapes, students develop a foundation for understanding area, volume, congruence, similarity, and symmetry in later grades.
Focus in the Standards
Not all content in a given grade is emphasized equally in the standards. Some clusters require greater emphasis than others based on the depth of the ideas, the time that they take to master, and/or their importance to future mathematics or the demands of college and career readiness. More time in these areas is also necessary for students to meet the Idaho Standards for Mathematical Practice. To say that some things have greater emphasis is not to say that anything in the standards can safely be neglected in instruction. Neglecting material will leave gaps in student skill and understanding and may leave students unprepared for the challenges of a later grade. Students should spend the large majority of their time on the major work of

CREATED 12/02/2021 DRAFT 7 – Idaho Content Standards/ Mathematics / SDE / 33
the grade (). Supporting work () and, where appropriate, additional work () can engage students in the major work of the grade.
Geometric and Spatial Thinking
Geometric and spatial thinking are important in and of themselves, because they connect mathematics with the physical world and play an important role in modeling occurrences whose origins are not necessarily physical; for example, as networks or graphs. They are also important because they support the development of number and arithmetic concepts and skills. Thus, geometry is essential for all grade levels for many reasons: its mathematical content; its roles in physical sciences, engineering, and many other subjects; and its strong aesthetic connections.

CREATED 12/02/2021 DRAFT 7 – Idaho Content Standards/ Mathematics / SDE / 34
Second Grade Overview
Operations and Algebraic Thinking
A. Represent and solve problems involving addition and subtraction. B. Add and subtract within 20. C. Work with equal groups of objects to gain foundations for multiplication.
Number and Operations in Base Ten
A. Understand place value. B. Use place value understanding and properties of operations to add and subtract.
Measurement and Data
A. Measure and estimate lengths in standard units. B. Relate addition and subtraction to length. C. Work with time and money. D. Represent and interpret data.
Geometry
A. Reason with shapes and their attributes.
Mastery Standards
Mastery standards describe those standards that ask students to be able to perform mathematical calculations accurately, efficiently, and flexibly. For standards related to knowing single-digit facts from memory, this typically involves generating a response within three to five seconds. For second grade these standards are:
• 2.OA.B.2 Demonstrate fluency for addition and subtraction within 20 using mental strategies. By the end of grade two, recall basic facts to add and subtract within 20 with automaticity.
• 2.NBT.B.5 Fluently add and subtract whole numbers within 100 using understanding of place value and properties of operations.
Standards for Mathematical Practice
1. Make sense of problems and persevere in solving them.
2. Reason abstractly and quantitatively.
3. Construct viable arguments and critique the reasoning of others.
4. Model with mathematics. 5. Use appropriate tools
strategically. 6. Attend to precision. 7. Look for and make use of
structure. 8. Look for and express regularity
in repeated reasoning.

CREATED 12/02/2021 DRAFT 7 – Idaho Content Standards/ Mathematics / SDE / 35
Second Grade Standards for Mathematical Practice The Standards for Mathematical Practice complement the content standards so that students increasingly engage with the subject matter as they grow in mathematical maturity and expertise throughout the K – 12 education years.
MP.1 Make sense of problems and persevere in solving them. In second grade, students realize that doing mathematics involves solving problems and discussing how they solved them. Students explain to themselves the meaning of a problem and look for ways to solve it. They may use concrete objects or pictures to help them conceptualize and solve problems. They may check their thinking by asking themselves, “Does this make sense?” They make conjectures about the solution and plan out a problem-solving approach. An example for this might be giving a student an equation and having him/her write a story to match.
MP.2 Reason abstractly and quantitatively. Younger students recognize that a number represents a specific quantity. They connect the quantity to written symbols. Quantitative reasoning entails creating a representation of a problem while attending to the meanings of the quantities. Second graders begin to know and use different properties of operations and relate addition and subtraction to length. In second grade students represent situations by decontextualizing tasks into numbers and symbols. For example, in the task “There are 25 children in the cafeteria, and they are joined by 17 more children. How many students are in the cafeteria?” Students translate the
situation into an equation, such as: 25 + 17 = and then solve the problem. Students also contextualize situations during the problem-solving process. For example, while solving the task above, students might refer to the context of the task to determine that they need to subtract 19 if 19 children leave.
MP.3 Construct viable arguments and critique the reasoning of others. Second graders may construct arguments using concrete referents, such as objects, pictures, drawings, and actions. They practice their mathematical communication skills as they participate in mathematical discussions involving prompts like “How did you get that?”, “Explain your thinking.”, and “Why is that true?” They not only explain their own thinking, but listen to others’ explanations. They decide if the explanations make sense and ask appropriate questions. Students critique the strategies and reasoning of their classmates. For example, to solve 74 − 18, students may use a variety of strategies, and after working on the task, they might discuss and critique each others’ reasoning and strategies, citing similarities and differences between various problem-solving approaches.

CREATED 12/02/2021 DRAFT 7 – Idaho Content Standards/ Mathematics / SDE / 36
MP.4 Model with mathematics. In early grades, students experiment with representing problem situations in multiple ways, including numbers, words (mathematical language), drawing pictures, using objects, acting out, making a chart or list, or creating equations. Students need opportunities to connect the different representations and explain the connections. They should be able to use all of these representations as needed. In grade two students model real-life mathematical situations with a number sentence or an equation and check to make sure that their equation accurately matches the problem context. They use concrete manipulatives and pictorial representations to explain the equation. They create an appropriate problem situation from an
equation. For example, students create a story problem for the equation 43 + 17 = , such as “There were 43 gumballs in the machine. Tom poured in 17 more gumballs. How many gumballs are now in the machine?”
MP.5 Use appropriate tools strategically. In second grade, students consider the available tools (including estimation) when solving a mathematical problem and decide when certain tools might be better suited. For instance, second graders may decide to solve a problem by drawing a picture rather than writing an equation. Students may use tools such as snap cubes, place value (base ten) blocks, hundreds number boards, number lines, rulers, virtual manipulatives, and concrete geometric shapes (e.g., pattern blocks, three-dimensional solids). Students understand which tools are the most appropriate to use. For example, while measuring the length of the hallway, students can explain why a yardstick is more appropriate to use than a ruler.
MP.6 Attend to precision. As children begin to develop their mathematical communication skills, they try to use clear and precise language in their discussions with others and when they explain their own reasoning. Second grade students communicate clearly, using grade-level appropriate vocabulary accurately and precise explanations and reasoning to explain their process and solutions. For example, while measuring an object, students carefully line up the tool correctly to get an accurate measurement. During tasks involving number sense, students consider if their answer is reasonable and check their work to ensure the accuracy of solutions.
MP.7 Look for and make use of structure. Second grade students look for patterns and structures in the number system. For example, students notice number patterns within the tens place as they connect skip counting by tens to corresponding numbers on a 100s chart. Students see structure in the base-ten number system as they understand that ten ones equal a ten, and ten tens equal a hundred. Students adopt mental math strategies based on patterns (making ten, fact families, doubles).

CREATED 12/02/2021 DRAFT 7 – Idaho Content Standards/ Mathematics / SDE / 37
They use structure to understand subtraction as missing addend problems (e.g., 50 − 33 =
can be written as 33 + = 50, and can be thought of as “How much more do I need to add to 33 to get to 50?”)
MP.8 Look for and express regularity in repeated reasoning. Second grade students notice repetitive actions in counting and computation (e.g., number patterns to skip count). When children have multiple opportunities to add and subtract, they look for shortcuts, such as using estimation strategies and then adjust the answer to compensate. Students continually check for the reasonableness of their solutions during and after completing a task by asking themselves, “Does this make sense?”

CREATED 12/02/2021 DRAFT 7 – Idaho Content Standards/ Mathematics / SDE / 38
Operations and Algebraic Thinking – 2.OA 2.OA.A. Represent and solve problems involving addition and subtraction.
1. Use addition and subtraction within 100 to solve one- and two-step word problems involving situations of adding to, taking from, putting together, taking apart, and comparing, with unknowns in all positions, by using physical, visual, and symbolic representations.
2.OA.B. Add and subtract within 20.
2. Demonstrate fluency for addition and subtraction within 20 using mental strategies. By the end of grade two, recall basic facts to add and subtract within 20 with automaticity.
Clarification: Fluency is reached when students are proficient, i.e., when they display accuracy, efficiency, and flexibility.
Students may use mental strategies such as counting on, making ten; decomposing a number leading to a ten; using the relationship between addition and subtraction, and creating equivalent but easier or known sums.
2.OA.C. Work with equal groups of objects to gain foundations for multiplication.
3. Determine whether a group of objects (up to 20) has an odd or even number of members and write an equation to express an even number as a sum of two equal addends.
Clarification: Students may pair objects or count them by twos.
4. Use addition to find the total number of objects arranged in rectangular arrays with up to 5 rows and up to 5 columns; write an equation to express the total as a sum of equal addends.
Example: The total number of objects arranged in a 2 × 5 rectangular array can be found by adding 2 + 2 + 2 + 2 + 2.
Number and Operations in Base Ten – 2.NBT 2.NBT.A. Understand place value.
1. Understand that the three digits of a three-digit number represent amounts of hundreds, tens, and ones. Understand:
a. 100 can be thought of as a bundle of ten tens—called a “hundred.”
b. The numbers 100, 200, 300, 400, 500, 600, 700, 800, and 900 refer to one, two, three, four, five, six, seven, eight, or nine hundreds (and 0 tens and 0 ones).
Example: The number 241 can be expressed as 2 ℎ𝑢𝑢𝑢𝑢𝑢𝑢𝑢𝑢𝑢𝑢𝑢𝑢𝑢𝑢 + 4 𝑡𝑡𝑢𝑢𝑢𝑢𝑢𝑢 + 1 𝑜𝑜𝑢𝑢𝑢𝑢 or as 24 𝑡𝑡𝑢𝑢𝑢𝑢𝑢𝑢 + 1 𝑜𝑜𝑢𝑢𝑢𝑢 or as 241 𝑜𝑜𝑢𝑢𝑢𝑢𝑢𝑢.

CREATED 12/02/2021 DRAFT 7 – Idaho Content Standards/ Mathematics / SDE / 39
2. Count within 1,000; skip-count by fives, tens, and 100s. Identify patterns in skip counting starting at any number.
3. Read and write numbers from 0 to 1,000 using standard form, expanded form, and word form.
Example: The number two-hundred forty-one written in standard form is 241 and in expanded form is 200 + 40 + 1.
4. Compare two three-digit numbers based on meanings of the hundreds, tens, and ones digits, recording the results of comparisons with the symbols >, =, and <.
2.NBT.B. Use place value understanding and properties of operations to add and subtract.
5. Fluently add and subtract whole numbers within 100 using understanding of place value and properties of operations. Clarification: Fluency is reached when students are proficient, i.e., when they display accuracy, efficiency, and flexibility.
6. Add up to four two-digit numbers using strategies based on place value and properties of operations.
7. Add and subtract whole numbers within 1,000, by using physical, visual, and symbolic representations, with an emphasis on place value, properties of operations, and/or the relationships between addition and subtraction.
a. Understand that in adding or subtracting three-digit numbers, one adds or subtracts hundreds and hundreds, tens and tens, ones and ones.
b. Understand that sometimes it is necessary to compose or decompose tens or hundreds.
Example: Students may use equations to represent their strategies based on place value such as: 324 + 515 = (300 + 500) + (20 + 10) + (4 + 5) = 839.
8. Use mental strategies to add or subtract a number that is ten more, ten less, one hundred more, and one hundred less than a given three-digit number.
9. Explain why addition and subtraction strategies work, using place value and the properties of operations.

CREATED 12/02/2021 DRAFT 7 – Idaho Content Standards/ Mathematics / SDE / 40
Measurement and Data – 2.MD 2.MD.A. Measure and estimate lengths in standard units.
1. Measure the length of an object by selecting and using appropriate tools such as rulers, yardsticks, meter sticks, and measuring tapes.
2. Measure the length of an object twice, using length units of different lengths for the two measurements; describe how the two measurements relate to the size of the unit chosen.
3. Estimate lengths using units of inches, feet, centimeters, and meters.
4. Measure to determine how much longer one object is than another, expressing the length difference in terms of a standard length unit.
2.MD.B. Relate addition and subtraction to length.
5. Use addition and subtraction within 100 to solve word problems involving lengths that are given in the same units.
Clarification: Students may use drawings (such as drawings of rulers) and equations with a symbol for the unknown number to represent the problem.
6. Represent whole numbers as lengths from zero on a number line diagram with equally spaced points corresponding to the numbers 0, 1, 2, ..., and represent whole-number sums and differences within 100 on a number line diagram.
2.MD.C. Work with time and money.
7. Tell and write time from analog and digital clocks to the nearest five minutes, using a.m. and p.m.
8. Solve word problems involving dollar bills, quarters, dimes, nickels, and pennies (up to $10), using $ and ¢ symbols appropriately and whole-dollar amounts.
Example: A sample question could be, “If you have 2 dimes and 3 pennies, how many cents do you have? If you have $3 and 4 quarters, how many dollars or cents do you have?”
2.MD.D. Represent and interpret data.
9. Generate measurement data by measuring lengths of several objects to the nearest whole unit, or by making repeated measurements of the same object. Organize and record data on a line plot (dot plot) where the horizontal scale is marked off in whole-number units.
10. Draw a picture graph and a bar graph (with single-unit scale) to represent a data set with up to four categories. Solve simple put-together, take-apart, and compare problems using information presented in the graph.

CREATED 12/02/2021 DRAFT 7 – Idaho Content Standards/ Mathematics / SDE / 41
Geometry – 2.G 2.G.A. Reason with shapes and their attributes.
1. Recognize and draw shapes having specified attributes, such as a given number of angles or a given number of equal faces. Identify triangles, squares, rectangles, rhombi, trapezoids, pentagons, hexagons, octagons, and cubes.
2. Partition a rectangle into rows and columns of same-size squares and count to find the total number of them.
3. Partition circles and rectangles into two, three, or four equal shares. Understand for these examples that decomposing into more equal shares creates smaller shares.
a. Describe the shares using the words “halves,” “thirds,” “fourths,” and “quarter,” and use the phrases “half of,” “a third of,” “a fourth of,” and “quarter of.”
b. Describe the whole as two of, three of, or four of the shares.
c. Recognize that equal shares of identical wholes need not have the same shape.
CREATED 12/02/2021 DRAFT 7 – Idaho Content Standards/ Mathematics / SDE / 42
THIRD GRADE
In third grade, instruction should focus on the following: (1) developing understanding of multiplication and division and strategies for multiplication and division within 100; (2) developing understanding of fractions, especially unit fractions (fractions with numerator 1); (3) developing understanding of the structure of rectangular arrays and of area; and (4) describing and analyzing two-dimensional shapes.
1. Students develop an understanding of the meanings of multiplication and division of whole numbers through activities and problems involving equal-sized groups, arrays, and area models; multiplication is finding an unknown product, and division is finding an unknown factor in these situations. For equal-sized group situations, division can require finding the unknown number of groups or the unknown group size. Students use properties of operations to calculate products of whole numbers, using increasingly sophisticated strategies based on these properties to solve multiplication and division problems involving single-digit factors. By comparing a variety of solution strategies, students learn the relationship between multiplication and division.
2. Students develop an understanding of fractions, beginning with unit fractions. Students view fractions in general as being built out of unit fractions, and they use fractions along with visual fraction models to represent parts of a whole. Students understand that the
size of a fractional part is relative to the size of the whole. For example, 12 of the paint in
a small bucket could be less paint than 13 of the paint in a larger bucket, but 1
3 of a ribbon
is longer than 15 of the same ribbon because when the ribbon is divided into three equal
parts, the parts are longer than when the ribbon is divided into five equal parts. Students are able to use fractions to represent numbers equal to, less than, and greater than one. They solve problems that involve comparing fractions by using visual fraction models and strategies based on noticing equal numerators or denominators.
3. Students recognize area as an attribute of two-dimensional regions. They measure the area of a shape by finding the total number of same-size units of area required to cover the shape without gaps or overlaps; a square with sides of unit length being the standard unit for measuring area. Students understand that rectangular arrays can be decomposed into identical rows or into identical columns. By decomposing rectangles into rectangular arrays of squares, students connect area to multiplication, and justify using multiplication to determine the area of a rectangle.
4. Students describe, analyze, and compare properties of two-dimensional shapes. They compare and classify shapes by their sides and angles, and connect these with definitions of shapes. Students also relate their fraction work to geometry by expressing the area of part of a shape as a unit fraction of the whole.

CREATED 12/02/2021 DRAFT 7 – Idaho Content Standards/ Mathematics / SDE / 43
Focus in the Standards
Not all content in a given grade is emphasized equally in the standards. Some clusters require greater emphasis than others based on the depth of the ideas, the time that they take to master, and/or their importance to future mathematics or the demands of college and career readiness. More time in these areas is also necessary for students to meet the Idaho Standards for Mathematical Practice. To say that some things have greater emphasis is not to say that anything in the standards can safely be neglected in instruction. Neglecting material will leave gaps in student skill and understanding and may leave students unprepared for the challenges of a later grade. Students should spend the large majority of their time on the major work of the grade (). Supporting work () and, where appropriate, additional work () can engage students in the major work of the grade.
Geometric and Spatial Thinking
Geometric and spatial thinking are important in and of themselves, because they connect mathematics with the physical world and play an important role in modeling occurrences whose origins are not necessarily physical; for example, as networks or graphs. They are also important because they support the development of number and arithmetic concepts and skills. Thus, geometry is essential for all grade levels for many reasons: its mathematical content; its roles in physical sciences, engineering, and many other subjects; and its strong aesthetic connections.

CREATED 12/02/2021 DRAFT 7 – Idaho Content Standards/ Mathematics / SDE / 44
Third Grade Overview
Operations and Algebraic Thinking
A. Represent and solve problems involving multiplication and division. B. Understand properties of multiplication and the relationship between multiplication and division. C. Multiply and divide within 100. D. Solve problems involving the four operations, and identify and explain patterns in arithmetic.
Number and Operations in Base Ten
A. Use place value understanding and properties of operations to perform multi-digit arithmetic.
Number and Operations – Fractions
A. Develop understanding of fractions as numbers.
Measurement and Data
A. Solve problems involving measurement and estimation of intervals of time, liquid volumes, and masses of objects. B. Represent and interpret data. C. Geometric measurement: Understand concepts of area and relate area to multiplication and to addition. D. Geometric measurement: Recognize perimeter as an attribute of plane figures and distinguish between linear and area measures.
Geometry
A. Reason with shapes and their attributes.
Mastery Standards
Mastery standards describe those standards that ask students to be able to perform mathematical calculations accurately, efficiently, and flexibly. For standards related to knowing single-digit facts from memory, this typically involves generating a response within three to five seconds. For third grade these standards are:
Standards for Mathematical Practice
1. Make sense of problems and persevere in solving them.
2. Reason abstractly and quantitatively.
3. Construct viable arguments and critique the reasoning of others.
4. Model with mathematics. 5. Use appropriate tools
strategically. 6. Attend to precision. 7. Look for and make use of
structure. 8. Look for and express regularity
in repeated reasoning.

CREATED 12/02/2021 DRAFT 7 – Idaho Content Standards/ Mathematics / SDE / 45
• 3.OA.C.7.b Demonstrate fluency for multiplication within 100. Know from memory all products of two single-digit numbers and related division facts.
• 3.NBT.A.2* Fluently add and subtract whole numbers within 1,000 using understanding of place value and properties of operations.
*Designated as a mastery standard because students in third grade fluently add and subtract within 1,000 using methods based on place value, properties of operations, and/or the relationship between addition and subtraction. They focus on methods that generalize readily to larger numbers, emphasizing the relationship between addition and subtraction. These methods can be extended to 1,000,000 in fourth grade and fluency can be developed with larger numbers.

CREATED 12/02/2021 DRAFT 7 – Idaho Content Standards/ Mathematics / SDE / 46
Third Grade Standards for Mathematical Practice The Standards for Mathematical Practice complement the content standards so that students increasingly engage with the subject matter as they grow in mathematical maturity and expertise throughout the K – 12 education years.
MP.1 Make sense of problems and persevere in solving them. In third grade, mathematically proficient students know that doing mathematics involves solving problems and discussing how they solved them. Students explain to themselves the meaning of a problem and look for ways to solve it. Students may use concrete objects, pictures, or drawings to help them conceptualize and solve problems, such as “Jim purchased five packages of muffins. Each package contained three muffins. How many muffins did Jim purchase?” or “Describe another situation where there would be five groups of three or 5 × 3.” Students may check their thinking by asking themselves, “Does this make sense?” Students listen to other students’ strategies and are able to make connections between various methods for a given problem.
MP.2 Reason abstractly and quantitatively. Third graders should recognize that a number represents a specific quantity. They connect the quantity to written symbols and create a logical representation of the problem at hand, considering both the appropriate units involved and the meaning of quantities. For example: students apply their understanding of the meaning of the equal sign as “the same as”
to interpret an equation with an unknown. When given 4 × = 40, they might think:
• 4 groups of some number is the same as 40 • 4 times some number is the same as 40 • I know that 4 groups of 10 is 40 so the unknown number is 10 • The missing factor is 10 because 4 times 10 equals 40.
Teachers might ask, “How do you know?” or “What is the relationship between the quantities?” to reinforce students’ reasoning and understanding.
MP.3 Construct viable arguments and critique the reasoning of others. Students may construct arguments using concrete referents, such as objects, pictures, and drawings. They refine their mathematical communication skills as they participate in mathematical discussions that the teacher facilitates by asking questions such as “How did you get that?” and “Why is that true?” Students explain their thinking to others and respond to others’ thinking. For example, after investigating patterns on the 100s chart, students might explain why the pattern makes sense.
MP.4 Model with mathematics.

CREATED 12/02/2021 DRAFT 7 – Idaho Content Standards/ Mathematics / SDE / 47
Students experiment with representing problem situations in multiple ways, including numbers; words (mathematical language); drawing pictures; using objects; acting out; making a chart; list, or graph; or creating equations. Students need opportunities to connect the different representations and explain the connections. They should be able to use all of these representations as needed. Third graders should evaluate their results in the context of the situation and reflect on whether the results make sense. For example, students use various contexts and a variety of models (e.g., circles, squares, rectangles, fraction bars, and number lines) to represent and develop understanding of fractions. Students use models to represent both equations and story problems and can explain their thinking. They evaluate their results in the context of the situation and reflect on whether the results make sense. Students should be encouraged to answer questions such as “What math drawing or diagram could you make and label to represent the problem?” or “What are some ways to represent the quantities?”
MP.5 Use appropriate tools strategically. Third graders consider the available tools (including drawings and estimation) when solving a mathematical problem and decide when certain tools might be helpful. For instance, they may use graph paper to find all the possible rectangles that have a given perimeter. They compile the possibilities into an organized list or a table and determine whether they have all the possible rectangles. Students should be encouraged to answer questions such as “Why was it helpful to use ___?”
MP.6 Attend to precision. As third graders develop their mathematical communication skills, they try to use clear and precise language in their discussions with others and in their own reasoning. They are careful about specifying units of measure and state the meaning of the symbols they choose. For instance, when figuring out the area of a rectangle they record their answers in square units.
MP.7 Look for and make use of structure. Students look closely to discover a pattern or structure. For instance, students use properties of operations (e.g., the commutative and distributive properties) as strategies to multiply and divide. Teachers might ask, “What do you notice when ___?” or “How do you know if something is a pattern?”
MP.8 Look for and express regularity in repeated reasoning. Students in third grade should notice repetitive actions in computation and look for more shortcut methods. For example, students use the distributive property as a strategy for using products they know to solve products that they do not know. For example, if students are asked to find the product of 7 × 8, they might decompose 7 into 5 and 2 and then multiply 5 × 8 and 2 × 8 to arrive at 40 + 16 or 56. In addition, third graders continually evaluate their

CREATED 12/02/2021 DRAFT 7 – Idaho Content Standards/ Mathematics / SDE / 48
work by asking themselves, “Does this make sense?” Students should be encouraged to answer questions such as “What is happening in this situation?” or “What predictions or generalizations can this pattern support?”
CREATED 12/02/2021 DRAFT 7 – Idaho Content Standards/ Mathematics / SDE / 49
Operations and Algebraic Thinking – 3.OA 3.OA.A. Represent and solve problems involving multiplication and division.
1. Interpret a product of whole numbers as a grouping of sets, e.g., 5 × 7 as five groups of seven objects each.
2. Interpret a quotient of whole numbers as equal sharing, e.g., 56 ÷ 8 as the number in each share when 56 objects are split into 8 equal shares, or as the number of shares when 56 objects are split into equal shares of 8 objects each.
3. Use multiplication and division within 100 to solve word problems involving equal groups, arrays, and measurements by using visual and symbolic representations, with a symbol for an unknown number.
4. Determine the unknown whole number in a multiplication or division equation relating three whole numbers.
Example: Determine the unknown number that makes the equation true in each of the equations: 8 × ? = 48, 5 = ? ÷ 3, 6 × 6 = ?.
3.OA.B. Understand properties of multiplication and the relationship between multiplication and division.
5. Apply the properties of operations to multiply and divide.
Clarification: Students need not use formal terms for these properties (identity, communicative, associative, distributive).
6. Understand division as determining an unknown factor in a multiplication problem.
3.OA.C. Multiply and divide within 100.
7. Demonstrate fluency for multiplication within 100.
a. Demonstrate understanding of strategies that make use of the relationship between multiplication and division or properties of operations.
b. Know from memory all products of two single-digit numbers and related division facts.
Clarification: Fluency is reached when students are proficient, i.e., when they display accuracy, efficiency, and flexibility.
3.OA.D. Solve problems involving the four operations, and identify and explain patterns in arithmetic.
8. Solve two-step word problems involving whole numbers using the four operations.
a. Represent these problems using equations with a letter standing for the unknown quantity.
CREATED 12/02/2021 DRAFT 7 – Idaho Content Standards/ Mathematics / SDE / 50
b. Assess the reasonableness of answers using mental computation and estimation strategies, including rounding.
9. Identify arithmetic patterns (including patterns in the addition table or multiplication table) and explain them using properties of operations.
Example: Arithmetic patterns are patterns that change by the same rate, such as adding the same number; the series 2, 4, 6, 8, 10 is an arithmetic pattern that increases by 2 between each term.
Number and Operations in Base Ten – 3.NBT 3.NBT.A. Use place value understanding and properties of operations to perform multi-digit arithmetic.
1. Round a whole number to the tens or hundreds place, using place value understanding or a visual representation.
2. Fluently add and subtract whole numbers within 1,000 using understanding of place value and properties of operations.
Clarification: Fluency is reached when students are proficient, i.e., when they display accuracy, efficiency, and flexibility.
3. Multiply one-digit whole numbers by multiples of ten in the range 10– 90 using understanding of place value and properties of operations.
Number and Operations – Fractions – 3.NF 3.NF.A. Develop understanding of fractions as numbers.
1. Understand a fraction 1𝑏𝑏 as the quantity formed by one part when a whole (a single unit) is
partitioned into 𝑏𝑏 equal parts; understand 𝑎𝑎𝑏𝑏 as the quantity formed by 𝑎𝑎 parts of size 1
𝑏𝑏.
2. Understand a fraction as a number on the number line; represent fractions on a number line diagram.
a. Represent a unit fraction 1𝑏𝑏 on a number line diagram by defining the interval
from 0 to 1 as the whole and partitioning it into 𝑏𝑏 equal parts. Recognize that
each part has size 1𝑏𝑏 and that the fraction 1
𝑏𝑏 is located 1
𝑏𝑏 of a whole unit from 0
on the number line.

CREATED 12/02/2021 DRAFT 7 – Idaho Content Standards/ Mathematics / SDE / 51
b. Represent a fraction 𝑎𝑎𝑏𝑏 on a number line diagram by marking off a length 1
𝑏𝑏 from
0. Recognize that the resulting interval has size 𝑎𝑎𝑏𝑏 and that its endpoint locates
the number 𝑎𝑎𝑏𝑏 on the number line.
3. Explain equivalence of fractions and compare fractions by reasoning about their size, in limited cases.
a. Understand two fractions as equivalent (equal) if they are the same size, or the same point on a number line.
b. Recognize and generate simple equivalent fractions, and explain why the fractions are equivalent, such as by using a visual fraction model.
Example: 12
= 24
; 46
= 23
c. Express whole numbers as fractions, and recognize fractions that are equivalent to whole numbers.
Example: Express 3 in the form 3 = 31; recognize that 6
1= 6; locate 4
4 and 1 at the same point
of a number line diagram.
d. Compare two fractions with the same numerator or the same denominator by reasoning about their size. Recognize the comparisons are valid only when the two fractions refer to the same whole. Record the results of the comparisons with the symbols >, = , and <, and justify the conclusion using visual representations and/or verbal reasoning.
Measurement and Data – 3.MD 3.MD.A. Solve problems involving measurement and estimation of intervals of time, liquid volumes, and masses of objects.
1. Tell and write time to the nearest minute within the same hour and measure time intervals in minutes. Solve word problems involving addition and subtraction of time intervals in minutes.
Clarification: Students may use tools such as clocks, number line diagrams, and tables to solve problems involving time intervals.
2. Identify and use the appropriate tools and units of measurement, both customary and metric, to solve one-step word problems using the four operations involving weight, mass, liquid volume, and capacity (within the same system and unit).

CREATED 12/02/2021 DRAFT 7 – Idaho Content Standards/ Mathematics / SDE / 52
Clarification: Students may use drawings (such as a beaker with a measurement scale) to represent the problem.
This standard does not include conversions between units. The focus is on measuring and reasonable estimates, using benchmarks to measure weight, and capacity.
3.MD.B. Represent and interpret data.
3. Draw a scaled picture graph and scaled bar graph to represent a data set with several categories. Solve one- and two-step “how many more” and “how many less” problems using information presented in scaled bar graphs.
Example: Draw a bar graph in which each square in the bar graph might represent five pets.
4. Generate measurement data by measuring lengths of objects using rulers marked with halves and fourths of an inch. Record and show the data by making a line plot (dot plot), where the horizontal scale is marked off in appropriate units— whole numbers, halves, or fourths.
3.MD.C. Geometric measurement: Understand concepts of area and relate area to multiplication and to addition.
5. Recognize area as an attribute of plane figures and understand concepts of area measurement.
a. A square with side length one unit, called “a unit square,” is said to have “one square unit” of area, and can be used to measure area.
b. A plane figure which can be covered without gaps or overlaps by 𝑢𝑢 unit squares is said to have an area of 𝑢𝑢 square units.
6. Measure areas by counting unit squares (square cm, square m, square in, square ft, and nonstandard units).
7. Relate area to the operations of multiplication and addition.
a. Find the area of a rectangle with whole-number side lengths by tiling it, and show that the area is the same as would be found by multiplying the side lengths.
b. Multiply side lengths to find areas of rectangles with whole-number side lengths in the context of solving real-world and mathematical problems, and represent whole-number products as rectangular areas in mathematical reasoning.
c. Use tiling to show in a concrete case that the area of a rectangle with whole-number side lengths 𝑎𝑎 and 𝑏𝑏 + 𝑐𝑐 is the sum of 𝑎𝑎 × 𝑏𝑏 and 𝑎𝑎 × 𝑐𝑐. Use area models to represent the distributive property in mathematical reasoning.
CREATED 12/02/2021 DRAFT 7 – Idaho Content Standards/ Mathematics / SDE / 53
Example: Using the distributive property, the area of a shape that is 6 by 7 can be determined by finding the area of the 6 × 5 section and the 6 × 2 section and then adding the two products together.
d. Recognize area as additive. Find areas of rectilinear figures by decomposing them into non-overlapping rectangles and adding the areas of the non-overlapping parts, applying this technique to solve real-world problems.
Example: A pool is comprised of two non-overlapping rectangles in the shape of an “L.” The area for a cover of a pool can be found by adding the areas of the two non-overlapping rectangles.
3.MD.D. Geometric measurement: Recognize perimeter as an attribute of plane figures and distinguish between linear and area measures.
8. Solve real-world and mathematical problems involving perimeters of polygons, including finding the perimeter given the side lengths, finding an unknown side length, and exhibiting rectangles with the same perimeter and different areas or with the same area and different perimeters.
Geometry – 3.G 3.G.A. Reason with shapes and their attributes.
1. Understand that shapes in different categories may share attributes, and that the shared attributes can define a larger category. Compare and classify shapes by their sides and angles. Recognize rhombi, rectangles, squares, and trapezoids as examples of quadrilaterals, and draw examples of quadrilaterals that do not belong to any of these subcategories.
2. Partition two-dimensional figures into equal areas, and express the area of each part as a unit fraction of the whole.
Example: Draw lines to separate a shape into 4 parts with equal area, and describe the area
of each part as 14 of the area of the shape.

CREATED 12/02/2021 DRAFT 7 – Idaho Content Standards/ Mathematics / SDE / 54
FOURTH GRADE
In fourth grade, instruction should focus on the following: (1) developing understanding and fluency with multi-digit multiplication, and developing understanding of dividing to find quotients involving multi-digit dividends; (2) developing an understanding of fraction equivalence, addition and subtraction of fractions with like denominators, and multiplication of fractions by whole numbers; and (3) understanding that geometric figures can be analyzed and classified based on their properties, such as having parallel sides, perpendicular sides, particular angle measures, and symmetry.
1. Students generalize their understanding of place value to 1,000,000, understanding the relative sizes of numbers in each place. They apply their understanding of models for multiplication (equal-sized groups, arrays, area models), place value, and properties of operations — in particular the distributive property — as they develop, discuss, and use efficient, accurate, and generalizable methods to compute products of multi-digit whole numbers. Depending on the numbers and the context, they select and accurately apply appropriate methods to estimate or mentally calculate products. They develop fluency with efficient procedures for multiplying whole numbers; understand and explain why the procedures work based on place value and properties of operations; and use them to solve problems. Students apply their understanding of models for division, place value, properties of operations, and the relationship of division to multiplication as they develop, discuss, and use efficient, accurate, and generalizable procedures to find quotients involving multi-digit dividends. They select and accurately apply appropriate methods to estimate and mentally calculate quotients, and interpret remainders based upon the context.
2. Students develop understanding of fraction equivalence and operations with fractions.
They recognize that two different fractions can be equal (e.g., 159
= 53), and they develop
methods for generating and recognizing equivalent fractions. Students extend previous understandings about how fractions are built from unit fractions, composing fractions from unit fractions, decomposing fractions into unit fractions, and using the meaning of fractions and the meaning of multiplication to multiply a fraction by a whole number.
3. Students describe, analyze, compare, and classify two-dimensional shapes. Through building, drawing, and analyzing two-dimensional shapes, students deepen their understanding of properties of two-dimensional objects and the use of them to solve problems involving symmetry.
Focus in the Standards

CREATED 12/02/2021 DRAFT 7 – Idaho Content Standards/ Mathematics / SDE / 55
Not all content in a given grade is emphasized equally in the standards. Some clusters require greater emphasis than others based on the depth of the ideas, the time that they take to master, and/or their importance to future mathematics or the demands of college and career readiness. More time in these areas is also necessary for students to meet the Idaho Standards for Mathematical Practice. To say that some things have greater emphasis is not to say that anything in the standards can safely be neglected in instruction. Neglecting material will leave gaps in student skill and understanding and may leave students unprepared for the challenges of a later grade. Students should spend the large majority of their time on the major work of the grade (). Supporting work () and, where appropriate, additional work () can engage students in the major work of the grade.
Geometric and Spatial Thinking
Geometric and spatial thinking are important in and of themselves, because they connect mathematics with the physical world and play an important role in modeling occurrences whose origins are not necessarily physical; for example, as networks or graphs. They are also important because they support the development of number and arithmetic concepts and skills. Thus, geometry is essential for all grade levels for many reasons: its mathematical content; its roles in physical sciences, engineering, and many other subjects; and its strong aesthetic connections.

CREATED 12/02/2021 DRAFT 7 – Idaho Content Standards/ Mathematics / SDE / 56
Fourth Grade Overview
Operations and Algebraic Thinking
A. Use the four operations with whole numbers to solve problems. B. Gain familiarity with factors and multiples. C. Generate and analyze patterns.
Number and Operations in Base Ten
A. Generalize place value understanding for multi-digit whole numbers, less than or equal to 1,000,000. B. Use place value understanding and properties of operations to perform multi-digit arithmetic on whole numbers less than or equal to 1,000,000.
Number and Operations – Fractions
A. Extend understanding of fraction equivalence and ordering. B. Build fractions from unit fractions by applying and extending previous understandings of operations on whole numbers. C. Understand decimal notation for fractions, and compare decimal fractions.
Measurement and Data
A. Solve problems involving measurement and conversion of measurements from a larger unit to a smaller unit. B. Represent and interpret data. C. Geometric measurement: Understand concepts of angle and measure angles.
Geometry
A. Draw and identify lines and angles, and classify shapes by properties of their lines and angles.
Standards for Mathematical Practice
1. Make sense of problems and persevere in solving them.
2. Reason abstractly and quantitatively.
3. Construct viable arguments and critique the reasoning of others.
4. Model with mathematics. 5. Use appropriate tools
strategically. 6. Attend to precision. 7. Look for and make use of
structure. 8. Look for and express regularity
in repeated reasoning.

CREATED 12/02/2021 DRAFT 7 – Idaho Content Standards/ Mathematics / SDE / 57
Mastery Standards
Mastery standards describe those standards that ask students to be able to perform mathematical calculations accurately, efficiently, and flexibly. For standards related to knowing single-digit facts from memory, this typically involves generating a response within three to five seconds. For fourth grade this standard is:
• 4.NBT.B.4 Fluently use the standard algorithm for multi-digit whole-number addition and subtraction.

CREATED 12/02/2021 DRAFT 7 – Idaho Content Standards/ Mathematics / SDE / 58
Fourth Grade Standards for Mathematical Practice The Standards for Mathematical Practice complement the content standards so that students increasingly engage with the subject matter as they grow in mathematical maturity and expertise throughout the K – 12 education years.
MP.1 Make sense of problems and persevere in solving them. In fourth grade, students know that doing mathematics involves solving problems and discussing how they solved them. Students explain to themselves the meaning of a problem and look for ways to solve it. Fourth graders may use concrete objects or pictures to help them conceptualize and solve problems. They may check their thinking by asking themselves, “Does this make sense?” They listen to the strategies of others and will try different approaches. They often will use another method to check their answers. Students might use an equation strategy to solve the word problem. For example, students could solve the problem “Chris bought clothes for school. She bought three shirts for $12 each and a skirt for $15. How much money did Chris spend on her new school clothes?” with the equation 3 × $12 + $15 = 𝑎𝑎.
MP.2 Reason abstractly and quantitatively. Fourth graders should recognize that a number represents a specific quantity. They connect the quantity to written symbols and create a logical representation of the problem at hand, considering both the appropriate units involved and the meaning of quantities. They extend this understanding from whole numbers to their work with fractions and decimals. Students write simple expressions, record calculations with numbers, and represent or round numbers using place value concepts. Students might use base ten blocks or drawings to demonstrate 154 × 6, as 154 added six times, and develop an understanding of the distributive property. For example: 154 × 6
= (100 + 50 + 4) × 6
= (100 × 6) + (50 × 6) + (4 × 6)
= 600 + 300 + 24 = 924
MP.3 Construct viable arguments and critique the reasoning of others. In fourth grade, students may construct arguments using concrete referents, such as objects, pictures, and drawings. They explain their thinking and make connections between models and equations. They refine their mathematical communication skills as they participate in mathematical discussions involving prompts like “How did you get that?”, “Explain your thinking.”, and “Why is that true?” They not only explain their own thinking, but listen to

CREATED 12/02/2021 DRAFT 7 – Idaho Content Standards/ Mathematics / SDE / 59
others’ explanations. Students explain and defend their answers and solution strategies as they answer questions that require an explanation. For example, “Vincent cuts two meters of string into four-centimeter pieces for a craft. How many pieces of string does Vincent have? Explain your reasoning.” Students ask appropriate questions, and they decide if explanations make sense. Students experiment with representing problem situations in multiple ways, including numbers; words (mathematical language); drawing pictures; using objects; making a chart, list, or graph; or creating equations.
MP.4 Model with mathematics. Students need opportunities to connect the different representations and explain the connections. They should be able to use all of these representations as needed. Fourth graders should evaluate their results in the context of the situation and reflect on whether the results make sense. For example, students may use money (i.e., dollars and coins) or base ten blocks to solve the following problem: Elsie buys a drink for $1.39 and a granola bar for $0.89. How much change will she receive if she pays with a $5 bill?
MP.5 Use appropriate tools strategically. Fourth graders consider the available tools (including estimation) when solving a mathematical problem and decide when certain tools might be helpful. For instance, they may use graph paper, a number line, or base ten blocks to represent, compare, add, and subtract decimals to the hundredths. Students in fourth grade use protractors to measure angles. They use other measurement tools to understand the relative size of units within a given system and express measurements given in larger units in terms of smaller units.
MP.6 Attend to precision. As fourth graders develop their mathematical communication skills, they try to use clear and precise language in their discussions with others and in their own reasoning. For instance, they may use graph paper, a number line, or base ten blocks to represent, compare, add, and subtract decimals to the hundredths. Students in fourth grade use protractors to measure angles. They are careful about specifying units of measure and state the meaning of the symbols they choose. For instance, they use appropriate labels when creating a line plot.
MP.7 Look for and make use of structure. In fourth grade, students look closely to discover a pattern or structure. For instance, students use properties of operations to explain calculations (partial products model). They relate representations of counting problems such as arrays and area models to the multiplication principle of counting. They generate number or shape patterns that follow a given rule using two-column tables.

CREATED 12/02/2021 DRAFT 7 – Idaho Content Standards/ Mathematics / SDE / 60
MP.8 Look for and express regularity in repeated reasoning. Students in fourth grade should notice repetitive actions in computation to make generalizations. Students use models to explain calculations and understand how algorithms work. They also use models to examine patterns and generate their own algorithms. For example, students use visual fraction models to write equivalent fractions.

CREATED 12/02/2021 DRAFT 7 – Idaho Content Standards/ Mathematics / SDE / 61
Operations and Algebraic Thinking – 4.OA 4.OA.A. Use the four operations with whole numbers to solve problems.
1. Interpret a multiplication equation as a comparison, e.g., 35 = 5 × 7, as 35 is 5 times as many as 7. Represent verbal multiplicative comparisons as equations.
2. Multiply or divide to solve word problems involving multiplicative comparison.
Example: If the cost of a red hat is three times more than a blue hat that costs $5, then a red hat costs $15.
Clarification: Students may use drawings and equations with a symbol for the unknown number to represent the problem. Distinguish between multiplicative comparison and additive comparison.
3. Solve multi-step whole-number word problems using the four operations, including problems in which remainders must be interpreted.
a. Represent these problems using equations with a letter standing for the unknown quantity.
b. Assess the reasonableness of answers using mental computation and estimation strategies, including rounding.
4.OA.B. Gain familiarity with factors and multiples.
4. Find all factor pairs for a whole number in the range 1–100.
a. Recognize that a whole number is a multiple of each of its factors.
b. Determine whether a given whole number in the range 1–100 is a multiple of a given one-digit number.
c. Determine whether a given whole number in the range 1–100 is prime or composite.
4.OA.C. Generate and analyze patterns.
5. Generate a number or shape pattern that follows a given rule. Identify and explain features of the pattern that were not explicit in the rule itself.
Example: Given the rule “Add 3” and the starting number 1, generate terms in the resulting sequence and observe that the terms appear to alternate between odd and even numbers. Explain informally why the numbers will continue to alternate in this way.

CREATED 12/02/2021 DRAFT 7 – Idaho Content Standards/ Mathematics / SDE / 62
Number and Operations in Base Ten – 4.NBT 4.NBT.A. Generalize place value understanding for multi-digit whole numbers, less than or equal to 1,000,000.
1. Recognize that in a multi-digit whole number, a digit in any place represents ten times as much as it represents in the place to its right.
2. Read and write multi-digit whole numbers using standard form, expanded form, and word form. Compare two multi-digit numbers based on meanings of the digits and each place, recording the results of comparisons with the symbols >, =, and <.
Example: The number two hundred seventy-five thousand eight hundred two written in standard form is 275,802, and in expanded form is 200,000 + 70,000 + 5,000 + 800 + 2 or (2 × 100,000) + (7 × 10,000) + (5 × 1,000) + (8 × 100) + (2 × 1).
3. Use place value understanding or visual representation to round multi-digit whole numbers to any place.
4.NBT.B. Use place value understanding and properties of operations to perform multi-digit arithmetic on whole numbers less than or equal to 1,000,000.
4. Fluently use the standard algorithm for multi-digit whole-number addition and subtraction.
Example: What is the difference between 634 and 328 using the standard algorithm?
Clarification: Fluency is reached when students are proficient, i.e., when they display accuracy, efficiency, and flexibility.
5. Multiply a whole number of up to four digits by a one-digit whole number, and multiply two two-digit numbers.
a. Use strategies based on place value and the properties of operations.
b. Illustrate and explain the calculation by using equations, rectangular arrays, and/or area models.
6. Find whole-number quotients and remainders with up to four-digit dividends and one-digit divisors.
a. Use strategies based on place value, the properties of operations, and/or the relationship between multiplication and division.

CREATED 12/02/2021 DRAFT 7 – Idaho Content Standards/ Mathematics / SDE / 63
b. Illustrate and explain the calculation by using rectangular arrays, area models, and/or equations.
Clarification for 4.NBT.B.5 and 4.NBT.B.6: Students should be familiar with multiple strategies but should be able to select and use the strategy with which they most closely connect and understand, with the ultimate goal of supporting students to use more efficient strategies.
Number and Operations – Fractions – 4.NF 4.NF.A. Extend understanding of fraction equivalence and ordering.
1. Explain why a fraction 𝑎𝑎𝑏𝑏 is equivalent to a fraction 𝑛𝑛×𝑎𝑎
𝑛𝑛×𝑏𝑏 by using visual fraction models, with
attention to how the numbers and sizes of the parts differ even though the two fractions themselves are the same size. Use this principle to recognize and generate equivalent fractions, including fractions greater than 1.
Example: When a horizontal line is drawn through the center of the model, the number of equal parts doubles and the size of the parts is halved.
2. Compare two fractions with different numerators and different denominators, by creating
common denominators or numerators, or by comparing to a benchmark fraction such as 12.
a. Recognize that comparisons are valid only when the two fractions refer to the same whole.
b. Record the results of comparisons with symbols >, =, or <, and justify the conclusions, by using a visual fraction model and/or verbal reasoning.
4.NF.B. Build fractions from unit fractions by applying and extending previous understandings of operations on whole numbers.
3. Understand a fraction 𝑎𝑎𝑏𝑏 with 𝑎𝑎 > 1 as a sum of fractions 1
𝑏𝑏.
a. Understand addition and subtraction of fractions as joining and separating parts referring to the same whole.
b. Decompose a fraction into a sum of fractions with the same denominator in more than one way, recording each decomposition by an equation. Justify the conclusions by using a visual fraction model and/or verbal reasoning.
Example: 38
= 18
+ 18
+ 18; 38
= 18
+ 28; 2 1
8= 1 + 1 + 1
8= 8
8+ 8
8+ 1
8

CREATED 12/02/2021 DRAFT 7 – Idaho Content Standards/ Mathematics / SDE / 64
c. Add and subtract mixed numbers with like denominators by replacing the mixed number with an equivalent fraction and/or by using properties of operations and the relationship between addition and subtraction.
d. Solve word problems involving addition and subtraction of fractions, including mixed numbers, with the same denominator. Justify the conclusions using a visual fraction model and/or verbal reasoning.
4. Apply and extend previous understandings of multiplication to multiply a fraction by a whole number.
a. Understand a fraction 𝑎𝑎𝑏𝑏 as a multiple of 1
𝑏𝑏.
Example: Use a visual fraction model to represent 54 as the product 5 × 1
4 , recording the
conclusion by the equation 54
= 5 × 14.
b. Understand a multiple of 𝑎𝑎𝑏𝑏 as a multiple of 1
𝑏𝑏, and use this understanding to
multiply a fraction by a whole number.
Example: Use a visual fraction model to express 3 × 25 as 6 × 1
5, recognizing this product as
65. In general, 𝑢𝑢 × 𝑎𝑎
𝑏𝑏= 𝑛𝑛×𝑎𝑎
𝑏𝑏.
c. Solve word problems involving multiplication of a fraction by a whole number e.g., by using visual fraction models and/or equations to represent the problem.
Example: If each person at a party will eat 38 of a pound of roast beef, and there will be 5
people at the party, how many pounds of roast beef will be needed? Between what two whole numbers does your answer lie?
4.NF.C. Understand decimal notation for fractions, and compare decimal fractions.
5. Express a fraction with denominator 10 as an equivalent fraction with denominator 100, and use this technique to add two fractions with respective denominators 10 and 100.
Example: Express 310
as 3100
, and add 310
+ 4100
= 34100
.
Clarification: Students who can generate equivalent fractions can develop strategies for adding fractions with unlike denominators in general, but addition and subtraction with unlike denominators is not a requirement at this grade.
6. Use decimal notation to represent fractions with denominators 10 or 100.
Example: rewrite 0.62 as 62100
; describe a length as 0.62 meters; locate 0.62 on a number line
diagram.

CREATED 12/02/2021 DRAFT 7 – Idaho Content Standards/ Mathematics / SDE / 65
7. Compare two decimals to hundredths by reasoning about their size.
a. Recognize that comparisons are valid only when the two decimals refer to the same whole.
b. Record the results of the comparisons with the symbols >, =, and <, and justify the conclusions using visual representations and/or verbal reasoning.
Clarification: Students able to multiply fractions in general can develop strategies to divide fractions in general, by reasoning about the relationship between multiplication and division, but division of a fraction by a fraction is not a requirement at this grade.
Measurement and Data – 4.MD 4.MD.A. Solve problems involving measurement and conversion of measurements from a larger unit to a smaller unit.
1. Know relative sizes of measurement units within any one system of units.
a. Within a single system of measurement, express measurements in a larger unit in terms of a smaller unit.
b. Record measurement equivalents in a two-column table.
Example: Know that 1 ft is 12 times as long as 1 in. Express the length of a 4 ft snake as 48 in. Generate a conversion table for feet and inches listing the number pairs (1, 12), (2, 24), (3, 36), ...
2. Use the four operations to solve word problems involving measurements.
a. Include problems involving simple fractions or decimals.
b. Include problems that require expressing measurements given in a larger unit in terms of a smaller unit.
c. Represent measurement quantities using diagrams such as number line diagrams that feature a measurement scale.
Clarification: Measurement may include, but is not limited to, length, area, volume, capacity, mass, weight, and money.
3. Apply the area and perimeter formulas for rectangles in real-world and mathematical problems.
Example: Find the width of a rectangular room given the area of the flooring and the length, by viewing the area formula as a multiplication equation with an unknown factor.

CREATED 12/02/2021 DRAFT 7 – Idaho Content Standards/ Mathematics / SDE / 66
Clarification: Students should express their answers in linear (perimeter) and square (area) units. Students are not expected to use the 1 𝑐𝑐𝑐𝑐2 notation.
4.MD.B. Represent and interpret data.
4. Make a line plot (dot plot) to show a set of measurements in fractions of a unit �12
, 14
, 18�.
Solve problems involving addition and subtraction of fractions by using information presented in line plots (dot plots).
Example: From a line plot (dot plot), find and interpret the difference in length between the longest and shortest specimens in an insect collection.
4.MD.C. Geometric measurement: Understand concepts of angle and measure angles.
5. Recognize angles as geometric shapes that are formed wherever two rays share a common endpoint, and understand concepts of angle measurement.
a. An angle is measured with reference to a circle with its center at the common endpoint of the rays, by considering the fraction of the circular arc between the points where the two rays intersect the circle.
Example: An angle that turns through 1360
of a circle is called a “one-degree angle” and can
be used to measure angles.
b. An angle that turns through 𝑢𝑢 one-degree angles is said to have an angle measure of 𝑢𝑢 degrees.
6. Measure angles in whole-number degrees using a protractor. Sketch angles of specified measure.
7. Solve addition and subtraction problems to find unknown angles on a diagram in real-world and mathematical problems.
a. Use an equation with a symbol for the unknown angle measure.
b. Recognize angle measure as additive. When an angle is decomposed into non-overlapping parts, the angle measure of the whole is the sum of the angle measures of the parts.
Geometry – 4.G 4.G.A. Draw and identify lines and angles, and classify shapes by properties of their lines and angles.
1. Draw points, lines, line segments, rays, angles (right, acute, obtuse), and perpendicular and parallel lines. Identify these in two-dimensional figures.

CREATED 12/02/2021 DRAFT 7 – Idaho Content Standards/ Mathematics / SDE / 67
2. Classify two-dimensional figures based on the presence or absence of parallel or perpendicular lines, or the presence or absence of angles of a specified size. Recognize right triangles as a category, and identify right triangles.
3. Recognize a line of symmetry for a two-dimensional figure as a line across the figure such that the figure can be folded along the line into matching parts. Identify line-symmetric figures and draw lines of symmetry.

CREATED 12/02/2021 DRAFT 7 – Idaho Content Standards/ Mathematics / SDE / 68
FIFTH GRADE
In fifth grade, instruction should focus on the following: (1) developing fluency with addition and subtraction of fractions, and developing understanding of multiplication of fractions and division of fractions in limited cases (unit fractions divided by whole numbers and whole numbers divided by unit fractions); (2) extending division to two-digit divisors, integrating decimal fractions into the place value system and developing understanding of operations with decimals to hundredths, and developing fluency with whole-number and decimal operations; (3) developing understanding of measurement systems and determining volumes to solve problems; and (4) solving problems using the coordinate plane.
1. Students apply their understanding of fractions and fraction models to represent the addition and subtraction of fractions with unlike denominators as equivalent calculations with like denominators. They develop fluency in calculating sums and differences of fractions, and make reasonable estimates of them. Students also use the meaning of fractions, multiplication and division, and the relationship between multiplication and division to understand and explain why the procedures for multiplying and dividing fractions make sense. (Note: This is limited to the case of dividing unit fractions by whole numbers and whole numbers by unit fractions.)
2. Students develop understanding of why division procedures work based on the meaning of base-ten numerals and properties of operations. They finalize fluency with multi-digit multiplication and division. They apply their understandings of models for decimals, decimal notation, and properties of operations to add and subtract decimals to hundredths. They develop fluency in these computations and make reasonable estimates of their results. Students use the relationship between decimals and fractions, as well as the relationship between finite decimals and whole numbers (i.e., a finite decimal multiplied by an appropriate power of ten is a whole number), to understand and explain why the procedures for multiplying and dividing finite decimals make sense. They compute products and quotients of decimals to hundredths efficiently and accurately.
3. Students convert among different-sized measurement units within a given measurement system, allowing for efficient and accurate problem solving with multi-step real-world problems as they progress in their understanding of scientific concepts and calculations. Students recognize volume as an attribute of three-dimensional space. They understand that volume can be measured by finding the total number of same-size units of volume required to fill the space without gaps or overlaps. They understand that a 1-unit by 1-unit by 1-unit cube is the standard unit for measuring volume. They select appropriate units, strategies, and tools for solving problems that involve
CREATED 12/02/2021 DRAFT 7 – Idaho Content Standards/ Mathematics / SDE / 69
estimating and measuring volume. They decompose three-dimensional shapes and find volumes of right rectangular prisms by viewing them as decomposed into layers of arrays of cubes. They measure necessary attributes of shapes in order to determine volumes to solve real-world and mathematical problems.
4. Students learn to interpret the components of a rectangular coordinate system as lines and understand the precision of location that these lines require. Students learn to apply their knowledge of number and length to the order and distance relationships of a coordinate grid and to coordinate this across two dimensions. Students solve mathematical and real-world problems using coordinates.
Focus in the Standards
Not all content in a given grade is emphasized equally in the standards. Some clusters require greater emphasis than others based on the depth of the ideas, the time that they take to master, and/or their importance to future mathematics or the demands of college and career readiness. More time in these areas is also necessary for students to meet the Idaho Standards for Mathematical Practice. To say that some things have greater emphasis is not to say that anything in the standards can safely be neglected in instruction. Neglecting material will leave gaps in student skill and understanding and may leave students unprepared for the challenges of a later grade. Students should spend the large majority of their time on the major work of the grade (). Supporting work () and, where appropriate, additional work () can engage students in the major work of the grade.
Geometric and Spatial Thinking
Geometric and spatial thinking are important in and of themselves, because they connect mathematics with the physical world and play an important role in modeling occurrences whose origins are not necessarily physical; for example, as networks or graphs. They are also important because they support the development of number and arithmetic concepts and skills. Thus, geometry is essential for all grade levels for many reasons: its mathematical content; its roles in physical sciences, engineering, and many other subjects; and its strong aesthetic connections.

CREATED 12/02/2021 DRAFT 7 – Idaho Content Standards/ Mathematics / SDE / 70
Fifth Grade Overview
Operations and Algebraic Thinking
A. Write and interpret numerical expressions. B. Analyze patterns and relationships.
Number and Operations in Base Ten
A. Understand the place value system. B. Perform operations with multi-digit whole numbers and with decimals to hundredths.
Number and Operations – Fractions
A. Use equivalent fractions as a strategy to add and subtract fractions. B. Apply and extend previous understandings of multiplication and division to multiply and divide fractions.
Measurement and Data
A. Convert like measurement units within a given measurement system. B. Represent and interpret data. C. Geometric measurement: Understand concepts of volume and relate volume to multiplication and to addition.
Geometry
A. Graph points on the coordinate plane to solve real-world and mathematical problems. B. Classify two-dimensional figures into categories based on their properties.
Mastery Standards
Mastery standards describe those standards that ask students to be able to perform mathematical calculations accurately, efficiently, and flexibly. For standards related to knowing single-digit facts from memory, this typically involves generating a response within three to five seconds. For fifth grade this standard is:
• 5.NBT.B.5 Demonstrate fluency for multiplication of multi-digit whole numbers using the standard algorithm. Include two-digit × four-digit numbers and three-digit × three-digit numbers.
Standards for Mathematical Practice
1. Make sense of problems and persevere in solving them.
2. Reason abstractly and quantitatively.
3. Construct viable arguments and critique the reasoning of others.
4. Model with mathematics. 5. Use appropriate tools
strategically. 6. Attend to precision. 7. Look for and make use of
structure. 8. Look for and express regularity
in repeated reasoning.

CREATED 12/02/2021 DRAFT 7 – Idaho Content Standards/ Mathematics / SDE / 71
Fifth Grade Standards for Mathematical Practice The Standards for Mathematical Practice complement the content standards so that students increasingly engage with the subject matter as they grow in mathematical maturity and expertise throughout the K – 12 education years.
MP.1 Make sense of problems and persevere in solving them. Students solve problems by applying their understanding of operations with whole numbers, decimals, and fractions including mixed numbers. They solve problems related to volume and measurement conversions. Students seek the meaning of a problem and look for
efficient ways to represent and solve it. For example, Sonia had 2 13 candy bars. She promised
her brother that she would give him 12 of a candy bar. How much will she have left after she
gives her brother the amount she promised? They may check their thinking by asking themselves, “What is the most efficient way to solve the problem?”, “Does this make sense?”, and “Can I solve the problem in a different way?”.
MP.2 Reason abstractly and quantitatively. Fifth graders should recognize that a number represents a specific quantity. They connect quantities to written symbols and create a logical representation of the problem at hand, considering both the appropriate units involved and the meaning of quantities. They extend this understanding from whole numbers to their work with fractions and decimals. Students write simple expressions that record calculations with numbers and represent or round numbers using place value concepts. For example, students use abstract and quantitative
thinking to recognize that 0.5 × (300 ÷ 15) is 12 of (300 ÷ 15) without calculating the
quotient.
MP.3 Construct viable arguments and critique the reasoning of others. In fifth grade, students may construct arguments using concrete referents, such as objects, pictures, and drawings. They explain calculations based upon models and properties of operations and rules that generate patterns. They demonstrate and explain the relationship between volume and multiplication. They refine their mathematical communication skills as they participate in mathematical discussions involving questions like “How did you get that?” and “Why is that true?” They explain their thinking to others and respond to others’ thinking. Students use various strategies to solve problems and they defend and justify their work with others. For example, two afterschool clubs are having pizza parties. The teacher will order 3 pizzas for every 5 students in the math club, and 5 pizzas for every 8 students in the student council. If a student is in both groups, decide which party they should attend. How

CREATED 12/02/2021 DRAFT 7 – Idaho Content Standards/ Mathematics / SDE / 72
much pizza will each student get at each party? If a student wants to have the most pizza, which party should they attend?
MP.4 Model with mathematics. Students experiment with representing problem situations in multiple ways, including numbers; words (mathematical language); drawing pictures; using objects; making a chart, list, or graph; or creating equations. Students need opportunities to connect the different representations and explain the connections. They should be able to use all of these representations as needed. Fifth graders should evaluate their results in the context of the situation and whether the results make sense. They also evaluate the utility of models to determine which models are most useful and efficient to solve problems.
MP.5 Use appropriate tools strategically. Fifth graders consider the available tools (including estimation) when solving a mathematical problem and decide when certain tools might be helpful. For instance, they may use unit cubes to fill a rectangular prism and then use a ruler to measure the dimensions. They use graph paper to accurately create graphs and solve problems or make predictions from real-world data.
MP.6 Attend to precision. Students continue to refine their mathematical communication skills by using clear and precise language in their discussions with others and in their own reasoning. Students use appropriate terminology when referring to expressions, fractions, geometric figures, and coordinate grids. They are careful about specifying units of measure and state the meaning of the symbols they choose. For instance, when figuring out the volume of a rectangular prism, they record their answers in cubic units.
MP.7 Look for and make use of structure. In fifth grade, students look closely to discover a pattern or structure. For instance, students use properties of operations as strategies to add, subtract, multiply, and divide with whole numbers, fractions, and decimals. They examine numerical patterns and relate them to a rule or a graphical representation.
MP.8 Look for and express regularity in repeated reasoning. Fifth graders use repeated reasoning to understand algorithms and make generalizations about patterns. Students connect place value and their prior work with operations to understand algorithms to fluently multiply multi-digit numbers and perform all operations with decimals to hundredths. Students explore operations with fractions with visual models and begin to formulate generalizations.

CREATED 12/02/2021 DRAFT 7 – Idaho Content Standards/ Mathematics / SDE / 73
Operations and Algebraic Thinking – 5.OA 5.OA.A. Write and interpret numerical expressions.
1. Use parentheses, brackets, or braces in numerical expressions, and evaluate expressions with these symbols. Example: 4.5 + (3 × 2) in word form is four and five tenths plus the quantity 3 times 2.
2. Write simple expressions that record calculations with numbers, and interpret numerical expressions without evaluating them. Example: Express the calculation “Add 8 and 7, then multiply by 2” as 2 × (8 + 7). Recognize that 12 × (7 + 91) is twelve times as large as 7 + 91, without having to calculate the indicated sum or product.
5.OA.B. Analyze patterns and relationships.
3. Generate two numerical patterns using two given rules.
a. Identify apparent relationships between corresponding terms.
b. Form ordered pairs consisting of corresponding terms from the two patterns.
c. Graph the ordered pairs on a coordinate plane.
Example: Given the rule “Add 3” and the starting number 0, and given the rule “Add 6” and the starting number 0, generate terms in the resulting sequences. Observe that the terms in one sequence are twice the corresponding terms in the other sequence and explain why this is so.
Number and Operations in Base Ten – 5.NBT 5.NBT.A. Understand the place value system.
1. Recognize that in a multi-digit number, including decimals, a digit in any place represents
ten times as much as it represents in the place to its right and 110
of what it represents in the
place to its left.
Example: In the number 55.55, each digit is 5, but the value of the digits is different because of the placement.
2. Explain patterns in the number of zeros of the product when multiplying a number by powers of ten, and explain patterns in the placement of the decimal point when a decimal is multiplied or divided by a power of ten. Use whole-number exponents to denote powers of ten.
Example: 102, which is 10 × 10 = 100, and 103, which is 10 × 10 × 10 = 1,000

CREATED 12/02/2021 DRAFT 7 – Idaho Content Standards/ Mathematics / SDE / 74
3. Read, write, and compare decimals to thousandths. a. Read and write decimals to thousandths using standard form, expanded form,
and word from.
Example: 347.392 = 3 × 100 + 4 × 10 + 7 × 1 + 3 × 110
+ 9 × 1100
+ 2 × 11,000
b. Compare two decimals to thousandths based on meanings of the digits in each place, and record the results of the comparisons using >, =, and <.
4. Use place value understanding to round decimals to any place.
5.NBT.B. Perform operations with multi-digit whole numbers and with decimals to hundredths.
5. Demonstrate fluency for multiplication of multi-digit whole numbers using the standard algorithm. Include two-digit × four-digit numbers and three-digit × three-digit numbers.
Example: What is the product of 304 and 23 using the standard algorithm?
Clarification: Fluency is reached when students are proficient, i.e., when they display accuracy, efficiency, and flexibility.
6. Find whole-number quotients of whole numbers with up to four-digit dividends and two-digit divisors.
a. Use strategies based on place value, the properties of operations, and/or the relationship between multiplication and division.
b. Illustrate and explain the calculation by using equations, rectangular arrays, and/or area models.
7. Add, subtract, multiply, and divide decimals to hundredths.
a. Use concrete models or drawings and strategies based on place value, properties of operations, and/or the relationship between addition and subtraction and between multiplication and division.
b. Relate the strategy to a written method and explain the reasoning used.
Clarification for 5.NBT.B.6 and 5.NBT.B.7: Students should be familiar with multiple strategies but should be able to select and use the strategy with which they most closely

CREATED 12/02/2021 DRAFT 7 – Idaho Content Standards/ Mathematics / SDE / 75
connect and understand, with the ultimate goal of supporting students to use more efficient strategies.
Number and Operations – Fractions – 5.NF 5.NF.A. Use equivalent fractions as a strategy to add and subtract fractions.
1. Add and subtract fractions with unlike denominators (including mixed numbers) by replacing given fractions with equivalent fractions to produce an equivalent sum or difference of fractions with like denominators.
Example: 23
+ 54
= 812
+ 1512
= 2312
. In general, 𝑎𝑎𝑏𝑏
+ 𝑐𝑐𝑑𝑑
= 𝑎𝑎𝑑𝑑+𝑏𝑏𝑐𝑐𝑏𝑏𝑑𝑑
.
2. Solve word problems involving addition and subtraction of fractions referring to the same whole (the whole can be a set of objects), including cases of unlike denominators.
a. Justify the conclusions by using visual fraction models and/or equations to represent the problem.
b. Use benchmark fractions and number sense of fraction to estimate mentally and assess the reasonableness of answers.
Example: Recognize an incorrect result 25
+ 12
= 37 by observing that 3
7< 1
2.
5.NF.B. Apply and extend previous understandings of multiplication and division to multiply and divide fractions.
3. Interpret a fraction as division of the numerator by the denominator �𝑎𝑎𝑏𝑏
= 𝑎𝑎 ÷ 𝑏𝑏�. Solve
word problems involving division of whole numbers leading to answers in the form of fractions or mixed numbers by using visual fraction models and/or equations to represent the problem.
Example: Interpret 34 as the result of dividing 3 by 4, noting that 3
4 multiplied by 4 equals 3,
and that when 3 wholes are shared equally among 4 people, each person has a share of size 34. If 𝑢𝑢𝑛𝑛𝑢𝑢𝑢𝑢 people want to share a 50-pound sack of rice equally by weight, how many
pounds of rice should each person get? Between what two whole numbers does your answer lie?
4. Apply and extend previous understandings of multiplication to multiply a fraction or whole number by a fraction.
a. Interpret the product �𝑎𝑎𝑏𝑏� × 𝑞𝑞 as 𝑎𝑎 parts of 𝑎𝑎 partitions of 𝑞𝑞 into 𝑏𝑏 equal parts,
and equivalently, as the result of the sequence of operations 𝑎𝑎 × 𝑞𝑞 ÷ 𝑏𝑏.

CREATED 12/02/2021 DRAFT 7 – Idaho Content Standards/ Mathematics / SDE / 76
Example: Use a visual model and/or area model to show �23� × 4 = 8
3 , and create a story
context for this equation. Do the same with �23� × �4
5� = 8
15. In general, �𝑎𝑎
𝑏𝑏� × �𝑐𝑐
𝑑𝑑� = 𝑎𝑎𝑐𝑐
𝑏𝑏𝑑𝑑.
b. Find the area of a rectangle with fractional side lengths. i. Tile it with unit squares of the appropriate unit fraction side lengths.
ii. Show that the area is the same by tiling as would be found by multiplying the side lengths.
iii. Multiply fractional side lengths to find areas of rectangles, and represent fraction products as rectangular areas.
5. Interpret multiplication as scaling (resizing), by:
a. Comparing the size of a fractional product to the size of one factor on the basis of the size of the other factor, without performing the indicated multiplication.
Example: Without multiplying, tell which number is greater: 225 or 34
× 225; 1150
or 32
× 1150
?
b. Explaining why multiplying a given number by a fraction greater than 1 results in a product greater than the given number, explaining why multiplying a given number by a fraction less than 1 results in a product smaller than the given
number, and relating the principle of fraction equivalence 𝑎𝑎𝑏𝑏
= 𝑛𝑛×𝑎𝑎𝑛𝑛×𝑏𝑏
to the effect
of multiplying 𝑎𝑎𝑏𝑏 by 1.
6. Solve real-world problems involving multiplication of fractions and mixed numbers by using visual fraction models and/or equations to represent the problem.
Example: Evan bought six roses for his mother, 23 of them were red. How many red roses
were there?
7. Apply and extend previous understandings of division to divide unit fractions by whole numbers and whole numbers by unit fractions.
a. Represent division of a unit fraction by a nonzero whole number and compute such quotients using a visual fraction model. Use the relationship between
multiplication and division to explain that 1𝑏𝑏
÷ 𝑐𝑐 = 1𝑏𝑏𝑐𝑐
because 1𝑏𝑏𝑐𝑐
× 𝑐𝑐 = 1𝑏𝑏.
Example: Create a story context to explain 13
÷ 4, and use a visual fraction model to show
the quotient.
b. Represent division of a whole number by a unit fraction, and compute such quotients using a visual fraction model. Use the relationship between
multiplication and division to explain that 𝑎𝑎 × 1𝑏𝑏
= 𝑎𝑎𝑏𝑏 because 𝑎𝑎𝑏𝑏 × 1𝑏𝑏
= 𝑎𝑎.

CREATED 12/02/2021 DRAFT 7 – Idaho Content Standards/ Mathematics / SDE / 77
Example: Create a story context to explain 4 ÷ 15, and use a visual fraction model to show
the quotient.
c. Solve real-world problems involving division of unit fractions by nonzero whole numbers and division of whole numbers by unit fractions by using visual fraction models and/or equations to represent the problem.
Example: How much chocolate will each person get if three people share 12 lb of chocolate
equally? How many 13 cup servings are in two cups of raisins?
Measurement and Data – 5.MD 5.MD.A. Convert like measurement units within a given measurement system.
1. Convert among different-sized standard measurement units within a given measurement system. Use conversions in solving multi-step, real-world problems.
Example: Convert 5 cm to 0.05 m.
5.MD.B. Represent and interpret data.
2. Collect, represent, and interpret numerical data, including whole numbers, and fractional and decimal values.
a. Interpret numerical data, with whole-number values, represented with tables or line plots.
b. Use graphic displays of data (line plots (dot plots), tables, etc.) to solve real-world problems using fractional data.
Example: Given different measurements of liquid in identical beakers, find the amount of liquid each beaker would contain if the total amount in all the beakers were redistributed equally.
5.MD.C. Geometric measurement: Understand concepts of volume and relate volume to multiplication and to addition.
3. Recognize volume as an attribute of solid figures and understand volume measurement in terms of cubic units.
a. A cube with side length 1 unit, called a “unit cube,” is said to have “one cubic unit” of volume, and can be used to measure volume.
b. A solid figure which can be packed without gaps or overlaps using 𝑢𝑢 unit cubes is said to have a volume of 𝑢𝑢 cubic units.

CREATED 12/02/2021 DRAFT 7 – Idaho Content Standards/ Mathematics / SDE / 78
4. Use concrete and/or visual models to measure the volume of rectangular prisms in cubic units by counting cubic cm, cubic in, cubic ft, and nonstandard units.
5. Relate volume to the operations of multiplication and addition and solve real-world and mathematical problems involving volume.
a. Find the volume of a right rectangular prism with whole-number edge lengths by packing it with unit cubes, and show that the volume is the same as would be found by multiplying the edge lengths, equivalently by multiplying the height by the area of the base.
Example: To represent the associative property of multiplication, (𝑙𝑙 × 𝑤𝑤) × ℎ =𝑙𝑙 × (𝑤𝑤 × ℎ).
b. Apply the formulas 𝑉𝑉 = 𝑙𝑙 × 𝑤𝑤 × ℎ and 𝑉𝑉 = 𝐵𝐵 × ℎ (where 𝐵𝐵 stands for the area of the base) for rectangular prisms to find volumes of right rectangular prisms with whole-number edge lengths, and in the context of solving real-world and mathematical problems.
c. Recognize volume as additive. Find volumes of solid figures composed of two non-overlapping right
rectangular prisms by adding the volumes of the non-overlapping parts.
Apply this technique to solve real-world problems.
Geometry – 5.G 5.G.A. Graph points on the coordinate plane to solve real-world and mathematical problems.
1. Describe and understand the key attributes of the coordinate plane.
a. Use a pair of perpendicular number lines (axes) with the intersection of the lines (the origin (0,0)) arranged to coincide with the 0 on each line and a given point in the plane located by using an ordered pair of numbers, called its coordinates.
b. Understand that the x-coordinate, the first number in an ordered pair, indicates movement parallel to the x-axis starting at the origin; and the y-coordinate, the second number, indicates movement parallel to the y-axis starting at the origin.
2. Represent real-world and mathematical problems by graphing points in the first quadrant of the coordinate plane (𝑥𝑥 and 𝑦𝑦 both have positive values), and interpret coordinate values of points in the context of the situation.
5.G.B. Classify two-dimensional figures into categories based on their properties.

CREATED 12/02/2021 DRAFT 7 – Idaho Content Standards/ Mathematics / SDE / 79
3. Understand that attributes belonging to a category of two-dimensional figures also belong to all of the subcategories of that category.
Example: All rectangles have four right angles and squares are rectangles, so all squares have four right angles.
4. Classify two-dimensional figures in a hierarchy based on properties.
Example: All rectangles are parallelograms because they are all quadrilaterals with two pairs of opposite sides parallel.

CREATED 12/02/2021 DRAFT 7 – Idaho Content Standards/ Mathematics / SDE / 80
SIXTH GRADE
In sixth grade, instruction is focused on the following areas: (1) connecting ratio and rate to whole-number multiplication and division, and using concepts of ratio and rate to solve problems; (2) completing understanding of division of fractions and extending the notion of number to the system of rational numbers, which includes negative numbers; (3) writing, interpreting, and using expressions and equations; (4) developing understanding of statistical thinking; and (5) reasoning about geometric shapes and their measurements.
1. Students use reasoning about multiplication and division to solve ratio and rate problems about quantities. By viewing equivalent ratios and rates as deriving from and extending pairs of rows (or columns) in the multiplication table, and by analyzing simple drawings that indicate the relative size of quantities, students connect their understanding of multiplication, division, and fractions from previous grades with ratios, rates, and percents. As students solve a wide variety of problems involving ratios and rates, they create a foundation for proportional reasoning and future work in algebra and geometry.
2. Students use the meaning of fractions, the meanings of multiplication and division, and the relationship between multiplication and division to understand and explain why the procedures for dividing fractions make sense. Students use these operations to solve problems, as well as demonstrate fluency in operations with whole numbers and decimals. Students extend their previous understandings of number and the ordering of numbers to the full system of rational numbers, which includes negative rational numbers, and in particular, negative integers. They reason about the order and absolute value of rational numbers and about the location of points in all four quadrants of the coordinate plane.
3. Students understand the use of variables in mathematical expressions. They write expressions and equations that correspond to given situations, evaluate expressions, and use expressions and formulas to solve problems. Students understand that expressions in different forms can be equivalent, and they use the properties of operations to rewrite expressions in equivalent forms. Students build on their understanding of an unknown quantity from previous grades to know that the solutions of an equation are the values of the variables that make the equation true. Students use properties of operations and the idea of maintaining the equality of both sides of an equation to solve simple one-step equations. Students construct and analyze tables, such as tables of quantities that are in equivalent ratios, and they use equations (such as 𝑦𝑦 = 3𝑥𝑥) to describe relationships between quantities.

CREATED 12/02/2021 DRAFT 7 – Idaho Content Standards/ Mathematics / SDE / 81
4. Building on and reinforcing their understanding of number, students begin to develop their ability to think statistically. Students recognize that a data distribution may not have a definite center and that different ways to measure center yield different values. The median measures center in the sense that it is roughly the middle value. The mean measures center in the sense that it is the value that each data point would take on if the total of the data values were redistributed equally, and also in the sense that it is a balance point. Students recognize that a measure of variability (interquartile range) can also be useful for summarizing data because two very different sets of data can have the same mean and median yet be distinguished by their variability. Students learn to describe and summarize numerical data sets, identifying clusters, peaks, gaps, and symmetry, considering the context in which the data were collected.
5. Students in grade six also build on their work with area in elementary school by reasoning about relationships among shapes to determine area, surface area, and volume. They find areas of right triangles, other triangles, and special quadrilaterals by decomposing these shapes, rearranging or removing pieces, and relating the shapes to rectangles. Using these methods, students discuss, develop, and justify formulas for areas of triangles and parallelograms. Students find areas of polygons and surface areas of prisms and pyramids by decomposing them into pieces whose areas they can determine. They reason about right rectangular prisms with fractional side lengths to extend formulas for the volume of a right rectangular prism to fractional side lengths.
Focus in the Standards
Not all content in a given grade is emphasized equally in the standards. Some clusters require greater emphasis than others based on the depth of the ideas, the time that they take to master, and/or their importance to future mathematics or the demands of college and career readiness. More time in these areas is also necessary for students to meet the Idaho Standards for Mathematical Practice. To say that some things have greater emphasis is not to say that anything in the standards can safely be neglected in instruction. Neglecting material will leave gaps in student skill and understanding and may leave students unprepared for the challenges of a later grade. Students should spend the large majority of their time on the major work of the grade (). Supporting work () and, where appropriate, additional work () can engage students in the major work of the grade.

CREATED 12/02/2021 DRAFT 7 – Idaho Content Standards/ Mathematics / SDE / 82
Sixth Grade Overview
Ratios and Proportional Relationships A. Understand ratio and rate concepts and use ratio and rate reasoning to solve problems.
The Number System
A. Apply and extend previous understandings of multiplication and division to divide fractions by fractions. B. Compute fluently with multi-digit numbers and find common factors and multiples. C. Apply and extend previous understandings of numbers to the system of rational numbers.
Expressions and Equations A. Apply and extend previous understandings of arithmetic to algebraic expressions. B. Reason about and solve one-variable equations and inequalities. C. Represent and analyze quantitative relationships between two variables.
Geometry
A. Solve real-world and mathematical problems involving area, surface area, and volume.
Statistics and Probability
A. Develop understanding of statistical variability. B. Summarize and describe distributions.
Mastery Standards
Mastery standards describe those standards that ask students to be able to perform mathematical calculations accurately, efficiently, and flexibly. For sixth grade these standards are:
• 6.NS.B.2 Fluently divide multi-digit numbers using the standard algorithm. • 6.NS.B.3 Fluently add, subtract, multiply, and divide multi-digit decimals using the
standard algorithm for each operation.
Standards for Mathematical Practice
1. Make sense of problems and persevere in solving them.
2. Reason abstractly and quantitatively.
3. Construct viable arguments and critique the reasoning of others.
4. Model with mathematics. 5. Use appropriate tools
strategically. 6. Attend to precision. 7. Look for and make use of
structure. 8. Look for and express regularity
in repeated reasoning.

CREATED 12/02/2021 DRAFT 7 – Idaho Content Standards/ Mathematics / SDE / 83
Sixth Grade Standards for Mathematical Practice The Standards for Mathematical Practice complement the content standards so that students increasingly engage with the subject matter as they grow in mathematical maturity and expertise throughout the K – 12 education years.
MP.1 Make sense of problems and persevere in solving them. In grade six, students solve problems involving ratios and rates and discuss how they solved them. Students solve real-world problems through the application of algebraic and geometric concepts. Students seek the meaning of a problem and look for efficient ways to represent and solve it. They may check their thinking by asking themselves, “What is the most efficient way to solve the problem?”, “Does this make sense?”, and “Can I solve the problem in a different way?”. Students can explain the relationships between equations, verbal descriptions, and tables and graphs. Mathematically proficient students check their answers to problems using a different method.
MP.2 Reason abstractly and quantitatively. In grade six, students represent a wide variety of real-world contexts through the use of real numbers and variables in mathematical expressions, equations, and inequalities. Students contextualize to understand the meaning of the number or variable as related to the problem and decontextualize to manipulate symbolic representations by applying properties of operations or other meaningful moves. To reinforce students’ reasoning and understanding, teachers might ask, “How do you know?” or “What is the relationship of the quantities?”.
MP.3 Construct viable arguments and critique the reasoning of others. In grade six, students construct arguments using verbal or written explanations accompanied by expressions, equations, inequalities, models, and graphs, tables, and other data displays (e.g., box plots, dot plots, and histograms). They further refine their mathematical communication skills through mathematical discussions in which they critically evaluate their own thinking and the thinking of other students. They pose questions like “How did you get that?”, “Why is that true?”, and “Does that always work?”. They explain their thinking to others and respond to others’ thinking.
MP.4 Model with mathematics. In grade six, students model problem situations symbolically, graphically, in tables, contextually, and visually. Students form expressions, equations, or inequalities from real-world contexts and connect symbolic and graphical representations. Students begin to represent two quantities simultaneously. Students use number lines to compare numbers and represent inequalities.

CREATED 12/02/2021 DRAFT 7 – Idaho Content Standards/ Mathematics / SDE / 84
They use measures of center and variability and data displays (e.g. box plots and histograms) to draw inferences about and make comparisons between data sets. Students need many opportunities to connect and explain the connections between the different representations. They should be able to use all of these representations as appropriate and apply them to a problem context. Students should be encouraged to answer questions such as “What are some ways to represent the quantities?” or “What formula might apply in this situation?”
MP.5 Use appropriate tools strategically. Students consider available tools (including estimation and technology) when solving a mathematical problem and decide when certain tools might be helpful. For instance, students in grade six may decide to represent figures on the coordinate plane to calculate area. Number lines are used to create dot plots, histograms, and box plots to visually compare the center and variability of the data. Visual fraction models can be used to represent situations involving division of fractions. Additionally, students might use physical objects or applets to construct nets and calculate the surface area of three-dimensional figures. Students should be encouraged to answer questions such as “What approach did you try first?” or “Why was it helpful to use?”
MP.6 Attend to precision. In grade six, students continue to refine their mathematical communication skills by using clear and precise language in their discussions with others and in their own reasoning. Students use appropriate terminology when referring to rates, ratios, geometric figures, data displays, and components of expressions, equations, or inequalities. When using ratio reasoning in solving problems, students are careful about specifying units of measure and labeling axes to clarify the correspondence with quantities in a problem. Students also learn to express numerical answers with an appropriate degree of precision when working with rational numbers in a situational problem. Teachers might ask, “What mathematical language, definitions, or properties can you use to explain ___?”
MP.7 Look for and make use of structure. Students routinely seek patterns or structures to model and solve problems. For instance, students recognize patterns that exist in ratio tables, recognizing both the additive and multiplicative properties. Students apply properties to generate equivalent expressions (e.g. 6 + 2𝑢𝑢 = 2(3 + 𝑢𝑢) by the distributive property) and solve equations (e.g. 2𝑐𝑐 + 3 = 15, 2𝑐𝑐 = 12 by the subtraction property of equality; 𝑐𝑐 = 6 by the division property of equality). Students compose and decompose two- and three-dimensional figures to solve real-world problems involving area and volume. Teachers might ask, “What do you notice when ___?” or “What parts of the problem might you eliminate, simplify, or ___?”

CREATED 12/02/2021 DRAFT 7 – Idaho Content Standards/ Mathematics / SDE / 85
MP.8 Look for and express regularity in repeated reasoning. In grade six, students use repeated reasoning to understand algorithms and make generalizations about patterns. During multiple opportunities to solve and model problems,
they may notice that 𝑎𝑎𝑏𝑏
÷ 𝑐𝑐𝑑𝑑
= 𝑎𝑎𝑑𝑑𝑏𝑏𝑐𝑐
and construct other examples and models that confirm their
generalization. Students connect place value and their prior work with operations to understand algorithms to fluently divide multi-digit numbers and perform all operations with multi-digit decimals. Students informally begin to make connections between rates and representations showing the relationships between quantities. Students should be encouraged to answer questions such as “How would we prove that ___?” or “How is this situation like and different from other situations?”

CREATED 12/02/2021 DRAFT 7 – Idaho Content Standards/ Mathematics / SDE / 86
Ratios and Proportional Relationships – 6.RP 6.RP.A. Understand ratio and rate concepts and use ratio and rate reasoning to solve problems.
1. Understand the concept of a ratio and use ratio language to describe a ratio relationship between two quantities.
Examples:
1) The ratio of wings to beaks in the bird house at the zoo was 2: 1, because for every two wings there was one beak.
2) For every vote candidate A received, candidate C received nearly three votes, meaning that candidate C received approximately three times the number of votes as candidate A, or
candidate A received approximately 13 of the number of votes that candidate C received.
2. Understand the concept of a unit rate 𝑎𝑎𝑏𝑏 associated with a ratio 𝑎𝑎: 𝑏𝑏 with 𝑏𝑏 ≠ 0, and use rate
language in the context of a ratio relationship.
Example: This recipe has a ratio of three cups of flour to four cups of sugar, so there is 34 cup
of flour for each cup of sugar. We paid $75 for 15 hamburgers, which is a rate of five dollars per hamburger.
3. Use ratio and rate reasoning to solve real-world and mathematical problems, e.g., by reasoning about tables of equivalent ratios, tape diagrams, double number line diagrams, or equations.
a. Make tables of equivalent ratios relating quantities with whole-number measurements, find missing values in the tables, and plot the pairs of values on the coordinate plane. Use tables to compare ratios.
b. Solve unit-rate problems, including those involving unit pricing and constant speed.
Example: If it took 7 hours to mow 4 lawns, then at that rate, how many lawns could be mowed in 35 hours? At what rate were lawns being mowed?
c. Find a percent of a quantity as a rate per 100; solve problems involving finding the whole, given a part and the percent.
Example: 30% of a quantity means 30100
times the quantity.
d. Use ratio reasoning to convert measurement units within and between measurement systems; manipulate and transform units appropriately when multiplying or dividing quantities.

CREATED 12/02/2021 DRAFT 7 – Idaho Content Standards/ Mathematics / SDE / 87
Examples:
1) Malik is making a recipe, but he cannot find his measuring cups! He has, however, found a tablespoon. His cookbook says that 1 cup = 16 tablespoons. Explain how he could use the
tablespoon to measure out the following ingredients: two cups of flour, 12 cup sunflower
seeds, and 1 14 cup of oatmeal.
2) Jessica is building a doghouse out of wooden planks. If the instructions say the house is 30 inches long, how long would the doghouse be using metric measurements (1 in = 2.54 cm)?
The Number System – 6.NS 6.NS.A. Apply and extend previous understandings of multiplication and division to divide fractions by fractions.
1. Interpret and compute quotients of fractions, and solve word problems involving division of fractions by fractions, e.g., by using visual fraction models and equations to represent the problem.
Examples:
1) Create a story context for 23
÷ 34 and use a visual fraction model to show the quotient.
2) Use the relationship between multiplication and division to explain that 23
÷ 34
= 89
because 34 of 8
9 is 2
3. In general, 𝑎𝑎
𝑏𝑏÷ 𝑐𝑐
𝑑𝑑= 𝑎𝑎𝑑𝑑
𝑏𝑏𝑐𝑐.
3) After hiking 6 12 miles along the Salmon River, Fred realized he had traveled 3
4 of the way to
his campsite. What is the total distance Fred will end up traveling during his hike?
4) How many 34 cup servings are in 2
3 of a cup of yogurt?
5) How wide is a rectangular strip of land with length 34 mi and area 1
2 square mi?
6.NS.B. Compute fluently with multi-digit numbers and find common factors and multiples.
2. Fluently divide multi-digit numbers using the standard algorithm. Example: What is the quotient of 657 and 3 using the standard algorithm?

CREATED 12/02/2021 DRAFT 7 – Idaho Content Standards/ Mathematics / SDE / 88
3. Fluently add, subtract, multiply, and divide multi-digit decimals using the standard algorithm for each operation.
Example: What is the difference of 1.82 and 0.06 using the standard algorithm?
4. Find the greatest common factor of two whole numbers less than or equal to 100 and the least common multiple of two whole numbers less than or equal to 12. Use the distributive property to express a sum of two whole numbers 1–100 with a common factor as a multiple of a sum of two whole numbers with no common factor.
Example: Express 36 + 8 as 4(9 + 2).
6.NS.C. Apply and extend previous understandings of numbers to the system of rational numbers.
5. Understand that positive and negative numbers are used together to describe quantities having opposite directions or values. Use positive and negative numbers (including fractions and decimals) to represent quantities in real-world contexts, explaining the meaning of zero in each situation.
Examples: Temperature above/below zero, elevation above/below sea level, credits/debits, and positive/negative electric charge
6. Understand a rational number as a point on the number line. Extend number line diagrams and coordinate axes familiar from previous grades to represent points on the line and in the plane with negative number coordinates.
a. Recognize opposite signs of numbers as indicating locations on opposite sides of 0 on the number line; recognize that the opposite of the opposite of a number is the number itself, e.g., −(−3) = 3, and that 0 is its own opposite.
b. Understand signs of numbers in ordered pairs as indicating locations in quadrants of the coordinate plane; recognize that when two ordered pairs differ

CREATED 12/02/2021 DRAFT 7 – Idaho Content Standards/ Mathematics / SDE / 89
only by signs, the locations of the points are related by reflections across one or both axes.
c. Find and position integers and other rational numbers on a horizontal or vertical number line diagram; find and position pairs of integers and other rational numbers on a coordinate plane.
7. Understand ordering and absolute value of rational numbers.
a. Interpret statements of inequality as statements about the relative position of two numbers on a number line diagram.
Examples: Interpret −3.7 > −7 12 as a statement that −3.7 is located to the right of −7 1
2 on
a number line oriented from left to right.
b. Write, interpret, and explain statements of order for rational numbers in real-world contexts.
Example: Write −3°C> −7°C to express the fact that −3°C is warmer than −7° C.
c. Understand the absolute value of a rational number as its distance from 0 on the number line; interpret absolute value as magnitude for a positive or negative quantity in a real-world situation.
Example: For an account balance of −30 dollars, write |−30| = 30 to describe the size of the debt in dollars.
d. Distinguish comparisons of absolute value from statements about order.
Example: Recognize that an account balance less than −30 dollars represents a debt greater than 30 dollars.
8. Solve real-world and mathematical problems by graphing points in all four quadrants of the coordinate plane. Include use of coordinates and absolute value to find distances between points with the same first coordinate or the same second coordinate.
Example: Samuel draws a coordinate plane on a map of his neighborhood. He found that the distance between two consecutive whole-number points is one block. His house is located at (−4, 6), and his school is located at (−4,−3). How many blocks are between Samuel’s house and school?
Expressions and Equations – 6.EE 6.EE.A. Apply and extend previous understandings of arithmetic to algebraic expressions.
1. Write and evaluate numerical expressions involving whole-number exponents.

CREATED 12/02/2021 DRAFT 7 – Idaho Content Standards/ Mathematics / SDE / 90
2. Write, read, and evaluate expressions in which letters stand for numbers.
a. Write expressions that record operations with numbers and with letters standing for numbers.
Example: Express the calculation “Subtract 𝑦𝑦 from 5” as 5 − 𝑦𝑦.
b. Identify parts of an expression using mathematical terms (e.g. sum, term, product, factor, quotient, coefficient); view one or more parts of an expression as a single entity.
Example: Describe the expression 2(8 + 7) as a product of two factors; view (8 + 7) as both a single entity and a sum of two terms.
c. Evaluate expressions at specific values of their variables. Include expressions that arise from formulas used in real-world problems. Perform arithmetic operations, including those involving whole-number exponents, in the conventional order when there are no parentheses to specify a particular order (Order of Operations).
Examples:
1) Use the formulas 𝑉𝑉 = 𝑢𝑢3 and 𝐴𝐴 = 6𝑢𝑢2 to find the volume (V) and surface area (A) of a
cube with sides of length 𝑢𝑢 = 12.
2) The formula for finding the perimeter of a rectangle is 𝑃𝑃 = 2𝑙𝑙 + 2𝑤𝑤. Find the perimeter of a rug that measures 7.5 ft by 9.5 ft.
3. Apply the properties of operations to generate equivalent expressions.
Examples:
1) Apply the distributive property to the expression 3(2 + 𝑥𝑥) to produce the equivalent expression 6 + 3𝑥𝑥.
2) Apply the distributive property to the expression 24𝑥𝑥 + 18𝑦𝑦 to produce the equivalent expression 6(4𝑥𝑥 + 3𝑦𝑦).
3) Apply properties of operations to 𝑦𝑦 + 𝑦𝑦 + 𝑦𝑦 to produce the equivalent expression 3𝑦𝑦.
4. Identify when two expressions are equivalent (i.e., when the two expressions name the same number regardless of which value is substituted into them).
Example: The expressions 𝑦𝑦 + 𝑦𝑦 + 𝑦𝑦 and 3𝑦𝑦 are equivalent because they name the same number regardless of the numeric value of 𝑦𝑦.
6.EE.B. Reason about and solve one-variable equations and inequalities.

CREATED 12/02/2021 DRAFT 7 – Idaho Content Standards/ Mathematics / SDE / 91
5. Understand solving an equation or inequality as a process of answering a question: Which values from a specified set, if any, make the equation or inequality true? Use substitution to determine whether a given number in a specified set makes an equation or inequality true.
6. Use variables to represent numbers and write expressions when solving a real-world or mathematical problem; understand that a variable can represent an unknown number, or depending on the purpose at hand, any number in a specified set.
7. Solve real-world and mathematical problems by writing and solving equations of the form 𝑥𝑥 + 𝑝𝑝 = 𝑞𝑞 and 𝑝𝑝𝑥𝑥 = 𝑞𝑞 for cases in which 𝑝𝑝, 𝑞𝑞, and 𝑥𝑥 are all nonnegative rational numbers.
8. Write an inequality of the form 𝑥𝑥 > 𝑐𝑐 or 𝑥𝑥 < 𝑐𝑐 to represent a constraint or condition in a real-world or mathematical problem.
a. Recognize that inequalities of the form 𝑥𝑥 > 𝑐𝑐 or 𝑥𝑥 < 𝑐𝑐 have infinitely many solutions.
b. Represent solutions of such inequalities on number line diagrams.
6.EE.C. Represent and analyze quantitative relationships between two variables.
9. Use variables to represent two quantities in a real-world problem that change in relationship to one another; write equations to represent the relationship between the two quantities. Analyze the relationship using graphs and tables and relate these to the equations. Include an understanding of independent and dependent variables.
Examples:
1) In a problem involving mixing water (𝑊𝑊) and orange concentrate (𝐶𝐶) to make a consistent flavor of orange juice, list and graph ordered pairs of cups of water and orange concentrate,
and write the equations (e.g., 𝐶𝐶 = 12∙ 𝑊𝑊 or 𝑊𝑊 = 2 ∙ 𝐶𝐶) to represent the relationship between
water (𝑊𝑊) and orange concentrate (𝐶𝐶).
2) When examining the relationship between time and the growth of a plant, time tends to be thought of as the independent variable and the height of the plant tends to be thought of as the dependent variable.
Geometry – 6.G 6.G.A. Solve real-world and mathematical problems involving area, surface area, and volume.
1. Find the area of right triangles, other triangles, special quadrilaterals, and polygons by composing into rectangles or decomposing into triangles and other shapes; apply these techniques in the context of solving real-world and mathematical problems.

CREATED 12/02/2021 DRAFT 7 – Idaho Content Standards/ Mathematics / SDE / 92
2. Find the volume of a right rectangular prism with fractional edge lengths by packing it with unit cubes of the appropriate unit fraction edge lengths and show that the volume is the same as would be found by multiplying the edge lengths of the prism. Apply the formulas 𝑉𝑉 = 𝑙𝑙𝑤𝑤ℎ and 𝑉𝑉 = 𝐵𝐵ℎ to find volumes of right rectangular prisms with fractional edge lengths in the context of solving real-world and mathematical problems.
3. Draw polygons in the coordinate plane given coordinates for the vertices; use coordinates to find the length of a side and area by joining points with the same first coordinate or the same second coordinate. Apply these techniques in the context of solving real-world and mathematical problems.
4. Represent three-dimensional figures using nets made up of rectangles and triangles and use the nets to find the surface area of these figures. Apply these techniques in the context of solving real-world and mathematical problems.
Example: Explain how you could find the surface area of a rectangular prism given a three-dimensional representation (Fig. A) or a net (Fig. B).
Statistics and Probability – 6.SP 6.SP.A. Develop understanding of statistical variability.
1. Recognize a statistical question as one that anticipates variability in the data related to the question and accounts for it in the answers.
Example: “How old am I?” is not a statistical question, but “How old are the students in my school?” is a statistical question because one anticipates variability in students’ ages.
2. Understand that a set of data collected to answer a statistical question has a distribution, which can be described by its center (median and/or mean), spread (range, interquartile range, and/or mean absolute deviation), and overall shape. The focus of mean absolute deviation (MAD) is visualizing deviations from the mean as a measure of variability as opposed to a focus on calculating MAD.

CREATED 12/02/2021 DRAFT 7 – Idaho Content Standards/ Mathematics / SDE / 93
3. Recognize that a measure of center for a numerical data set summarizes all of its values with a single number, while a measure of variation describes how its values vary with a single number.
6.SP.B. Summarize and describe distributions.
4. Display numerical data in plots on a number line, including dot plots, histograms, and box plots.
5. Summarize numerical data sets in relation to their context, such as by: a. Reporting the number of observations.
b. Describing the nature of the attribute under investigation, including how it was measured and its units of measurement.
c. Giving quantitative measures of center (median, and/or mean) and variability (range, interquartile range, and/or mean absolute deviation), as well as describing any overall pattern and any striking deviations from the overall pattern with reference to the context in which the data were gathered.
d. Relating the choice of measures of center and variability to the shape of the data distribution and the context in which the data were gathered.
Examples: Bobbie is a sixth grader who competes in the 100 meter hurdles. In eight track meets during the season, she recorded the following times (to the nearest one hundredth of a second).
18.11, 31.23, 17.99, 18.25, 17.50, 35.55, 17.44, 17.85
Is the mean or the median a better representation of Bobbie’s hurdle time? Justify your answer. (From Illustrative Mathematics.)

CREATED 12/02/2021 DRAFT 7 – Idaho Content Standards/ Mathematics / SDE / 94
SEVENTH GRADE
In seventh grade, instruction is focused on the following areas: (1) developing understanding of and applying proportional relationships; (2) developing understanding of operations with rational numbers and working with expressions and linear equations; (3) solving problems involving scale drawings and informal geometric constructions, and working with two- and three-dimensional shapes to solve problems involving area, surface area, and volume; and (4) drawing inferences about populations based on samples.
1. Students extend their understanding of ratios and rates and develop understanding of proportionality to solve single- and multi-step problems. Students use their understanding of ratios, rates, and proportionality to solve a wide variety of percent problems, including those involving discounts, interest, taxes, tips, and percent increase or decrease. Students solve problems about scale drawings by relating corresponding lengths between the objects or by using the fact that relationships of lengths within an object are preserved in similar objects. Students graph proportional relationships and understand the unit rate informally as a measure of the steepness of the related line (constant of proportionality). They distinguish proportional relationships from other relationships.
2. Students develop a unified understanding of number, recognizing fractions, decimals (that have a finite or a repeating decimal representation), and percents as different representations of rational numbers. Students extend addition, subtraction, multiplication, and division to all rational numbers, maintaining the properties of operations and the relationships between addition and subtraction, and multiplication and division. By applying these properties, and by viewing negative numbers in terms of everyday contexts (e.g., amounts owed or temperatures below zero), students explain and interpret the rules for adding, subtracting, multiplying, and dividing with negative numbers. They use the arithmetic of rational numbers as they formulate expressions, equations, and inequalities in one variable. Students also solve real-world and multi-step equations and inequalities.
3. Students continue their work with area from grade six, solving problems involving the area and circumference of a circle and surface area of three-dimensional objects. In preparation for work on congruence and similarity in grade eight, they reason about relationships among two-dimensional figures using scale drawings and informal geometric constructions, and they gain familiarity with the relationships between angles formed by intersecting lines. Students work with three-dimensional figures, relating them to two-dimensional figures by examining cross-sections. They solve real-world and mathematical problems involving area, surface area, and volume of two- and three-

CREATED 12/02/2021 DRAFT 7 – Idaho Content Standards/ Mathematics / SDE / 95
dimensional objects composed of triangles, quadrilaterals, polygons, cubes, and right prisms.
4. Students build on their previous work with single data distributions to compare two data distributions and address questions about differences between populations. They begin informal work with random sampling to generate data sets and learn about the importance of representative samples for drawing inferences. In grade seven the concept of probability is introduced, and it is explored in later grades.
Focus in the Standards
Not all content in a given grade is emphasized equally in the standards. Some clusters require greater emphasis than others based on the depth of the ideas, the time that they take to master, and/or their importance to future mathematics or the demands of college and career readiness. More time in these areas is also necessary for students to meet the Idaho Standards for Mathematical Practice. To say that some things have greater emphasis is not to say that anything in the standards can safely be neglected in instruction. Neglecting material will leave gaps in student skill and understanding and may leave students unprepared for the challenges of a later grade. Students should spend the large majority of their time on the major work of the grade (). Supporting work () and, where appropriate, additional work () can engage students in the major work of the grade.

CREATED 12/02/2021 DRAFT 7 – Idaho Content Standards/ Mathematics / SDE / 96
Seventh Grade Overview
Ratios and Proportional Relationships A. Analyze proportional relationships and use them to solve real-world and mathematical problems.
The Number System
A. Apply and extend previous understandings of operations with fractions to add, subtract, multiply, and divide rational numbers.
Expressions and Equations
A. Use properties of operations to generate equivalent expressions. B. Solve real-life and mathematical problems using numerical and algebraic expressions and equations.
Geometry
A. Draw, construct, and describe geometrical figures and describe the relationships between them. B. Solve real-life and mathematical problems involving angle measure, area, surface area, and volume.
Statistics and Probability
A. Use random sampling to draw inferences about a population. B. Draw informal comparative inferences about two populations. C. Investigate chance processes and develop, use, and evaluate probability models.
Mastery Standards
Mastery standards describe those standards that ask students to be able to perform mathematical calculations accurately, efficiently, and flexibly. For seventh grade this standard is:
• 7.NS.A.3 Solve real-world and mathematical problems involving the four operations with integers and other rational numbers.
Standards for Mathematical Practice
1. Make sense of problems and persevere in solving them.
2. Reason abstractly and quantitatively.
3. Construct viable arguments and critique the reasoning of others.
4. Model with mathematics. 5. Use appropriate tools
strategically. 6. Attend to precision. 7. Look for and make use of
structure. 8. Look for and express regularity
in repeated reasoning.

CREATED 12/02/2021 DRAFT 7 – Idaho Content Standards/ Mathematics / SDE / 97
Seventh Grade Standards for Mathematical Practice The Standards for Mathematical Practice complement the content standards so that students increasingly engage with the subject matter as they grow in mathematical maturity and expertise throughout the K – 12 education years.
MP.1 Make sense of problems and persevere in solving them. In seventh grade, students solve problems involving ratios and rates and discuss how they solved them. Students solve real-world problems through the application of algebraic and geometric concepts. Students seek the meaning of a problem and look for efficient ways to represent and solve it. They may check their thinking by asking themselves, “What is the most efficient way to solve the problem?”, “Does this make sense?”, and “Can I solve the problem in a different way?”. When students compare arithmetic and algebraic solutions to the same problem, they identify correspondences between different approaches.
MP.2 Reason abstractly and quantitatively. In seventh grade, students represent a wide variety of real-world contexts through the use of real numbers and variables in mathematical expressions, equations, and inequalities. Students contextualize to understand the meaning of the number or variable as related to the problem and decontextualize to manipulate symbolic representations by applying properties of operations.
MP.3 Construct viable arguments and critique the reasoning of others. In seventh grade, students construct arguments using verbal or written explanations accompanied by expressions; equations; inequalities; models; and graphs, tables, and other data displays (e.g. box plots, dot plots, and histograms). They further refine their mathematical communication skills through mathematical discussions in which they critically evaluate their own thinking and the thinking of other students. For example, as students notice when geometric conditions determine a unique triangle, more than one triangle, or no triangle, they have an opportunity to construct viable arguments and critique the reasoning of others. Students should be encouraged to answer questions such as these: “How did you get that?”, “Why is that true?”, and “Does that always work?”. They explain their thinking to others and respond to others’ thinking.
MP.4 Model with mathematics. In seventh grade, students model problem situations visually, symbolically, graphically, in tables, and contextually. Students form expressions, equations, or inequalities from real-world contexts and connect symbolic and graphical representations. Students use experiments or simulations to generate data sets and create probability models. Proportional relationships

CREATED 12/02/2021 DRAFT 7 – Idaho Content Standards/ Mathematics / SDE / 98
present opportunities for modeling. For example, for modeling purposes, the number of people who live in an apartment building might be taken as proportional to the number of stories in the building. Students should be encouraged to answer questions such as “What are some ways to represent the quantities?” or “How might it help to create a table, chart, or graph?”
MP.5 Use appropriate tools strategically. Students consider available tools (including estimation and technology) when solving a mathematical problem and decide when certain tools might be helpful. For instance, students in seventh grade may decide to represent similar data sets using dot plots with the same scale to visually compare the center and variability of the data. Students might use physical objects or applets to generate probability data and use graphing calculators or spreadsheets to manage and represent data in different forms. Teachers might ask, “What approach are you considering?” or “Why was it helpful to use ___?”
MP.6 Attend to precision. In seventh grade, students continue to refine their mathematical communication skills by using clear and precise language in their discussions with others and in their own reasoning. Students define variables, specify units of measure, and label axes accurately. Students use appropriate terminology when referring to rates; ratios; probability models; geometric figures; data displays; and components of expressions, equations, or inequalities. Teachers might ask, “What mathematical language, definitions, or properties can you use to explain ___?”
MP.7 Look for and make use of structure. Students routinely seek patterns or structures to model and solve problems. For instance, students recognize patterns that exist in ratio tables, making connections between the constant of proportionality in a table with the slope of a graph. Students apply properties to generate equivalent expressions (i.e. 6 + 2𝑢𝑢 = 2(3 + 𝑢𝑢) by the distributive property) and solve equations (e.g. 2𝑐𝑐 + 3 = 15, 2𝑐𝑐 = 12 by the subtraction property of equality; 𝑐𝑐 = 6 by the division property of equality). Students compose and decompose two- and three-dimensional figures to solve real-world problems involving scale drawings, surface area, and volume. Students examine tree diagrams or systematic lists to determine the sample space for compound events and verify that they have listed all possibilities. Solving an equation such as
8 = 4 �𝑢𝑢 − 12� is easier if students can see and make use of structure, temporarily viewing
�𝑢𝑢 − 12� as a single entity.
MP.8 Look for and express regularity in repeated reasoning. In seventh grade, students use repeated reasoning to understand algorithms and make generalizations about patterns. During multiple opportunities to solve and model

CREATED 12/02/2021 DRAFT 7 – Idaho Content Standards/ Mathematics / SDE / 99
problems, they may notice that 𝑎𝑎𝑏𝑏
= 𝑐𝑐𝑑𝑑
if and only if 𝑎𝑎𝑢𝑢 = 𝑏𝑏𝑐𝑐 and construct other examples and
models that confirm their generalization. Students should be encouraged to answer questions such as “How would we prove that ___?” or “How is this situation both similar to and different from other situations using these operations?”

CREATED 12/02/2021 DRAFT 7 – Idaho Content Standards/ Mathematics / SDE / 100
Ratios and Proportional Relationships – 7.RP 7.RP.A. Analyze proportional relationships and use them to solve real-world and mathematical problems.
1. Compute unit rates associated with ratios of fractions, including ratios of lengths, areas and other quantities measured in like or different units.
Example: If a person walks 12 mile in each 1
4 hour, compute the unit rate as the complex
fraction 12�
14� miles per hour, equivalently 2 miles per hour.
2. Recognize and represent proportional relationships between quantities.
a. Decide whether two quantities are in a proportional relationship, e.g., by testing for equivalent ratios in a table or graphing on a coordinate plane and observing whether the graph is a straight line through the origin.
b. Identify the constant of proportionality in tables, graphs, equations, diagrams, and verbal descriptions of proportional relationships. Recognize the constant of proportionality as both the unit rate and as the multiplicative comparison between two quantities.
c. Represent proportional relationships by equations.
Example: If total cost 𝑡𝑡 is proportional to the number 𝑢𝑢 of items purchased at a constant price 𝑝𝑝, the relationship between the total cost and the number of items can be expressed as 𝑡𝑡 = 𝑝𝑝𝑢𝑢.
d. Explain what a point (𝑥𝑥,𝑦𝑦) on the graph of a proportional relationship means in terms of the situation, with special attention to the points (0, 0) and (1, 𝑢𝑢) where 𝑢𝑢 is the unit rate.
3. Use proportional relationships to solve multi-step ratio, rate, and percent problems.
Examples: Simple interest, tax, price increases and discounts, gratuities and commissions, fees, percent increase and decrease, percent error
The Number System – 7.NS 7.NS.A. Apply and extend previous understandings of operations with fractions to add, subtract, multiply, and divide rational numbers.
1. Apply and extend previous understandings of addition and subtraction to add and subtract integers and other rational numbers; represent addition and subtraction on a horizontal or vertical number line diagram.

CREATED 12/02/2021 DRAFT 7 – Idaho Content Standards/ Mathematics / SDE / 101
a. Describe situations in which opposite quantities combine to make zero.
Example: If you open a new bank account with a deposit of $30.52 and then withdraw $30.52, you are left with a $0 balance.
b. Understand 𝑝𝑝 + 𝑞𝑞 as the number located a distance |𝑞𝑞| from 𝑝𝑝, in the positive or negative direction depending on whether 𝑞𝑞 is positive or negative. Show that a number and its opposite are additive inverses because they have a sum of 0 (e.g., 12.5 + (−12.5) = 0). Interpret sums of rational numbers by describing real-world contexts.
c. Understand subtraction of rational numbers as adding the additive inverse, 𝑝𝑝 −𝑞𝑞 = 𝑝𝑝 + (−𝑞𝑞). Show that the distance between two rational numbers on the number line is the absolute value of their difference, and apply this principle in real-world contexts.
d. Apply properties of operations as strategies to add and subtract rational numbers.
Example: 14− 5 + 3
4+ 7 = �1
4+ 3
4� + �(−5) + 5� + 2
2. Apply and extend previous understandings of multiplication and division and of fractions to multiply and divide integers and other rational numbers.
a. Understand that multiplication is extended from fractions to rational numbers by requiring that operations continue to satisfy the properties of operations,
particularly the distributive property, leading to products such as �− 12� (−1) = 1
2
and the rules for multiplying signed numbers. Interpret products of rational numbers by describing real-world contexts.
b. Understand that integers can be divided, provided that the divisor is not zero, and every quotient of integers (with nonzero divisor) is a rational number. If 𝑝𝑝
and 𝑞𝑞 are integers, then −�𝑝𝑝𝑞𝑞� = −(𝑝𝑝)
𝑞𝑞= 𝑝𝑝
−(𝑞𝑞). Interpret quotients of rational
numbers by describing real- world contexts. Interpret quotients of rational numbers by describing real-world contexts.
c. Apply properties of operations as strategies to multiply and divide rational numbers.
Example: −4(0.25 − 1) = �(−4) × 0.25� + �(−4) × (−1)� = −1 + 4 = 3
d. Convert a rational number to a decimal using long division; know that the decimal form of a rational number terminates or eventually repeats.

CREATED 12/02/2021 DRAFT 7 – Idaho Content Standards/ Mathematics / SDE / 102
3. Solve real-world and mathematical problems involving the four operations with integers and other rational numbers.
Example: A water well drilling rig has dug to a depth of −60 feet after one full day of continuous use. If the rig has been running constantly and is currently at a depth of −143.6 feet, for how long has the rig been running? (Modified from Illustrative Mathematics.)
Expressions and Equations – 7.EE 7.EE.A. Use properties of operations to generate equivalent expressions.
1. Apply properties of operations to add, subtract, factor, and expand linear expressions with rational coefficients.
Example: 4𝑥𝑥 + 2 = 2(2𝑥𝑥 + 1) and −3 �𝑥𝑥 − 53� = −3𝑥𝑥 + 5
2. Understand that rewriting an expression in different forms in a problem context can shed light on the problem and how the quantities in it are related.
Examples:
1) 𝑎𝑎 + 0.05𝑎𝑎 = 1.05𝑎𝑎 means that “increase by 5%” is the same as “multiply by 1.05.”
2) A shirt at a clothing store is on sale for 20% off the regular price, 𝑝𝑝. The discount can be expressed as 0.2𝑝𝑝. The new price for the shirt can be expressed as 𝑝𝑝 − 0.2𝑝𝑝 or 0.8𝑝𝑝.
7.EE.B. Solve real-life and mathematical problems using numerical and algebraic expressions and equations.
3. Solve multi-step real-life and mathematical problems posed with positive and negative rational numbers in any form (integers, fractions, and decimals). Apply properties of operations to calculate with numbers in any form; convert between forms as appropriate; and assess the reasonableness of answers using mental computation and estimation strategies.
Examples:
1) If a woman making $25 per hour gets a 10% raise, she will make an additional 110
of her
salary an hour, or $2.50, for a new salary of $27.50.
2) If you want to place a towel bar 9 34 inches long in the center of a door that is 27 1
2 inches
wide, you will need to place the bar about nine inches from each edge; this estimate can be used as a check on the exact computation.

CREATED 12/02/2021 DRAFT 7 – Idaho Content Standards/ Mathematics / SDE / 103
4. Use variables to represent quantities in a real-world or mathematical problem, and construct simple equations and inequalities to solve problems by reasoning about the quantities.
a. Solve word problems leading to equations of the form 𝑝𝑝𝑥𝑥 + 𝑞𝑞 = 𝑢𝑢 and 𝑝𝑝(𝑥𝑥 + 𝑞𝑞) = 𝑢𝑢, where 𝑝𝑝, 𝑞𝑞, and 𝑢𝑢 are specific rational numbers. Solve equations of these forms fluently. Compare an algebraic solution to an arithmetic solution, identifying the sequence of the operations used in each approach.
Example: The perimeter of a rectangle is 54 cm. Its width is 6 cm. What is its length?
b. Solve word problems leading to inequalities of the form 𝑝𝑝𝑥𝑥 + 𝑞𝑞 > 𝑢𝑢 or 𝑝𝑝𝑥𝑥 + 𝑞𝑞 <𝑢𝑢, where 𝑝𝑝, 𝑞𝑞, and 𝑢𝑢 are specific rational numbers. Graph the solution set of the inequality and interpret it in the context of the problem.
Example: As a salesperson, you are paid $50 per week plus $3 per sale. This week you want your pay to be at least $100. Write an inequality for the number of sales you need to make, and describe the solutions.
Geometry – 7.G 7.G.A. Draw, construct, and describe geometrical figures and describe the relationships between them.
1. Solve problems involving scale drawings of geometric figures, including computing actual lengths and areas from a scale drawing and reproducing a scale drawing at a different scale.
Example: Mariko has an 14 inch scale drawing (1
4 inch=1 foot) of the floor plan of her house.
On the floor plan, the scaled dimensions of her rectangular living room are 4 12 inches by 8 3
4
inches. What is the area of her living room in square feet?
2. Draw (freehand, with ruler and protractor, and with technology) two-dimensional geometric shapes with given conditions. Focus on constructing triangles from three measures of angles or sides, noticing when the conditions determine unique triangles, more than one triangle, or no triangle.
Example: A triangle with side lengths 3 cm, 4 cm, and 5 cm exists. Use a compass and ruler to draw a triangle with these side lengths. (Modified from Engage NY M6L9.)
3. Describe the shape of the two-dimensional face of the figure that results from slicing three-dimensional figures, as in plane sections of right rectangular prisms and right rectangular pyramids.

CREATED 12/02/2021 DRAFT 7 – Idaho Content Standards/ Mathematics / SDE / 104
7.G.B. Solve real-life and mathematical problems involving angle measure, area, surface area, and volume.
4. Understand the attributes and measurements of circles.
a. Know that a circle is a two-dimensional shape created by connecting all of the points equidistant from a fixed point called the center of the circle.
b. Develop an understanding of circle attributes including radius, diameter, circumference, and area and investigate the relationships between each.
c. Informally derive and know the formulas for the area and circumference of a circle and use them to solve problems.
5. Use facts about supplementary, complementary, vertical, and adjacent angles to write equations and use them to solve for an unknown angle in a figure.
Example: The ratio of the measurement of an angle to its complement is 1: 2. Create and solve an equation to find the measurement of the angle and its complement. (Modified from Engage NY M5L1.)
6. Generalize strategies for finding area, volume, and surface areas of two- and three-dimensional objects composed of triangles, quadrilaterals, polygons, cubes, and right prisms. Solve real-world and mathematical problems in each of these areas.
Example: A playground is being updated. Sand underneath a swing needs to be at least 15 inches deep. The sand under the swings is currently only 12 inches deep. The rectangular area under the swing set measures 9 feet by 12 feet. How much additional sand will be needed to meet the requirement? (Modified from Illustrative Mathematics.)
Statistics and Probability – 7.SP 7.SP.A. Use random sampling to draw inferences about a population.
1. Understand that statistics can be used to gain information about a population by examining a sample of the population; generalizations about a population from a sample are valid only if the sample is representative of that population. Understand that random sampling tends to produce representative samples and support valid inferences.
2. Use data from a random sample about an unknown characteristic of a population. Generate multiple samples (or simulated samples) of the same size to gauge the variation in estimates or predictions, i.e., generate a sampling distribution.
Example: Estimate the mean word length in a book by randomly sampling words from the book; predict the winner of a school election based on randomly sampled survey data. Gauge how far off the estimate or prediction might be.

CREATED 12/02/2021 DRAFT 7 – Idaho Content Standards/ Mathematics / SDE / 105
7.SP.B. Draw informal comparative inferences about two populations.
3. Informally assess the degree of visual overlap of two numerical data distributions with similar variabilities, measuring the difference between the centers by expressing it as a multiple of a measure of variability.
Example: The difference in the mean height between players on the basketball team versus the soccer team is 10 cm. This difference in the means - 10 cm - is about twice the variability (mean absolute deviation) on either team (i.e., mean divided by the MAD). On a dot plot, the separation between the two distributions of heights is noticeable.
4. Use measures of center and measures of variability for numerical data from random samples to draw informal comparative inferences about two populations.
Example: Decide whether the words in a chapter of a seventh-grade science book are generally longer than the words in a chapter of a fourth-grade science book.
7.SP.C. Investigate chance processes and develop, use, and evaluate probability models.
5. Understand that the probability of a chance event is a number between 0 and 1 that expresses the likelihood of the event occurring. A probability near 0 indicates an unlikely
event, a probability around 12 indicates an event that is neither unlikely nor likely, and a
probability near 1 indicates a likely event.
Example: The likelihood of drawing a heart from a deck of cards is 0.25. The likelihood of flipping a coin and landing on heads is 0.5. It is more likely that a flipped coin will land on heads than it is to choose a heart from a deck of cards. (0.5 is greater than 0.25).
6. Approximate the (theoretical) probability of a chance event by collecting data and observing its long-run relative frequency (experimental probability). Predict the approximate relative frequency given the (theoretical) probability.
Examples:

CREATED 12/02/2021 DRAFT 7 – Idaho Content Standards/ Mathematics / SDE / 106
1) When drawing chips out of a bag containing an unknown number of red and white chips, estimate the probability of selecting a particular chip color given 50 draws.
2) When rolling a number cube 600 times, predict that a 3 or 6 would be rolled approximately 200 times, but probably not exactly 200 times.
7. Develop a probability model and use it to find probabilities of events. Compare probabilities from a model to observed frequencies; if the agreement is not good, explain possible sources of the discrepancy.
a. Develop a uniform probability model by assigning equal probability to all outcomes, and use the model to determine probabilities of events.
Example: If a student is selected at random from a class, find the probability that Jane will be selected and the probability that a girl will be selected.
b. Develop a probability model (which may not be uniform) by observing frequencies in data generated from a chance process.
Example: Find the approximate probability that a spinning penny will land heads up or that a tossed paper cup will land open-end down. Do the outcomes for the spinning penny appear to be equally likely based on the observed frequencies?
8. Find probabilities of compound events using organized lists, tables, tree diagrams, and simulation.
a. Understand that, just as with simple events, the probability of a compound event is the fraction of outcomes in the sample space for which the compound event occurs.
b. Represent sample spaces for compound events using methods such as organized lists, tables, and tree diagrams. For an event described in everyday language (e.g., “rolling double sixes”), identify the outcomes in the sample space which compose the event.
c. Design and use a simulation to generate frequencies for compound events.
Example: Use random digits as a simulation tool to approximate the answer to the question: If 40% of donors have type A blood, what is the probability that it will take at least 4 donors to find one with type A blood?

CREATED 12/02/2021 DRAFT 7 – Idaho Content Standards/ Mathematics / SDE / 107
EIGHTH GRADE
In eighth grade, instruction is focused on the following areas: (1) formulating and reasoning about expressions and equations, including modeling an association in bivariate data with a linear equation and solving linear equations and systems of linear equations; (2) grasping the concept of a function and using functions to describe quantitative relationships; (3) analyzing two- and three-dimensional space and figures using distance, angle, similarity, and congruence, and understanding and applying the Pythagorean Theorem; and (4) defining the properties of integer exponents and irrational numbers.
1. Students use linear equations and systems of linear equations to represent, analyze, and solve a variety of problems. Students recognize equations for proportions (𝑦𝑦
𝑥𝑥= 𝑐𝑐 or 𝑦𝑦 =
𝑐𝑐𝑥𝑥) as special linear equations (𝑦𝑦 = 𝑐𝑐𝑥𝑥 + 𝑏𝑏), understanding that the constant of proportionality (𝑐𝑐) is the slope, and the graphs are lines through the origin. They understand that the slope (𝑐𝑐) of a line is a constant rate of change, so that if the input or x-coordinate changes by an amount 𝐴𝐴, the output or y-coordinate changes by the amount 𝑐𝑐 × 𝐴𝐴. Students also use a linear equation to describe the association between two quantities in bivariate data (such as arm span vs. height for students in a classroom). At this grade, fitting the model and assessing its fit to the data are done informally. Interpreting the model in the context of the data requires students to express a relationship between the two quantities in question and to interpret components of the relationship (such as slope and y-intercept) in terms of the situation.
2. Students strategically choose and efficiently implement procedures to solve linear equations in one variable, understanding that when they use the properties of equality and the concept of logical equivalence, they maintain the solutions of the original equation. Students solve systems of two linear equations in two variables and relate the systems to pairs of lines in the plane; these intersect, are parallel, or are the same line. Students use linear equations, systems of linear equations, linear functions, and their understanding of slope of a line to analyze situations and solve problems.
3. Students are introduced to the concept of a function as a rule that assigns to each input exactly one output. They understand that functions describe situations where one quantity determines another. Students can define, evaluate, and compare functions in multiple forms (pictures, tables, graphs, equations, etc.).
4. Students use ideas about distance and angles, how they behave under translations, rotations, reflections, and dilations, and ideas about congruence and similarity to describe and analyze two-dimensional figures and to solve problems. Students show that the sum of

CREATED 12/02/2021 DRAFT 7 – Idaho Content Standards/ Mathematics / SDE / 108
the angles in a triangle is the angle formed by a straight line, and that various configurations of lines give rise to similar triangles because of the angles created when a transversal cuts parallel lines. Students understand the statement of the Pythagorean Theorem and its converse, and can explain why the Pythagorean Theorem holds; for example, by decomposing a square in two different ways. They apply the Pythagorean Theorem to find distances between points on the coordinate plane, to find lengths, and to analyze polygons. Students complete their work on volume by solving problems involving cones, cylinders, and spheres.
5. Students use their understanding of multiplication and apply properties to develop an understanding of radicals and integer exponents. Students use and perform operations with numbers expressed in scientific notation. They use their knowledge of rational numbers to develop an understanding of irrational numbers.
Focus in the Standards
Not all content in a given grade is emphasized equally in the standards. Some clusters require greater emphasis than others based on the depth of the ideas, the time that they take to master, and/or their importance to future mathematics or the demands of college and career readiness. More time in these areas is also necessary for students to meet the Idaho Standards for Mathematical Practice. To say that some things have greater emphasis is not to say that anything in the standards can safely be neglected in instruction. Neglecting material will leave gaps in student skill and understanding and may leave students unprepared for the challenges of a later grade. Students should spend the large majority of their time on the major work of the grade (). Supporting work () and, where appropriate, additional work () can engage students in the major work of the grade.
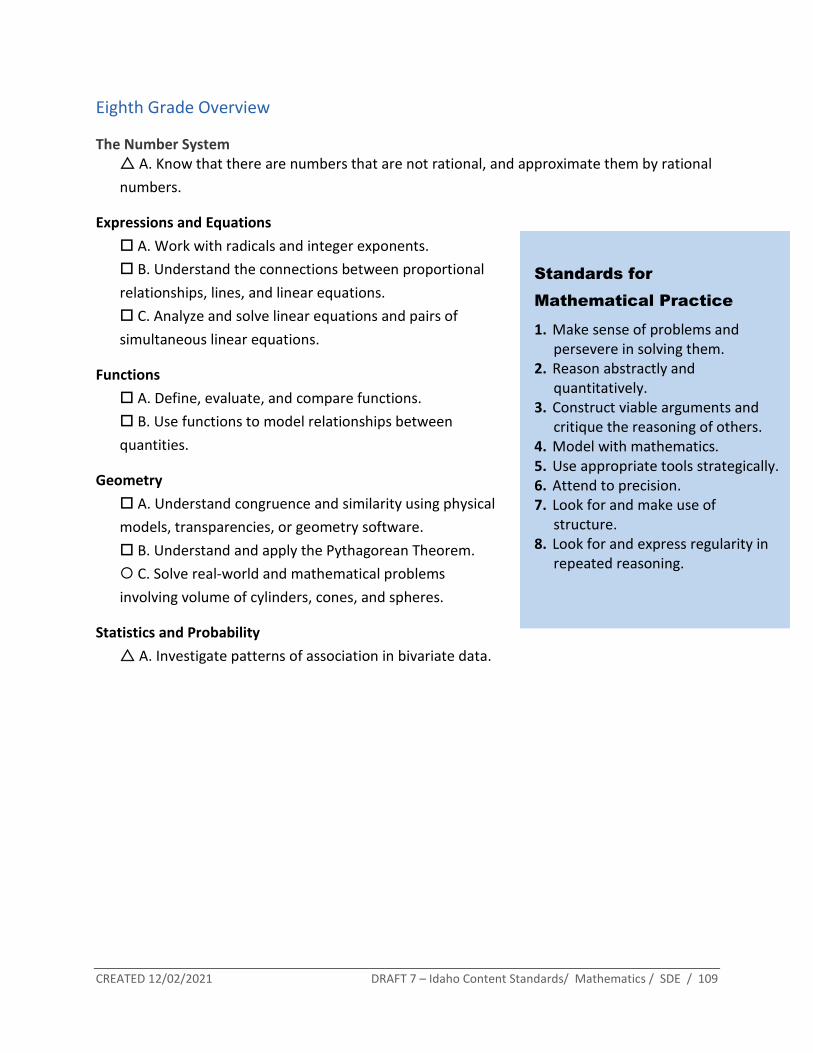
CREATED 12/02/2021 DRAFT 7 – Idaho Content Standards/ Mathematics / SDE / 109
Eighth Grade Overview
The Number System A. Know that there are numbers that are not rational, and approximate them by rational numbers.
Expressions and Equations A. Work with radicals and integer exponents. B. Understand the connections between proportional relationships, lines, and linear equations. C. Analyze and solve linear equations and pairs of simultaneous linear equations.
Functions A. Define, evaluate, and compare functions. B. Use functions to model relationships between quantities.
Geometry A. Understand congruence and similarity using physical models, transparencies, or geometry software. B. Understand and apply the Pythagorean Theorem. C. Solve real-world and mathematical problems involving volume of cylinders, cones, and spheres.
Statistics and Probability A. Investigate patterns of association in bivariate data.
Standards for Mathematical Practice 1. Make sense of problems and
persevere in solving them. 2. Reason abstractly and
quantitatively. 3. Construct viable arguments and
critique the reasoning of others. 4. Model with mathematics. 5. Use appropriate tools strategically. 6. Attend to precision. 7. Look for and make use of
structure. 8. Look for and express regularity in
repeated reasoning.

CREATED 12/02/2021 DRAFT 7 – Idaho Content Standards/ Mathematics / SDE / 110
Eighth Grade Standards for Mathematical Practice The Standards for Mathematical Practice complement the content standards so that students increasingly engage with the subject matter as they grow in mathematical maturity and expertise throughout the K – 12 education years.
MP.1 Make sense of problems and persevere in solving them. In eighth grade, students solve real-world problems through the application of algebraic and geometric concepts. Students seek the meaning of a problem and look for efficient ways to represent and solve it. They may check their thinking by asking themselves, “What is the most efficient way to solve the problem?”, “Does this make sense?”, and “Can I solve the problem in a different way?”
MP.2 Reason abstractly and quantitatively. In eighth grade, students represent a wide variety of real-world contexts through the use of real numbers and variables in mathematical expressions, equations, and inequalities. They examine patterns in data and assess the degree of linearity of functions. Students contextualize to understand the meaning of the number(s) or variable(s) as related to the problem and decontextualize to manipulate symbolic representations by applying properties of operations.
MP.3 Construct viable arguments and critique the reasoning of others. In eighth grade, students construct arguments using verbal or written explanations accompanied by expressions; equations; inequalities; models; and graphs, tables, and other data displays (e.g. box plots, dot plots, and histograms). They further refine their mathematical communication skills through mathematical discussions in which they critically evaluate their own thinking and the thinking of other students. They pose questions like “How did you get that?”, “Why is that true?”, and “Does that always work?”. They explain their thinking to others and respond to others’ thinking.
MP.4 Model with mathematics. In eighth grade, students model problem situations symbolically, graphically, in tables, and contextually. Working with the new concept of a function, students learn that relationships between variable quantities in the real world often satisfy a dependent relationship, in that one quantity determines the value of another. Students form expressions, equations, or inequalities from real-world contexts and connect symbolic and graphical representations. Students use scatter plots to represent data and describe associations between variables. Students need many opportunities to explain the connections between the different representations. They should be able to use all of these representations as

CREATED 12/02/2021 DRAFT 7 – Idaho Content Standards/ Mathematics / SDE / 111
appropriate to a problem context. Students should be encouraged to answer questions such as “What are some ways to represent the quantities?” or “How might it help to create a table, chart, graph, or ___?”
MP.5 Use appropriate tools strategically. Students consider available tools (including estimation and technology) when solving a mathematical problem and decide when certain tools might be helpful. For instance, students in grade eight may translate a set of data given in tabular form to a graphical representation to compare it to another data set. Students might draw pictures, use applets, or write equations to show the relationship between the angles created by a transversal that intersects parallel lines. Teachers might ask, “What approach are you considering?” or “Why was it helpful to use ___?”
MP.6 Attend to precision. In eighth grade, students continue to refine their mathematical communication skills by using clear and precise language in their discussions with others and in their own reasoning. Students use appropriate terminology when referring to the number system, functions, geometric figures, and data displays. Teachers might ask, “What mathematical language, definitions, or properties can you use to explain ____?”
MP.7 Look for and make use of structure. Students routinely seek patterns or structures to model and solve problems. In eighth grade, students apply properties to generate equivalent expressions and solve equations. Students examine patterns in tables and graphs to generate equations and describe relationships. Additionally, students experimentally verify the effects of transformations and describe them in terms of congruence and similarity.
MP.8 Look for and express regularity in repeated reasoning. In grade eight, students use repeated reasoning to understand the slope formula and to make sense of rational and irrational numbers. Through multiple opportunities to model linear relationships, they notice that the slope of the graph of the linear relationship and the rate of change of the associated function are the same. For example, as students repeatedly check whether points are on the line with a slope of 3 that goes through the point (1, 2), they
might abstract the equation of the line in the form 𝑦𝑦−2𝑥𝑥−1
= 3. Students should be encouraged to
answer questions such as “How would we prove that ___?” or “How is this situation like and different from other situations using these operations?”

CREATED 12/02/2021 DRAFT 7 – Idaho Content Standards/ Mathematics / SDE / 112
The Number System – 8.NS 8.NS.A. Know that there are numbers that are not rational, and approximate them by rational numbers.
1. Know that numbers that are not rational are called irrational. Understand informally that every number has a decimal expansion; for rational numbers show that the decimal expansion repeats eventually, and convert a decimal expansion which repeats eventually into a rational number.
2. Use rational approximations of irrational numbers to compare the size of irrational numbers, locate them approximately on a number line diagram, and estimate the value of expressions.
Examples:
1) Estimate the value of √2.
2) By truncating the decimal expansion of √2, show that √2 is between 1 and 2, then between 1.4 and 1.5, and explain how to continue on to get better approximations.
Expressions and Equations – 8.EE 8.EE.A. Work with radicals and integer exponents.
1. Know and apply the properties of integer exponents to generate equivalent numerical expressions.
Example: 32 × 3−5 = 3−3 = �13�3
= 127
2. Use square root and cube root symbols to represent solutions to equations of the form 𝑥𝑥2 = 𝑝𝑝 and 𝑥𝑥3 = 𝑝𝑝, where 𝑝𝑝 is a positive rational number. Evaluate square roots of small perfect squares and cube roots of small perfect cubes. Know that √2 is irrational.
3. Use numbers expressed in the form of a single digit multiplied by an integer power of ten (scientific notation) to estimate very large or very small quantities, and express how many times as much one is than the other.
Example: Estimate the population of the United States as 3 × 10⁸ and the population of the world as 7 × 10⁹, and determine that the world population is more than 20 times larger.
4. Perform operations with numbers expressed in scientific notation, including problems where both decimal and scientific notation are used. Use scientific notation and choose units of appropriate size for measurements of very large or very small quantities. Interpret scientific notation that has been generated by technology.

CREATED 12/02/2021 DRAFT 7 – Idaho Content Standards/ Mathematics / SDE / 113
Example: Millimeters per year for seafloor spreading
8.EE.B. Understand the connections between proportional relationships, lines, and linear equations.
5. Graph proportional relationships, interpreting the unit rate as the slope of the graph. Compare two different proportional relationships represented in different ways.
Example: Compare a distance-time graph to a distance-time equation to determine which of two moving objects has greater speed.
6. Use similar triangles to explain why the slope 𝑐𝑐 is the same between any two distinct points on a non-vertical line in the coordinate plane. Derive the equation 𝑦𝑦 = 𝑐𝑐𝑥𝑥 for a line through the origin and the equation 𝑦𝑦 = 𝑐𝑐𝑥𝑥 + 𝑏𝑏 for a line intercepting the vertical axis at 𝑏𝑏.
8.EE.C. Analyze and solve linear equations and pairs of simultaneous linear equations.
7. Solve linear equations in one variable.
a. Give examples of linear equations in one variable with one solution, infinitely many solutions, or no solutions. Show which of these possibilities is the case by successively transforming the given equation into simpler forms, until an equivalent equation of the form 𝑥𝑥 = 𝑎𝑎 (1 solution), 𝑎𝑎 = 𝑎𝑎 (infinitely many solutions), or 𝑎𝑎 = 𝑏𝑏 (no solution) results (where 𝑎𝑎 and 𝑏𝑏 are different numbers).
Example: −3𝑥𝑥 − 2 = 7𝑥𝑥 + 2 − 10𝑥𝑥 has no solution because the equation simplifies to −2 = 2 which is false for any value of 𝑥𝑥.
b. Solve linear equations with rational number coefficients, including equations whose solutions require expanding expressions using the distributive property and collecting like terms.
8. Analyze and solve pairs of simultaneous linear equations.
a. Understand that solutions to a system of two linear equations in two variables correspond to points of intersection of their graphs because points of intersection satisfy both equations simultaneously.
b. Solve systems of two linear equations in two variables algebraically (including but not limited to using substitution and elimination strategies), and estimate solutions by graphing the equations; solve simple cases by inspection.
Example: 3𝑥𝑥 + 2𝑦𝑦 = 5 and 3𝑥𝑥 + 2𝑦𝑦 = 6 have no solution because 3𝑥𝑥 + 2𝑦𝑦 cannot simultaneously be 5 and 6.

CREATED 12/02/2021 DRAFT 7 – Idaho Content Standards/ Mathematics / SDE / 114
c. Solve real-world and mathematical problems leading to two linear equations in two variables.
Examples:
1) Given coordinates for two pairs of points, determine whether the line through the first pair of points intersects the line through the second pair.
2) Your family decided to rent a snowmobile at Island Park. Company A charges $125 for the first hour plus $37.50 for each additional hour. Company B charges a $50 one-time rental fee plus $45 per hour. Which company would cost less for you to rent for 3 hours? 5 hours? 8 hours?
Functions – 8.F 8.F.A. Define, evaluate, and compare functions.
1. Understand that a function is a rule that assigns to each input exactly one output and that the graph of a function is the set of ordered pairs consisting of an input and the corresponding output.
2. Compare properties of two functions each represented in a different way (algebraically, graphically, numerically in tables, or by verbal descriptions).
Example: Given a linear function represented by a table of values and a linear function represented by an algebraic expression, determine which function has the greater rate of change.
3. Interpret the equation 𝑦𝑦 = 𝑐𝑐𝑥𝑥 + 𝑏𝑏 as defining a linear function, whose graph is a straight line; give examples of functions that are not linear.
Example: The function 𝐴𝐴 = 𝑢𝑢2 giving the area of a square as a function of its side length is not linear because its graph contains the points (1, 1), (2, 4) and (3, 9), which are not on a straight line.
8.F.B. Use functions to model relationships between quantities.
4. Construct a function to model a linear relationship between two quantities. Determine the rate of change and initial value of the function from a description of a relationship or from two (𝑥𝑥,𝑦𝑦) values, including reading these from a table or from a graph. Interpret the rate of change and initial value of a linear function in terms of the situation it models, and in terms of its graph or a table of values.
5. Describe qualitatively the functional relationship between two quantities by analyzing and sketching a graph (e.g., where the function is increasing or decreasing, linear or nonlinear).

CREATED 12/02/2021 DRAFT 7 – Idaho Content Standards/ Mathematics / SDE / 115
Sketch a graph that exhibits the qualitative features of a function that has been described verbally.
Geometry – 8.G 8.G.A. Understand congruence and similarity using physical models, transparencies, or geometry software.
1. Verify experimentally the properties of rotations, reflections, and translations:
a. Lines are transformed to lines, and line segments to line segments of the same length.
b. Angles are transformed to angles of the same measure.
c. Parallel lines are transformed to parallel lines.
2. Understand that a two-dimensional figure is congruent to another if the second can be obtained from the first by a sequence of rotations, reflections, and translations.
Example: Given two congruent figures, describe a sequence that exhibits the congruence between them.
3. Describe the effect of dilations, translations, rotations, and reflections on two-dimensional figures using coordinates.
Example: The image of Triangle ABC with 𝐴𝐴 = (−3, 0), 𝐵𝐵 = (−3,−2), and 𝐶𝐶 = (4,−2) would have coordinates 𝐴𝐴’ = (−3 − 3, 0 + 2) = (−6, 2), 𝐵𝐵’ = (−3 − 3,−2 + 2) = (−6,0), and 𝐶𝐶’ = (4 − 3,−2 + 2) = (1,0) following a translation 3 units to the left and 2 units up.
4. Understand that a two-dimensional figure is similar to another if the second can be obtained from the first by a sequence of rotations, reflections, translations, and dilations.
Example: Given two similar two-dimensional figures, describe a sequence that exhibits the similarity between them.
5. Use informal arguments to establish facts about the angle sum and exterior angle of triangles, about the angles created when parallel lines are cut by a transversal, and the angle-angle criterion for similarity of triangles.
Example: Arrange three copies of the same triangle so that the sum of the three angles appears to form a line, and give an argument in terms of transversals why this is so.
8.G.B. Understand and apply the Pythagorean Theorem.
6. Analyze and justify the Pythagorean Theorem and its converse using pictures, diagrams, narratives, or models.

CREATED 12/02/2021 DRAFT 7 – Idaho Content Standards/ Mathematics / SDE / 116
7. Apply the Pythagorean Theorem to determine unknown side lengths in right triangles in real-world and mathematical problems in two and three dimensions.
8. Apply the Pythagorean Theorem to find the distance between two points in a coordinate system.
8.G.C. Solve real-world and mathematical problems involving volume of cylinders, cones, and spheres.
9. Know the formulas for the volumes of cones, cylinders, and spheres and use them to solve real-world and mathematical problems.
Statistics and Probability – 8.SP 8.SP.A. Investigate patterns of association in bivariate data.
1. Construct and interpret scatter plots for bivariate measurement data to investigate patterns of association between two quantities. Describe patterns such as clustering, outliers, positive or negative association, linear association, and nonlinear association.
2. Know that straight lines are widely used to model relationships between two quantitative variables. For scatter plots that suggest a linear association, informally fit a straight line, and informally assess the model fit by judging the closeness of the data points to the line.
3. Use the equation of a linear model to solve problems in the context of bivariate measurement data, interpreting the slope and intercept.
Example: In a linear model for a biology experiment, interpret a slope of 1.5 cm/hr as meaning that an additional hour of sunlight each day is associated with an additional 1.5 cm in mature plant height.
4. Understand that patterns of association can also be seen in bivariate categorical data by displaying frequencies and relative frequencies in a two-way table. Construct and interpret a two-way table summarizing data on two categorical variables collected from the same subjects. Use relative frequencies calculated for rows or columns to describe possible association between the two variables.
Example: Collect data from students in your school on grade level (sixth, seventh, and eighth) and whether or not they have assigned chores at home (yes, no). Is there evidence that a particular grade level tends to have chores? (In this example the two variables are grade level and chores.)

CREATED 12/02/2021 DRAFT 7 – Idaho Content Standards/ Mathematics / SDE / 117
GRADES 9 – 12 CONTENT STANDARDS BY CONCEPTUAL CATEGORIES
Content Standards by Conceptual Category Identifiers/Coding The content standards presented by conceptual categories are built on mathematical learning progressions informed by research on cognitive development and by the logical structure of mathematics. These progressions provide the foundation for the grades 9–12 content standards. In this section, the standards are organized by conceptual categories. The Conceptual Categories are:
• Number and Quantity (N) • Algebra (A) • Functions (F) • Modeling () • Geometry (G) • Statistics and Probability (S)
The code for each 9 – 12 conceptual category standard begins with the identifier for the conceptual category code (N, A, F, G, S), followed by the domain code, and the standard number, as shown below.
The standard highlighted above is identified as N.RN.A.1, identifying it as a standard in the Number and Quantity conceptual category (N.) within that category’s Real Number System

CREATED 12/02/2021 DRAFT 7 – Idaho Content Standards/ Mathematics / SDE / 118
domain (RN.), and as the first standard in that domain and in that cluster (A.1). All of the standards in this Framework use a common coding system.
Note: Standards with a ★ indicate a modeling standard. Standards with a (+) represent standards for advanced classes such as calculus, advanced statistics, or discrete mathematics. Standards without a (+) are the present standards for all college and career ready students.

CREATED 12/02/2021 DRAFT 7 – Idaho Content Standards/ Mathematics / SDE / 119
Grades 9 – 12 Standards for Mathematical Practice The Standards for Mathematical Practice complement the content standards so that students increasingly engage with the subject matter as they grow in mathematical maturity and expertise throughout the Grades K – 12 education years.
MP.1 Make sense of problems and persevere in solving them. Grades 9 – 12 students should work to understand what a problem is asking, choose a strategy to find a solution, and check the answer to make sure it makes sense. When unable to immediately identify a strategy that will work or when their selected strategy does not work as intended, they must learn to persist in trying a range of potential approaches, looking for how the current problem may relate to previous work they have done. Solving problems is the essence of mathematical work.
MP.2 Reason abstractly and quantitatively. Grades 9 – 12 students need to be able to abstract a given situation and represent it symbolically. Students should also make sense of quantities and their relationships in problem situations. Particular attention to units associated with quantities is essential to understanding how the quantities are related. For example, a linear function relating the distance traveled to time needs to specify the units, such as feet and seconds. The slope of that function then gives the rate of change (velocity) given in feet per second. Students should consistently consider the reasonableness of their answer within the context of the problem.
MP.3 Construct viable arguments and critique the reasoning of others. Grades 9 – 12 students are increasingly expected to make formal mathematical arguments based on stated assumptions or properties, well-defined definitions, and previously established results. Students should be expected to make formal and informal arguments as they progress through the grades 9 – 12. Students should listen to or read the arguments of others, decide whether they make sense, and ask useful questions to clarify or improve the arguments. Moreover, experience with critiquing the arguments produced by classmates is essential to their mathematical development. Reasoning undergirds deep conceptual understanding.
MP.4 Model with mathematics. Grades 9 – 12 students need to learn to use mathematics to address problems in everyday life, society, and the workplace. This should occur at a range of levels, from more specific application of mathematical ideas to full-scale mathematical modeling. Students should routinely interpret their mathematical results in the context of the situation and reflect on whether the results make sense, possibly improving the model if it has not served its purpose.
MP.5 Use appropriate tools strategically.

CREATED 12/02/2021 DRAFT 7 – Idaho Content Standards/ Mathematics / SDE / 120
Grades 9 – 12 students need to be comfortable in using applicable tools when solving a mathematics problem. A range of technological tools should be available, including graphing calculators and software, computer algebra systems, spreadsheets, dynamic geometry software, and statistical software. Physical manipulatives, such as algebra tiles and geometric models, are useful for students and should be incorporated into the 9 – 12 classroom. Students should be comfortable using paper-and-pencil representations, such as tables, graphs, and other visual representations.
MP.6 Attend to precision. Grades 9 – 12 students need to learn to communicate effectively with others, using precise vocabulary. They should use symbols to represent their thinking, clearly describing the meaning of those symbols. By the time students reach grades 9 – 12 they have learned to examine claims and make explicit use of definitions. They also need to be able to express the precision of the answers they give in real-world contexts, based on the accuracy of the given information.
MP.7 Look for and make use of structure. Grades 9 – 12 students examine mathematical situations in order to detect a pattern or structure that may provide further insight. Students use patterns and structure to create equivalent expressions, factor and solve equations, compose functions, and transform figures. For example, drawing an auxiliary line in a geometric figure may help them to better understand the structure behind a situation. Drawing in the diagonals of an isosceles trapezoid creates two overlapping triangles ∆𝐴𝐴𝐵𝐵𝐶𝐶and ∆𝐵𝐵𝐶𝐶𝐴𝐴 as shown in the following figure; if we can demonstrate their congruence, other properties of the figure will become apparent.
MP.8 Look for and express regularity in repeated reasoning. Grades 9 – 12 students notice patterns in calculations that are performed in order to form generalizations and efficient strategies for calculation. For example, grades 9-12 students may expand on their understanding of right triangles to explore the relationship between the legs
and hypotenuse of a 45-45-90 triangle to discover that the hypotenuse is √2 times the leg.

CREATED 12/02/2021 DRAFT 7 – Idaho Content Standards/ Mathematics / SDE / 121
Grades 9 – 12 Number and Quantity (N) Numbers and Number Systems
During the years from kindergarten to eighth grade, students must repeatedly extend their conception of number. At first, “number” means “counting number”: 1, 2, 3…. Soon after that, 0 is used to represent “none” and the whole numbers are formed by the counting numbers together with zero. The next extension is fractions. At first, fractions are barely numbers and tied strongly to pictorial representations. Yet by the time students understand division of fractions, they have a strong concept of fractions as numbers and have connected them, via their decimal representations, with the base-ten system used to represent the whole numbers. During middle school, fractions are augmented by negative fractions to form the rational numbers. In eighth grade, students extend this system once more, augmenting the rational numbers with the irrational numbers to form the real numbers. In high school, students will be exposed to yet another extension of number, when the real numbers are augmented by the imaginary numbers to form the complex numbers.
With each extension of number, the meanings of addition, subtraction, multiplication, and division are extended. In each new number system—integers, rational numbers, real numbers, and complex numbers—the four operations stay the same in two important ways: They have the Commutative, Associative, and Distributive properties and their new meanings are consistent with their previous meanings.
Extending the properties of whole-number exponents leads to new and productive notation.
For example, properties of whole-number exponents suggest that (51 3� )3should be 5�1 3� �3 =51 = 5 and that 51 3� should be the cube root of 5.
Calculators, spreadsheets, and computer algebra systems can provide ways for students to become better acquainted with these new number systems and their notation. They can be used to generate data for numerical experiments; to help understand the workings of matrix, vector, and complex number algebra, and to experiment with non-integer exponents.
Quantities
In real-world problems, the answers are usually not numbers but quantities: numbers with units, which involve measurement. In their work in measurement up through grade eight, students primarily measure commonly used attributes such as length, area, and volume. In high school, students encounter a wider variety of units in modeling, e.g., acceleration, currency conversions, derived quantities such as person-hours and heating degree-days, social science rates such as per-capita income, and rates in everyday life such as points scored per game or batting averages. They also encounter novel situations in which they themselves must conceive

CREATED 12/02/2021 DRAFT 7 – Idaho Content Standards/ Mathematics / SDE / 122
the attributes of interest. For example, to find a good measure of overall highway safety, they might propose measures such as fatalities per year, fatalities per year per driver, or fatalities per vehicle-mile traveled. Such a conceptual process is sometimes called quantification. Quantification is important for science, as when surface area suddenly “stands out” as an important variable in evaporation. Quantification is also important for companies, which must conceptualize relevant attributes and create or choose suitable measures for them.
Note: Standards with a ★ indicate a modeling standard. Standards with a (+) represent standards for advanced classes such as calculus, advanced statistics, or discrete mathematics. Standards without a (+) are the present standards for all college and career ready students.

CREATED 12/02/2021 DRAFT 7 – Idaho Content Standards/ Mathematics / SDE / 123
Grades 9 – 12 Number and Quantity Overview
The Real Number System
A. Extend the properties of exponents to rational exponents.
B. Use properties of rational and irrational numbers.
Quantities
A. Reason quantitatively and use units to solve problems.
The Complex Number System
A. Perform arithmetic operations with complex numbers.
B. Represent complex numbers and their operations on the complex plane.
C. Use complex numbers in polynomial identities and equations.
Vector and Matrix Quantities
A. Represent and model with vector quantities.
B. Perform operations on vectors.
C. Perform operations on matrices and use matrices in applications.
Standards for Mathematical Practice
1. Make sense of problems and persevere in solving them.
2. Reason abstractly and quantitatively.
3. Construct viable arguments and critique the reasoning of others.
4. Model with mathematics. 5. Use appropriate tools
strategically. 6. Attend to precision. 7. Look for and make use of
structure. 8. Look for and express regularity
in repeated reasoning.

CREATED 12/02/2021 DRAFT 7 – Idaho Content Standards/ Mathematics / SDE / 124
The Real Number System - N.RN N.RN.A. Extend the properties of exponents to rational exponents.
1. Explain how the definition of the meaning of rational exponents follows from extending the properties of integer exponents to those values, allowing for a notation for radicals in terms of rational exponents.
Example: We define 51 3� to be the cube root of 5 because we want (51 3� )3 = 5�1 3� �3 to
hold, so (51 3� )3 must equal 5.
2. Rewrite expressions involving radicals and rational exponents using the properties of exponents.
Example: Solving the volume of a cube formula, 𝑉𝑉 = 𝑢𝑢3, for 𝑢𝑢 would involve rewriting the
solution as either 𝑢𝑢 = √𝑉𝑉3 or 𝑢𝑢 = 𝑉𝑉1 3� .
N.RN.B. Use properties of rational and irrational numbers.
3. Explain why the sum or product of two rational numbers is rational; why the sum of a rational number and an irrational number is irrational; and why the product of a nonzero rational number and an irrational number is irrational.
Quantities – N.Q N.Q.A. Reason quantitatively and use units to solve problems.
1. Use units as a way to understand problems and to guide the solution of multi-step problems; choose and interpret units consistently in formulas; choose and interpret the scale and the origin in graphs and data displays.
2. Define appropriate quantities for the purpose of descriptive modeling.
3. Choose a level of accuracy appropriate to limitations on measurement when reporting quantities.
The Complex Number System – N.CN N.CN.A. Perform arithmetic operations with complex numbers.
1. Know there is a complex number 𝑛𝑛 such that 𝑛𝑛2 = −1, and show that every complex number has the form 𝑎𝑎 + 𝑏𝑏𝑛𝑛 where 𝑎𝑎 and 𝑏𝑏 real.
Example: Express the radical ±√−24 , using the imaginary unit, 𝑛𝑛, in simplified form. Expressing the radical using 𝑛𝑛 in simplified form results in the expression ±2𝑛𝑛√6 .

CREATED 12/02/2021 DRAFT 7 – Idaho Content Standards/ Mathematics / SDE / 125
2. Use the relation 𝑛𝑛2 = −1 and the commutative, associative, and distributive properties to add, subtract, and multiply complex numbers.
3. (+) Find the conjugate of a complex number; use conjugates to find absolute value and quotients of complex numbers.
N.CN.B. Represent complex numbers and their operations on the complex plane.
4. (+) Represent complex numbers on the complex plane in rectangular and polar form (including real and imaginary numbers), and explain why the rectangular and polar forms of a given complex number represent the same number.
5. (+) Represent addition, subtraction, multiplication, and conjugation of complex numbers geometrically on the complex plane; use properties of this representation for computation.
Example: (1 + 𝑛𝑛√3)3 = 8 because �−1 + 𝑛𝑛√3� has a radius of 2 and argument 120°.
6. (+) Calculate the distance between numbers in the complex plane as the absolute value of the difference, and the midpoint of a segment as the average of the numbers at its endpoints.
N.CN.C. Use complex numbers in polynomial identities and equations.
7. Solve quadratic equations with real coefficients that have complex solutions.
Example: Find the complex solutions of the quadratic equation 5𝑥𝑥2 + 3𝑥𝑥 + 1 = 0, with the
solutions of 𝑥𝑥 = 310
+ 35𝑛𝑛 and 𝑥𝑥 = 3
10− 3
5𝑛𝑛.
8. (+) Extend polynomial identities to the complex numbers.
Example: Rewrite 𝑥𝑥2 + 4 as (𝑥𝑥 + 2𝑛𝑛) (𝑥𝑥 − 2𝑛𝑛).
9. (+) Know the Fundamental Theorem of Algebra; show that it is true for quadratic polynomials.
Vector and Matrix Quantities – N.VM N.VM.A. Represent and model with vector quantities.
1. (+) Recognize vector quantities as having both magnitude and direction. Represent vector quantities by directed line segments, and use appropriate symbols for vectors and their magnitudes (e.g., v, |v|, ||v||, v).
2. (+) Find the components of a vector by subtracting the coordinates of an initial point from the coordinates of a terminal point.
3. (+) Solve problems involving velocity and other quantities that can be represented by vectors.
CREATED 12/02/2021 DRAFT 7 – Idaho Content Standards/ Mathematics / SDE / 126
N.VM.B. Perform operations on vectors.
4. (+) Add and subtract vectors.
a. (+) Add vectors end-to-end, component-wise, and by the parallelogram rule. Understand that the magnitude of a sum of two vectors is typically not the sum of the magnitudes.
b. (+) Given two vectors in magnitude and direction form, determine the magnitude and direction of their sum.
c. (+) Demonstrate understanding of vector subtraction v – w as v + (–w), where
--w is the additive inverse of w, with the same magnitude as w and pointing in the opposite direction. Represent vector subtraction graphically by connecting the tips in the appropriate order, and perform vector subtraction component-wise.
5. (+) Multiply a vector by a scalar.
a. (+) Represent scalar multiplication graphically by scaling vectors and possibly reversing their direction; perform scalar multiplication component-wise, e.g., as 𝑐𝑐(𝑣𝑣𝑥𝑥 , 𝑣𝑣𝑦𝑦) = (𝑐𝑐𝑣𝑣𝑥𝑥 , 𝑐𝑐𝑣𝑣𝑦𝑦).
b. (+) Compute the magnitude of a scalar multiple cv using ||cv|| = |c|v. Compute the direction of cv, knowing that when |c|v ≠ 0, the direction of cv is either along v (for 𝑐𝑐 > 0) or against v (for 𝑐𝑐 < 0).
N.VM.C. Perform operations on matrices and use matrices in applications.
6. (+) Use matrices to represent and manipulate data, e.g., to represent payoffs or incidence relationships in a network.
7. (+) Multiply matrices by scalars to produce new matrices, e.g., as when all of the payoffs in a game are doubled.
8. (+) Add, subtract, and multiply matrices of appropriate dimensions.
9. (+) Demonstrate understanding that, unlike multiplication of numbers, matrix multiplication for square matrices is not a commutative operation, but still satisfies the associative and distributive properties.
10. (+) Demonstrate understanding that the zero and identity matrices play a role in matrix addition and multiplication similar to the role of 0 and 1 in the real numbers. The determinant of a square matrix is nonzero if and only if the matrix has a multiplicative inverse.
CREATED 12/02/2021 DRAFT 7 – Idaho Content Standards/ Mathematics / SDE / 127
11. (+) Multiply a vector (regarded as a matrix with one column) by a matrix of suitable dimensions to produce another vector. Work with matrices as transformations of vectors.
12. (+) Work with 2 × 2 matrices as transformations of the plane, and interpret the absolute value of the determinant in terms of area.

CREATED 12/02/2021 DRAFT 7 – Idaho Content Standards/ Mathematics / SDE / 128
Grades 9 – 12 Algebra (A) Expressions
An expression is a record of a computation with numbers, symbols that represent numbers, arithmetic operations, exponentiation, and, at more advanced levels, the operation of evaluating a function. Conventions about the use of parentheses and the Order of Operations assure that each expression is unambiguous. Creating an expression that describes a computation involving a general quantity requires the ability to express the computation in general terms, abstracting from specific instances.
Reading an expression with comprehension involves analysis of its underlying structure. This may suggest a different but equivalent way of writing the expression that exhibits some different aspect of its meaning. For example, 𝑝𝑝 + 0.05𝑝𝑝 can be interpreted as the addition of a 5% tax to a price 𝑝𝑝. Rewriting 𝑝𝑝 + 0.05𝑝𝑝 as 1.05𝑝𝑝 shows that adding a tax is the same as multiplying the price by a constant factor.
Algebraic manipulations are governed by the properties of operations and exponents, and the conventions of algebraic notation. At times, an expression is the result of applying operations to simpler expressions. For example, 𝑝𝑝 + 0.05𝑝𝑝 is the sum of the simpler expressions 𝑝𝑝 and 0.05𝑝𝑝. Viewing an expression as the result of operation on simpler expressions can sometimes clarify its underlying structure. A spreadsheet or a computer algebra system (CAS) can be used to experiment with algebraic expressions, perform complicated algebraic manipulations, and understand how algebraic manipulations behave.
Equations and Inequalities
An equation is a statement of equality between two expressions, often viewed as a question asking for which values of the variables the expressions on either side are in fact equal. These values are the solutions to the equation. An identity, in contrast, is true for all values of the variables; identities are often developed by rewriting an expression in an equivalent form.
The solutions of an equation in one variable form a set of numbers; the solutions of an equation in two variables form a set of ordered pairs of numbers, which can be plotted in the coordinate plane. Two or more equations and/or inequalities form a system. A solution for such a system must satisfy every equation and inequality in the system.
An equation can often be solved by successively deducing from it one or more simpler equations. For example, one can add the same constant to both sides without changing the solutions, but squaring both sides might lead to extraneous solutions. Strategic competence in solving includes looking ahead for productive manipulations and anticipating the nature and number of solutions.

CREATED 12/02/2021 DRAFT 7 – Idaho Content Standards/ Mathematics / SDE / 129
Some equations have no solutions in a given number system, but have a solution in a larger system. For example, the solution of x + 1 = 0 is an integer, not a whole number; the solution of 2x + 1 = 0 is a rational number, not an integer; the solutions of x2 − 2 = 0 are real numbers, not rational numbers; and the solutions of x2 + 2 = 0 are complex numbers, not real numbers.
The same solution techniques used to solve equations can be used to rearrange formulas. For
example, the formula for the area of a trapezoid, 𝐴𝐴 = �𝑏𝑏1+𝑏𝑏22
�ℎ, can be solved for ℎ using the
same deductive process. Inequalities can be solved by reasoning about the properties of inequality. Many, but not all, of the properties of equality continue to hold for inequalities and can be useful in solving them.
Connections to Functions and Modeling
Expressions can define functions, and equivalent expressions define the same function. Asking when two functions have the same value for the same input leads to an equation; graphing the two functions allows for finding approximate solutions of the equation. Converting a verbal description to an equation, inequality, or system of these is an essential skill in modeling.
Note: Standards with a ★ indicate a modeling standard. Standards with a (+) represent standards for advanced classes such as calculus, advanced statistics, or discrete mathematics. Standards without a (+) are the present standards for all college and career ready students.

CREATED 12/02/2021 DRAFT 7 – Idaho Content Standards/ Mathematics / SDE / 130
Grades 9 – 12 Algebra Overview
Seeing Structure in Expressions
A. Interpret the structure of linear, quadratic, exponential, polynomial, and rational expressions.
B. Write expressions in equivalent forms to solve problems.
Arithmetic with Polynomials and Rational Expressions
A. Perform arithmetic operations on polynomials.
B. Understand the relationship between zeros and factors of polynomials.
C. Use polynomial identities to solve problems.
D. Rewrite rational expressions.
Creating Equations
A. Create equations that describe numbers or relationships.
Reasoning with Equations and Inequalities
A. Understand solving equations as a process of reasoning and explain the reasoning.
B. Solve equations and inequalities in one variable.
C. Solve systems of equations.
D. Represent and solve equations and inequalities graphically.
Standards for Mathematical Practice
1. Make sense of problems and persevere in solving them.
2. Reason abstractly and quantitatively.
3. Construct viable arguments and critique the reasoning of others.
4. Model with mathematics. 5. Use appropriate tools
strategically. 6. Attend to precision. 7. Look for and make use of
structure. 8. Look for and express regularity
in repeated reasoning.

CREATED 12/02/2021 DRAFT 7 – Idaho Content Standards/ Mathematics / SDE / 131
Seeing Structure in Expressions – A.SSE A.SSE.A. Interpret the structure of linear, quadratic, exponential, polynomial, and rational expressions.
1. Interpret expressions that represent a quantity in terms of its context. ★
a. Interpret parts of an expression, such as terms, factors, and coefficients.
b. Interpret complicated expressions by viewing one or more of their parts as a single entity.
Example: Interpret 𝑃𝑃(1 + 𝑢𝑢)𝑛𝑛 as the product of P and a factor not depending on 𝑃𝑃.
2. Use the structure of an expression to identify ways to rewrite it.
Example: See 𝑥𝑥4 – 𝑦𝑦4 as (𝑥𝑥2)2 – (𝑦𝑦2)2 , thus recognizing it as a difference of squares that can be factored as (𝑥𝑥2 – 𝑦𝑦2)(𝑥𝑥2 + 𝑦𝑦2).
A.SSE.B. Write expressions in equivalent forms to solve problems.
3. Choose and produce an equivalent form of an expression to reveal and explain properties of the quantity represented by the expression.
a. Factor a quadratic expression to reveal the zeros of the function it defines.
b. Complete the square in a quadratic expression to reveal the maximum or minimum value of the function it defines.
Example: A high school player punts a football, and the function ℎ(𝑡𝑡) = −16𝑡𝑡2 + 64𝑡𝑡 + 2 represents the height ℎ, in feet, of the football at time 𝑡𝑡 seconds after it is punted. Complete the square in the quadratic expression to find the maximum height of the football.
c. Use the properties of exponents to transform expressions for exponential functions.
Example: The expression 1.15𝑡𝑡 can be rewritten as (1.151 12� )12𝑡𝑡 ≈ 1.01212𝑡𝑡 to reveal the approximate equivalent monthly interest rate if the annual rate is 15%.
4. Derive the formula for the sum of a finite geometric series (when the common ratio is not 1) and use the formula to solve problems.★
Example: Calculate mortgage payments.
Arithmetic with Polynomials and Rational Expressions – A.APR A.APR.A. Perform arithmetic operations on polynomials.

CREATED 12/02/2021 DRAFT 7 – Idaho Content Standards/ Mathematics / SDE / 132
1. Demonstrate understanding that polynomials form a system analogous to the integers; namely, they are closed under certain operations.
a. Perform operations on polynomial expressions (addition, subtraction, multiplication, division) and compare the system of polynomials to the system of integers when performing operations.
b. Factor and/or expand polynomial expressions, identify and combine like terms, and apply the distributive property.
A.APR.B. Understand the relationship between zeros and factors of polynomials.
2. Know and apply the Remainder Theorem: For a polynomial 𝑝𝑝(𝑥𝑥) and a number 𝑎𝑎, the remainder on division by 𝑥𝑥 − 𝑎𝑎 is 𝑝𝑝(𝑎𝑎), so 𝑝𝑝(𝑎𝑎) = 0 if and only if (𝑥𝑥 − 𝑎𝑎) is a factor of 𝑝𝑝(𝑥𝑥).
3. Identify zeros of polynomials when suitable factorizations are available, and use the zeros to construct a rough graph of the function defined by the polynomial.
A.APR.C. Use polynomial identities to solve problems.
4. Prove polynomial identities and use them to describe numerical relationships.
Example: The polynomial identity (𝑥𝑥2 + 𝑦𝑦2)2 = (𝑥𝑥2 − 𝑦𝑦2)2 + (2𝑥𝑥𝑦𝑦)2 can be used to generate Pythagorean triples.
5. (+) Know and apply the Binomial Theorem for the expansion of (𝑥𝑥 + 𝑦𝑦)𝑛𝑛 in powers of 𝑥𝑥 and 𝑦𝑦 for a positive integer 𝑢𝑢, where 𝑥𝑥 and 𝑦𝑦 are any numbers, with coefficients determined, for example, by Pascal’s Triangle.
A.APR.D. Rewrite rational expressions.
6. Rewrite simple rational expressions in different forms using inspection, long division, or, for the more complicated examples, a computer algebra system.
Example: Write 𝑎𝑎(𝑥𝑥)𝑏𝑏(𝑥𝑥)
in the form 𝑞𝑞(𝑥𝑥) + 𝑟𝑟(𝑥𝑥)𝑏𝑏(𝑥𝑥)
where 𝑎𝑎(𝑥𝑥),𝑏𝑏(𝑥𝑥), 𝑞𝑞(𝑥𝑥), and 𝑢𝑢(𝑥𝑥) are
polynomials with the degree of 𝑢𝑢(𝑥𝑥) less than the degree of 𝑏𝑏(𝑥𝑥).
7. (+) Demonstrate understanding that rational expressions form a system analogous to the rational numbers, closed under addition, subtraction, multiplication, and division by a nonzero rational expression; add, subtract, multiply, and divide rational expressions.
Creating Equations – A.CED A.CED.A. Create equations that describe numbers or relationships.
1. Create one-variable equations and inequalities to solve problems, including linear, quadratic, rational, and exponential functions.

CREATED 12/02/2021 DRAFT 7 – Idaho Content Standards/ Mathematics / SDE / 133
Example: Four people may be seated at one rectangular table. If two rectangular tables are placed together end-to-end, six people may be seated at the table. If ten tables are placed together end-to-end, how many people can be seated? How many tables are needed for 𝑢𝑢 people?
2. Interpret the relationship between two or more quantities.
a. Define variables to represent the quantities and write equations to show the relationship.
Example: The cost of parking in the parking garage is $2.00 for the first hour and $1.00 for every hour after that. Write an equation in terms of 𝑥𝑥 and 𝑦𝑦 that shows the total cost for parking, 𝑦𝑦, for 𝑥𝑥 hours. Use the equation to calculate the cost for parking in the garage for 5 hours.
b. Use graphs to show a visual representation of the relationship while adhering to appropriate labels and scales.
Example: Using the equation from A.CED.A.2.a, show how the graph of the equation can be used to predict the cost for a specified amount of time.
3. Represent constraints using equations or inequalities and interpret solutions as viable or non-viable options in a modeling context.
4. Represent constraints using systems of equations and/or inequalities and interpret solutions as viable or non-viable options in a modeling context.
5. Rearrange formulas to highlight a quantity of interest, using the same reasoning as in solving equations.
Example: Rearrange Ohm’s law 𝑉𝑉 = 𝐼𝐼𝐼𝐼 to highlight resistance 𝐼𝐼.
Reasoning with Equations and Inequalities – A.REI A.REI.A. Understand solving equations as a process of reasoning and explain the reasoning.
1. Explain each step in solving a simple equation as following from the equality of numbers asserted at the previous step, starting from the assumption that the original equation has a solution. Construct a viable argument to justify or refute a solution method.
2. Solve simple rational and radical equations in one variable, and give examples showing how extraneous solutions may arise.
A.REI.B. Solve equations and inequalities in one variable.
3. Solve linear equations and inequalities in one variable, including equations with coefficients represented by letters.

CREATED 12/02/2021 DRAFT 7 – Idaho Content Standards/ Mathematics / SDE / 134
a. Solve linear equations and inequalities in one variable involving absolute value.
4. Solve quadratic equations in one variable.
a. Use the method of completing the square to transform any quadratic equation in 𝑥𝑥 into an equation of the form (𝑥𝑥– 𝑝𝑝)2 = 𝑞𝑞 that has the same solutions. Derive the quadratic formula from this form.
b. Solve quadratic equations by inspection (e.g., for 𝑥𝑥2 = 49), taking square roots, completing the square, the quadratic formula, and factoring, as appropriate to the initial form of the equation. Recognize when the quadratic formula gives complex solutions and write them as 𝑎𝑎 ± 𝑏𝑏𝑛𝑛 for real numbers 𝑎𝑎 and 𝑏𝑏.
A.REI.C. Solve systems of equations.
5. Verify that, given a system of two equations in two variables, replacing one equation by the sum of that equation and a multiple of the other produces a system with the same solutions.
6. Solve systems of linear equations exactly and approximately (e.g., with graphs), focusing on pairs of linear equations in two variables.
Example: A school club is selling hats and t-shirts for a fundraiser. The group expects to sell a total of 50 items. They make a profit of 15 dollars for each t-shirt sold and 5 dollars for each hat sold. How many hats and t-shirts will the school club need to sell to make a profit of $300?
7. Solve a simple system consisting of a linear equation and a quadratic equation in two variables algebraically and graphically.
Example: Find the points of intersection between the line 𝑦𝑦 = – 3𝑥𝑥 and the circle
𝑥𝑥2 + 𝑦𝑦2 = 3.
8. (+) Represent a system of linear equations as a single matrix equation in a vector variable.
9. (+) Find the inverse of a matrix if it exists and use it to solve systems of linear equations (using technology for matrices of dimension 3 × 3 or greater).
A.REI.D. Represent and solve equations and inequalities graphically.
10. Demonstrate understanding that the graph of an equation in two variables is the set of all its solutions plotted in the coordinate plane. Show that any point on the graph of an equation in two variables is a solution to the equation.
11. Explain why the x-coordinates of the points where the graphs of the equations 𝑦𝑦 = 𝑓𝑓(𝑥𝑥) and 𝑦𝑦 = 𝑔𝑔(𝑥𝑥) intersect are the solutions of the equation 𝑓𝑓(𝑥𝑥) = 𝑔𝑔(𝑥𝑥); find the solutions

CREATED 12/02/2021 DRAFT 7 – Idaho Content Standards/ Mathematics / SDE / 135
approximately. Include cases where 𝑓𝑓(𝑥𝑥) and/or 𝑔𝑔(𝑥𝑥) are linear, polynomial, rational, absolute value, exponential, and logarithmic functions.
Example: Use technology to graph the functions, make tables of values, or find successive approximations.
12. Graph the solutions to a linear inequality in two variables as a half-plane (excluding the boundary in the case of a strict inequality), and graph the solution set to a system of linear inequalities in two variables as the intersection of the corresponding half-planes.

CREATED 12/02/2021 DRAFT 7 – Idaho Content Standards/ Mathematics / SDE / 136
Grades 9 – 12 Functions (F) Functions describe situations where one quantity determines another. For example, the return on $10,000 invested at an annualized percentage rate of 4.25% is a function of the length of time the money is invested. Because we continually make theories about dependencies between quantities in nature and society, functions are important tools in the construction of mathematical models.
In grades 9 – 12 mathematics, functions usually have numerical inputs and outputs and are often defined by an algebraic expression. For example, the time in hours it takes for a car to
drive 100 miles is a function of the car’s speed in miles per hour, 𝑣𝑣; the rule 𝑇𝑇(𝑣𝑣) = 100𝑣𝑣
expresses this relationship algebraically and defines a function whose name is 𝑇𝑇.
The set of inputs to a function is called its domain. We often infer the domain to be all inputs for which the expression defining a function has a value, or for which the function makes sense in a given context.
A function can be described in various ways, such as, by a graph (e.g., the trace of a seismograph); by a verbal rule, as in, “I’ll give you a state, you give me the capital city”; by an algebraic expression like 𝑓𝑓(𝑥𝑥) = 𝑎𝑎 + 𝑏𝑏𝑥𝑥; or by a recursive rule. The graph of a function is often a useful way of visualizing the relationship of the function models, and manipulating a mathematical expression for a function can throw light on the function’s properties.
Functions presented as expressions can model many important phenomena. Two important families of functions characterized by laws of growth are linear functions, which grow at a constant rate, and exponential functions, which grow at a constant percent rate. Linear functions with a constant term of zero describe proportional relationships.
A graphing utility or a computer algebra system can be used to experiment with properties of these functions and their graphs and to build computational models of functions, including recursively defined functions.
Connections to Expressions, Equations, Modeling, and Coordinates
Determining an output value for a particular input involves evaluating an expression; finding inputs that yield a given output involves solving an equation. Questions about when two functions have the same value for the same input lead to equations whose solutions can be visualized from the intersection of their graphs. Because functions describe relationships between quantities, they are frequently used in modeling. Sometimes functions are defined by a recursive process, which can be displayed effectively using a spreadsheet or other technology.

CREATED 12/02/2021 DRAFT 7 – Idaho Content Standards/ Mathematics / SDE / 137
Note: Standards with a ★ indicate a modeling standard. Standards with a (+) represent standards for advanced classes such as calculus, advanced statistics, or discrete mathematics. Standards without a (+) are the present standards for all college and career ready students.

CREATED 12/02/2021 DRAFT 7 – Idaho Content Standards/ Mathematics / SDE / 138
Grades 9 – 12 Functions Overview
Interpreting Functions
A. Understand the concept of a function and use function notation.
B. Interpret functions that arise in applications in terms of the context. Include linear, quadratic, exponential, rational, polynomial, square root and cube root, trigonometric, and logarithmic functions.
C. Analyze functions using different representations.
Building Functions
A. Build a function that models a relationship between two quantities.
B. Build new functions from existing functions.
Linear, Quadratic, and Exponential Models
A. Construct and compare linear, quadratic, and exponential models and solve problems.
B. Interpret expressions for functions in terms of the situation they model.
Trigonometric Functions
A. Extend the domain of trigonometric functions using the unit circle.
B. Model periodic phenomena with trigonometric functions.
C. Prove and apply trigonometric identities.
Standards for Mathematical Practice
1. Make sense of problems and persevere in solving them.
2. Reason abstractly and quantitatively.
3. Construct viable arguments and critique the reasoning of others.
4. Model with mathematics. 5. Use appropriate tools
strategically. 6. Attend to precision. 7. Look for and make use of
structure. 8. Look for and express regularity
in repeated reasoning.

CREATED 12/02/2021 DRAFT 7 – Idaho Content Standards/ Mathematics / SDE / 139
Interpreting Functions – F.IF F.IF.A. Understand the concept of a function and use function notation.
1. Demonstrate understanding that a function is a correspondence from one set (called the domain) to another set (called the range) that assigns to each element of the domain exactly one element of the range: If 𝑓𝑓 is a function and 𝑥𝑥 is an element of its domain, then 𝑓𝑓(𝑥𝑥) denotes the output of 𝑓𝑓 corresponding to the input 𝑥𝑥. The graph of 𝑓𝑓 is the graph of the equation 𝑦𝑦 = 𝑓𝑓(𝑥𝑥).
2. Use function notation, evaluate functions for inputs in their domains, and interpret statements that use function notation in terms of a context.
Example: Given a function representing a car loan, determine the balance of the loan at different points in time.
3. Demonstrate that a sequence is a functions, sometimes defined recursively, whose domain is a subset of the integers.
Example: The Fibonacci sequence is defined recursively by 𝑓𝑓(0) = 𝑓𝑓(1) = 1,
𝑓𝑓(𝑢𝑢 + 1) = 𝑓𝑓(𝑢𝑢) + 𝑓𝑓(𝑢𝑢 − 1) for 𝑢𝑢 ≥ 1.
F.IF.B. Interpret functions that arise in applications in terms of the context. Include linear, quadratic, exponential, rational, polynomial, square root and cube root, trigonometric, and logarithmic functions.
4. For a function that models a relationship between two quantities, interpret key features of graphs and tables in terms of the quantities, and sketch graphs showing key features given a verbal description of the relationship. Key features include: intercepts; intervals where the function is increasing, decreasing, positive, or negative; relative maxima and minima; symmetries; end behavior; and periodicity.
Example: Given a context or verbal description of a relationship, sketch a graph that models the context or description and shows its key features.
5. Relate the domain of a function to its graph and, where applicable, to the quantitative relationship it describes.★
Example: If the function ℎ(𝑢𝑢) gives the number of person-hours it takes to assemble 𝑢𝑢 engines in a factory, then the positive integers would be an appropriate domain for the function.
6. Calculate and interpret the average rate of change of a function (presented symbolically or as a table) over a specified interval. Estimate the rate of change from a graph.★
F.IF.C. Analyze functions using different representations.

CREATED 12/02/2021 DRAFT 7 – Idaho Content Standards/ Mathematics / SDE / 140
7. Graph functions expressed symbolically and show key features of the graphs, by hand in simple cases and using technology for more complicated cases.★
a. Graph linear and quadratic functions and show intercepts, maxima, and minima.★
b. Graph square root, cube root, and piecewise-defined functions, including step functions and absolute value functions.★
c. Graph polynomial functions, identifying zeros when suitable factorizations are available, and showing end behavior.★
d. (+) Graph rational functions, identifying zeros and asymptotes when suitable factorizations are available, and showing end behavior.★
e. Graph exponential and logarithmic functions, showing intercepts and end behavior, and trigonometric functions, showing period, midline, and amplitude.★
8. Write a function defined by an expression in different but equivalent forms to reveal and explain different properties of the function.
a. Use the process of factoring and/or completing the square in quadratic and polynomial functions, where appropriate, to show zeros, extreme values, and symmetry of the graph, and interpret these in terms of a context.
Example: Suppose ℎ(𝑡𝑡) = −5𝑡𝑡2 + 10𝑡𝑡 + 3 represents the height of a diver above the water (in meters), 𝑡𝑡 seconds after the diver leaves the springboard. What is the maximum height above the water the diver reaches? After how many seconds, 𝑡𝑡, does the diver hit the water?
b. Use the properties of exponents to interpret expressions for exponential functions. Apply to financial situations such as identifying appreciation and depreciation rate for the value of a house or car sometime after its initial purchase.
Example: The equation for radioactive decay is 𝐴𝐴 = 𝐴𝐴0 �12� 𝑡𝑡 ℎ� . When 𝐴𝐴0 is the original
amount of a radioactive substance, 𝐴𝐴 is the final amount, ℎ is the half-life of the substance, and 𝑡𝑡 is time. Hagerman, Idaho is a hotbed of fossil hunting. The half-life of carbon-14 is about 5730 years. If a fossil that was found in Hagerman contains 54 grams of carbon-14 at time 𝑡𝑡 = 0, how much carbon-14 remains at time 𝑡𝑡 = 17190 years?
9. Compare properties of two functions each represented in a different way (algebraically, graphically, numerically in tables, or by verbal descriptions).

CREATED 12/02/2021 DRAFT 7 – Idaho Content Standards/ Mathematics / SDE / 141
Example: Given a graph of one polynomial function and an algebraic expression for another, say which has the larger/smaller relative maximum and/or minimum.
10. Given algebraic, numeric and/or graphical representations of functions, recognize the function as polynomial, rational, logarithmic, exponential, or trigonometric.
Building Functions – F.BF F.BF.A. Build a function that models a relationship between two quantities.
1. Write a function that describes a relationship between two quantities. Functions could include linear, exponential, quadratic, simple rational, radical, logarithmic, and trigonometric.
a. Determine an explicit expression, a recursive process, or steps for calculation from a context.
b. Combine standard function types using arithmetic operations.
Example: Build a function that models the temperature of a cooling body by adding a constant function to a decaying exponential, and relate these functions to the model.
c. (+) Compose functions.
Example: If 𝑇𝑇(𝑦𝑦) is the temperature in the atmosphere as a function of height, and ℎ(𝑡𝑡) is the height of a weather balloon as a function of time, then 𝑇𝑇(ℎ(𝑡𝑡)) is the temperature at the location of the weather balloon as a function of time.
2. Write arithmetic and geometric sequences both recursively and with an explicit formula, use them to model situations, and translate between the two forms.★
Example: If the U.S. Census Bureau wrote the following recursive equation to represent how they estimate Idaho’s population will grow each year after 2019: 𝑃𝑃(𝑢𝑢) = 1.023 ∙ 𝑃𝑃(𝑢𝑢 − 1), 𝑃𝑃(0) = 1,787,000. 𝑃𝑃(𝑢𝑢) represents Idaho’s population at the end of the 𝑢𝑢𝑡𝑡ℎ year in terms of Idaho’s population at the end of the (𝑢𝑢 − 1)𝑡𝑡ℎ year, 𝑃𝑃(𝑢𝑢 − 1). Predict Idaho’s population in 2040.
F.BF.B. Build new functions from existing functions.
3. Identify the effect on the graph of replacing 𝑓𝑓(𝑥𝑥) by 𝑓𝑓(𝑥𝑥) + 𝑘𝑘,𝑘𝑘𝑓𝑓(𝑥𝑥),𝑓𝑓(𝑘𝑘𝑥𝑥), and 𝑓𝑓(𝑥𝑥 + 𝑘𝑘) for specific values of 𝑘𝑘 (both positive and negative); find the value of 𝑘𝑘 given the graphs. Include, linear, quadratic, exponential, absolute value, simple rational and radical, logarithmic, and trigonometric functions. Utilize technology to experiment with cases and illustrate an explanation of the effects on the graph. Include recognizing even and odd functions from their graphs and algebraic expressions for them.

CREATED 12/02/2021 DRAFT 7 – Idaho Content Standards/ Mathematics / SDE / 142
4. Find inverse functions algebraically and graphically.
a. Solve an equation of the form 𝑓𝑓(𝑥𝑥) = 𝑐𝑐 for a simple function 𝑓𝑓 that has an inverse and write an expression for the inverse. Include linear and simple polynomial, rational, and exponential functions.
Example: 𝑓𝑓(𝑥𝑥) = 2𝑥𝑥3 or 𝑓𝑓(𝑥𝑥) = 𝑥𝑥+1𝑥𝑥−1
for 𝑥𝑥 ≠ 1
b. (+) Verify by composition that one function is the inverse of another.
c. (+) Read values of an inverse function from a graph or a table, given that the function has an inverse.
d. (+) Produce an invertible function from a non-invertible function by restricting the domain.
5. (+) Understand the inverse relationship between exponents and logarithms and use this relationship to solve problems involving logarithms and exponents.
Linear, Quadratic, and Exponential Models – F.LE F.LE.A. Construct and compare linear, quadratic, and exponential models and solve problems.
1. Distinguish between situations that can be modeled with linear functions and with exponential functions.★
a. Demonstrate that linear functions grow by equal differences over equal intervals, and that exponential functions grow by equal factors over equal intervals.
b. Identify situations in which one quantity changes at a constant rate per unit interval relative to another.
c. Identify situations in which a quantity grows or decays by a constant percent rate per unit interval relative to another.
2. Construct linear and exponential functions, including arithmetic and geometric sequences, given a graph, a description of a relationship, or two input-output pairs (including reading these from a table).★
3. Use graphs and tables to demonstrate that a quantity increasing exponentially eventually exceeds a quantity increasing linearly, quadratically, or (more generally) as a polynomial function.★
Example: Becca’s parents are saving for her college education by putting $3,000/year in a safe deposit box. Becca’s grandpa is also saving for her college education by putting
CREATED 12/02/2021 DRAFT 7 – Idaho Content Standards/ Mathematics / SDE / 143
$2,000/year in an IDeal (Idaho college savings) account with an APR of 6.17%. Build tables to show which account has the most money after ten years, and how much more? How many years will it take for the total in her grandpa’s account to exceed the total in her parents’ safe deposit box?
4. For exponential models, express as a logarithm the solution to 𝑎𝑎𝑏𝑏𝑐𝑐𝑡𝑡 = 𝑢𝑢 where 𝑎𝑎, 𝑐𝑐, and 𝑢𝑢 are numbers and the base 𝑏𝑏 is 2, 10, or 𝑢𝑢; evaluate the logarithm using technology.★
Example: Mr. Rico has a savings account that has an interest rate of 7% compounded continuously. The amount in the account is calculated using 𝐴𝐴 = 𝑃𝑃𝑢𝑢𝑟𝑟𝑡𝑡. If Mr. Rico invested $30,000 on January 1, 2020, when will he have $100,000 in the account?
F.LE.B. Interpret expressions for functions in terms of the situation they model.
5. Interpret the parameters in a linear or exponential function (of the form 𝑓𝑓(𝑥𝑥) = 𝑏𝑏𝑥𝑥 + 𝑘𝑘) in terms of a context.★
Trigonometric Functions – F.TF T.TF.A. Extend the domain of trigonometric functions using the unit circle.
1. Demonstrate radian measure as the ratio of the arc length subtended by a central angle to the length of the radius of the unit circle.
a. Use radian measure to solve problems.
Example: You live in New Meadows, Idaho, which is located on the 45th parallel (45° North latitude). Approximately how far will you drive, in miles, to attend the Calgary Stampede? Calgary is located at 51°N latitude, almost due North of New Meadows. (Use 𝑢𝑢 = 3960 miles for the radius of the Earth.)
2. Explain how the unit circle in the coordinate plane enables the extension of trigonometric functions to all real numbers, interpreted as radian measures of angles traversed counterclockwise around the unit circle.
3. (+) Use special triangles to determine geometrically the values of sine, cosine, tangent for 𝜋𝜋3,
𝜋𝜋4, and 𝜋𝜋
6, and use the unit circle to express the values of sine, cosine, and tangent for 𝜋𝜋 − 𝑥𝑥,
𝜋𝜋 + 𝑥𝑥, and 2𝜋𝜋 − 𝑥𝑥 in terms of their values for 𝑥𝑥, where 𝑥𝑥 is any real number.
4. (+) Use the unit circle to explain symmetry (odd and even) and periodicity of trigonometric functions.
T.TF.B. Model periodic phenomena with trigonometric functions.
5. Model periodic phenomena using trigonometric functions with specified amplitude, frequency, and midline.

CREATED 12/02/2021 DRAFT 7 – Idaho Content Standards/ Mathematics / SDE / 144
Example: This past summer you and your friends decided to ride the Ferris wheel at the Idaho State Fair. You wondered how high the highest point on the Ferris wheel was. You asked the operator, and he didn’t know, but he told you that the height of the chair was 5 ft off the ground when you got on and the center of the Ferris wheel is 30 ft above that. You checked your phone when you got on and figured out that it took you 12 mins to make one full revolution. Create a model to show your height from the platform at any given time on the Ferris wheel.
6. (+) Understand that restricting a trigonometric function to a domain on which it is always increasing or always decreasing allows its inverse to be constructed.
7. (+) Use inverse functions to solve trigonometric equations that arise in modeling contexts; evaluate the solutions using technology, and interpret them in terms of the context.★
T.TF.C. Prove and apply trigonometric identities.
8. Relate the Pythagorean Theorem to the unit circle to discover the Pythagorean identity 𝑢𝑢𝑛𝑛𝑢𝑢2(𝜃𝜃) + 𝑐𝑐𝑜𝑜𝑢𝑢2(𝜃𝜃) = 1 and use the Pythagorean identity to find the value of a trigonometric function (𝑢𝑢𝑛𝑛𝑢𝑢(𝜃𝜃), 𝑐𝑐𝑜𝑜𝑢𝑢(𝜃𝜃), 𝑜𝑜𝑢𝑢 𝑡𝑡𝑎𝑎𝑢𝑢(𝜃𝜃)) given one trigonometric function (𝑢𝑢𝑛𝑛𝑢𝑢(𝜃𝜃), 𝑐𝑐𝑜𝑜𝑢𝑢(𝜃𝜃), 𝑜𝑜𝑢𝑢 𝑡𝑡𝑎𝑎𝑢𝑢(𝜃𝜃)) and the quadrant of the angle.
Example: Suppose that cos(𝜃𝜃) = 25 and that 𝜃𝜃 is in the 4th quadrant. Find the exact value of
sin(𝜃𝜃) and tan(𝜃𝜃).
9. (+) Prove the addition and subtraction formulas for sine, cosine, and tangent and use them to solve problems.

CREATED 12/02/2021 DRAFT 7 – Idaho Content Standards/ Mathematics / SDE / 145
Grades 9 – 12 Modeling (★) Modeling links classroom mathematics and statistics to everyday life, work, and decision-making. Modeling is the process of choosing and using appropriate mathematics and statistics to analyze empirical situations, to understand them better, and to improve decisions. Quantities and their relationships in physical, economic, public policy, social, and everyday situations can be modeled using mathematical and statistical methods. When making mathematical models, technology is valuable for varying assumptions, exploring consequences, and comparing predictions with data.
A model can be very simple, such as writing total cost as a product of unit price and number bought or using a geometric shape to describe a physical object like a coin. Even such simple models involve making choices. It is up to us whether to model a coin as a three-dimensional cylinder, or whether a two-dimensional disk works well enough for our purposes. Other situations—modeling a delivery route, a production schedule, or a comparison of loan amortizations—need more elaborate models that use other tools from the mathematical sciences. Real-world situations are not organized and labeled for analysis; formulating tractable models, representing such models, and analyzing them is appropriately a creative process. Like every such process, this depends on acquired expertise as well as creativity.
Some examples of such situations might include:
• Estimating how much water and food is needed for emergency relief in a devastated city of three million people, and how it might be distributed.
• Planning a table tennis tournament for seven players at a club with four tables, where each player plays against each other player.
• Designing the layout of the stalls in a school fair so as to raise as much money as possible.
• Analyzing stopping distance for a car. • Model a savings account balance, bacterial colony growth, or investment growth. • Engaging in critical path analysis, e.g., applied to turnaround of an aircraft at an airport. • Analyzing risk in situations such as extreme sports, pandemics, and terrorism. • Relating population statistics to individual predictions.
In situations like these, the models devised depend on a number of factors: How precise an answer do we want or need? What aspects of the situation do we most need to understand, control, or optimize? What resources of time and tools do we have? The range of models that we can create and analyze is also constrained by the limitations of our mathematical, statistical, and technical skills, and our ability to recognize significant variables and relationships among them. Diagrams of various kinds, spreadsheets and other technology, and algebra are powerful
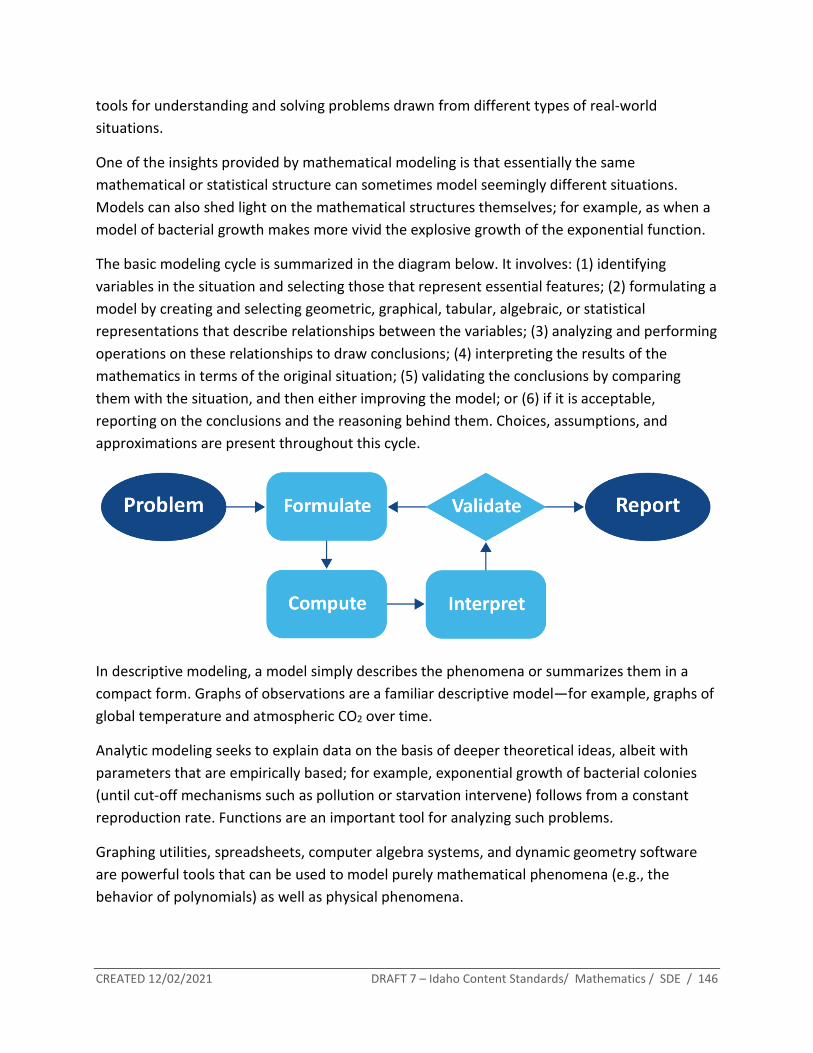
CREATED 12/02/2021 DRAFT 7 – Idaho Content Standards/ Mathematics / SDE / 146
tools for understanding and solving problems drawn from different types of real-world situations.
One of the insights provided by mathematical modeling is that essentially the same mathematical or statistical structure can sometimes model seemingly different situations. Models can also shed light on the mathematical structures themselves; for example, as when a model of bacterial growth makes more vivid the explosive growth of the exponential function.
The basic modeling cycle is summarized in the diagram below. It involves: (1) identifying variables in the situation and selecting those that represent essential features; (2) formulating a model by creating and selecting geometric, graphical, tabular, algebraic, or statistical representations that describe relationships between the variables; (3) analyzing and performing operations on these relationships to draw conclusions; (4) interpreting the results of the mathematics in terms of the original situation; (5) validating the conclusions by comparing them with the situation, and then either improving the model; or (6) if it is acceptable, reporting on the conclusions and the reasoning behind them. Choices, assumptions, and approximations are present throughout this cycle.
In descriptive modeling, a model simply describes the phenomena or summarizes them in a compact form. Graphs of observations are a familiar descriptive model—for example, graphs of global temperature and atmospheric CO2 over time.
Analytic modeling seeks to explain data on the basis of deeper theoretical ideas, albeit with parameters that are empirically based; for example, exponential growth of bacterial colonies (until cut-off mechanisms such as pollution or starvation intervene) follows from a constant reproduction rate. Functions are an important tool for analyzing such problems.
Graphing utilities, spreadsheets, computer algebra systems, and dynamic geometry software are powerful tools that can be used to model purely mathematical phenomena (e.g., the behavior of polynomials) as well as physical phenomena.

CREATED 12/02/2021 DRAFT 7 – Idaho Content Standards/ Mathematics / SDE / 147
Modeling Standards
Modeling is best interpreted, not as a collection of isolated topics, but rather in relation to other standards. Making mathematical models is a Standard for Mathematical Practice, and specific Modeling standards appear throughout the high school standards, indicated by a star symbol ().

CREATED 12/02/2021 DRAFT 7 – Idaho Content Standards/ Mathematics / SDE / 148
Grades 9 – 12 Geometry (G) An understanding of the attributes and relationships of geometric objects can be applied in diverse contexts—interpreting a schematic drawing, estimating the amount of wood needed to frame a sloping roof, rendering computer graphics, or designing a sewing pattern for the most efficient use of material.
Although there are many types of geometry, school mathematics is devoted primarily to plane Euclidean geometry, studied both synthetically (without coordinates) and analytically (with coordinates). Euclidean geometry is characterized most importantly by the Parallel Postulate that through a point not on a given line there is exactly one parallel line. (Spherical geometry, in contrast, has no parallel lines.)
During grades 9 – 12 mathematics, students begin to formalize their geometry experiences from elementary and middle school, using more precise definitions and developing careful proofs. Later in college, some students develop Euclidean and other geometries carefully from a small set of axioms.
The concepts of congruence, similarity, and symmetry can be understood from the perspective of geometric transformation. Fundamental are the rigid motions: translations, rotations, reflections, and combinations of these, all of which are here assumed to preserve distance and angles (and therefore shapes generally). Reflections and rotations each explain a particular type of symmetry, and the symmetries of an object offer insight into its attributes—as when the reflective symmetry of an isosceles triangle assures that its base angles are congruent.
In the approach taken here, two geometric figures are defined to be congruent if there is a sequence of rigid motions that carries one onto the other. This is the principle of superposition. For triangles, congruence means the equality of all corresponding pairs of sides and all corresponding pairs of angles. During the middle grades, through experiences drawing triangles from given conditions, students notice ways to specify enough measures in a triangle to ensure that all triangles drawn with those measures are congruent. Once these triangle congruence criteria (ASA, SAS, and SSS) are established using rigid motions, they can be used to prove theorems about triangles, quadrilaterals, and other geometric figures.
Similarity transformations (rigid motions followed by dilations) define similarity in the same way that rigid motions define congruence, thereby formalizing the similarity ideas of “same shape” and “scale factor” developed in the middle grades. These transformations lead to the criterion for triangle similarity that two pairs of corresponding angles are congruent.
The definitions of sine, cosine, and tangent for acute angles are founded on right triangles and similarity, and, with the Pythagorean Theorem, are fundamental in many real-world and

CREATED 12/02/2021 DRAFT 7 – Idaho Content Standards/ Mathematics / SDE / 149
theoretical situations. The Pythagorean Theorem is generalized to non-right triangles by the Law of Cosines. Together, the Laws of Sines and Cosines embody the triangle congruence criteria for the cases where three pieces of information suffice to completely solve a triangle. Furthermore, these laws yield two possible solutions in the ambiguous case, illustrating that Side-Side-Angle is not a congruence criterion.
Connections to Equations
Analytic geometry connects algebra and geometry, resulting in powerful methods of analysis and problem solving. Just as the number line associates numbers with locations in one dimension, a pair of perpendicular axes associates pairs of numbers with locations in two dimensions.
This correspondence between numerical coordinates and geometric points allows methods from algebra to be applied to geometry and vice versa. The solution set of an equation becomes a geometric curve, making visualization a tool for doing and understanding algebra. Geometric shapes can be described by equations, making algebraic manipulation into a tool for geometric understanding, modeling, and proof. Geometric transformations of the graphs of equations correspond to algebraic changes in their equations.
Dynamic geometry environments provide students with experimental and modeling tools that allow them to investigate geometric phenomena in much the same way as computer algebra systems allow them to experiment with algebraic phenomena.
Note: Standards with a ★ indicate a modeling standard. Standards with a (+) represent standards for advanced classes such as calculus, advanced statistics, or discrete mathematics. Standards without a (+) are the present standards for all college and career ready students.

CREATED 12/02/2021 DRAFT 7 – Idaho Content Standards/ Mathematics / SDE / 150
Grades 9 – 12 Geometry Overview
Congruence
A. Experiment with transformations in the plane.
B. Understand congruence in terms of rigid motions.
C. Prove geometric theorems and, when appropriate, the converse of theorems.
D. Make geometric constructions.
Similarity, Right Triangles, and Trigonometry
A. Understand similarity in terms of similarity transformations.
B. Prove theorems involving similarity.
C. Define trigonometric ratios and solve problems involving right triangles.
D. Apply trigonometry to general triangles.
Circles
A. Understand and apply theorems about circles.
B. Find arc lengths and areas of sectors of circles.
Expressing Geometric Properties with Equations
A. Translate between the geometric description and the equation for a conic section.
B. Use coordinates to prove simple geometric theorems algebraically.
Geometric Measurement and Dimension
A. Explain volume formulas and use them to solve problems.
B. Visualize relationships between two-dimensional and three-dimensional objects.
Modeling with Geometry
A. Apply geometric concepts in modeling situations.
Standards for Mathematical Practice
1. Make sense of problems and persevere in solving them.
2. Reason abstractly and quantitatively.
3. Construct viable arguments and critique the reasoning of others.
4. Model with mathematics. 5. Use appropriate tools
strategically. 6. Attend to precision. 7. Look for and make use of
structure. 8. Look for and express regularity
in repeated reasoning.

CREATED 12/02/2021 DRAFT 7 – Idaho Content Standards/ Mathematics / SDE / 151
Congruence – G.CO G.CO.A. Experiment with transformations in the plane.
1. Know precise definitions of angle, circle, perpendicular line, parallel line, and line segment, based on the undefined notions of point, line, distance along a line, and distance around a circular arc.
2. Represent transformations in the plane and describe transformations as functions that take points in the plane as inputs and give other points as outputs. Compare transformations that preserve distance and angle to those that do not.
Example: Translation versus horizontal stretch.
3. Describe the rotations and reflections that carry a given figure (rectangle, parallelogram, trapezoid, or regular polygon) onto itself.
4. Develop definitions of rotations, reflections, and translations in terms of angles, circles, perpendicular lines, parallel lines, and line segments.
5. Draw the transformation (rotation, reflection, or translation) for a given geometric figure.
Example: Given quadrilateral 𝑇𝑇𝑇𝑇𝑇𝑇𝑇𝑇 with vertices 𝑇𝑇(0,−1), 𝑇𝑇(3,−2), 𝑇𝑇(−1,−5), and 𝑇𝑇(−3,−2), reflect the shape across the 𝑥𝑥-axis.
6. Specify a sequence of transformations that will carry a given figure onto another.
G.CO.B. Understand congruence in terms of rigid motions.
7. Use geometric descriptions of rigid motions to transform figures and to predict the effect of a given rigid motion on a given figure; given two figures, use the definition of congruence in terms of rigid motions to decide if they are congruent.
8. Use the definition of congruence in terms of rigid motions to show that two triangles are congruent if and only if corresponding pairs of sides and corresponding pairs of angles are congruent.
9. Explain how the criteria for triangle congruence (ASA, SAS, and SSS) follow from the definition of congruence in terms of rigid motions.
Example: In ∆𝐴𝐴𝐵𝐵𝐶𝐶 and ∆𝐴𝐴𝐵𝐵𝐴𝐴 (with shared side 𝐴𝐴𝐵𝐵����), we are given that ∠𝐵𝐵𝐴𝐴𝐶𝐶 ≅ ∠𝐵𝐵𝐴𝐴𝐴𝐴 and ∠𝐴𝐴𝐵𝐵𝐶𝐶 ≅ ∠𝐴𝐴𝐵𝐵𝐴𝐴. What pair(s) of corresponding parts is/are needed to ensure the triangles are congruent by either ASA, SAS, or SSS? What rigid motion would show the triangles are congruent?
G.CO.C. Prove geometric theorems and, when appropriate, the converse of theorems.

CREATED 12/02/2021 DRAFT 7 – Idaho Content Standards/ Mathematics / SDE / 152
10. Prove theorems about lines and angles. Theorems include: vertical angles are congruent; when a transversal crosses parallel lines, alternate interior angles are congruent and corresponding angles are congruent, and conversely prove lines are parallel; points on a perpendicular bisector of a line segment are exactly those equidistant from the segment’s endpoints.
11. Prove theorems about triangles. Theorems include: measures of interior angles of a triangle sum to 180°; base angles of isosceles triangles are congruent, and conversely prove a triangle is isosceles; the segment joining midpoints of two sides of a triangle is parallel to the third side and half the length; the medians of a triangle meet at a point.
12. Prove theorems about parallelograms. Theorems include: opposite sides are congruent, opposite angles are congruent, the diagonals of a parallelogram bisect each other, and conversely, rectangles are parallelograms with congruent diagonals.
a. Prove theorems about polygons. Theorems include: the measures of interior and exterior angles; apply properties of polygons to the solutions of mathematical and contextual problems.
G.CO.D. Make geometric constructions.
13. Make formal geometric constructions with a variety of tools and methods (compass and straightedge, string, reflective devices, paper folding, dynamic geometric software, etc.) Constructions include: copying a segment; copying an angle; bisecting a segment; bisecting an angle; constructing perpendicular lines, including the perpendicular bisector of a line segment; and constructing a line parallel to a given line through a point not on the line.
14. Construct an equilateral triangle, a square, and a regular hexagon inscribed in a circle.
Similarity, Right Triangles, and Trigonometry – G.SRT G.SRT.A. Understand similarity in terms of similarity transformations.
1. Verify experimentally the properties of dilations given by a center and a scale factor.
a. A dilation takes a line not passing through the center of the dilation to a parallel line, and leaves a line passing through the center unchanged.
b. The dilation of a line segment is longer or shorter in the ratio given by the scale factor.
2. Use the definition of similarity to decide if two given figures are similar; explain using similarity transformations the meaning of similarity for triangles as the equality of all corresponding pairs of angles and the proportionality of all corresponding pairs of sides.

CREATED 12/02/2021 DRAFT 7 – Idaho Content Standards/ Mathematics / SDE / 153
3. Use the properties of similarity transformations to establish the Angle-Angle (AA) criterion for two triangles to be similar.
Example: Given ∆𝐴𝐴𝐵𝐵𝐶𝐶 and ∆𝐴𝐴𝑇𝑇𝐷𝐷, ∠𝐴𝐴 ≅ ∠𝐴𝐴, and ∠𝐵𝐵 ≅ ∠𝑇𝑇, show that ∆𝐴𝐴𝐵𝐵𝐶𝐶~ ∆𝐴𝐴𝑇𝑇𝐷𝐷 using a sequence of translations, rotations, reflections, and/or dilations.
G.SRT.B. Prove theorems involving similarity.
4. Prove theorems about triangles. Theorems include: a line parallel to one side of a triangle divides the other two proportionally, and conversely; the Pythagorean Theorem proved using triangle similarity.
5. Use congruence and similarity criteria for triangles to solve problems and to prove relationships in geometric figures.
Example: A high school student visits a giant cedar tree near the town of Elk River, Idaho and the end of his shadow lines up with the end of the tree’s shadow. The student is 6 feet tall and his shadow is 8 feet long. The cedar tree’s shadow is 228 feet long. How tall is the cedar tree?
G.SRT.C. Define trigonometric ratios and solve problems involving right triangles.
6. Demonstrate understanding that by similarity, side ratios in right triangles are properties of the angles in the triangle, leading to definitions of trigonometric ratios for acute angles.
7. Explain and use the relationship between the sine and cosine of complementary angles.
8. Use trigonometric ratios and the Pythagorean Theorem to solve right triangles in applied problems.★
Example: Mark and Ruth are rock climbing in the Snake River Canyon. Mark is anchoring the rope for Ruth. If the length of the rope from Mark to Ruth is 60 ft, with an angle of elevation of 23°, how far is Mark from the base of the cliff?
G.SRT.D. Apply trigonometry to general triangles.
9. (+) Derive the formula 𝐴𝐴 = 12𝑎𝑎𝑏𝑏𝑢𝑢𝑛𝑛𝑢𝑢(𝐶𝐶) for the area of a triangle by drawing an auxiliary line
from a vertex perpendicular to the opposite side.
10. (+) Prove the Laws of Sines and Cosines and use them to solve problems.
11. (+) Understand and apply the Law of Sines and the Law of Cosines to find unknown measurements in right and non-right triangles (e.g., surveying problems; resultant forces).

CREATED 12/02/2021 DRAFT 7 – Idaho Content Standards/ Mathematics / SDE / 154
Circles – G.C G.C.A. Understand and apply theorems about circles.
1. Prove that all circles are similar.
2. Identify and describe relationships among inscribed angles, radii, and chords. Include the relationship between central, inscribed, and circumscribed angles; inscribed angles on a diameter are right angles; the radius of a circle is perpendicular to the tangent where the radius intersects the circle.
3. Prove properties of angles for a quadrilateral and other polygons inscribed in a circle, by constructing the inscribed and circumscribed circles of a triangle.
4. (+) Construct a tangent line to a circle from a point outside the given circle.
G.C.B. Find arc lengths and areas of sectors of circles.
5. Derive using similarity the fact that the length of the arc intercepted by an angle is proportional to the radius, and define the radian measure of the angle as the constant of proportionality; derive the formula for the area of a sector.
Expressing Geometric Properties with Equations – G.GPE G.GPE.A. Translate between the geometric description and the equation for a conic section.
1. Derive the equation of a circle of given center and radius using the Pythagorean Theorem; complete the square to find the center and radius of a circle given by an equation.
2. Derive the equation of a parabola given a focus and directrix.
3. (+) Derive the equations of ellipses and hyperbolas given the foci, using the fact that the sum or difference of distances from the foci is constant.
a. (+) Use equations and graphs of conic sections to model real-world problems.
G.GPE.B. Use coordinates to prove simple geometric theorems algebraically.
4. Use coordinates to prove simple geometric theorems algebraically, including the distance formula and its relationship to the Pythagorean Theorem.
Example: Prove or disprove that a figure defined by four given points in the coordinate plane is a rectangle; prove or disprove that the point (1,√3) lies on the circle centered at the origin and containing the point (0, 2).
5. Prove the slope criteria for parallel and perpendicular lines and use them to solve geometric problems.

CREATED 12/02/2021 DRAFT 7 – Idaho Content Standards/ Mathematics / SDE / 155
Example: Find the equation of a line parallel or perpendicular to a given line that passes through a given point.
6. Find the point on a directed line segment between two given points that partitions the segment in a given ratio.
7. Use coordinates to compute perimeters of polygons and areas of triangles and rectangles (e.g., using the distance formula).★
Geometric Measurement and Dimension – G.GMD G.GMD.A. Explain volume formulas and use them to solve problems.
1. Give an informal argument for the formulas for the circumference of a circle; area of a circle; volume of a cylinder, pyramid, and cone. Use dissection arguments, Cavalieri’s principle, and informal limit arguments.
2. (+) Give an informal argument using Cavalieri’s principle for the formulas for the volume of a sphere and other solid figures.
3. Use volume formulas for cylinders, pyramids, cones, and spheres to solve problems.★
Example: The tank at the top of the Meridian Water Tower is roughly spherical. If the diameter of the sphere is 50.35 feet, approximately how much water can the tank hold?
G.GMD.B. Visualize relationships between two-dimensional and three-dimensional objects.
4. Identify the shapes of two-dimensional cross-sections of three-dimensional objects, and identify three-dimensional objects generated by rotations of two-dimensional objects.
Modeling with Geometry – G.MG G.MG.A. Apply geometric concepts in modeling situations.
1. Use geometric shapes, their measures, and their properties to describe objects.★
Example: Modeling a tree trunk or a human torso as a cylinder.
2. Apply concepts of density based on area and volume in modeling situations.★
Example: Persons per square mile, BTUs per cubic foot
3. Apply geometric methods to solve design problems.★
Example: Designing an object or structure to satisfy physical constraints or minimize cost; working with typographic grid systems based on ratios.
CREATED 12/02/2021 DRAFT 7 – Idaho Content Standards/ Mathematics / SDE / 156
4. Use dimensional analysis for unit conversions to confirm that expressions and equations make sense.★
CREATED 12/02/2021 DRAFT 7 – Idaho Content Standards/ Mathematics / SDE / 157
Grades 9 – 12 Statistics and Probability (S) Decisions or predictions are often based on data—numbers in context. These decisions or predictions would be easy if the data always sent a clear message, but the message is often obscured by variability. Statistics provides tools for describing variability in data and for making informed decisions that take it into account.
Data are gathered, displayed, summarized, examined, and interpreted to discover patterns and deviations from patterns. Quantitative data can be described in terms of key characteristics: measures of shape, center, and spread. The shape of a data distribution might be described as symmetric, skewed, flat, or bell shaped, and it might be summarized by a statistic measuring center (such as mean or median) and a statistic measuring spread (such as standard deviation or interquartile range). Different distributions can be compared numerically using these statistics or compared visually using plots. Knowledge of center and spread are not enough to describe a distribution. Which statistics to compare, which plots to use, and what the results of a comparison might mean depend on the question to be investigated and the real-life actions to be taken.
Randomization has two important uses in drawing statistical conclusions. First, collecting data from a random sample of a population makes it possible to draw valid conclusions about the whole population, taking variability into account. Second, randomly assigning individuals to different treatments allows a fair comparison of the effectiveness of those treatments. A statistically significant outcome is one that is unlikely to be due to chance alone, and this can be evaluated only under the condition of randomness. The conditions under which data are collected are important in drawing conclusions from the data. In critically reviewing uses of statistics in public media and other reports, it is important to consider the study design, how the data were gathered, and the analyses employed, as well as the data summaries and the conclusions drawn.
Random processes can be described mathematically by using a probability model: a list or description of the possible outcomes (the sample space), each of which is assigned a probability. In situations such as flipping a coin, rolling a number cube, or drawing a card, it might be reasonable to assume various outcomes are equally likely. In a probability model, sample points represent outcomes and combine to make up events; probabilities of events can be computed by applying the Addition and Multiplication Rules. Interpreting these probabilities relies on an understanding of independence and conditional probability, which can be approached through the analysis of two-way tables.

CREATED 12/02/2021 DRAFT 7 – Idaho Content Standards/ Mathematics / SDE / 158
Technology plays an important role in statistics and probability by making it possible to generate plots, regression functions, and correlation coefficients, and to simulate many possible outcomes in a short amount of time.
Connections to Functions and Modeling
Functions may be used to describe data; if the data suggest a linear relationship, the relationship can be modeled with a regression line, and its strength and direction can be expressed through a correlation coefficient.
Note: Standards with a ★ indicate a modeling standard. Standards with a (+) represent standards for advanced classes such as calculus, advanced statistics, or discrete mathematics. Standards without a (+) are the present standards for all college and career ready students.

CREATED 12/02/2021 DRAFT 7 – Idaho Content Standards/ Mathematics / SDE / 159
Grades 9 – 12 Statistics and Probability Overview
Interpreting Categorical and Quantitative Data
A. Summarize, represent, and interpret data on a single count or measurement variable. Use calculators, spreadsheets, and other technology as appropriate.
B. Summarize, represent, and interpret data on two categorical and quantitative variables.
C. Interpret linear models.
Making Inferences and Justifying Conclusions
A. Understand and evaluate random processes underlying statistical studies. Use calculators, spreadsheets, and other technology as appropriate.
B. Make inferences and justify conclusions from sample surveys, experiments, and observational studies.
Conditional Probability and the Rules of Probability
A. Understand independence and conditional probability and use them to interpret data from simulations or experiments.
B. Use the rules of probability to compute probabilities of compound events in a uniform probability model.
Using Probability to Make Decisions
A. Calculate expected values and use them to solve problems.
B. Use probability to evaluate outcomes of decisions.
Standards for Mathematical Practice
1. Make sense of problems and persevere in solving them.
2. Reason abstractly and quantitatively.
3. Construct viable arguments and critique the reasoning of others.
4. Model with mathematics. 5. Use appropriate tools
strategically. 6. Attend to precision. 7. Look for and make use of
structure. 8. Look for and express regularity
in repeated reasoning.

CREATED 12/02/2021 DRAFT 7 – Idaho Content Standards/ Mathematics / SDE / 160
Interpreting Categorical and Quantitative Data – S.ID S.ID.A. Summarize, represent, and interpret data on a single count or measurement variable. Use calculators, spreadsheets, and other technology as appropriate.
1. Differentiate between count data and measurement variable.★
2. Represent measurement data with plots on the real number line (dot plots, histograms, and box plots).★
Example: Construct a histogram of the current population size in each of Idaho’s counties.
3. Compare center (median, mean) and spread (interquartile range, standard deviation) of two or more different variables, using statistics appropriate to the shape of the distribution for each measurement variable.★
Example: Compare the histograms of the annual potato yields over the last 25 years for Idaho and Maine using the correct measures of center and spread for the shape of the histograms.
4. Interpret differences in shape, center, and spread in the context of the variables accounting for possible effects of extreme data points (outliers) for measurement variables.★
Example: Describe differences in distributions of annual precipitation over the last 100 years between Boise and Seattle using shape, center, spread, and outliers.
5. Use the mean and standard deviation of a data set to fit it to a normal distribution and to estimate population percentages. Recognize that there are data sets for which such a procedure is not appropriate. Use calculators, spreadsheets, and tables to estimate areas under the normal curve.★
Example: Estimate the percentage of all Idaho elk hunters who successfully filled their tag last year, using the results from Washington County hunters.
S.ID.B. Summarize, represent, and interpret data on two categorical and quantitative variables.
6. Represent data on two categorical variables on a clustered bar chart and describe how the variables are related. Summarize categorical data for two categories in two-way frequency tables. Interpret relative frequencies in the context of the data (including joint, marginal, and conditional relative frequencies). Recognize possible associations and trends in the data.★
Example: Represent the relationship between student effort (on a scale of 1 – 5) and letter grade in a math class with a clustered bar chart and describe the relationship using a relative frequency table.

CREATED 12/02/2021 DRAFT 7 – Idaho Content Standards/ Mathematics / SDE / 161
7. Represent data on two quantitative variables on a scatter plot, and describe how the variables are related.★
a. Fit a linear function to data where a scatter plot suggests a linear relationship and use the fitted function to solve problems in the context of the data.★
b. Use functions fitted to data, focusing on quadratic and exponential models, or choose a function suggested by the context. Utilize technology where appropriate.★
Example: Use technology to fit a function of the relationship between the board-feet (measured in volume) of trees and the diameter of the trunks of the trees.
c. Informally assess the fit of a function by plotting and analyzing residuals.★
S.ID.C. Interpret linear models.
8. Interpret the slope (rate of change) and the intercept (constant term) of a linear model in the context of the data.★
Example: Explain why the y-intercept of a linear model relating the volume production of sugar beets to size of farm has no meaning, whereas the y-intercept of a linear model relating the volume production of sugar beets related to minimum temperature does have meaning.
9. Compute (using technology) and interpret the linear correlation coefficient.★
Example: Find the correlation coefficient between the number of hours firefighters sleep each night and the length of fireline they construct each day. Use the correlation coefficient to explain whether sleep is important.
10. Distinguish between (linear) correlation and causation.★
Making Inferences and Justifying Conclusions – S.IC S.IC.A. Understand and evaluate random processes underlying statistical studies. Use calculators, spreadsheets, and other technology as appropriate.
1. Understand statistics as a process for making inferences about population parameters based on a random sample from that population.★
2. Decide if a specified model is consistent with results from a given data-generating process (e.g., using simulation or validation with given data).★
Example: A model says a spinning coin falls heads up with probability 0.5. Would a result of 5 tails in a row cause you to question the model?

CREATED 12/02/2021 DRAFT 7 – Idaho Content Standards/ Mathematics / SDE / 162
S.IC.B. Make inferences and justify conclusions from sample surveys, experiments, and observational studies.
3. Recognize the purposes of and differences among sample surveys, experiments, and observational studies; explain how randomization relates to each.★
4. Use data from a sample survey to estimate a population mean or proportion and a margin of error.★
5. Use data from a randomized and controlled experiment to compare two treatments; use margins of error to decide if differences between treatments are significant.★
6. Evaluate reports of statistical information based on data.★
Example: Students may analyze and critique different reports from media, business, and government sources.
Conditional Probability and the Rules of Probability – S.CP S.CP.A. Understand independence and conditional probability and use them to interpret data from simulations or experiments.
1. Describe events as subsets of a sample space (the set of outcomes) using characteristics (or categories) of the outcomes, or as unions, intersections, or complements of other events (“or,” “and,” “not”).★
2. Demonstrate understanding that two events A and B are independent if the probability of A and B occurring together is the product of their probabilities, and use this characterization to determine if they are independent.★
3. Understand the conditional probability of 𝐴𝐴 given 𝐵𝐵 as 𝑃𝑃(𝐴𝐴∩𝐵𝐵)𝑃𝑃(𝐵𝐵)
, and interpret independence
of 𝐴𝐴 and 𝐵𝐵 as saying that the conditional probability of 𝐴𝐴 given 𝐵𝐵 is the same as the probability of 𝐴𝐴, and the conditional probability of 𝐵𝐵 given 𝐴𝐴 is the same as the probability of 𝐵𝐵.★
4. Construct and interpret two-way frequency tables of data when two categories are associated with each object being classified. Use the two-way table as a sample space to decide if events are independent and to approximate conditional probabilities.★
Example: Collect data from a random sample of students in your school on their favorite subject among math, science, and English. Estimate the probability that a randomly selected student from your school will favor science given that the student is in tenth grade. Do the same for other subjects and compare the results.

CREATED 12/02/2021 DRAFT 7 – Idaho Content Standards/ Mathematics / SDE / 163
5. Recognize and explain the concepts of conditional probability and independence in everyday language and everyday situations.★
Example: Compare the chance of having lung cancer if you are a smoker with the chance of being a smoker if you have lung cancer.
S.CP.B. Use the rules of probability to compute probabilities of compound events in a uniform probability model.
6. Find the conditional probability of 𝐴𝐴 given 𝐵𝐵 as the fraction of 𝐵𝐵’s outcomes that also belong to 𝐴𝐴, and interpret the answer in terms of the model.★
7. Apply the Addition Rule, 𝑃𝑃(𝐴𝐴 ∪ 𝐵𝐵) = 𝑃𝑃(𝐴𝐴) + 𝑃𝑃(𝐵𝐵)− 𝑃𝑃(𝐴𝐴 ∩ 𝐵𝐵), and interpret the answer in terms of the model.★
8. (+) Apply the general Multiplication Rule in a uniform probability model
𝑃𝑃(𝐴𝐴 ∩ 𝐵𝐵) = 𝑃𝑃(𝐴𝐴)𝑃𝑃(𝐵𝐵|𝐴𝐴) = 𝑃𝑃(𝐵𝐵)𝑃𝑃(𝐴𝐴|𝐵𝐵), and interpret the answer in terms of the model.★
9. (+) Use permutations and combinations to compute probabilities of compound events and solve problems.★
Using Probability to Make Decisions – S.MD S.MD.A. Calculate expected values and use them to solve problems.
1. (+) Define a random variable for a quantity of interest by assigning a numerical value to each event in a sample space; graph the corresponding probability distribution using the same graphical displays as for data distributions.★
2. (+) Calculate the expected value of a random variable; interpret it as the mean of the probability distribution of the variable.★
3. (+) Develop a probability distribution for a random variable defined for a sample space in which theoretical probabilities can be calculated; find the expected value.★
Example: Find the theoretical probability distribution for the number of correct answers obtained by guessing on all five questions of a multiple-choice test where each question has four choices, and find the expected grade under various grading schemes.

CREATED 12/02/2021 DRAFT 7 – Idaho Content Standards/ Mathematics / SDE / 164
4. (+) Develop a probability distribution for a random variable defined for a sample space in which probabilities are assigned empirically; find the expected value.★
Example: Find a current data distribution on the number of TV sets per household in the United States, and calculate the expected number of sets per household. How many TV sets would you expect to find in 100 randomly selected households?
S.MD.B. Use probability to evaluate outcomes of decisions.
5. (+) Weigh the possible outcomes of a decision by assigning probabilities to payoff values and finding expected values.★
a. Find the expected payoff for a game of chance.★
Example: Find the expected winnings from a state lottery ticket or a game at a fast-food restaurant.
b. Evaluate and compare strategies on the basis of expected values.★
Example: Compare a high-deductible versus a low-deductible automobile insurance policy using various, but reasonable, chances of having a minor or a major accident.
6. (+) Use probabilities to make objective decisions.★
Example: The Idaho Department of Transportation classifies highways for overweight loads based on the probability of bridges on a highway failing under given vehicle weights.
7. (+) Analyze decisions and strategies using probability concepts.★
Example: Product testing, medical testing, or pulling a hockey or soccer goalie at the end of a game and replacing the goalie with an extra player.

CREATED 12/02/2021 DRAFT 7 – Idaho Content Standards/ Mathematics / SDE / 165
REFERENCES
The works below were used to guide the creation of this document:
Boaler, J. (2016). Mathematical Mindsets. San Francisco, CA: Jossey-Bass.
California Department of Education. (2021). California Math Framework Draft. Sacramento, CA: California Department of Education.
Florida Department of Education. (2020). Florida B.E.S.T. Standards: Mathematics. Tallahassee, FL: Florida Department of Education.
Massachusetts Department of Elementary and Secondary Education. (2017). Massachusetts Curriculum Framework for Mathematics. Malden, MA: Massachusetts Department of Elementary and Secondary Education.
Nebraska Department of Education. (2015). Nebraska’s College and Career Ready Standards for Mathematics. Lincoln, NE: Nebraska Department of Education.
Student Achievement Partners (2013). Achieve the Core Mathematics: Focus by Grade Level Retrieved from https://achievethecore.org/category/774/mathematics-focus-by-grade-level.
Texas Education Agency. (2012). Texas Essential Knowledge and Skills for Mathematics. Austin, TX: Texas Education Agency.