identification of mechanisms and pathways involved in mll2
TRANSCRIPT
Identification of Mechanisms and Pathways Involved in MLL2-Mediated Tumorigenesis
by
Chun-Chi Chang
Department of Pathology
Duke University
Date:_______________________
Approved:
___________________________
Yiping He, Supervisor
___________________________
Salvatore Pizzo
___________________________
Hai Yan
Thesis submitted in partial fulfillment of
the requirements for the degree of
Master of Science in the Department of
Pathology in the Graduate School of
Duke University
2013
ABSTRACT
Identification of Mechanisms and Pathways Involved in MLL2-Mediated Tumorigenesis
by
Chun-Chi Chang
Department of Pathology
Duke University
Date:_______________________
Approved:
___________________________
Yiping He, Supervisor
___________________________
Salvatore Pizzo
___________________________
Hai Yan
An abstract of a thesis submitted in partial
fulfillment of the requirements for the degree
of Master of Science in the Department of
Pathology in the Graduate School of
Duke University
2013

Copyright by
Chun-Chi Chang
2013
iv
Abstract
Myeloid/lymphoid or mixed-lineage leukemia (MLL)-family genes encode histone lysine
methyltransferases that play important roles in epigenetic regulation of gene transcription, and
these genes are frequently mutated in human cancers. While MLL1 and MLL4 have been the
most extensively studied, MLL2 and its homolog MLL3 are not well-understood. Specifically,
little is known regarding the extent of global MLL2 involvement in the regulation of gene
expression and the mechanism underlying its alterations in mediating tumorigenesis. To study the
role of MLL2 in tumorigenesis, we somatically knocked out MLL2 in a colorectal carcinoma cell
line, HCT116. We observed that the MLL2 loss of function results in significant reduction of cell
growth and multinuclear morphology. We further profiled MLL2 regulated genes and pathways
by analyzing gene expression in MLL2 wild-type versus MLL2-null isogenic cell lines. Our
results reveal the connection of MLL2 to multiple cellular signaling pathways and suggest
potential mechanisms underlying tumorigenesis mediated by MLL2 alterations.

v
Dedication
I dedicate my thesis work to my beloved family. I especially feel gratitude to my loving
parents, Chih-Wen Chang (張志文) and Lien-Chih Chang (張蓮枝), who always support me with
words of encouragement. My husband Tzung-Lian Tzeng (曾宗廉) and my sister Chun-Ping
Chang (張君萍) have never left my side. I also dedicate this thesis to my friends who have
supported me throughout the process. I will always appreciate all they have done, especially
Christopher Pirozzi for helping me the many hours of proofreading. I dedicate this work and give
special thanks to my church family for being there pray for me throughout the entire master
program. All of you have been my best cheerleaders.
vi
Contents
Abstract ......................................................................................................................................iv
Dedication ................................................................................................................................... v
List of Tables ........................................................................................................................... viii
List of Figures ............................................................................................................................ ix
Acknowledgements ................................................................................................................... x
1. Introduction ........................................................................................................................ 1
2. Materials and Methods ..................................................................................................... 5
2.1 Cell Culture .................................................................................................................... 5
2.2 Somatic Targeting ......................................................................................................... 5
2.3 Nuclear Extraction ........................................................................................................ 7
2.4 Western B ....................................................................................................................... 7
2.5 MTT Assay ..................................................................................................................... 8
2.6 Microarray Assay .......................................................................................................... 8
2.7 Confirmation of Microarray ........................................................................................ 9

vii
2.8 Microarray Data Analysis .......................................................................................... 10
2.9 Chromatin Immunoprecipitation (ChIP) and ChIP-Quantitative PCR ............... 10
2.11 Retinoic Acid Treatment ............................................................................................ 11
3. Results ............................................................................................................................... 13
3.1 Generation of Isogenic MLL2-Knockout Colorectal Cancer Cells ....................... 13
3.2 Cell Growth Reduced in MLL2-knockout Cells...................................................... 16
3.3 Gene Expression Analysis of Parental and MLL2-knockout Cells....................... 16
3.4 MLL2 Regulates Gene Expression of Multiple Signaling Pathways.................... 21
3.5 MLL2 Regulates the Expression of the Retinoic Acid-Responsive Gene ASB2. 21
4. Discussions ....................................................................................................................... 25
Supplementary Dataset 1 ........................................................................................................ 27
References ................................................................................................................................. 45
viii
List of Tables
Table 1. Genes in the MLL2 pathway are frequently mutated in various types of cancer............... 4
Table 2. Primers Information ........................................................................................................ 12
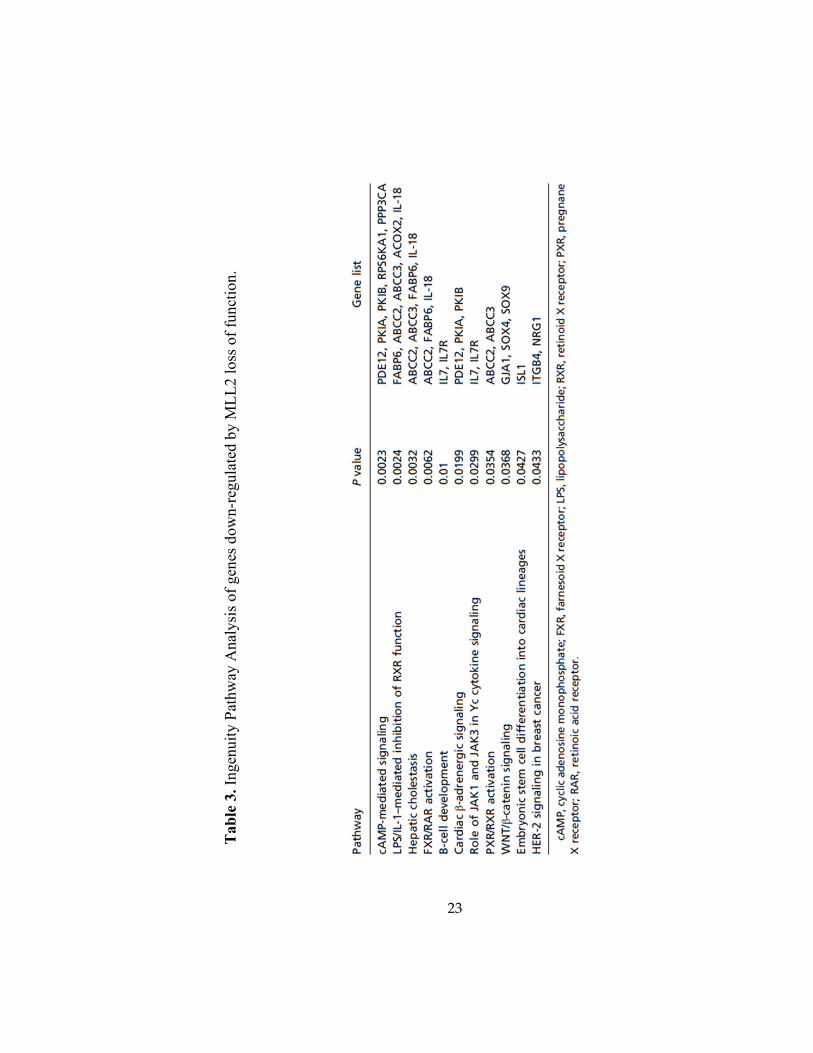
Table 3. Ingenuity Pathway Analysis of genes down-regulated by MLL2 loss of function. ......... 23
ix
List of Figures
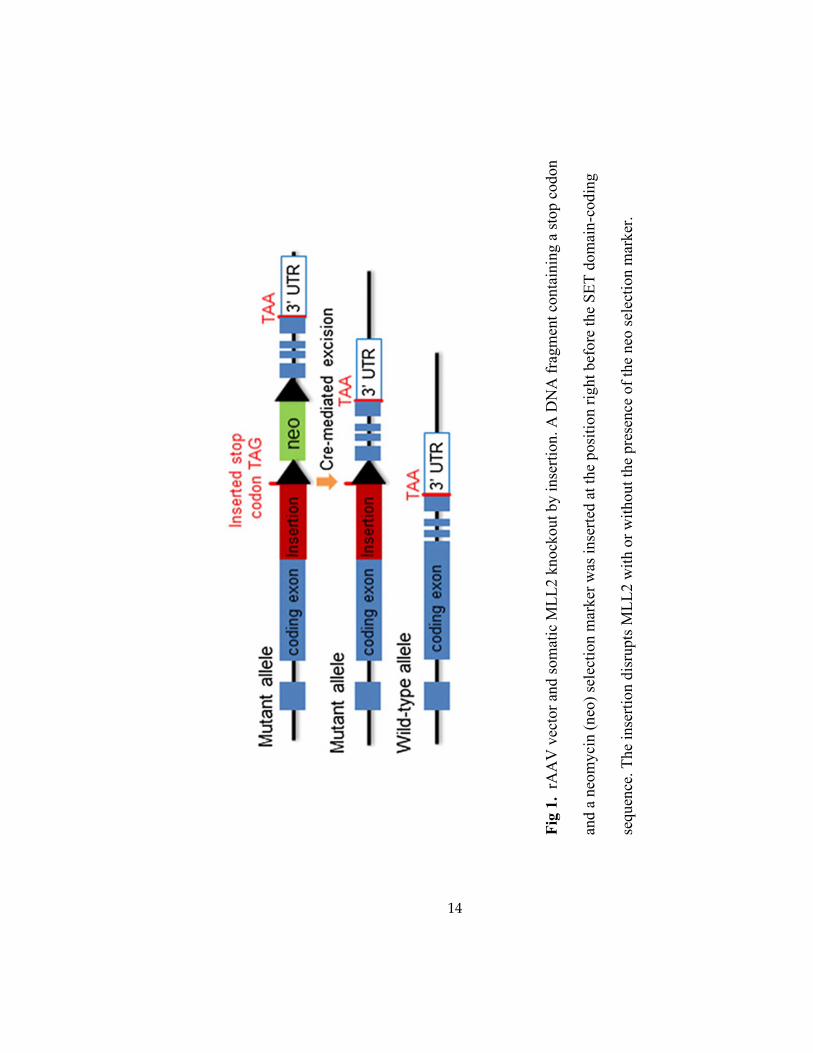
Fig 1. rAAV vector and somatic MLL2 knockout by insertion. .................................................. 14
Fig 2. Confirmation of MLL2-/- clones. ....................................................................................... 15
Fig 3. MLL2 deficiency have defective cell growth in HCT116. ................................................. 18
Fig 4. Expression profiling of parental and MLL2-knockout HCT116 cells. ............................... 19
Fig 5. MLL2 binding to the S100A gene cluster. ......................................................................... 20
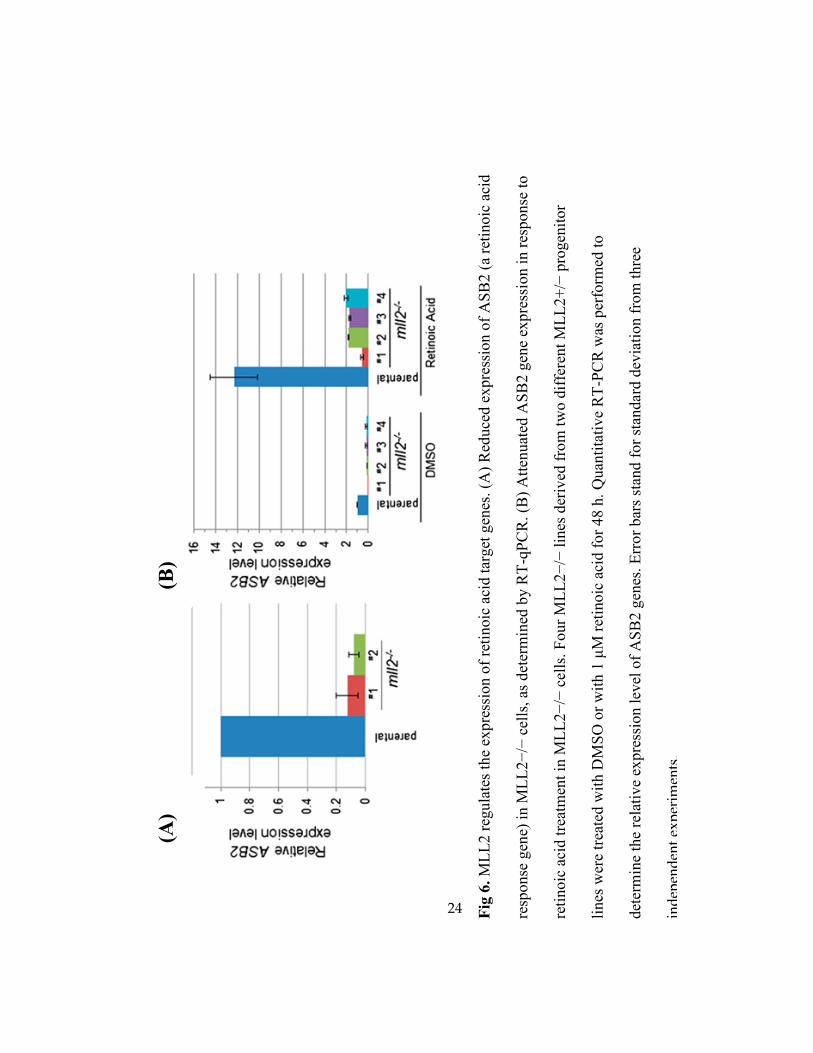
Fig 6. MLL2 regulates the expression of retinoic acid target genes. ............................................ 24

x
Acknowledgements
I sincerely thank my thesis committee Dr.Yiping He, Dr. Hai Yan, and Dr. Salvatore
Pizzo for their useful guidance and insightful comments through my entire master study. I
also thank Dr. Jen-Tsan Ashley Chi and Dr. Sridharan Gururangan for their encouragement on
this project. I would like to extend my deepest gratitude to my thesis advisor, Dr. Yiping He
for his patience, motivation, enthusiasm, and immense knowledge. His guidance helped me
in all the time of research and writing of this thesis. I could not have imagined having a better
advisor and mentor for my master study. I thank my all of the members of Dr. He and Dr.
Yan lab for their help through this project. I especially wish to thank Dr. Changcun Guo and
Christopher Pirozzi, without whose continuous support, this effort would have been
impossible. I also thank the Department of Pathology for providing me this great chance to
expend my knowledge, especially our Dr. Soman Abraham whose words always inspire my
enthusiasm.

1
1. Introduction
Modulation of chromatin accessibility through histone methylation is a critical step in
regulating eukaryotic gene transcription. Histone H3 lysine 4 (H3K4) methylation by histone
methyltransferases is an epigenetic mark for active gene transcription [1]. In human cells, four
Mixed-Lineage Leukemia (MLL) family proteins have H3K4 methyltransferase activity, each
with an enzymatic Su (var) 3–9 Enhancer-of-zeste Trithorax methyltransferase (SET) domain.
These MLL-family genes include MLL1, MLL2 (also known as ALR/MLL4), MLL3, and MLL4
(also known as MLL2 or Wbp7, conflicting with the official symbol for MLL2). Each of these
proteins is associated with multiple subunits that function as a complex with histone-modifying
activities [2]. Among the MLL genes, MLL1 and its homologue, MLL4, have been the most
extensively studied. MLL1 is frequently involved in genetic alterations in acute myeloid and
acute lymphoblastic leukemia [3]. Overexpression of MLL4 has been found in breast and
colorectal cell lines and primary tissues [4].
MLL2 was originally cloned as a human homolog of Drosophila trithorax [5]. MLL2 and
its homolog, MLL3, function distinctly from MLL1 and MLL4. Both MLL2 and MLL3 associate
with nuclear receptor coactivator 6 (NCOA6, also known as Activating Signaling Cointegrator-2,
ASC-2) to form a complex that contains other essential subunits, including ASH2L, RbBP5,
WDR5, DPY30, PTIP, PA1, and UTX, a histone H3K27 demethylase [6-8]. The MLL2 or MLL3
(hereafter named MLL2/MLL3) complex has been found to play an essential role as a coactivator
for transcriptional activation by nuclear hormone receptors [9]. Previous studies have shown that

2
MLL2/MLL3 complexes regulate Homeobox (Hox) gene transcription, and that they play critical
roles in PPARγ-dependent adipogenesis [10-12].
With the latest high-throughput next generation sequencing, new cancer driver genes
previously unlinked to human cancers have been discovered. Among these genes, the
MLL2/MLL3 pathway is the most frequently mutated driver in an ever-growing list of cancers.
Initially, our medulloblastoma (MB) exome sequencing revealed frequent cancer driver
inactivating mutations of histone lysine methyltransferase gene MLL2, and its paralogue gene
MLL3. These were altered in 16% of cases (passenger gene probability <0.001), a prevalence
which is comparable to classic MB cancer genes such as CTNNB1 (12%). Most somatic MLL2
gene mutations identified in MBs lead to frame-shift. [13]. Subsequent comprehensive studies
involving larger numbers of well-classified MB samples have significantly extended these genetic
findings and further confirmed that dysregulation of the MLL2/MLL3 pathway, including
mutations in a MLL2 and MLL3-associated demethylase, UTX, plays an important role in driving
various groups of human MBs [14-16]. These results clearly established the aberrant
MLL2/MLL3 pathway as a bona fide cancer-driving pathway.
In addition to its role in MB development, recent studies found that the MLL2/MLL3
pathway is frequently mutated in other cancers (summarized in Table 1), including 89% of
follicular lymphoma and 20%-30% of diffusive large B-cell lymphoma [17, 18]. MLL3 is also
mutated in colorectal cancer [19, 20]. Other cancers that have recently been found to be driven by
the aberrant MLL2/MLL3 pathway, mainly through MLL2 or MLL3 mutations, include renal
[21], prostate [22] , bladder [23], gastric [24], liver [25], pancreatic [26], and lung [27, 28]. UTX
3
was also found to be mutated in a variety of human cancers with various frequencies [29].
Furthermore, germ line MLL2 inactivation has recently been found to be the major cause of
Kabuki syndrome [30], a rare pediatric congenital disorder characterized by intellectual
disabilities. Collectively, these findings place the MLL2/MLL3 pathway among the most
frequently mutated pathogenic pathways that drive human cancers.
In contrast to the well-documented genetic evidence about MLL2/MLL3 mutations,
much less is known regarding the mechanism underlying the tumor suppressor roles of the
MLL2/MLL3 pathway. A recent study showed that shRNA-mediated knockdown of MLL2
resulted in reduced cancer cell growth and altered adhesion in HeLa cells, although the
underlying mechanism and its relevance to tumorigenesis were unknown [7]. To further elucidate
the role of MLL2 in tumorigenesis, we utilized recombinant adeno-associated virus (rAAV) to
somatically knockout MLL2 in the colorectal cancer cell line, HCT116. Knockout of MLL2 in
human cells affects the expression of a variety of genes. We note a set of genes that are retinoic
acid-responsive and may be directly regulated by MLL2. Finally, integrative pathway analysis
uncovered various signaling pathways that are regulated by the MLL2 complex. Our results
reveal the global and pathway-specific roles of MLL2 and suggest that it participates in regulating
a wide range of pathways with relevance to its role in oncogenesis [31].

4
Tab
le 1
. G
enes
in t
he
ML
L2 p
athw
ay a
re f
requen
tly m
uta
ted i
n v
ario
us
typ
es o
f ca
nce
r

5
2. Materials and Methods
2.1 Cell Culture
Human colorectal carcinoma cell line HCT116 (American Type Culture Collection) was
cultured in McCoy’s 5A medium (Gibco) with 10% (vol/vol) FBS (HyClone). Cells were grown
up to 70% confluency in 100 × 20 mm cell culture dishes (Corning) for genomic DNA, RNA, or
nuclear protein extraction. HCT116-MLL2−/−
cells were maintained in complete medium
containing 0.5 mg/mL Geneticin. HEK 293FT cells (Invitrogen) were cultured in DMEM with
high glucose (Gibco) containing 10% (vol/vol) FBS and used for rAAV targeting virus
production as previously described [32]. Exponentially growing cells were used for microarray
gene expression profiling. For retinoic acid treatment, ~106 cells in six-well plates were treated
with 1 μM all-trans retinoic acid (Sigma) for 48 hours before cells were harvested for RNA
preparation.
2.2 Somatic Targeting
The vector and protocol for epitope tag targeting and gene knockout have been described
previously [33-35] . To generate MLL2-knockout cell lines, we utilized a rAAV vector to insert a
stop codon right before the SET domain (amino acid 5391Leu), which is the enzymatic functional
domain of MLL2. The rAAV vector was composed of two homology arms which were ∼1–1.2
kb in length and surrounded the insertion site, and a neomycin (neo) selection marker surrounded
by two loxP sites. The homology arms were amplified from HCT116 genomic DNA using
Hotstart High-Fidelity Platinum Taq polymerase (Invitrogen).
6
Using Lipofectamine 2000 (Invitrogen), the vector was co-transfected with pAAV-RC
and pHelper plasmids (Invitrogen) into HEK 293FT cells to generate rAAV targeting virus using
a modified procedure based on the previously described protocol [33, 35]. Virus was harvested 2
days after transfection. HCT116 cells were infected with targeting virus for 5 hours. Cells were
allowed to recover in complete culture medium for 2 days, and were serially diluted into 96-well
plates in culture media containing 0.5 mg/mL Geneticin. Geneticin-resistant cells were grown for
14–21 days, harvested for Lyse-N-Go genomic DNA extraction (Thermo Scientific), and
screened by PCR using two sets of primers (see Table 2 for primer information). The first set of
primers has the forward primer, P1, located in the genome, upstream of the left homologous arm,
and the reverse primer, NR, is located in the neo marker insertion region. The second set of
primers has the forward primer, NF, located in the neo marker insertion region, and reverse
primer, P2, located downstream of the right homologous arm in the genome. The screening PCR
products that identified positive clones were confirmed by sequencing (Genewiz).
Positive clones were then infected with Cre recombinase-expressing adenovirus (Vector
Biolabs) to remove the drug-resistance selection marker. Cells were serially diluted and cultured
in complete media for 10–14 days, and clones were picked for PCR screening using primers P3
and P4 (see Table 2 for primer information).
After the generation of MLL2+/−
cell lines, two independent MLL2+/−
lines were used for
targeting the second MLL2 allele in exactly the same manner to generate MLL2−/−
cell lines. The
neomycin selection marker in the second MLL2 allele was not removed. MLL2 knockout
(MLL2−/−
) was confirmed by genotyping, sequencing (Genewiz) the mutant transcript (RT-PCR),
7
and anti-MLL2 immunoblot.
2.3 Nuclear Extraction
Chemicals were ordered from Sigma unless otherwise stated. Briefly, ~1 x 10⁷cells were
harvested, washed with buffer A (10 mM Hepes·KOH (EMD), pH 7.9, 1.5 mM magnesium
chloride, 10 mM potassium chloride, 0.5 mM DTT, 5 mM sodium fluoride, 2 μM sodium
orthovanadate (MP Biomedical), protease inhibitor cocktail (Roche)), and lysed in buffer A with
0.1% Nonidet P-40. The nuclei were collected by centrifugation (4 °C, at 3500 g for 5 min) and
lysed in high-salt buffer C (20 mM Hepes·KOH, pH 7.9, 1.5 mM magnesium chloride, 420 mM
sodium chloride, 0.2 mM EDTA (Gibco), 25% (vol/vol) glycerol, 0.5 mM DTT, 5 mM sodium
fluoride, 2 μM sodium orthovanadate, protease inhibitor mixture) at 4 °C on rotating mixer.
Nuclear lysate was directly used for immunoblot.
2.4 Western Blot
Nuclear extract was resolved on 4–12% SDS/PAGE using NuPAGE system (Invitrogen).
The blot was transferred on a piece of nitrocellulose paper using a TE22 tank transfer unit
(Hoefer) filled with transfer buffer (1x NuPAGE transfer buffer, 0.1% SDS, 5% methanol,
8.75mM 2-Mercaptoethanol) under 400mA or 100V at 4 °C for 4 hours. Nitrocellulose papers
with the blots were then blocking with 1% casein in Tris-buffered saline (TBS, 50mM Tris-HCl,
pH 7.5, 150mM NaCl) (Bio-rad) at 4 °C for overnight. The blots were stained with 1:1000 diluted
anti-MLL2 antibody (gift from Dr. Kai Ge [6]) in blocking buffer at room temperature for at least
2 hours, and wash with TBS with 0.05% Tween-20 (TBST) for 10 mins, 3 times. HRP-

8
conjugated goat anti-rabbit or anti-mouse IgG (1mg/mL) were diluted 1:5000 in the blocking
buffer, and incubate with the blots for 0.5 hours at room temperature, and wash with TBST for 10
mins, 3 times. The blots were developed with SuperSignal West Femto Chemiluminescent
Substrate (Pierce). The membrane was exposed to film for 0.5-10 mins.
2.5 MTT Assay
MTT assay was used to determine the cell viability and cell growth. About 104 cells were
plated in 96-well plate on day 0, and MTT assay was performed daily for 4 days to evaluate the
overall proliferation of the cells. MTT (3-(4,5-dimethylthiazol-2-yl)-2,5-diphenyl tetrazolium
bromide; Sigma) was dissolved in PBS at 5 mg/ml and filtered with 0.2 um filter for sterilization.
On each day, 10ul of stock MTT solution were diluted in 100ul fresh culture medium, and added
into the wells to be tested. The plates were incubated at 37°C for 4 hours. After incubation, 200
ul of acid-isopropanol (1 portion of 4N HCl : 100 portion of isopropanol) was added to all wells
and mixed by pipetting thoroughly to dissolve the dark blue crystals. The plates were read on a
POLARstar Optima microplate reader, using a test wavelength of 570 nm to determine the
relative cell viability. Plates were normally read within 1 hours of adding the isopropanol.
2.6 Microarray Assay
Total RNA was prepared from MLL2−/−
cells (two pairs of cell lines, clone 1, 2 and cell
line clone 3, 4, which were derived from two independent MLL2+/−
progenitor lines, were
included for two separate microarray experiments) and HCT116 parental cells. The quality of the
RNA was assessed with a 2100 Bioanalyzer G2939A (Agilent Technologies) and Nanodrop 8000

9
spectrophotometer (Thermo Scientific). Hybridization targets were prepared with a MessageAmp
Premier RNA Amplification Kit (Applied Biosystems/Ambion) from total RNA, hybridized to
GeneChip U133 Plus 2.0 arrays in Affymetrix GeneChip Hybridization Oven 645, washed in
Affymetrix GeneChip Fluidics Station 450, and scanned with Affymetrix GeneChip Scanner 7G
according to standard Affymetrix GeneChip hybridization, wash, and stain protocols. Each cell
line was done in triplicate. Statistical analysis for false discovery rate was performed by
significance analysis of microarrays [36]. Statistical analysis for the enrichment of down-
regulated genes in the ChIP-identified genes was performed by χ2 test.
2.7 Confirmation of Microarray Gene Expression
The expression change of selected genes was confirmed by RT-qPCR in the original
microarray- analyzed pair of MLL2−/−
cell lines (clones 1 and 2) and in additional MLL2−/−
clones
(clones 3 and 4) derived from two independent MLL2+/−
progenitor lines. Total RNA was
prepared from parental cell lines and MLL2−/−
cells using a total RNA kit (Omega Bio-Tek)
according to the manufacturer’s instructions. One microgram of total RNA was used for reverse
transcription using a SuperScript II First-Strand Synthesis Kit (Life Technologies) according to
the kit manual. After transcription, the cDNA was diluted 1:20 and used as template for qPCR.
SYBR green-based real-time qPCR was performed with an Applied Biosystems 7900
platform (Life Technologies). Quantitative PCR was done in 20-μL reactions containing 1× PCR
buffer (67mMTris·HCT,pH8.8, 6.7mMMgCl2, 16.6 mM NH4SO4, 10 mM 2-mercaptoethanol), 2
mM dNTPs, 0.5 μM forward and reverse primers, 6% (vol/vol) DMSO, 1:2,000 SYBR green, and
1 unit Platinum Taq (Invitrogen). The PCR program was 95 °C, 10 min for hotstart, amplification
10
for 38 cycles (95 °C, 15 s to 60 °C, 15 s to 72 °C, 15 s), and a dissociation curve analysis (95 °C,
15 s to 60 °C, 15 s to 95 °C, 15 s, ramp rate 2%).Gene expression levels were normalized to the
housekeeper gene GAPDH (see Primers for list of primers used for qPCR).
2.8 Microarray Data Analysis
The web-based Ingenuity Pathway Analysis (IPA) (www.ingenuity.com) tool was used to
analyze the genes down-regulated by >50% in the microarray. Top affected canonical pathways
were identified for the down-regulated genes (Table 3).
2.9 Chromatin Immunoprecipitation (ChIP) and ChIP-Quantitative PCR
The ChIP procedure is described in detail in our previous publication. Briefly, cells were
cross-linked and cell lysate was then prepared and subjected to sonication to shear the chromatin.
Magnetic beads (New England BioLabs) conjugated with anti-Flag antibody (F3165; Sigma)
were used for IP. ChIP-derived DNA was recovered for Illumina GAII-compatible library
preparation. Libraries were used for sequencing or qPCR analysis. High-throughput sequencing
was performed on the Illumina GAII system. Tags were mapped to the human genome (release
hg18) by using the Illumina alignment software Eland.
2.10 ChIP-Quantitative PCR
Primers were designed according to the enriched locus coordinates, and SYBR green-based
real-time qPCR was performed with an Applied Biosystems 7900 platform (Life Technologies).
A LINE-1 amplicon was used for normalization (refer to Table 2 of primers used for ChIP-qPCR).
11
ChIP DNA preparation was done as described above. ChIP DNA (2.5 μL) was used as qPCR
template. Quantitative PCR was done in 20-μL reactions containing 1×PCRbuffer
(67mMTris·HCT,pH8.8, 6.7mMMgCl2, 16.6 mM NH4SO4, 10 mM 2-mercaptoethanol), 2 mM
dNTPs, 0.5 μM forward and reverse primers, 6% (vol/vol) DMSO, 1:2,000 SYBR green, and 1
unit Platinum Taq (Invitrogen). The PCR program was 95 °C, 10 min for hotstart, amplification
for 38 cycles (95 °C, 15 s to 60 °C, 15 s to 72 °C, 15 s), and a dissociation curve analysis (95 °C,
15 s to 60 °C, 15 s to 95 °C, 15 s, ramp rate 2%).
2.11 Retinoic Acid Treatment
HCT116 parental cells or MLL2−/−
cells were treated with retinoic acid (1 μM) for 48 h.
Afterward, RNA preparation, reverse transcription to generate cDNA, and real-time qPCR were
performed as described above to measure the expression of ASB2 as a readout for retinoic acid
treatment.

12
Tab
le 2
. P
rim
ers
Info
rmat
ion

13
3. Results
3.1 Generation of Isogenic MLL2-Knockout Colorectal Cancer Cells
To investigate the function of MLL2 and identify downstream events that were regulated
by MLL2, microarray analysis of gene expression in the isogenic MLL2 deficient cells was
performed. Two technical barriers have complicated our task: (1) the massive size of MLL2
(5537 amino acid; MW=~600kD) makes gene engineering challenging; and (2) the lack of high
quality antibodies. In addition, si-RNA and sh-RNA did not show significant knockdown in our
cell lines. To overcome these technical challenges, we have applied recombinant adeno-
associated virus (rAAV)-based somatic knockin technology [33, 35] to insert a stop codon into a
coding exon of the MLL2 gene in HCT116 cell line. We chose the HCT116 carcinoma cell line
for our study, as it is a near-diploid cell line with well-defined key cancerous pathways.
Furthermore, this cell line has homozygous MLL3-inactivating mutations, thus preventing
compensatory effects from obscuring functional analysis. Using rAAV based somatic knock-in
technology, we generated MLL2-null HCT116 cell lines, and effectively engineered inactivated
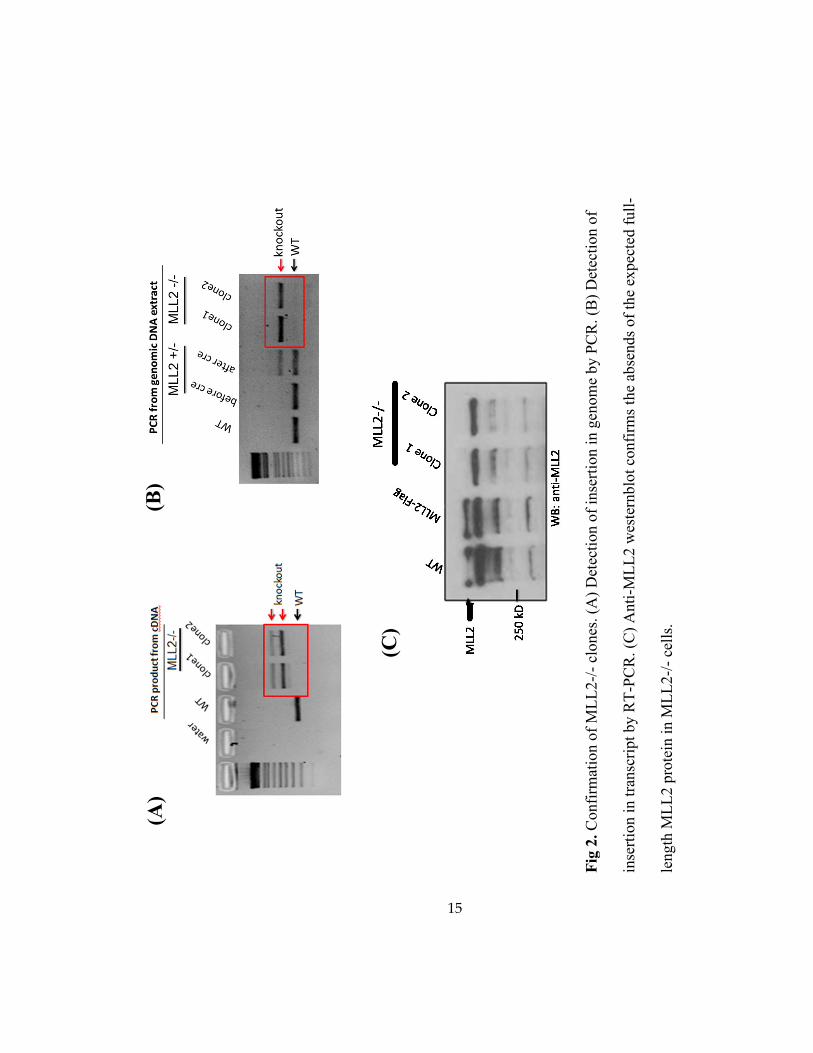
MLL2 mutations similar to those that are frequently found in cancers (Fig. 1). As expected, cell
lines with insertions in both MLL2 alleles (MLL2−/−
) had complete loss of the wild-type MLL2
genes and transcript, and had no detectable MLL2 protein due to the nonsense mutation and/or
altered splicing (Fig. 2).
14
Fig
1. r
AA
V v
ecto
r an
d s
om
atic
ML
L2 k
nock
out
by i
nse
rtio
n. A
DN
A f
ragm
ent
conta
inin
g a
sto
p c
odon
and a
neo
myci
n (
neo
) se
lect
ion m
arker
was
inse
rted
at
the
posi
tion r
ight
bef
ore
the
SE
T d
om
ain
-cod
ing
sequen
ce.
The
inse
rtio
n d
isru
pts
ML
L2 w
ith o
r w
ithout
the
pre
sence
of
the
neo
sel
ecti
on m
ark
er.
15
(A)
Fig
2. C
onfi
rmat
ion o
f M
LL
2-/
- cl
ones
. (A
) D
etec
tion o
f in
sert
ion i
n g
enom
e by P
CR
. (B
) D
etec
tion o
f
inse
rtio
n i
n t
ransc
ript
by R
T-P
CR
. (C
) A
nti
-ML
L2 w
este
rnblo
t co
nfi
rms
the
abse
nds
of
the
expec
ted f
ull
-
length
ML
L2 p
rote
in i
n M
LL
2-/
- ce
lls.
(C)
(A)
(B)
16
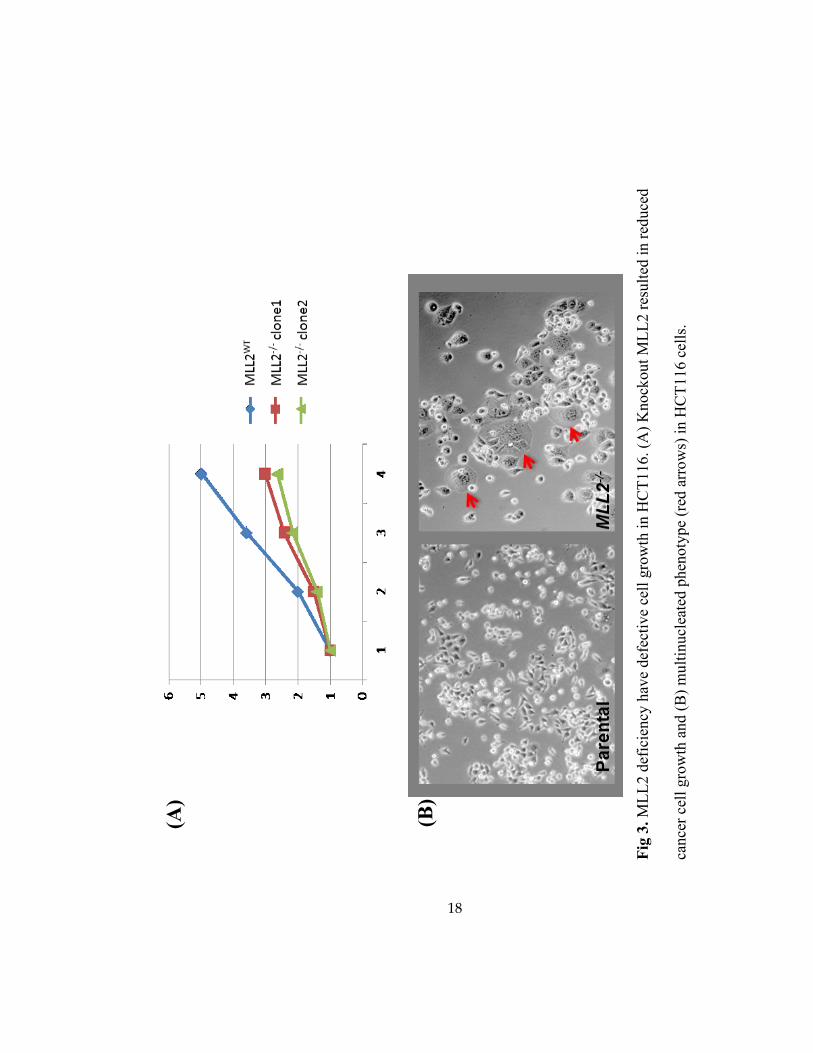
3.2 Cell Growth Reduced in MLL2-knockout Cells
To determine the biological function of MLL2, we observed the morphology and growth
in MLL2 deficient cells. MTT assay was used to determine the cell growth in our MLL2-null
cells compared with the parental HCT116. Our results showed an overall slower growth of the
MLL2-/-
HCT116 cell lines (Fig 3A), consistent with the previous result of MLL2 knockdown in
HeLa cells [7]. Further, the MLL2-/-
cells frequently displayed a flattened morphology and a
multinucleated phenotype (Fig 3B). These results indicated that MLL2 deficiency plays roles in
cell cycle defect and/or cell senescence.
3.3 Gene Expression Analysis of Parental and MLL2-knockout Cells.
To identify downstream events that were regulated by MLL2, microarray analysis was
used to analyze gene expression in the parental HCT116 cells and four MLL2-/-
clones. Overall,
while a list of genes were identified to be downregulated by MLL2 loss of function
(Supplementary Dataset 1), most of the down-regulation of gene expression was moderate, in
agreement with the observation that deletion of a single MLL-family gene has only minimal
effects on global H3K4 methylation [37, 38]. Interestingly, there were also genes that displayed
higher expression levels in MLL2-/-
cells than in the parental cells (Fig 4), consistent with an
indirect effect. Gene expression changes were further verified by qPCR of transcripts from the
four MLL2-/-
clones.
To identify MLL2 direct transcriptional target genes, we further identified the MLL2
binding profile and gene expression profile. Our analysis revealed that a subset of genes
17
associated with MLL2-bound loci [31] displays reduced expression in MLL2-/-
cell lines
(Supplementary Dataset 1), including S100 alpha (S100A) families (Fig 5A ad 5B). The
decreased expression was accompanied by reduced H3K4 trimethylation (Fig 5C), consistent
with the effect of MLL2 loss of function; while minor or no change in H3K27 trimethylation
(Fig 5D).
18
(A)
(B)
Fig
3.
ML
L2 d
efic
iency
hav
e def
ecti
ve
cell
gro
wth
in H
CT
116. (A
) K
nock
out
ML
L2 r
esult
ed i
n r
educe
d
cance
r ce
ll g
row
th a
nd (
B)
mult
inucl
eate
d p
hen
oty
pe
(red
arr
ow
s) i
n H
CT
116 c
ells
.
19
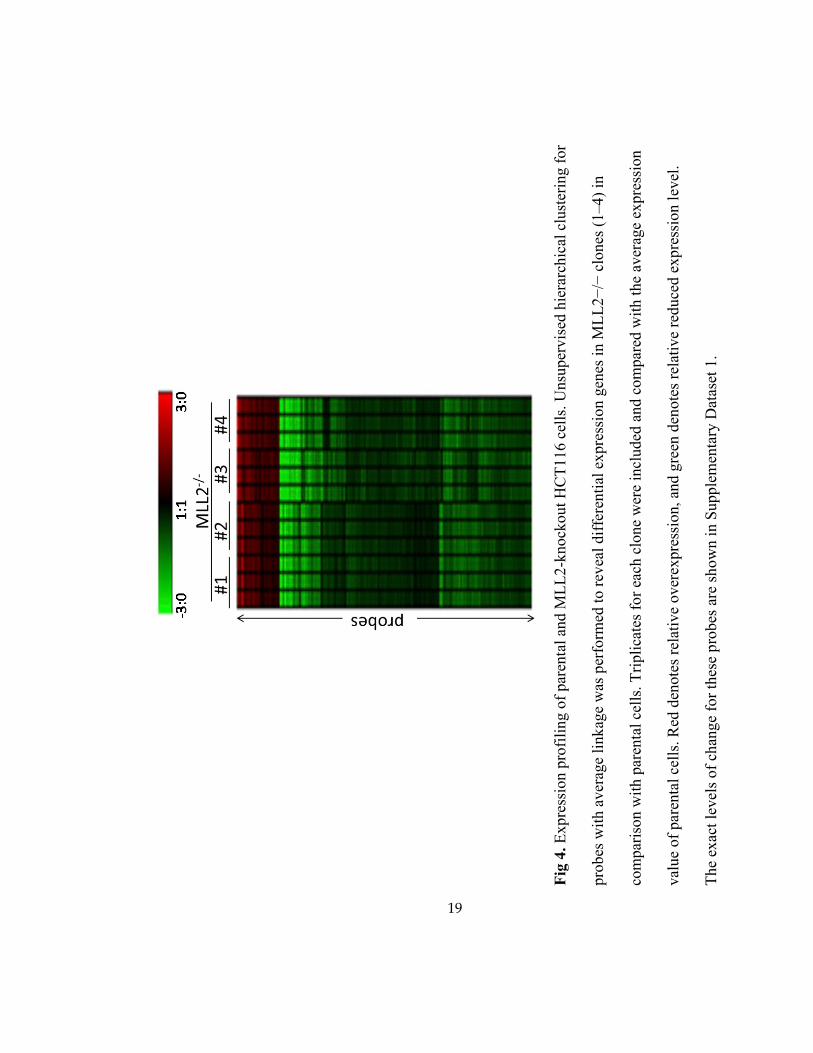
Fig
4.
Expre
ssio
n p
rofi
lin
g o
f par
enta
l an
d M
LL
2-k
nock
out
HC
T116 c
ells
. U
nsu
per
vis
ed h
iera
rchic
al c
lust
erin
g f
or
pro
bes
wit
h a
ver
age
link
age
was
per
form
ed t
o r
evea
l dif
fere
nti
al e
xpre
ssio
n g
enes
in M
LL
2−
/− c
lones
(1
–4)
in
com
par
ison w
ith p
aren
tal
cell
s. T
ripli
cate
s fo
r ea
ch c
lone
wer
e in
cluded
an
d c
om
par
ed w
ith t
he
aver
age
expre
ssio
n
val
ue
of
par
enta
l ce
lls.
Red
den
ote
s re
lati
ve
over
expre
ssio
n, an
d g
reen
den
ote
s re
lati
ve
reduce
d e
xp
ress
ion l
evel
.
The
exac
t le
vel
s of
chan
ge
for
thes
e p
robes
are
sh
ow
n i
n S
upple
men
tary
Dat
aset
1.
20
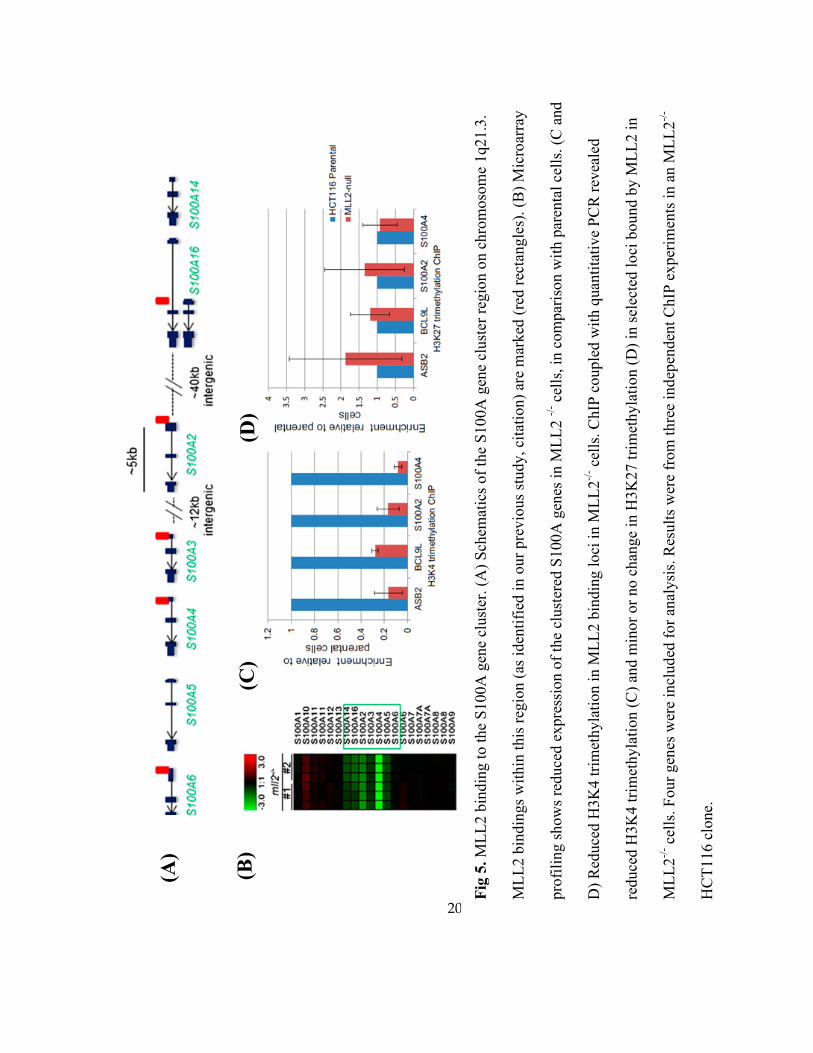
Fig
5.
ML
L2 b
indin
g t
o t
he
S100A
gen
e cl
ust
er. (A
) S
chem
atic
s of
the
S10
0A
gen
e cl
ust
er r
egio
n o
n c
hro
moso
me
1q21.3
.
ML
L2 b
indin
gs
wit
hin
this
reg
ion (
as i
den
tifi
ed i
n o
ur
pre
vio
us
study
, ci
tati
on)
are
mar
ked
(re
d r
ecta
ngle
s). (B
) M
icro
arra
y
pro
fili
ng s
how
s re
duce
d e
xpre
ssio
n o
f th
e cl
ust
ered
S100A
gen
es i
n M
LL
2 -/
- cel
ls, in
com
par
ison w
ith p
aren
tal
cell
s. (
C a
nd
D)
Red
uce
d H
3K
4 t
rim
ethyla
tion i
n M
LL
2 b
indin
g l
oci
in M
LL
2-/
- cel
ls. C
hIP
couple
d w
ith q
uan
tita
tive
PC
R r
evea
led
reduce
d H
3K
4 t
rim
ethyla
tion
(C
) an
d m
inor
or
no c
han
ge
in H
3K
27 t
rim
ethyla
tion
(D
) in
sel
ecte
d l
oci
bound b
y M
LL
2 i
n
ML
L2
-/- c
ells
. F
our
gen
es w
ere
incl
ud
ed f
or
anal
ysi
s. R
esult
s w
ere
from
th
ree
ind
epen
den
t C
hIP
ex
per
imen
ts i
n a
n M
LL
2-/
-
HC
T116 c
lone.
(A)
(B)
(C)
(D)
21
3.4 MLL2 Regulates Gene Expression of Multiple Signaling Pathways
To further gain an integrative view of the functional consequence of MLL2 in the context
of cellular signaling pathways, we selected the genes whose expression was >50% down-
regulated by MLL2 loss of function and subjected them to IPA canonical pathway analysis
(Supplementary Dataset 1). Analysis of pathways that may be regulated by MLL2 revealed the
potential effects of MLL2 on a broad range of cellular processes. Among those signaling
pathways that were found to be significantly related were cAMP-mediated signaling and
retinoic acid receptor (RXR) signaling (Table 3). Our data also revealed hepatic cholestasis
pathway and B-cell development pathway, consistent with previous studies [11, 17, 18, 39]
3.5 MLL2 Regulates the Expression of the Retinoic Acid-Responsive Gene ASB2.
We next sought to validate the functional role of MLL2 in regulating the transcription of
the genes we identified. The pathway analysis revealed that one of the interesting categories of
genes was those that respond to nuclear hormones. Interestingly, one of the pathways
overrepresented in both MLL2-bound and MLL2-responsive gene sets was retinoic acid
signaling. One of the genes that were linked to the MLL2 binding loci was ASB2 [31], whose
expression was previously found to be induced by retinoic acid in leukemia cells [40, 41]. This
gene was expressed at a relatively low level in parental HCT116 cells, and quantitative analysis
of the ASB2 transcript showed that its expression was further reduced in the MLL2−/−
cell lines
(Fig. 6A). To verify the role of the MLL2 complex in mediating the retinoic acid response, we
tested whether HCT116 cells responded to retinoic acid transcriptionally using ASB2 as a
marker gene. Treatment of parental HCT116 cells with retinoic acid induced robust ASB2
22
expression (Fig. 6B). Furthermore, whereas retinoic acid treatment also led to an increased
ASB2 transcript level over a very low basal level in the MLL2−/−
cells, the expression level of
ASB2 was significantly lower than the level seen in the MLL2-intact parental cells upon
retinoic acid treatment (Fig. 6B), indicating that MLL2 involvement accounted for the majority
of increased ASB2 expression in response to retinoic acid. Collectively, these results validated
the roles of MLL2 uncovered by gene expression studies, and suggest an extensive involvement
of MLL2 in a variety of cellular signaling pathways.
23
Tab
le 3
. In
gen
uit
y P
athw
ay A
nal
ysi
s of
gen
es d
ow
n-r
egula
ted b
y M
LL
2 l
oss
of
funct
ion
.
24
Fig
6.
ML
L2 r
egula
tes
the
expre
ssio
n o
f re
tinoic
aci
d t
arget
gen
es. (A
) R
educe
d e
xpre
ssio
n o
f A
SB
2 (
a re
tinoic
aci
d
resp
onse
gen
e) i
n M
LL
2−
/− c
ells
, as
det
erm
ined
by R
T-q
PC
R. (B
) A
tten
uat
ed A
SB
2 g
ene
exp
ress
ion i
n r
esponse
to
reti
no
ic a
cid t
reat
men
t in
ML
L2−
/− c
ells
. F
our
ML
L2−
/− l
ines
der
ived
fro
m t
wo d
iffe
rent
ML
L2
+/−
pro
gen
itor
lines
wer
e tr
eate
d w
ith D
MS
O o
r w
ith 1
μM
ret
inoic
aci
d f
or
48 h
. Q
uan
tita
tive
RT
-PC
R w
as p
erfo
rmed
to
det
erm
ine
the
rela
tive
expre
ssio
n l
evel
of
AS
B2 g
enes
. E
rro
r bar
s st
and f
or
stan
dard
dev
iati
on f
rom
thre
e
indep
enden
t ex
per
imen
ts.
(A)
(B)
25
4. Discussions
In this study, we generated MLL2 knockout cell lines for identification of genes whose
expression was affected by MLL2 loss of function. The MLL2 deficient cells display slower
growth and multinuclear morphology, which indicate the MLL2 function in cell cycle and/or cell
senescence. A further examination such as cell cycle progression assay and senescence assay will
be required to confirm our result. In addition to the biological finding, our gene expression
analysis revealed a list of genes that are regulated by the MLL2 complex. Pathway analysis
showed that the MLL2 complex plays roles in multiple signaling pathways and cellular processes,
including cAMP signaling pathway, and retinoic acid signaling pathway. By comparing with our
previous result of MLL2 binding loci [31], a subset of genes that were bound by MLL2 displays
significant lower expression level in MLL2-null cells. Among those genes, we notice that MLL2
was associated with and likely directly regulated by the S100A family of genes, which encode
proteins containing EF-hand calcium-binding motifs that regulate intracellular calcium signaling
and participate in a number of cellular processes [42]. In particular, S100A2 was identified as a
putative tumor suppressor [43, 44], possibly through regulating the p53 pathway [45]. The
regulation of the S100A gene cluster by the MLL2 complex reveals an additional gene cluster
that is transcriptionally co-regulated by an MLL-family epigenetic regulator.
Our findings provide evidence to expand previously established links between H3K4
methyltransferases and other pathways, and suggest that the roles of MLL2 may be extensive.
Nuclear hormone receptors are among those at the top of the list in the transcription factor and
pathway analysis from our gene expression profiling and binding sites of MLL2. In addition,
26
among the most interesting discoveries are the signaling pathways that were not previously
known to be associated with MLL2 or MLL3 complexes, such as cAMP signaling. These findings,
and those from previous work, provide insight that may inform the future search for mechanisms
underlying the role of MLL2 in pathogenesis: (i) It is possible that one or more of these currently
described pathways contributes to MLL2 mutation-mediated tumorigenesis in a cell type specific
manner; (ii) comparing gene expression profiles (MLL2 wild-type versus mutant) in different
cellular contexts may suggest the primacy of these pathways in tumors bearing MLL2 pathway
alterations; and (iii) gene expression signatures characteristic of MLL2 mutations may be
exploited for tumor classification.
In summary, the present study advances our understanding of MLL2 in the following
ways: (i) it identified various downstream pathways that are regulated by MLL2, establishing a
basis for studying the mechanism underlying the role of MLL2 in development and disease; (ii) it
uncovered the regulatory role of MLL2 in the transcription of clustered S100A-family genes that
encode for a group of broadly distributed yet understudied proteins; (iii) it further established the
extensive role of MLL2 in nuclear hormone signaling and provided a rationale for future studies
on the link between nuclear hormone signaling and diseases associated with MLL2 alterations;
and finally, (iv) our work further validated the somatic recombination-based approach for
studying massive proteins, such as MLL2, for which overexpression is a challenging task. The
findings and approaches undertaken here have laid the foundation for further understanding the
function of MLL2 and have implications for future research on the rapidly accumulating list of
epigenetic regulator genes that have been found to be altered in cancers and other diseases.
27
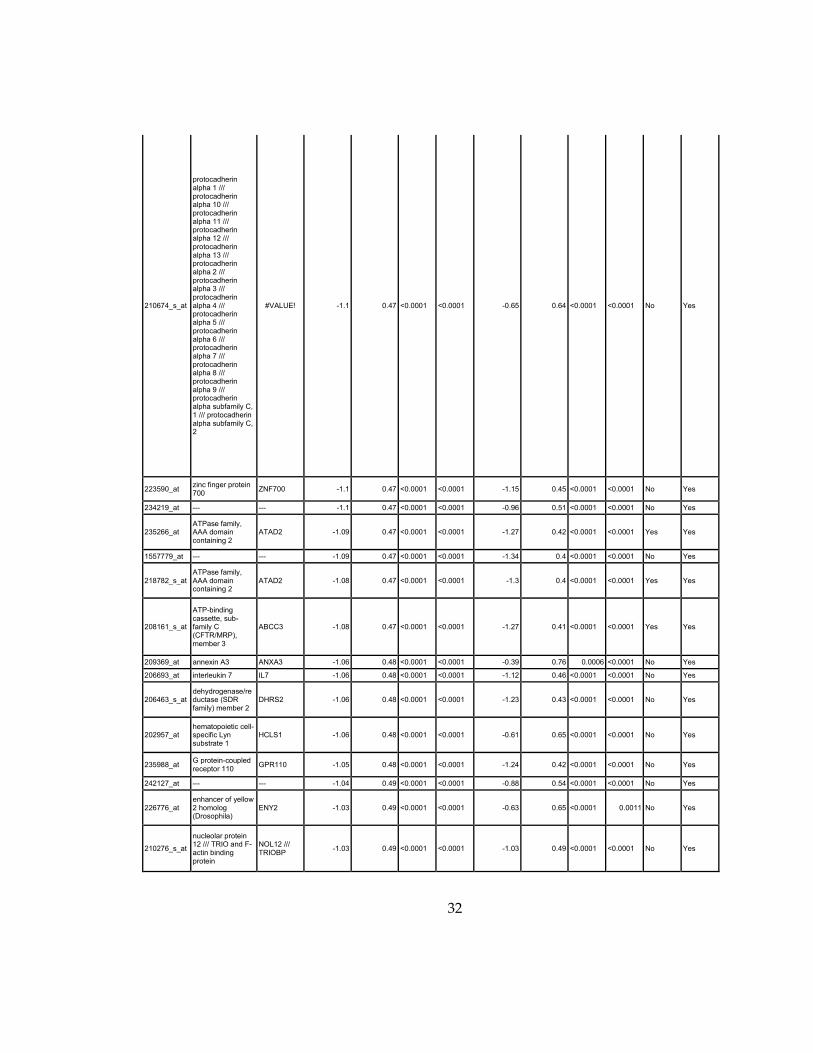
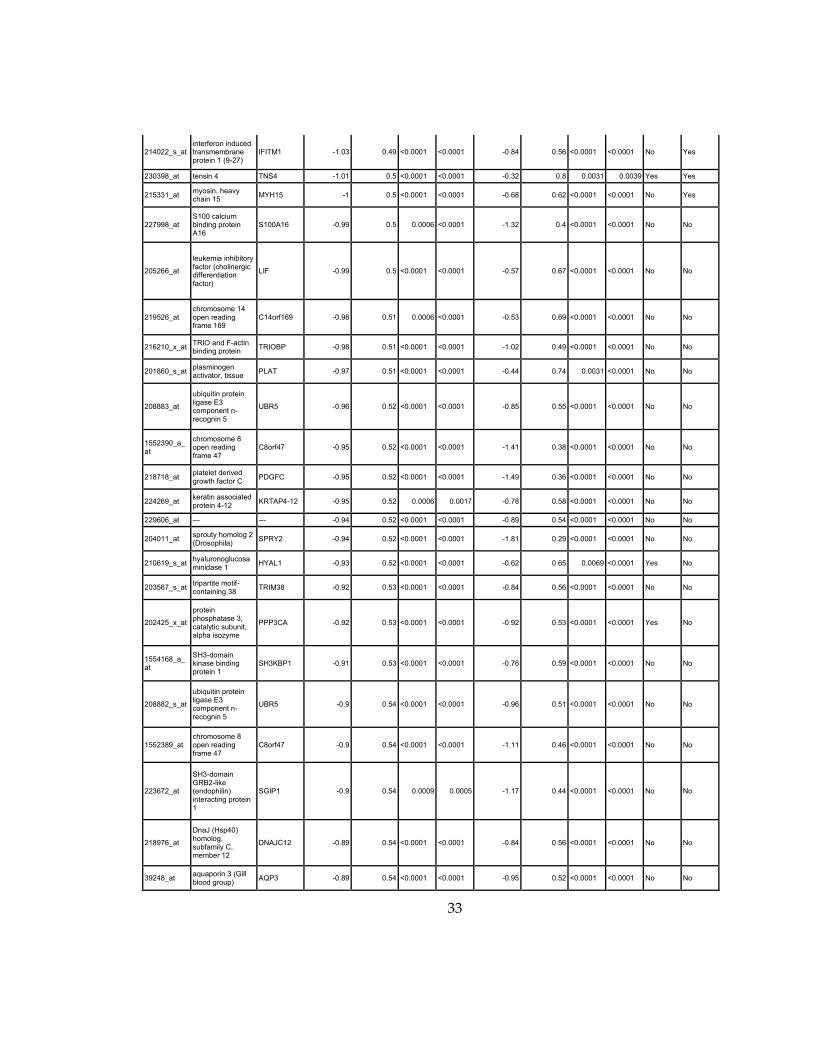
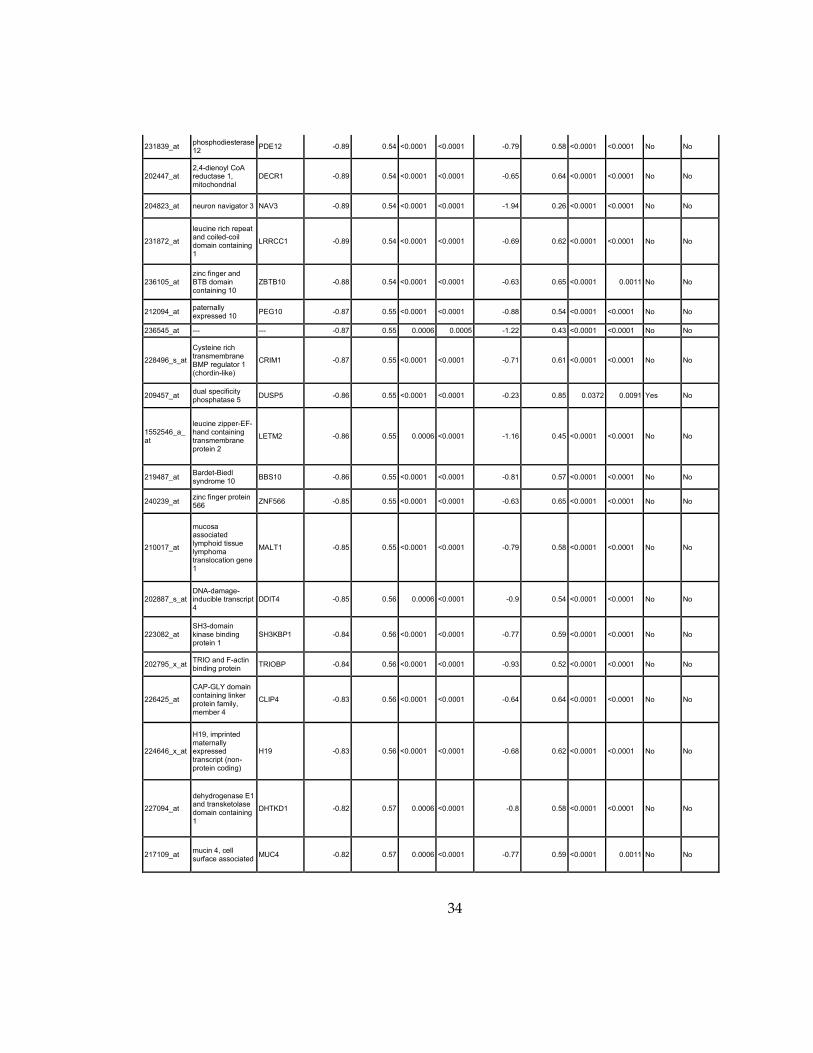
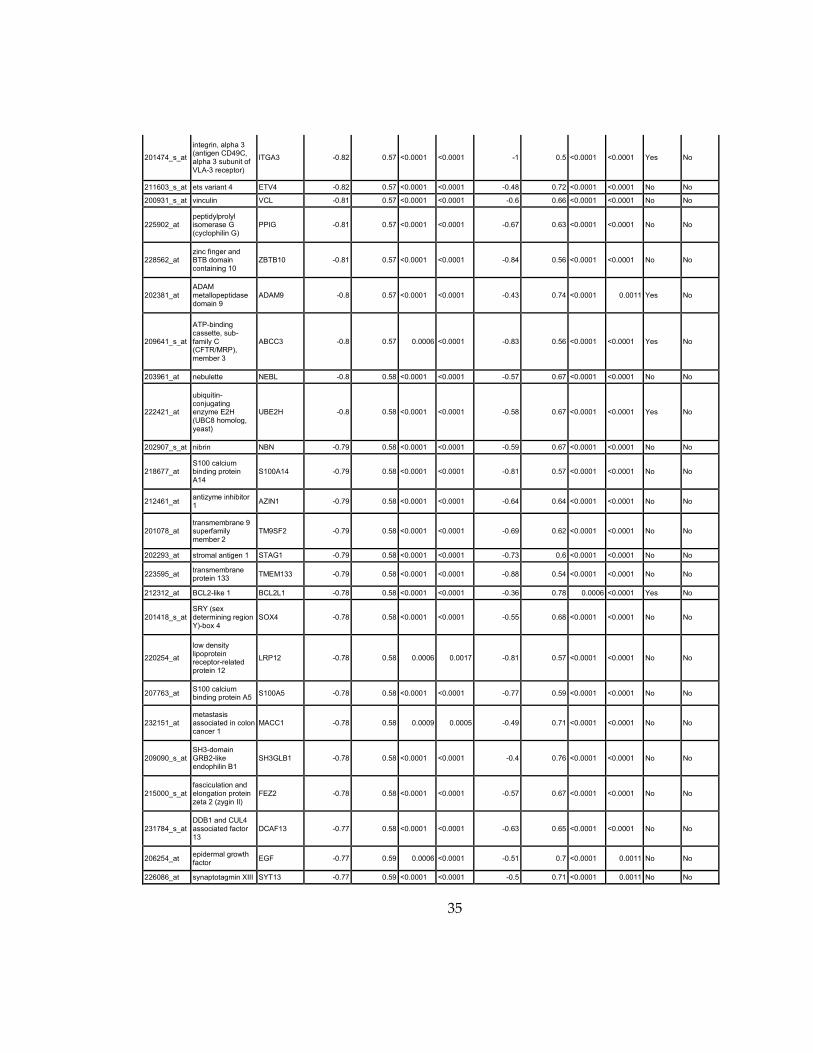
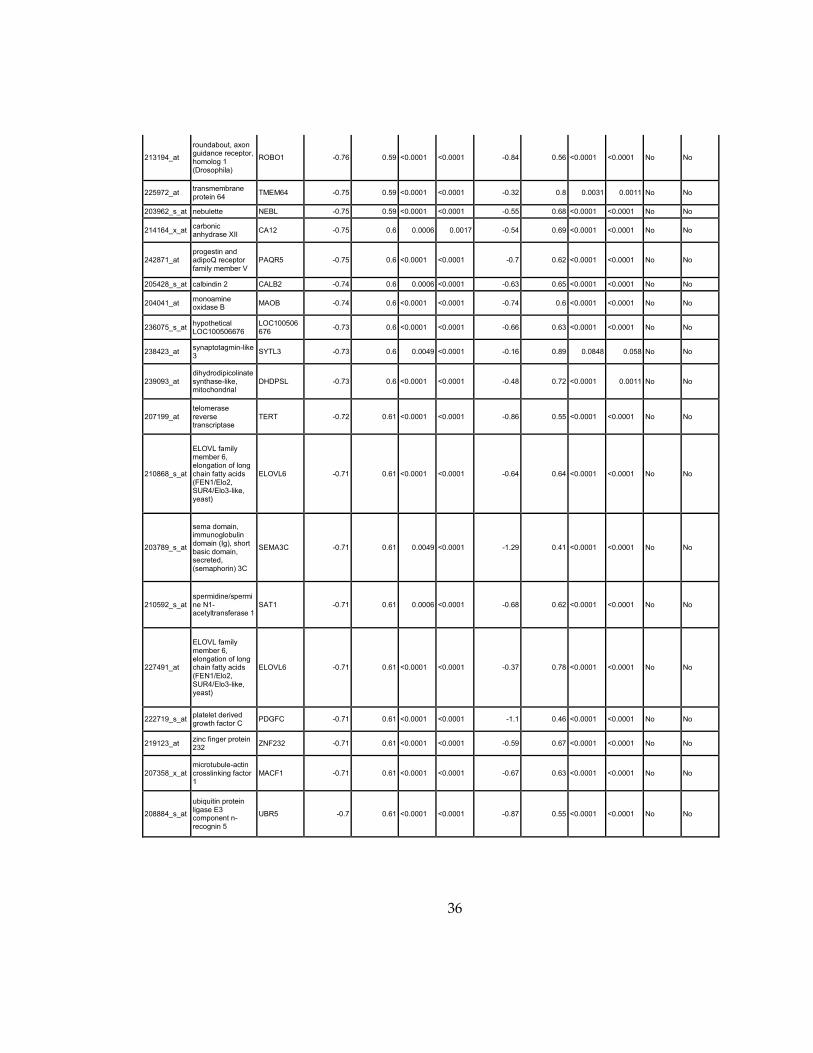
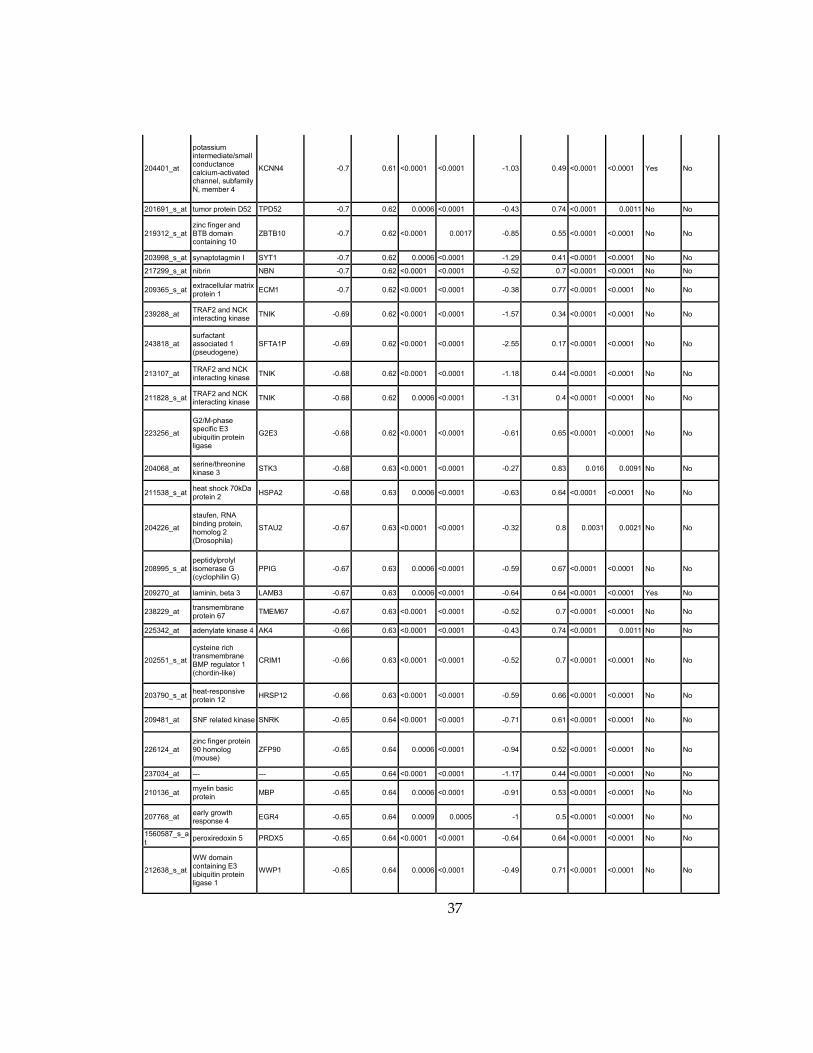
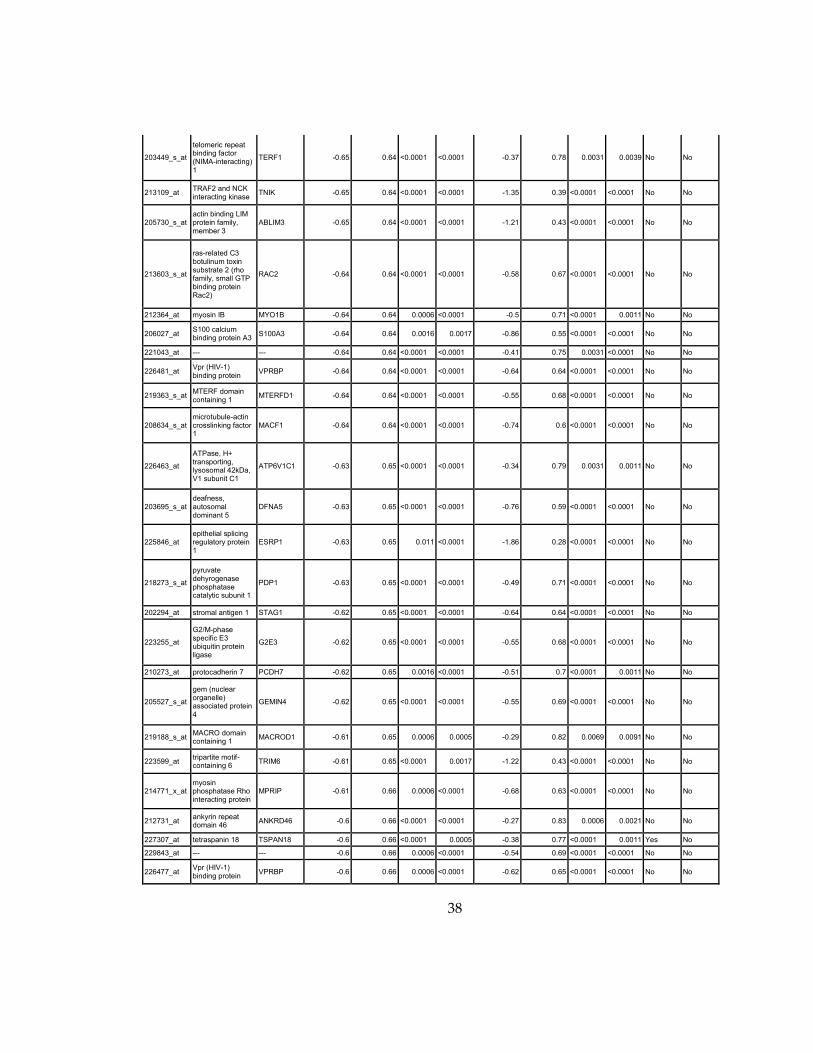
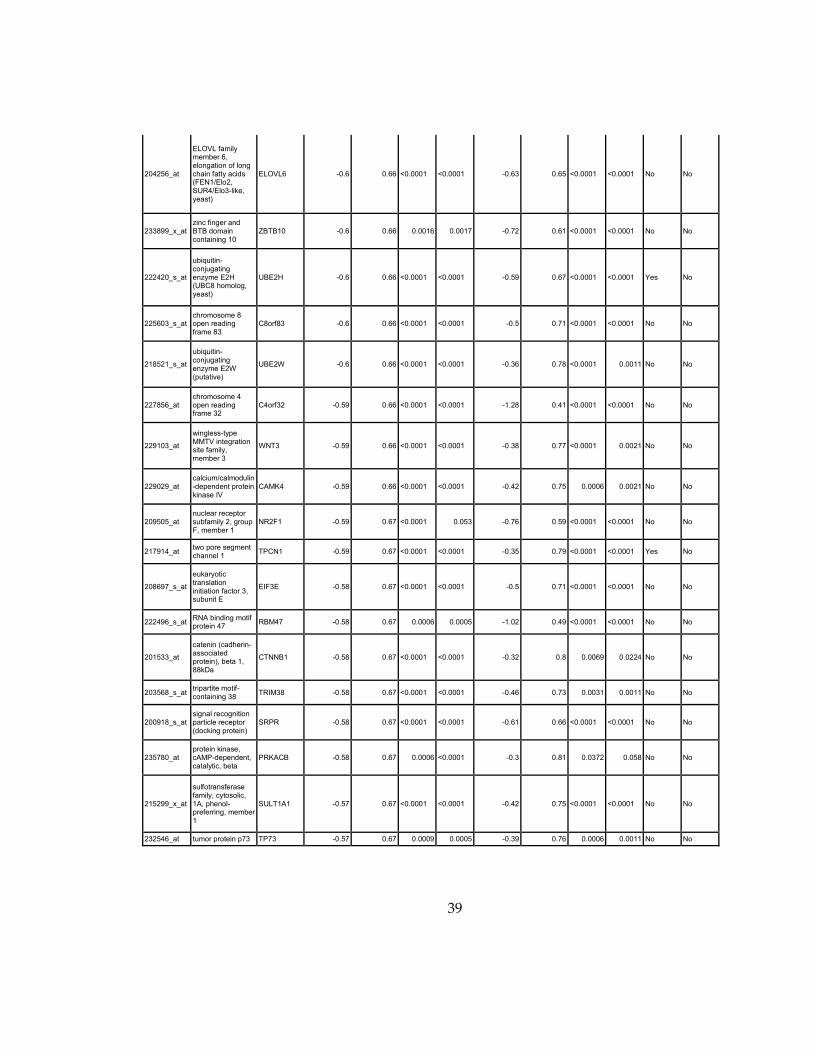
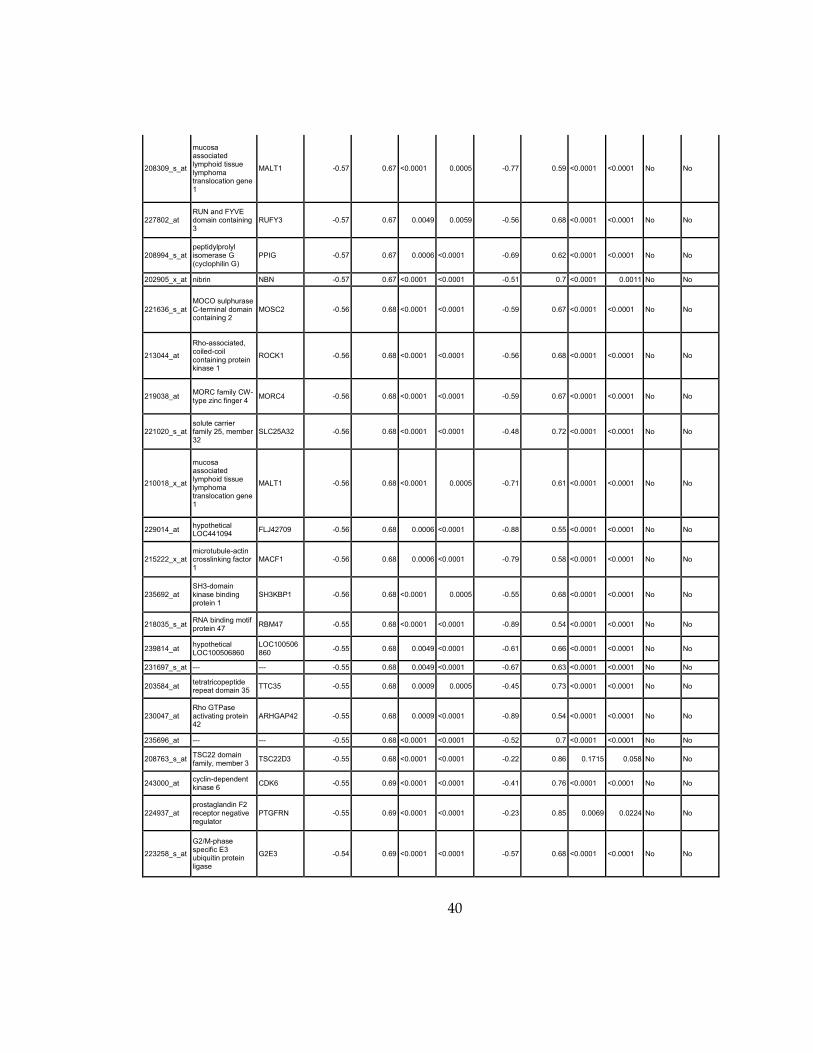
Supplementary Dataset 1
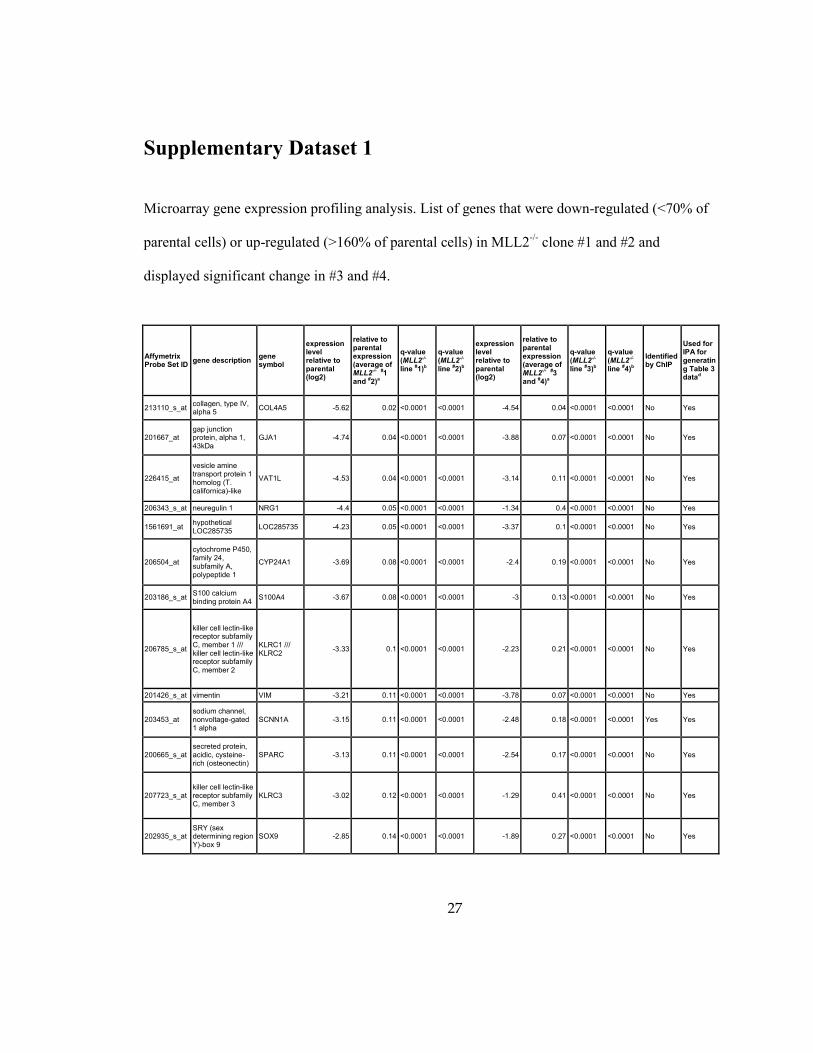
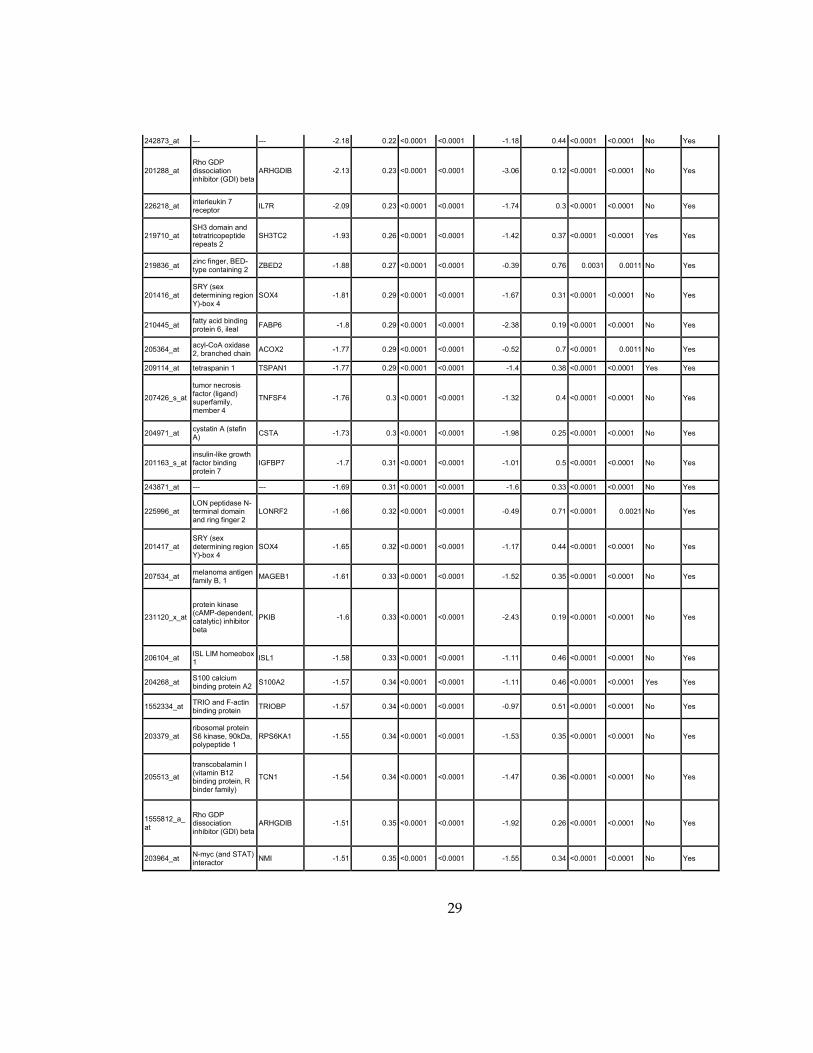
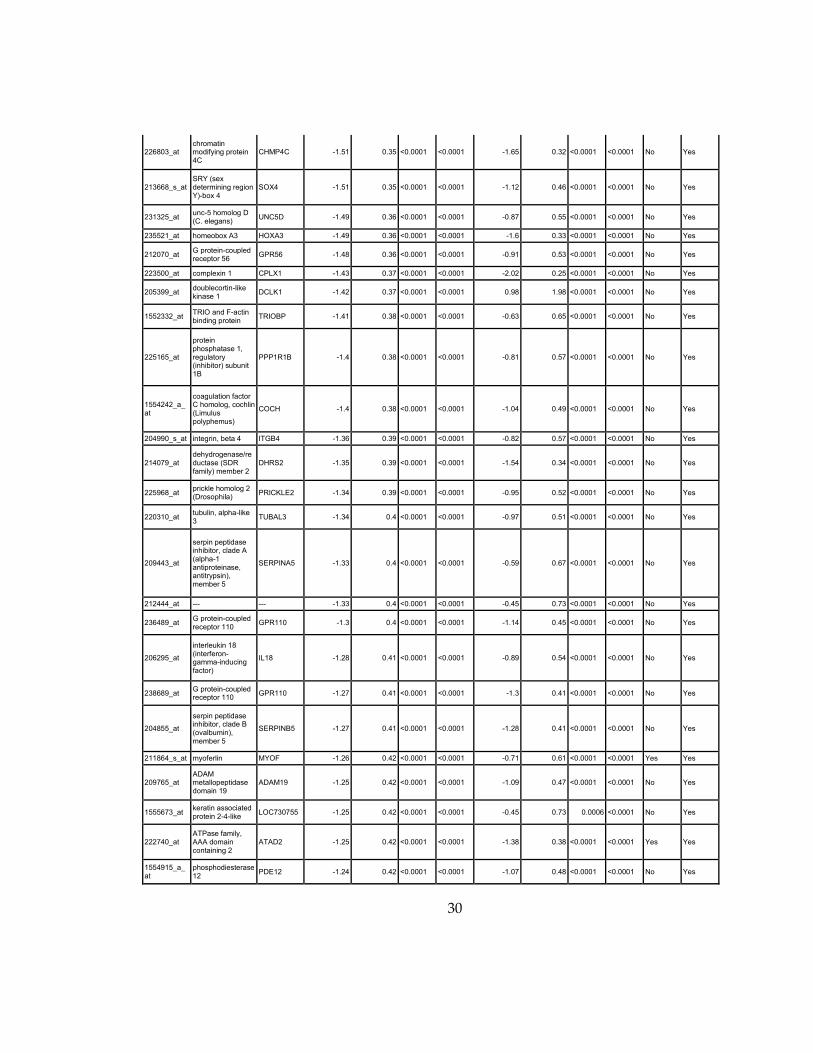
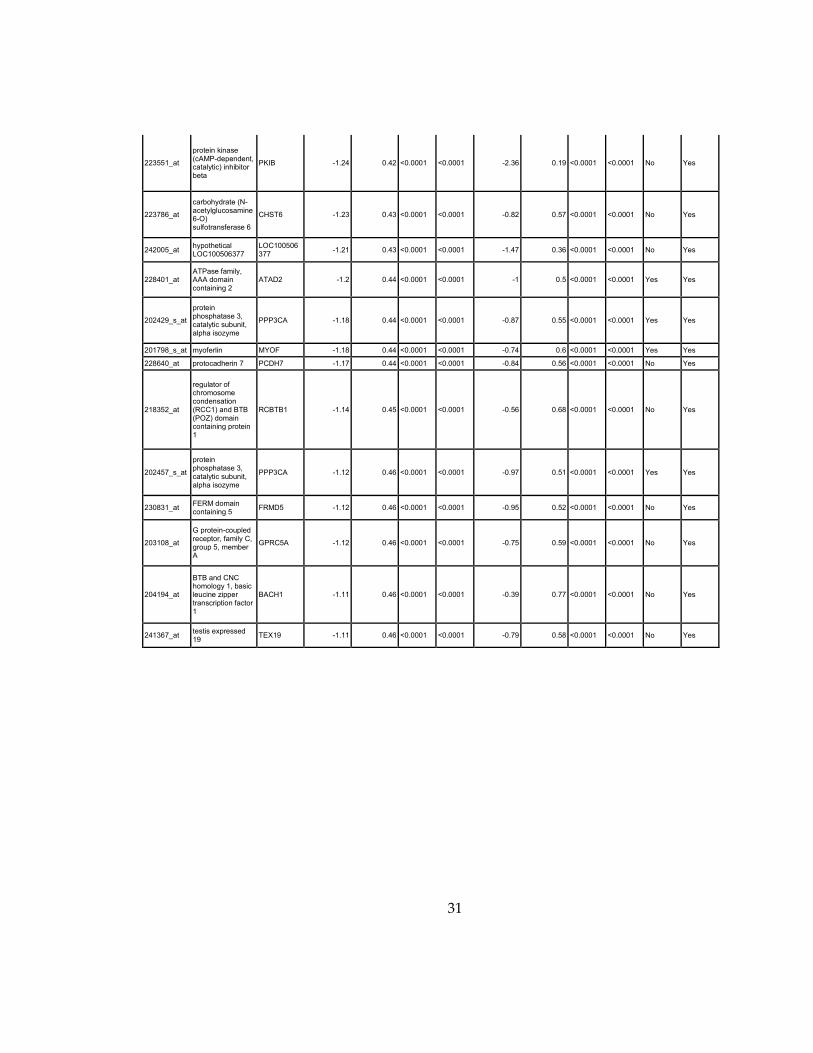
Microarray gene expression profiling analysis. List of genes that were down-regulated (<70% of
parental cells) or up-regulated (>160% of parental cells) in MLL2-/-
clone #1 and #2 and
displayed significant change in #3 and #4.
Affymetrix Probe Set ID
gene description gene symbol
expression level relative to parental (log2)
relative to parental expression (average of MLL2-/- #1 and #2)a
q-value (MLL2-/-
line #1)b
q-value (MLL2-/-
line #2)b
expression level relative to parental (log2)
relative to parental expression (average of MLL2-/- #3 and #4)a
q-value (MLL2-/-
line #3)b
q-value (MLL2-/-
line #4)b
Identified by ChIP
Used for IPA for generating Table 3 datad
213110_s_at collagen, type IV, alpha 5
COL4A5 -5.62 0.02 <0.0001 <0.0001 -4.54 0.04 <0.0001 <0.0001 No Yes
201667_at gap junction protein, alpha 1, 43kDa
GJA1 -4.74 0.04 <0.0001 <0.0001 -3.88 0.07 <0.0001 <0.0001 No Yes
226415_at
vesicle amine transport protein 1 homolog (T. californica)-like
VAT1L -4.53 0.04 <0.0001 <0.0001 -3.14 0.11 <0.0001 <0.0001 No Yes
206343_s_at neuregulin 1 NRG1 -4.4 0.05 <0.0001 <0.0001 -1.34 0.4 <0.0001 <0.0001 No Yes
1561691_at hypothetical LOC285735
LOC285735 -4.23 0.05 <0.0001 <0.0001 -3.37 0.1 <0.0001 <0.0001 No Yes
206504_at
cytochrome P450, family 24, subfamily A, polypeptide 1
CYP24A1 -3.69 0.08 <0.0001 <0.0001 -2.4 0.19 <0.0001 <0.0001 No Yes
203186_s_at S100 calcium binding protein A4
S100A4 -3.67 0.08 <0.0001 <0.0001 -3 0.13 <0.0001 <0.0001 No Yes
206785_s_at
killer cell lectin-like receptor subfamily C, member 1 /// killer cell lectin-like receptor subfamily C, member 2
KLRC1 /// KLRC2
-3.33 0.1 <0.0001 <0.0001 -2.23 0.21 <0.0001 <0.0001 No Yes
201426_s_at vimentin VIM -3.21 0.11 <0.0001 <0.0001 -3.78 0.07 <0.0001 <0.0001 No Yes
203453_at sodium channel, nonvoltage-gated 1 alpha
SCNN1A -3.15 0.11 <0.0001 <0.0001 -2.48 0.18 <0.0001 <0.0001 Yes Yes
200665_s_at secreted protein, acidic, cysteine-rich (osteonectin)
SPARC -3.13 0.11 <0.0001 <0.0001 -2.54 0.17 <0.0001 <0.0001 No Yes
207723_s_at killer cell lectin-like receptor subfamily C, member 3
KLRC3 -3.02 0.12 <0.0001 <0.0001 -1.29 0.41 <0.0001 <0.0001 No Yes
202935_s_at SRY (sex determining region Y)-box 9
SOX9 -2.85 0.14 <0.0001 <0.0001 -1.89 0.27 <0.0001 <0.0001 No Yes

28
204612_at
protein kinase (cAMP-dependent, catalytic) inhibitor alpha
PKIA -2.81 0.14 <0.0001 <0.0001 -2.36 0.19 <0.0001 <0.0001 No Yes
227452_at hypothetical LOC100499467
LOC100499467
-2.75 0.15 <0.0001 <0.0001 -1.82 0.28 <0.0001 <0.0001 No Yes
219631_at
low density lipoprotein receptor-related protein 12
LRP12 -2.72 0.15 <0.0001 <0.0001 -2.89 0.13 <0.0001 <0.0001 No Yes
223435_s_at
protocadherin alpha 1 /// protocadherin alpha 10 /// protocadherin alpha 11 /// protocadherin alpha 12 /// protocadherin alpha 13 /// protocadherin alpha 2 /// protocadherin alpha 3 /// protocadherin alpha 4 /// protocadherin alpha 5 /// protocadherin alpha 6 /// protocadherin alpha 7 /// protocadherin alpha 8 /// protocadherin alpha 9 /// protocadherin alpha subfamily C, 1 /// protocadherin alpha subfamily C, 2
-2.62 0.16 <0.0001 <0.0001 -1.98 0.25 <0.0001 <0.0001 No Yes
240228_at CUB and Sushi multiple domains 3
CSMD3 -2.61 0.16 <0.0001 <0.0001 -2.56 0.17 <0.0001 <0.0001 No Yes
226864_at
protein kinase (cAMP-dependent, catalytic) inhibitor alpha
PKIA -2.5 0.18 <0.0001 <0.0001 -1.73 0.3 <0.0001 <0.0001 No Yes
205229_s_at
coagulation factor C homolog, cochlin (Limulus polyphemus)
COCH -2.48 0.18 <0.0001 <0.0001 -1.24 0.42 <0.0001 <0.0001 No Yes
202936_s_at SRY (sex determining region Y)-box 9
SOX9 -2.48 0.18 <0.0001 <0.0001 -1.64 0.32 <0.0001 <0.0001 No Yes
213992_at collagen, type IV, alpha 6
COL4A6 -2.4 0.19 <0.0001 <0.0001 -1.52 0.35 <0.0001 <0.0001 No Yes
206155_at
ATP-binding cassette, sub-family C (CFTR/MRP), member 2
ABCC2 -2.3 0.2 <0.0001 <0.0001 -2.6 0.16 <0.0001 <0.0001 Yes Yes
221577_x_at growth differentiation factor 15
GDF15 -2.28 0.21 <0.0001 <0.0001 -0.96 0.51 <0.0001 <0.0001 No Yes
29
242873_at --- --- -2.18 0.22 <0.0001 <0.0001 -1.18 0.44 <0.0001 <0.0001 No Yes
201288_at Rho GDP dissociation inhibitor (GDI) beta
ARHGDIB -2.13 0.23 <0.0001 <0.0001 -3.06 0.12 <0.0001 <0.0001 No Yes
226218_at interleukin 7 receptor
IL7R -2.09 0.23 <0.0001 <0.0001 -1.74 0.3 <0.0001 <0.0001 No Yes
219710_at SH3 domain and tetratricopeptide repeats 2
SH3TC2 -1.93 0.26 <0.0001 <0.0001 -1.42 0.37 <0.0001 <0.0001 Yes Yes
219836_at zinc finger, BED-type containing 2
ZBED2 -1.88 0.27 <0.0001 <0.0001 -0.39 0.76 0.0031 0.0011 No Yes
201416_at SRY (sex determining region Y)-box 4
SOX4 -1.81 0.29 <0.0001 <0.0001 -1.67 0.31 <0.0001 <0.0001 No Yes
210445_at fatty acid binding protein 6, ileal
FABP6 -1.8 0.29 <0.0001 <0.0001 -2.38 0.19 <0.0001 <0.0001 No Yes
205364_at acyl-CoA oxidase 2, branched chain
ACOX2 -1.77 0.29 <0.0001 <0.0001 -0.52 0.7 <0.0001 0.0011 No Yes
209114_at tetraspanin 1 TSPAN1 -1.77 0.29 <0.0001 <0.0001 -1.4 0.38 <0.0001 <0.0001 Yes Yes
207426_s_at
tumor necrosis factor (ligand) superfamily, member 4
TNFSF4 -1.76 0.3 <0.0001 <0.0001 -1.32 0.4 <0.0001 <0.0001 No Yes
204971_at cystatin A (stefin A)
CSTA -1.73 0.3 <0.0001 <0.0001 -1.98 0.25 <0.0001 <0.0001 No Yes
201163_s_at insulin-like growth factor binding protein 7
IGFBP7 -1.7 0.31 <0.0001 <0.0001 -1.01 0.5 <0.0001 <0.0001 No Yes
243871_at --- --- -1.69 0.31 <0.0001 <0.0001 -1.6 0.33 <0.0001 <0.0001 No Yes
225996_at LON peptidase N-terminal domain and ring finger 2
LONRF2 -1.66 0.32 <0.0001 <0.0001 -0.49 0.71 <0.0001 0.0021 No Yes
201417_at SRY (sex determining region Y)-box 4
SOX4 -1.65 0.32 <0.0001 <0.0001 -1.17 0.44 <0.0001 <0.0001 No Yes
207534_at melanoma antigen family B, 1
MAGEB1 -1.61 0.33 <0.0001 <0.0001 -1.52 0.35 <0.0001 <0.0001 No Yes
231120_x_at
protein kinase (cAMP-dependent, catalytic) inhibitor beta
PKIB -1.6 0.33 <0.0001 <0.0001 -2.43 0.19 <0.0001 <0.0001 No Yes
206104_at ISL LIM homeobox 1
ISL1 -1.58 0.33 <0.0001 <0.0001 -1.11 0.46 <0.0001 <0.0001 No Yes
204268_at S100 calcium binding protein A2
S100A2 -1.57 0.34 <0.0001 <0.0001 -1.11 0.46 <0.0001 <0.0001 Yes Yes
1552334_at TRIO and F-actin binding protein
TRIOBP -1.57 0.34 <0.0001 <0.0001 -0.97 0.51 <0.0001 <0.0001 No Yes
203379_at ribosomal protein S6 kinase, 90kDa, polypeptide 1
RPS6KA1 -1.55 0.34 <0.0001 <0.0001 -1.53 0.35 <0.0001 <0.0001 No Yes
205513_at
transcobalamin I (vitamin B12 binding protein, R binder family)
TCN1 -1.54 0.34 <0.0001 <0.0001 -1.47 0.36 <0.0001 <0.0001 No Yes
1555812_a_at
Rho GDP dissociation inhibitor (GDI) beta
ARHGDIB -1.51 0.35 <0.0001 <0.0001 -1.92 0.26 <0.0001 <0.0001 No Yes
203964_at N-myc (and STAT) interactor
NMI -1.51 0.35 <0.0001 <0.0001 -1.55 0.34 <0.0001 <0.0001 No Yes
30
226803_at chromatin modifying protein 4C
CHMP4C -1.51 0.35 <0.0001 <0.0001 -1.65 0.32 <0.0001 <0.0001 No Yes
213668_s_at SRY (sex determining region Y)-box 4
SOX4 -1.51 0.35 <0.0001 <0.0001 -1.12 0.46 <0.0001 <0.0001 No Yes
231325_at unc-5 homolog D (C. elegans)
UNC5D -1.49 0.36 <0.0001 <0.0001 -0.87 0.55 <0.0001 <0.0001 No Yes
235521_at homeobox A3 HOXA3 -1.49 0.36 <0.0001 <0.0001 -1.6 0.33 <0.0001 <0.0001 No Yes
212070_at G protein-coupled receptor 56
GPR56 -1.48 0.36 <0.0001 <0.0001 -0.91 0.53 <0.0001 <0.0001 No Yes
223500_at complexin 1 CPLX1 -1.43 0.37 <0.0001 <0.0001 -2.02 0.25 <0.0001 <0.0001 No Yes
205399_at doublecortin-like kinase 1
DCLK1 -1.42 0.37 <0.0001 <0.0001 0.98 1.98 <0.0001 <0.0001 No Yes
1552332_at TRIO and F-actin binding protein
TRIOBP -1.41 0.38 <0.0001 <0.0001 -0.63 0.65 <0.0001 <0.0001 No Yes
225165_at
protein phosphatase 1, regulatory (inhibitor) subunit 1B
PPP1R1B -1.4 0.38 <0.0001 <0.0001 -0.81 0.57 <0.0001 <0.0001 No Yes
1554242_a_at
coagulation factor C homolog, cochlin (Limulus polyphemus)
COCH -1.4 0.38 <0.0001 <0.0001 -1.04 0.49 <0.0001 <0.0001 No Yes
204990_s_at integrin, beta 4 ITGB4 -1.36 0.39 <0.0001 <0.0001 -0.82 0.57 <0.0001 <0.0001 No Yes
214079_at dehydrogenase/reductase (SDR family) member 2
DHRS2 -1.35 0.39 <0.0001 <0.0001 -1.54 0.34 <0.0001 <0.0001 No Yes
225968_at prickle homolog 2 (Drosophila)
PRICKLE2 -1.34 0.39 <0.0001 <0.0001 -0.95 0.52 <0.0001 <0.0001 No Yes
220310_at tubulin, alpha-like 3
TUBAL3 -1.34 0.4 <0.0001 <0.0001 -0.97 0.51 <0.0001 <0.0001 No Yes
209443_at
serpin peptidase inhibitor, clade A (alpha-1 antiproteinase, antitrypsin), member 5
SERPINA5 -1.33 0.4 <0.0001 <0.0001 -0.59 0.67 <0.0001 <0.0001 No Yes
212444_at --- --- -1.33 0.4 <0.0001 <0.0001 -0.45 0.73 <0.0001 <0.0001 No Yes
236489_at G protein-coupled receptor 110
GPR110 -1.3 0.4 <0.0001 <0.0001 -1.14 0.45 <0.0001 <0.0001 No Yes
206295_at
interleukin 18 (interferon-gamma-inducing factor)
IL18 -1.28 0.41 <0.0001 <0.0001 -0.89 0.54 <0.0001 <0.0001 No Yes
238689_at G protein-coupled receptor 110
GPR110 -1.27 0.41 <0.0001 <0.0001 -1.3 0.41 <0.0001 <0.0001 No Yes
204855_at
serpin peptidase inhibitor, clade B (ovalbumin), member 5
SERPINB5 -1.27 0.41 <0.0001 <0.0001 -1.28 0.41 <0.0001 <0.0001 No Yes
211864_s_at myoferlin MYOF -1.26 0.42 <0.0001 <0.0001 -0.71 0.61 <0.0001 <0.0001 Yes Yes
209765_at ADAM metallopeptidase domain 19
ADAM19 -1.25 0.42 <0.0001 <0.0001 -1.09 0.47 <0.0001 <0.0001 No Yes
1555673_at keratin associated protein 2-4-like
LOC730755 -1.25 0.42 <0.0001 <0.0001 -0.45 0.73 0.0006 <0.0001 No Yes
222740_at ATPase family, AAA domain containing 2
ATAD2 -1.25 0.42 <0.0001 <0.0001 -1.38 0.38 <0.0001 <0.0001 Yes Yes
1554915_a_at
phosphodiesterase 12
PDE12 -1.24 0.42 <0.0001 <0.0001 -1.07 0.48 <0.0001 <0.0001 No Yes
31
223551_at
protein kinase (cAMP-dependent, catalytic) inhibitor beta
PKIB -1.24 0.42 <0.0001 <0.0001 -2.36 0.19 <0.0001 <0.0001 No Yes
223786_at
carbohydrate (N-acetylglucosamine 6-O) sulfotransferase 6
CHST6 -1.23 0.43 <0.0001 <0.0001 -0.82 0.57 <0.0001 <0.0001 No Yes
242005_at hypothetical LOC100506377
LOC100506377
-1.21 0.43 <0.0001 <0.0001 -1.47 0.36 <0.0001 <0.0001 No Yes
228401_at ATPase family, AAA domain containing 2
ATAD2 -1.2 0.44 <0.0001 <0.0001 -1 0.5 <0.0001 <0.0001 Yes Yes
202429_s_at
protein phosphatase 3, catalytic subunit, alpha isozyme
PPP3CA -1.18 0.44 <0.0001 <0.0001 -0.87 0.55 <0.0001 <0.0001 Yes Yes
201798_s_at myoferlin MYOF -1.18 0.44 <0.0001 <0.0001 -0.74 0.6 <0.0001 <0.0001 Yes Yes
228640_at protocadherin 7 PCDH7 -1.17 0.44 <0.0001 <0.0001 -0.84 0.56 <0.0001 <0.0001 No Yes
218352_at
regulator of chromosome condensation (RCC1) and BTB (POZ) domain containing protein 1
RCBTB1 -1.14 0.45 <0.0001 <0.0001 -0.56 0.68 <0.0001 <0.0001 No Yes
202457_s_at
protein phosphatase 3, catalytic subunit, alpha isozyme
PPP3CA -1.12 0.46 <0.0001 <0.0001 -0.97 0.51 <0.0001 <0.0001 Yes Yes
230831_at FERM domain containing 5
FRMD5 -1.12 0.46 <0.0001 <0.0001 -0.95 0.52 <0.0001 <0.0001 No Yes
203108_at
G protein-coupled receptor, family C, group 5, member A
GPRC5A -1.12 0.46 <0.0001 <0.0001 -0.75 0.59 <0.0001 <0.0001 No Yes
204194_at
BTB and CNC homology 1, basic leucine zipper transcription factor 1
BACH1 -1.11 0.46 <0.0001 <0.0001 -0.39 0.77 <0.0001 <0.0001 No Yes
241367_at testis expressed 19
TEX19 -1.11 0.46 <0.0001 <0.0001 -0.79 0.58 <0.0001 <0.0001 No Yes
32
210674_s_at
protocadherin alpha 1 /// protocadherin alpha 10 /// protocadherin alpha 11 /// protocadherin alpha 12 /// protocadherin alpha 13 /// protocadherin alpha 2 /// protocadherin alpha 3 /// protocadherin alpha 4 /// protocadherin alpha 5 /// protocadherin alpha 6 /// protocadherin alpha 7 /// protocadherin alpha 8 /// protocadherin alpha 9 /// protocadherin alpha subfamily C, 1 /// protocadherin alpha subfamily C, 2
#VALUE! -1.1 0.47 <0.0001 <0.0001 -0.65 0.64 <0.0001 <0.0001 No Yes
223590_at zinc finger protein 700
ZNF700 -1.1 0.47 <0.0001 <0.0001 -1.15 0.45 <0.0001 <0.0001 No Yes
234219_at --- --- -1.1 0.47 <0.0001 <0.0001 -0.96 0.51 <0.0001 <0.0001 No Yes
235266_at ATPase family, AAA domain containing 2
ATAD2 -1.09 0.47 <0.0001 <0.0001 -1.27 0.42 <0.0001 <0.0001 Yes Yes
1557779_at --- --- -1.09 0.47 <0.0001 <0.0001 -1.34 0.4 <0.0001 <0.0001 No Yes
218782_s_at ATPase family, AAA domain containing 2
ATAD2 -1.08 0.47 <0.0001 <0.0001 -1.3 0.4 <0.0001 <0.0001 Yes Yes
208161_s_at
ATP-binding cassette, sub-family C (CFTR/MRP), member 3
ABCC3 -1.08 0.47 <0.0001 <0.0001 -1.27 0.41 <0.0001 <0.0001 Yes Yes
209369_at annexin A3 ANXA3 -1.06 0.48 <0.0001 <0.0001 -0.39 0.76 0.0006 <0.0001 No Yes
206693_at interleukin 7 IL7 -1.06 0.48 <0.0001 <0.0001 -1.12 0.46 <0.0001 <0.0001 No Yes
206463_s_at dehydrogenase/reductase (SDR family) member 2
DHRS2 -1.06 0.48 <0.0001 <0.0001 -1.23 0.43 <0.0001 <0.0001 No Yes
202957_at hematopoietic cell-specific Lyn substrate 1
HCLS1 -1.06 0.48 <0.0001 <0.0001 -0.61 0.65 <0.0001 <0.0001 No Yes
235988_at G protein-coupled receptor 110
GPR110 -1.05 0.48 <0.0001 <0.0001 -1.24 0.42 <0.0001 <0.0001 No Yes
242127_at --- --- -1.04 0.49 <0.0001 <0.0001 -0.88 0.54 <0.0001 <0.0001 No Yes
226776_at enhancer of yellow 2 homolog (Drosophila)
ENY2 -1.03 0.49 <0.0001 <0.0001 -0.63 0.65 <0.0001 0.0011 No Yes
210276_s_at
nucleolar protein 12 /// TRIO and F-actin binding protein
NOL12 /// TRIOBP
-1.03 0.49 <0.0001 <0.0001 -1.03 0.49 <0.0001 <0.0001 No Yes
33
214022_s_at interferon induced transmembrane protein 1 (9-27)
IFITM1 -1.03 0.49 <0.0001 <0.0001 -0.84 0.56 <0.0001 <0.0001 No Yes
230398_at tensin 4 TNS4 -1.01 0.5 <0.0001 <0.0001 -0.32 0.8 0.0031 0.0039 Yes Yes
215331_at myosin, heavy chain 15
MYH15 -1 0.5 <0.0001 <0.0001 -0.68 0.62 <0.0001 <0.0001 No Yes
227998_at S100 calcium binding protein A16
S100A16 -0.99 0.5 0.0006 <0.0001 -1.32 0.4 <0.0001 <0.0001 No No
205266_at
leukemia inhibitory factor (cholinergic differentiation factor)
LIF -0.99 0.5 <0.0001 <0.0001 -0.57 0.67 <0.0001 <0.0001 No No
219526_at chromosome 14 open reading frame 169
C14orf169 -0.98 0.51 0.0006 <0.0001 -0.53 0.69 <0.0001 <0.0001 No No
216210_x_at TRIO and F-actin binding protein
TRIOBP -0.98 0.51 <0.0001 <0.0001 -1.02 0.49 <0.0001 <0.0001 No No
201860_s_at plasminogen activator, tissue
PLAT -0.97 0.51 <0.0001 <0.0001 -0.44 0.74 0.0031 <0.0001 No No
208883_at
ubiquitin protein ligase E3 component n-recognin 5
UBR5 -0.96 0.52 <0.0001 <0.0001 -0.85 0.55 <0.0001 <0.0001 No No
1552390_a_at
chromosome 8 open reading frame 47
C8orf47 -0.95 0.52 <0.0001 <0.0001 -1.41 0.38 <0.0001 <0.0001 No No
218718_at platelet derived growth factor C
PDGFC -0.95 0.52 <0.0001 <0.0001 -1.49 0.36 <0.0001 <0.0001 No No
224269_at keratin associated protein 4-12
KRTAP4-12 -0.95 0.52 0.0006 0.0017 -0.78 0.58 <0.0001 <0.0001 No No
229606_at --- --- -0.94 0.52 <0.0001 <0.0001 -0.89 0.54 <0.0001 <0.0001 No No
204011_at sprouty homolog 2 (Drosophila)
SPRY2 -0.94 0.52 <0.0001 <0.0001 -1.81 0.29 <0.0001 <0.0001 No No
210619_s_at hyaluronoglucosaminidase 1
HYAL1 -0.93 0.52 <0.0001 <0.0001 -0.62 0.65 0.0069 <0.0001 Yes No
203567_s_at tripartite motif-containing 38
TRIM38 -0.92 0.53 <0.0001 <0.0001 -0.84 0.56 <0.0001 <0.0001 No No
202425_x_at
protein phosphatase 3, catalytic subunit, alpha isozyme
PPP3CA -0.92 0.53 <0.0001 <0.0001 -0.92 0.53 <0.0001 <0.0001 Yes No
1554168_a_at
SH3-domain kinase binding protein 1
SH3KBP1 -0.91 0.53 <0.0001 <0.0001 -0.76 0.59 <0.0001 <0.0001 No No
208882_s_at
ubiquitin protein ligase E3 component n-recognin 5
UBR5 -0.9 0.54 <0.0001 <0.0001 -0.96 0.51 <0.0001 <0.0001 No No
1552389_at chromosome 8 open reading frame 47
C8orf47 -0.9 0.54 <0.0001 <0.0001 -1.11 0.46 <0.0001 <0.0001 No No
223672_at
SH3-domain GRB2-like (endophilin) interacting protein 1
SGIP1 -0.9 0.54 0.0009 0.0005 -1.17 0.44 <0.0001 <0.0001 No No
218976_at
DnaJ (Hsp40) homolog, subfamily C, member 12
DNAJC12 -0.89 0.54 <0.0001 <0.0001 -0.84 0.56 <0.0001 <0.0001 No No
39248_at aquaporin 3 (Gill blood group)
AQP3 -0.89 0.54 <0.0001 <0.0001 -0.95 0.52 <0.0001 <0.0001 No No
34
231839_at phosphodiesterase 12
PDE12 -0.89 0.54 <0.0001 <0.0001 -0.79 0.58 <0.0001 <0.0001 No No
202447_at 2,4-dienoyl CoA reductase 1, mitochondrial
DECR1 -0.89 0.54 <0.0001 <0.0001 -0.65 0.64 <0.0001 <0.0001 No No
204823_at neuron navigator 3 NAV3 -0.89 0.54 <0.0001 <0.0001 -1.94 0.26 <0.0001 <0.0001 No No
231872_at
leucine rich repeat and coiled-coil domain containing 1
LRRCC1 -0.89 0.54 <0.0001 <0.0001 -0.69 0.62 <0.0001 <0.0001 No No
236105_at zinc finger and BTB domain containing 10
ZBTB10 -0.88 0.54 <0.0001 <0.0001 -0.63 0.65 <0.0001 0.0011 No No
212094_at paternally expressed 10
PEG10 -0.87 0.55 <0.0001 <0.0001 -0.88 0.54 <0.0001 <0.0001 No No
236545_at --- --- -0.87 0.55 0.0006 0.0005 -1.22 0.43 <0.0001 <0.0001 No No
228496_s_at
Cysteine rich transmembrane BMP regulator 1 (chordin-like)
CRIM1 -0.87 0.55 <0.0001 <0.0001 -0.71 0.61 <0.0001 <0.0001 No No
209457_at dual specificity phosphatase 5
DUSP5 -0.86 0.55 <0.0001 <0.0001 -0.23 0.85 0.0372 0.0091 Yes No
1552546_a_at
leucine zipper-EF-hand containing transmembrane protein 2
LETM2 -0.86 0.55 0.0006 <0.0001 -1.16 0.45 <0.0001 <0.0001 No No
219487_at Bardet-Biedl syndrome 10
BBS10 -0.86 0.55 <0.0001 <0.0001 -0.81 0.57 <0.0001 <0.0001 No No
240239_at zinc finger protein 566
ZNF566 -0.85 0.55 <0.0001 <0.0001 -0.63 0.65 <0.0001 <0.0001 No No
210017_at
mucosa associated lymphoid tissue lymphoma translocation gene 1
MALT1 -0.85 0.55 <0.0001 <0.0001 -0.79 0.58 <0.0001 <0.0001 No No
202887_s_at DNA-damage-inducible transcript 4
DDIT4 -0.85 0.56 0.0006 <0.0001 -0.9 0.54 <0.0001 <0.0001 No No
223082_at SH3-domain kinase binding protein 1
SH3KBP1 -0.84 0.56 <0.0001 <0.0001 -0.77 0.59 <0.0001 <0.0001 No No
202795_x_at TRIO and F-actin binding protein
TRIOBP -0.84 0.56 <0.0001 <0.0001 -0.93 0.52 <0.0001 <0.0001 No No
226425_at
CAP-GLY domain containing linker protein family, member 4
CLIP4 -0.83 0.56 <0.0001 <0.0001 -0.64 0.64 <0.0001 <0.0001 No No
224646_x_at
H19, imprinted maternally expressed transcript (non-protein coding)
H19 -0.83 0.56 <0.0001 <0.0001 -0.68 0.62 <0.0001 <0.0001 No No
227094_at
dehydrogenase E1 and transketolase domain containing 1
DHTKD1 -0.82 0.57 0.0006 <0.0001 -0.8 0.58 <0.0001 <0.0001 No No
217109_at mucin 4, cell surface associated
MUC4 -0.82 0.57 0.0006 <0.0001 -0.77 0.59 <0.0001 0.0011 No No
35
201474_s_at
integrin, alpha 3 (antigen CD49C, alpha 3 subunit of VLA-3 receptor)
ITGA3 -0.82 0.57 <0.0001 <0.0001 -1 0.5 <0.0001 <0.0001 Yes No
211603_s_at ets variant 4 ETV4 -0.82 0.57 <0.0001 <0.0001 -0.48 0.72 <0.0001 <0.0001 No No
200931_s_at vinculin VCL -0.81 0.57 <0.0001 <0.0001 -0.6 0.66 <0.0001 <0.0001 No No
225902_at peptidylprolyl isomerase G (cyclophilin G)
PPIG -0.81 0.57 <0.0001 <0.0001 -0.67 0.63 <0.0001 <0.0001 No No
228562_at zinc finger and BTB domain containing 10
ZBTB10 -0.81 0.57 <0.0001 <0.0001 -0.84 0.56 <0.0001 <0.0001 No No
202381_at ADAM metallopeptidase domain 9
ADAM9 -0.8 0.57 <0.0001 <0.0001 -0.43 0.74 <0.0001 0.0011 Yes No
209641_s_at
ATP-binding cassette, sub-family C (CFTR/MRP), member 3
ABCC3 -0.8 0.57 0.0006 <0.0001 -0.83 0.56 <0.0001 <0.0001 Yes No
203961_at nebulette NEBL -0.8 0.58 <0.0001 <0.0001 -0.57 0.67 <0.0001 <0.0001 No No
222421_at
ubiquitin-conjugating enzyme E2H (UBC8 homolog, yeast)
UBE2H -0.8 0.58 <0.0001 <0.0001 -0.58 0.67 <0.0001 <0.0001 Yes No
202907_s_at nibrin NBN -0.79 0.58 <0.0001 <0.0001 -0.59 0.67 <0.0001 <0.0001 No No
218677_at S100 calcium binding protein A14
S100A14 -0.79 0.58 <0.0001 <0.0001 -0.81 0.57 <0.0001 <0.0001 No No
212461_at antizyme inhibitor 1
AZIN1 -0.79 0.58 <0.0001 <0.0001 -0.64 0.64 <0.0001 <0.0001 No No
201078_at transmembrane 9 superfamily member 2
TM9SF2 -0.79 0.58 <0.0001 <0.0001 -0.69 0.62 <0.0001 <0.0001 No No
202293_at stromal antigen 1 STAG1 -0.79 0.58 <0.0001 <0.0001 -0.73 0.6 <0.0001 <0.0001 No No
223595_at transmembrane protein 133
TMEM133 -0.79 0.58 <0.0001 <0.0001 -0.88 0.54 <0.0001 <0.0001 No No
212312_at BCL2-like 1 BCL2L1 -0.78 0.58 <0.0001 <0.0001 -0.36 0.78 0.0006 <0.0001 Yes No
201418_s_at SRY (sex determining region Y)-box 4
SOX4 -0.78 0.58 <0.0001 <0.0001 -0.55 0.68 <0.0001 <0.0001 No No
220254_at
low density lipoprotein receptor-related protein 12
LRP12 -0.78 0.58 0.0006 0.0017 -0.81 0.57 <0.0001 <0.0001 No No
207763_at S100 calcium binding protein A5
S100A5 -0.78 0.58 <0.0001 <0.0001 -0.77 0.59 <0.0001 <0.0001 No No
232151_at metastasis associated in colon cancer 1
MACC1 -0.78 0.58 0.0009 0.0005 -0.49 0.71 <0.0001 <0.0001 No No
209090_s_at SH3-domain GRB2-like endophilin B1
SH3GLB1 -0.78 0.58 <0.0001 <0.0001 -0.4 0.76 <0.0001 <0.0001 No No
215000_s_at fasciculation and elongation protein zeta 2 (zygin II)
FEZ2 -0.78 0.58 <0.0001 <0.0001 -0.57 0.67 <0.0001 <0.0001 No No
231784_s_at DDB1 and CUL4 associated factor 13
DCAF13 -0.77 0.58 <0.0001 <0.0001 -0.63 0.65 <0.0001 <0.0001 No No
206254_at epidermal growth factor
EGF -0.77 0.59 0.0006 <0.0001 -0.51 0.7 <0.0001 0.0011 No No
226086_at synaptotagmin XIII SYT13 -0.77 0.59 <0.0001 <0.0001 -0.5 0.71 <0.0001 0.0011 No No
36
213194_at
roundabout, axon guidance receptor, homolog 1 (Drosophila)
ROBO1 -0.76 0.59 <0.0001 <0.0001 -0.84 0.56 <0.0001 <0.0001 No No
225972_at transmembrane protein 64
TMEM64 -0.75 0.59 <0.0001 <0.0001 -0.32 0.8 0.0031 0.0011 No No
203962_s_at nebulette NEBL -0.75 0.59 <0.0001 <0.0001 -0.55 0.68 <0.0001 <0.0001 No No
214164_x_at carbonic anhydrase XII
CA12 -0.75 0.6 0.0006 0.0017 -0.54 0.69 <0.0001 <0.0001 No No
242871_at progestin and adipoQ receptor family member V
PAQR5 -0.75 0.6 <0.0001 <0.0001 -0.7 0.62 <0.0001 <0.0001 No No
205428_s_at calbindin 2 CALB2 -0.74 0.6 0.0006 <0.0001 -0.63 0.65 <0.0001 <0.0001 No No
204041_at monoamine oxidase B
MAOB -0.74 0.6 <0.0001 <0.0001 -0.74 0.6 <0.0001 <0.0001 No No
236075_s_at hypothetical LOC100506676
LOC100506676
-0.73 0.6 <0.0001 <0.0001 -0.66 0.63 <0.0001 <0.0001 No No
238423_at synaptotagmin-like 3
SYTL3 -0.73 0.6 0.0049 <0.0001 -0.16 0.89 0.0848 0.058 No No
239093_at dihydrodipicolinate synthase-like, mitochondrial
DHDPSL -0.73 0.6 <0.0001 <0.0001 -0.48 0.72 <0.0001 0.0011 No No
207199_at telomerase reverse transcriptase
TERT -0.72 0.61 <0.0001 <0.0001 -0.86 0.55 <0.0001 <0.0001 No No
210868_s_at
ELOVL family member 6, elongation of long chain fatty acids (FEN1/Elo2, SUR4/Elo3-like, yeast)
ELOVL6 -0.71 0.61 <0.0001 <0.0001 -0.64 0.64 <0.0001 <0.0001 No No
203789_s_at
sema domain, immunoglobulin domain (Ig), short basic domain, secreted, (semaphorin) 3C
SEMA3C -0.71 0.61 0.0049 <0.0001 -1.29 0.41 <0.0001 <0.0001 No No
210592_s_at spermidine/spermine N1-acetyltransferase 1
SAT1 -0.71 0.61 0.0006 <0.0001 -0.68 0.62 <0.0001 <0.0001 No No
227491_at
ELOVL family member 6, elongation of long chain fatty acids (FEN1/Elo2, SUR4/Elo3-like, yeast)
ELOVL6 -0.71 0.61 <0.0001 <0.0001 -0.37 0.78 <0.0001 <0.0001 No No
222719_s_at platelet derived growth factor C
PDGFC -0.71 0.61 <0.0001 <0.0001 -1.1 0.46 <0.0001 <0.0001 No No
219123_at zinc finger protein 232
ZNF232 -0.71 0.61 <0.0001 <0.0001 -0.59 0.67 <0.0001 <0.0001 No No
207358_x_at microtubule-actin crosslinking factor 1
MACF1 -0.71 0.61 <0.0001 <0.0001 -0.67 0.63 <0.0001 <0.0001 No No
208884_s_at
ubiquitin protein ligase E3 component n-recognin 5
UBR5 -0.7 0.61 <0.0001 <0.0001 -0.87 0.55 <0.0001 <0.0001 No No
37
204401_at
potassium intermediate/small conductance calcium-activated channel, subfamily N, member 4
KCNN4 -0.7 0.61 <0.0001 <0.0001 -1.03 0.49 <0.0001 <0.0001 Yes No
201691_s_at tumor protein D52 TPD52 -0.7 0.62 0.0006 <0.0001 -0.43 0.74 <0.0001 0.0011 No No
219312_s_at zinc finger and BTB domain containing 10
ZBTB10 -0.7 0.62 <0.0001 0.0017 -0.85 0.55 <0.0001 <0.0001 No No
203998_s_at synaptotagmin I SYT1 -0.7 0.62 0.0006 <0.0001 -1.29 0.41 <0.0001 <0.0001 No No
217299_s_at nibrin NBN -0.7 0.62 <0.0001 <0.0001 -0.52 0.7 <0.0001 <0.0001 No No
209365_s_at extracellular matrix protein 1
ECM1 -0.7 0.62 <0.0001 <0.0001 -0.38 0.77 <0.0001 <0.0001 No No
239288_at TRAF2 and NCK interacting kinase
TNIK -0.69 0.62 <0.0001 <0.0001 -1.57 0.34 <0.0001 <0.0001 No No
243818_at surfactant associated 1 (pseudogene)
SFTA1P -0.69 0.62 <0.0001 <0.0001 -2.55 0.17 <0.0001 <0.0001 No No
213107_at TRAF2 and NCK interacting kinase
TNIK -0.68 0.62 <0.0001 <0.0001 -1.18 0.44 <0.0001 <0.0001 No No
211828_s_at TRAF2 and NCK interacting kinase
TNIK -0.68 0.62 0.0006 <0.0001 -1.31 0.4 <0.0001 <0.0001 No No
223256_at
G2/M-phase specific E3 ubiquitin protein ligase
G2E3 -0.68 0.62 <0.0001 <0.0001 -0.61 0.65 <0.0001 <0.0001 No No
204068_at serine/threonine kinase 3
STK3 -0.68 0.63 <0.0001 <0.0001 -0.27 0.83 0.016 0.0091 No No
211538_s_at heat shock 70kDa protein 2
HSPA2 -0.68 0.63 0.0006 <0.0001 -0.63 0.64 <0.0001 <0.0001 No No
204226_at
staufen, RNA binding protein, homolog 2 (Drosophila)
STAU2 -0.67 0.63 <0.0001 <0.0001 -0.32 0.8 0.0031 0.0021 No No
208995_s_at peptidylprolyl isomerase G (cyclophilin G)
PPIG -0.67 0.63 0.0006 <0.0001 -0.59 0.67 <0.0001 <0.0001 No No
209270_at laminin, beta 3 LAMB3 -0.67 0.63 0.0006 <0.0001 -0.64 0.64 <0.0001 <0.0001 Yes No
238229_at transmembrane protein 67
TMEM67 -0.67 0.63 <0.0001 <0.0001 -0.52 0.7 <0.0001 <0.0001 No No
225342_at adenylate kinase 4 AK4 -0.66 0.63 <0.0001 <0.0001 -0.43 0.74 <0.0001 0.0011 No No
202551_s_at
cysteine rich transmembrane BMP regulator 1 (chordin-like)
CRIM1 -0.66 0.63 <0.0001 <0.0001 -0.52 0.7 <0.0001 <0.0001 No No
203790_s_at heat-responsive protein 12
HRSP12 -0.66 0.63 <0.0001 <0.0001 -0.59 0.66 <0.0001 <0.0001 No No
209481_at SNF related kinase SNRK -0.65 0.64 <0.0001 <0.0001 -0.71 0.61 <0.0001 <0.0001 No No
226124_at zinc finger protein 90 homolog (mouse)
ZFP90 -0.65 0.64 0.0006 <0.0001 -0.94 0.52 <0.0001 <0.0001 No No
237034_at --- --- -0.65 0.64 <0.0001 <0.0001 -1.17 0.44 <0.0001 <0.0001 No No
210136_at myelin basic protein
MBP -0.65 0.64 0.0006 <0.0001 -0.91 0.53 <0.0001 <0.0001 No No
207768_at early growth response 4
EGR4 -0.65 0.64 0.0009 0.0005 -1 0.5 <0.0001 <0.0001 No No
1560587_s_at
peroxiredoxin 5 PRDX5 -0.65 0.64 <0.0001 <0.0001 -0.64 0.64 <0.0001 <0.0001 No No
212638_s_at
WW domain containing E3 ubiquitin protein ligase 1
WWP1 -0.65 0.64 0.0006 <0.0001 -0.49 0.71 <0.0001 <0.0001 No No
38
203449_s_at
telomeric repeat binding factor (NIMA-interacting) 1
TERF1 -0.65 0.64 <0.0001 <0.0001 -0.37 0.78 0.0031 0.0039 No No
213109_at TRAF2 and NCK interacting kinase
TNIK -0.65 0.64 <0.0001 <0.0001 -1.35 0.39 <0.0001 <0.0001 No No
205730_s_at actin binding LIM protein family, member 3
ABLIM3 -0.65 0.64 <0.0001 <0.0001 -1.21 0.43 <0.0001 <0.0001 No No
213603_s_at
ras-related C3 botulinum toxin substrate 2 (rho family, small GTP binding protein Rac2)
RAC2 -0.64 0.64 <0.0001 <0.0001 -0.58 0.67 <0.0001 <0.0001 No No
212364_at myosin IB MYO1B -0.64 0.64 0.0006 <0.0001 -0.5 0.71 <0.0001 0.0011 No No
206027_at S100 calcium binding protein A3
S100A3 -0.64 0.64 0.0016 0.0017 -0.86 0.55 <0.0001 <0.0001 No No
221043_at --- --- -0.64 0.64 <0.0001 <0.0001 -0.41 0.75 0.0031 <0.0001 No No
226481_at Vpr (HIV-1) binding protein
VPRBP -0.64 0.64 <0.0001 <0.0001 -0.64 0.64 <0.0001 <0.0001 No No
219363_s_at MTERF domain containing 1
MTERFD1 -0.64 0.64 <0.0001 <0.0001 -0.55 0.68 <0.0001 <0.0001 No No
208634_s_at microtubule-actin crosslinking factor 1
MACF1 -0.64 0.64 <0.0001 <0.0001 -0.74 0.6 <0.0001 <0.0001 No No
226463_at
ATPase, H+ transporting, lysosomal 42kDa, V1 subunit C1
ATP6V1C1 -0.63 0.65 <0.0001 <0.0001 -0.34 0.79 0.0031 0.0011 No No
203695_s_at deafness, autosomal dominant 5
DFNA5 -0.63 0.65 <0.0001 <0.0001 -0.76 0.59 <0.0001 <0.0001 No No
225846_at epithelial splicing regulatory protein 1
ESRP1 -0.63 0.65 0.011 <0.0001 -1.86 0.28 <0.0001 <0.0001 No No
218273_s_at
pyruvate dehyrogenase phosphatase catalytic subunit 1
PDP1 -0.63 0.65 <0.0001 <0.0001 -0.49 0.71 <0.0001 <0.0001 No No
202294_at stromal antigen 1 STAG1 -0.62 0.65 <0.0001 <0.0001 -0.64 0.64 <0.0001 <0.0001 No No
223255_at
G2/M-phase specific E3 ubiquitin protein ligase
G2E3 -0.62 0.65 <0.0001 <0.0001 -0.55 0.68 <0.0001 <0.0001 No No
210273_at protocadherin 7 PCDH7 -0.62 0.65 0.0016 <0.0001 -0.51 0.7 <0.0001 0.0011 No No
205527_s_at
gem (nuclear organelle) associated protein 4
GEMIN4 -0.62 0.65 <0.0001 <0.0001 -0.55 0.69 <0.0001 <0.0001 No No
219188_s_at MACRO domain containing 1
MACROD1 -0.61 0.65 0.0006 0.0005 -0.29 0.82 0.0069 0.0091 No No
223599_at tripartite motif-containing 6
TRIM6 -0.61 0.65 <0.0001 0.0017 -1.22 0.43 <0.0001 <0.0001 No No
214771_x_at myosin phosphatase Rho interacting protein
MPRIP -0.61 0.66 0.0006 <0.0001 -0.68 0.63 <0.0001 <0.0001 No No
212731_at ankyrin repeat domain 46
ANKRD46 -0.6 0.66 <0.0001 <0.0001 -0.27 0.83 0.0006 0.0021 No No
227307_at tetraspanin 18 TSPAN18 -0.6 0.66 <0.0001 0.0005 -0.38 0.77 <0.0001 0.0011 Yes No
229843_at --- --- -0.6 0.66 0.0006 <0.0001 -0.54 0.69 <0.0001 <0.0001 No No
226477_at Vpr (HIV-1) binding protein
VPRBP -0.6 0.66 0.0006 <0.0001 -0.62 0.65 <0.0001 <0.0001 No No
39
204256_at
ELOVL family member 6, elongation of long chain fatty acids (FEN1/Elo2, SUR4/Elo3-like, yeast)
ELOVL6 -0.6 0.66 <0.0001 <0.0001 -0.63 0.65 <0.0001 <0.0001 No No
233899_x_at zinc finger and BTB domain containing 10
ZBTB10 -0.6 0.66 0.0016 0.0017 -0.72 0.61 <0.0001 <0.0001 No No
222420_s_at
ubiquitin-conjugating enzyme E2H (UBC8 homolog, yeast)
UBE2H -0.6 0.66 <0.0001 <0.0001 -0.59 0.67 <0.0001 <0.0001 Yes No
225603_s_at chromosome 8 open reading frame 83
C8orf83 -0.6 0.66 <0.0001 <0.0001 -0.5 0.71 <0.0001 <0.0001 No No
218521_s_at
ubiquitin-conjugating enzyme E2W (putative)
UBE2W -0.6 0.66 <0.0001 <0.0001 -0.36 0.78 <0.0001 0.0011 No No
227856_at chromosome 4 open reading frame 32
C4orf32 -0.59 0.66 <0.0001 <0.0001 -1.28 0.41 <0.0001 <0.0001 No No
229103_at
wingless-type MMTV integration site family, member 3
WNT3 -0.59 0.66 <0.0001 <0.0001 -0.38 0.77 <0.0001 0.0021 No No
229029_at calcium/calmodulin-dependent protein kinase IV
CAMK4 -0.59 0.66 <0.0001 <0.0001 -0.42 0.75 0.0006 0.0021 No No
209505_at nuclear receptor subfamily 2, group F, member 1
NR2F1 -0.59 0.67 <0.0001 0.053 -0.76 0.59 <0.0001 <0.0001 No No
217914_at two pore segment channel 1
TPCN1 -0.59 0.67 <0.0001 <0.0001 -0.35 0.79 <0.0001 <0.0001 Yes No
208697_s_at
eukaryotic translation initiation factor 3, subunit E
EIF3E -0.58 0.67 <0.0001 <0.0001 -0.5 0.71 <0.0001 <0.0001 No No
222496_s_at RNA binding motif protein 47
RBM47 -0.58 0.67 0.0006 0.0005 -1.02 0.49 <0.0001 <0.0001 No No
201533_at
catenin (cadherin-associated protein), beta 1, 88kDa
CTNNB1 -0.58 0.67 <0.0001 <0.0001 -0.32 0.8 0.0069 0.0224 No No
203568_s_at tripartite motif-containing 38
TRIM38 -0.58 0.67 <0.0001 <0.0001 -0.46 0.73 0.0031 0.0011 No No
200918_s_at signal recognition particle receptor (docking protein)
SRPR -0.58 0.67 <0.0001 <0.0001 -0.61 0.66 <0.0001 <0.0001 No No
235780_at protein kinase, cAMP-dependent, catalytic, beta
PRKACB -0.58 0.67 0.0006 <0.0001 -0.3 0.81 0.0372 0.058 No No
215299_x_at
sulfotransferase family, cytosolic, 1A, phenol-preferring, member 1
SULT1A1 -0.57 0.67 <0.0001 <0.0001 -0.42 0.75 <0.0001 <0.0001 No No
232546_at tumor protein p73 TP73 -0.57 0.67 0.0009 0.0005 -0.39 0.76 0.0006 0.0011 No No
40
208309_s_at
mucosa associated lymphoid tissue lymphoma translocation gene 1
MALT1 -0.57 0.67 <0.0001 0.0005 -0.77 0.59 <0.0001 <0.0001 No No
227802_at RUN and FYVE domain containing 3
RUFY3 -0.57 0.67 0.0049 0.0059 -0.56 0.68 <0.0001 <0.0001 No No
208994_s_at peptidylprolyl isomerase G (cyclophilin G)
PPIG -0.57 0.67 0.0006 <0.0001 -0.69 0.62 <0.0001 <0.0001 No No
202905_x_at nibrin NBN -0.57 0.67 <0.0001 <0.0001 -0.51 0.7 <0.0001 0.0011 No No
221636_s_at MOCO sulphurase C-terminal domain containing 2
MOSC2 -0.56 0.68 <0.0001 <0.0001 -0.59 0.67 <0.0001 <0.0001 No No
213044_at
Rho-associated, coiled-coil containing protein kinase 1
ROCK1 -0.56 0.68 <0.0001 <0.0001 -0.56 0.68 <0.0001 <0.0001 No No
219038_at MORC family CW-type zinc finger 4
MORC4 -0.56 0.68 <0.0001 <0.0001 -0.59 0.67 <0.0001 <0.0001 No No
221020_s_at solute carrier family 25, member 32
SLC25A32 -0.56 0.68 <0.0001 <0.0001 -0.48 0.72 <0.0001 <0.0001 No No
210018_x_at
mucosa associated lymphoid tissue lymphoma translocation gene 1
MALT1 -0.56 0.68 <0.0001 0.0005 -0.71 0.61 <0.0001 <0.0001 No No
229014_at hypothetical LOC441094
FLJ42709 -0.56 0.68 0.0006 <0.0001 -0.88 0.55 <0.0001 <0.0001 No No
215222_x_at microtubule-actin crosslinking factor 1
MACF1 -0.56 0.68 0.0006 <0.0001 -0.79 0.58 <0.0001 <0.0001 No No
235692_at SH3-domain kinase binding protein 1
SH3KBP1 -0.56 0.68 <0.0001 0.0005 -0.55 0.68 <0.0001 <0.0001 No No
218035_s_at RNA binding motif protein 47
RBM47 -0.55 0.68 <0.0001 <0.0001 -0.89 0.54 <0.0001 <0.0001 No No
239814_at hypothetical LOC100506860
LOC100506860
-0.55 0.68 0.0049 <0.0001 -0.61 0.66 <0.0001 <0.0001 No No
231697_s_at --- --- -0.55 0.68 0.0049 <0.0001 -0.67 0.63 <0.0001 <0.0001 No No
203584_at tetratricopeptide repeat domain 35
TTC35 -0.55 0.68 0.0009 0.0005 -0.45 0.73 <0.0001 <0.0001 No No
230047_at Rho GTPase activating protein 42
ARHGAP42 -0.55 0.68 0.0009 <0.0001 -0.89 0.54 <0.0001 <0.0001 No No
235696_at --- --- -0.55 0.68 <0.0001 <0.0001 -0.52 0.7 <0.0001 <0.0001 No No
208763_s_at TSC22 domain family, member 3
TSC22D3 -0.55 0.68 <0.0001 <0.0001 -0.22 0.86 0.1715 0.058 No No
243000_at cyclin-dependent kinase 6
CDK6 -0.55 0.69 <0.0001 <0.0001 -0.41 0.76 <0.0001 <0.0001 No No
224937_at prostaglandin F2 receptor negative regulator
PTGFRN -0.55 0.69 <0.0001 <0.0001 -0.23 0.85 0.0069 0.0224 No No
223258_s_at
G2/M-phase specific E3 ubiquitin protein ligase
G2E3 -0.54 0.69 <0.0001 <0.0001 -0.57 0.68 <0.0001 <0.0001 No No
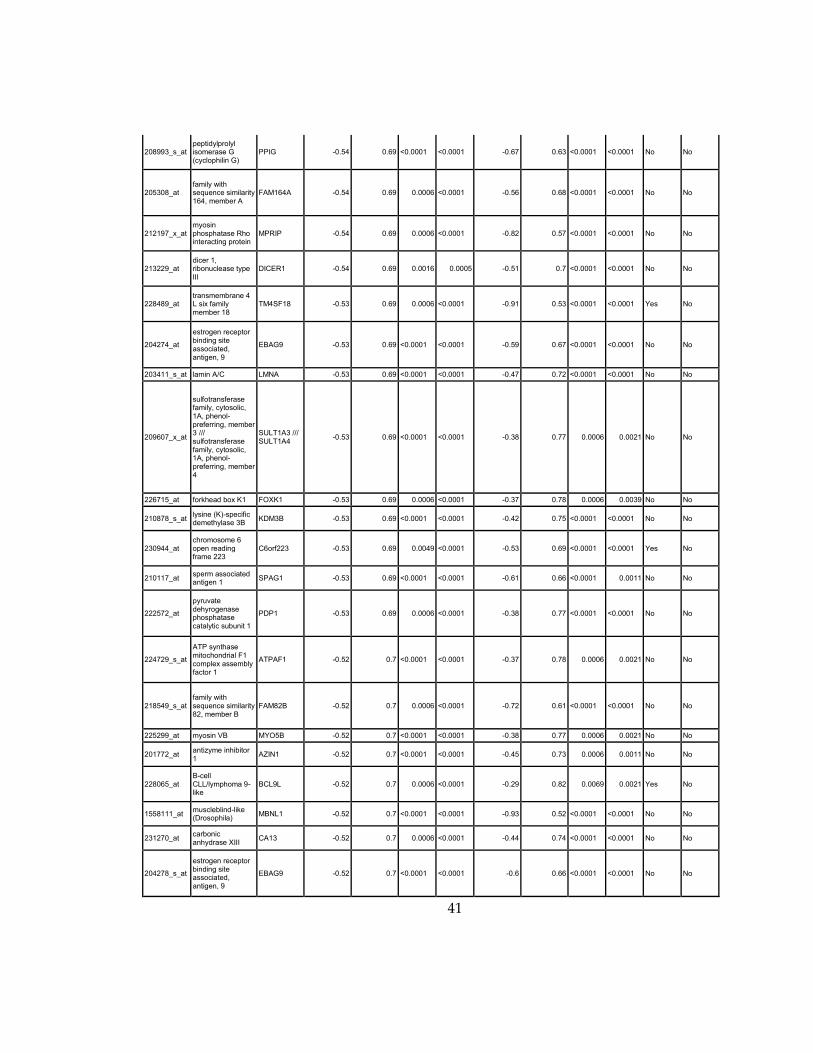
41
208993_s_at peptidylprolyl isomerase G (cyclophilin G)
PPIG -0.54 0.69 <0.0001 <0.0001 -0.67 0.63 <0.0001 <0.0001 No No
205308_at family with sequence similarity 164, member A
FAM164A -0.54 0.69 0.0006 <0.0001 -0.56 0.68 <0.0001 <0.0001 No No
212197_x_at myosin phosphatase Rho interacting protein
MPRIP -0.54 0.69 0.0006 <0.0001 -0.82 0.57 <0.0001 <0.0001 No No
213229_at dicer 1, ribonuclease type III
DICER1 -0.54 0.69 0.0016 0.0005 -0.51 0.7 <0.0001 <0.0001 No No
228489_at transmembrane 4 L six family member 18
TM4SF18 -0.53 0.69 0.0006 <0.0001 -0.91 0.53 <0.0001 <0.0001 Yes No
204274_at
estrogen receptor binding site associated, antigen, 9
EBAG9 -0.53 0.69 <0.0001 <0.0001 -0.59 0.67 <0.0001 <0.0001 No No
203411_s_at lamin A/C LMNA -0.53 0.69 <0.0001 <0.0001 -0.47 0.72 <0.0001 <0.0001 No No
209607_x_at
sulfotransferase family, cytosolic, 1A, phenol-preferring, member 3 /// sulfotransferase family, cytosolic, 1A, phenol-preferring, member 4
SULT1A3 /// SULT1A4
-0.53 0.69 <0.0001 <0.0001 -0.38 0.77 0.0006 0.0021 No No
226715_at forkhead box K1 FOXK1 -0.53 0.69 0.0006 <0.0001 -0.37 0.78 0.0006 0.0039 No No
210878_s_at lysine (K)-specific demethylase 3B
KDM3B -0.53 0.69 <0.0001 <0.0001 -0.42 0.75 <0.0001 <0.0001 No No
230944_at chromosome 6 open reading frame 223
C6orf223 -0.53 0.69 0.0049 <0.0001 -0.53 0.69 <0.0001 <0.0001 Yes No
210117_at sperm associated antigen 1
SPAG1 -0.53 0.69 <0.0001 <0.0001 -0.61 0.66 <0.0001 0.0011 No No
222572_at
pyruvate dehyrogenase phosphatase catalytic subunit 1
PDP1 -0.53 0.69 0.0006 <0.0001 -0.38 0.77 <0.0001 <0.0001 No No
224729_s_at
ATP synthase mitochondrial F1 complex assembly factor 1
ATPAF1 -0.52 0.7 <0.0001 <0.0001 -0.37 0.78 0.0006 0.0021 No No
218549_s_at family with sequence similarity 82, member B
FAM82B -0.52 0.7 0.0006 <0.0001 -0.72 0.61 <0.0001 <0.0001 No No
225299_at myosin VB MYO5B -0.52 0.7 <0.0001 <0.0001 -0.38 0.77 0.0006 0.0021 No No
201772_at antizyme inhibitor 1
AZIN1 -0.52 0.7 <0.0001 <0.0001 -0.45 0.73 0.0006 0.0011 No No
228065_at B-cell CLL/lymphoma 9-like
BCL9L -0.52 0.7 0.0006 <0.0001 -0.29 0.82 0.0069 0.0021 Yes No
1558111_at muscleblind-like (Drosophila)
MBNL1 -0.52 0.7 <0.0001 <0.0001 -0.93 0.52 <0.0001 <0.0001 No No
231270_at carbonic anhydrase XIII
CA13 -0.52 0.7 0.0006 <0.0001 -0.44 0.74 <0.0001 <0.0001 No No
204278_s_at
estrogen receptor binding site associated, antigen, 9
EBAG9 -0.52 0.7 <0.0001 <0.0001 -0.6 0.66 <0.0001 <0.0001 No No
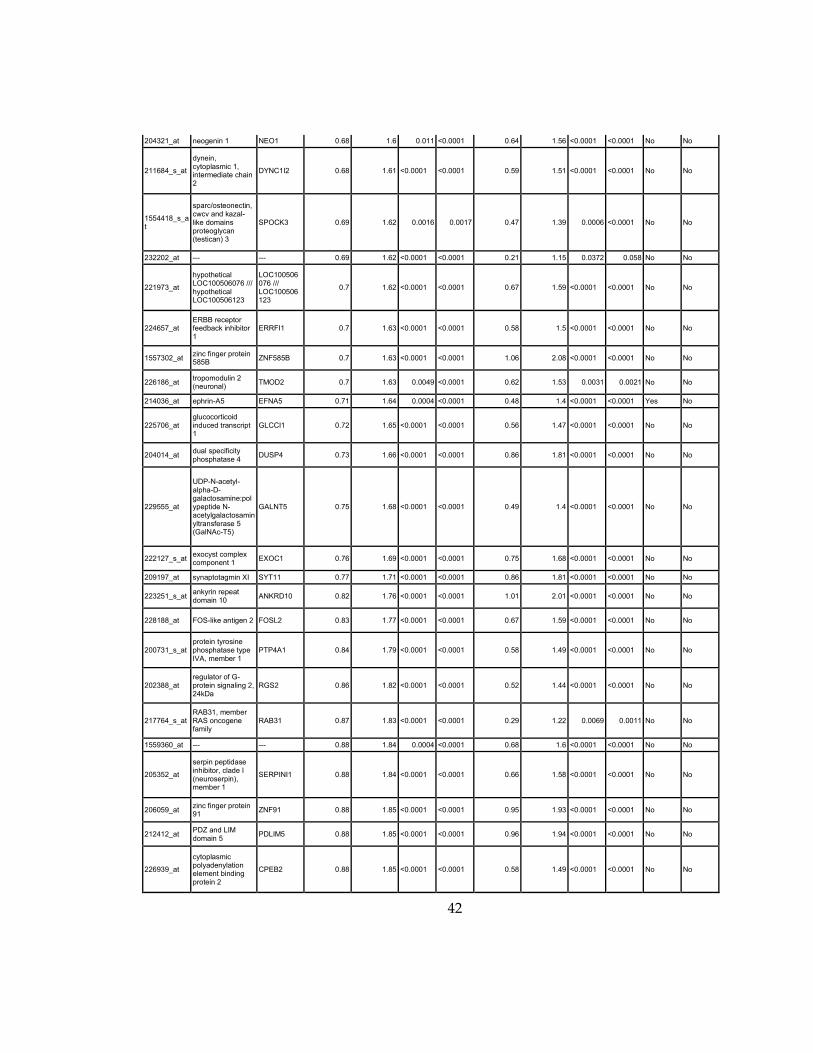
42
204321_at neogenin 1 NEO1 0.68 1.6 0.011 <0.0001 0.64 1.56 <0.0001 <0.0001 No No
211684_s_at
dynein, cytoplasmic 1, intermediate chain 2
DYNC1I2 0.68 1.61 <0.0001 <0.0001 0.59 1.51 <0.0001 <0.0001 No No
1554418_s_at
sparc/osteonectin, cwcv and kazal-like domains proteoglycan (testican) 3
SPOCK3 0.69 1.62 0.0016 0.0017 0.47 1.39 0.0006 <0.0001 No No
232202_at --- --- 0.69 1.62 <0.0001 <0.0001 0.21 1.15 0.0372 0.058 No No
221973_at
hypothetical LOC100506076 /// hypothetical LOC100506123
LOC100506076 /// LOC100506123
0.7 1.62 <0.0001 <0.0001 0.67 1.59 <0.0001 <0.0001 No No
224657_at ERBB receptor feedback inhibitor 1
ERRFI1 0.7 1.63 <0.0001 <0.0001 0.58 1.5 <0.0001 <0.0001 No No
1557302_at zinc finger protein 585B
ZNF585B 0.7 1.63 <0.0001 <0.0001 1.06 2.08 <0.0001 <0.0001 No No
226186_at tropomodulin 2 (neuronal)
TMOD2 0.7 1.63 0.0049 <0.0001 0.62 1.53 0.0031 0.0021 No No
214036_at ephrin-A5 EFNA5 0.71 1.64 0.0004 <0.0001 0.48 1.4 <0.0001 <0.0001 Yes No
225706_at glucocorticoid induced transcript 1
GLCCI1 0.72 1.65 <0.0001 <0.0001 0.56 1.47 <0.0001 <0.0001 No No
204014_at dual specificity phosphatase 4
DUSP4 0.73 1.66 <0.0001 <0.0001 0.86 1.81 <0.0001 <0.0001 No No
229555_at
UDP-N-acetyl-alpha-D-galactosamine:polypeptide N-acetylgalactosaminyltransferase 5 (GalNAc-T5)
GALNT5 0.75 1.68 <0.0001 <0.0001 0.49 1.4 <0.0001 <0.0001 No No
222127_s_at exocyst complex component 1
EXOC1 0.76 1.69 <0.0001 <0.0001 0.75 1.68 <0.0001 <0.0001 No No
209197_at synaptotagmin XI SYT11 0.77 1.71 <0.0001 <0.0001 0.86 1.81 <0.0001 <0.0001 No No
223251_s_at ankyrin repeat domain 10
ANKRD10 0.82 1.76 <0.0001 <0.0001 1.01 2.01 <0.0001 <0.0001 No No
228188_at FOS-like antigen 2 FOSL2 0.83 1.77 <0.0001 <0.0001 0.67 1.59 <0.0001 <0.0001 No No
200731_s_at protein tyrosine phosphatase type IVA, member 1
PTP4A1 0.84 1.79 <0.0001 <0.0001 0.58 1.49 <0.0001 <0.0001 No No
202388_at regulator of G-protein signaling 2, 24kDa
RGS2 0.86 1.82 <0.0001 <0.0001 0.52 1.44 <0.0001 <0.0001 No No
217764_s_at RAB31, member RAS oncogene family
RAB31 0.87 1.83 <0.0001 <0.0001 0.29 1.22 0.0069 0.0011 No No
1559360_at --- --- 0.88 1.84 0.0004 <0.0001 0.68 1.6 <0.0001 <0.0001 No No
205352_at
serpin peptidase inhibitor, clade I (neuroserpin), member 1
SERPINI1 0.88 1.84 <0.0001 <0.0001 0.66 1.58 <0.0001 <0.0001 No No
206059_at zinc finger protein 91
ZNF91 0.88 1.85 <0.0001 <0.0001 0.95 1.93 <0.0001 <0.0001 No No
212412_at PDZ and LIM domain 5
PDLIM5 0.88 1.85 <0.0001 <0.0001 0.96 1.94 <0.0001 <0.0001 No No
226939_at
cytoplasmic polyadenylation element binding protein 2
CPEB2 0.88 1.85 <0.0001 <0.0001 0.58 1.49 <0.0001 <0.0001 No No
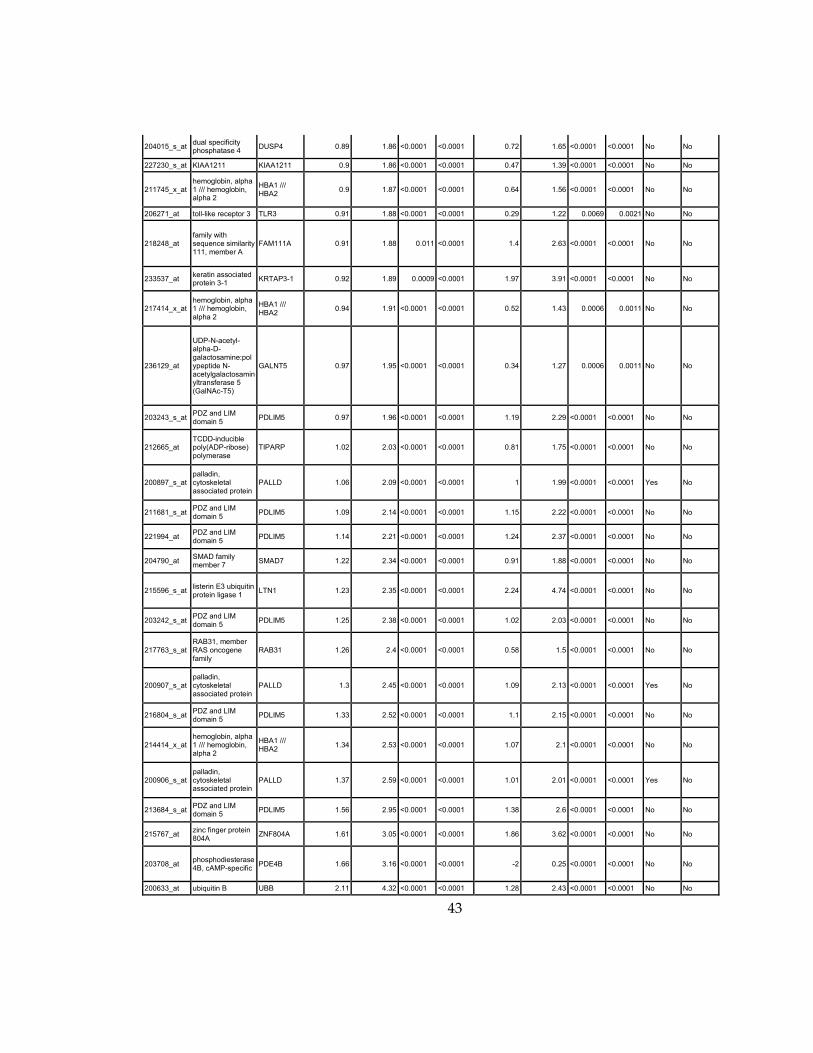
43
204015_s_at dual specificity phosphatase 4
DUSP4 0.89 1.86 <0.0001 <0.0001 0.72 1.65 <0.0001 <0.0001 No No
227230_s_at KIAA1211 KIAA1211 0.9 1.86 <0.0001 <0.0001 0.47 1.39 <0.0001 <0.0001 No No
211745_x_at hemoglobin, alpha 1 /// hemoglobin, alpha 2
HBA1 /// HBA2
0.9 1.87 <0.0001 <0.0001 0.64 1.56 <0.0001 <0.0001 No No
206271_at toll-like receptor 3 TLR3 0.91 1.88 <0.0001 <0.0001 0.29 1.22 0.0069 0.0021 No No
218248_at family with sequence similarity 111, member A
FAM111A 0.91 1.88 0.011 <0.0001 1.4 2.63 <0.0001 <0.0001 No No
233537_at keratin associated protein 3-1
KRTAP3-1 0.92 1.89 0.0009 <0.0001 1.97 3.91 <0.0001 <0.0001 No No
217414_x_at hemoglobin, alpha 1 /// hemoglobin, alpha 2
HBA1 /// HBA2
0.94 1.91 <0.0001 <0.0001 0.52 1.43 0.0006 0.0011 No No
236129_at
UDP-N-acetyl-alpha-D-galactosamine:polypeptide N-acetylgalactosaminyltransferase 5 (GalNAc-T5)
GALNT5 0.97 1.95 <0.0001 <0.0001 0.34 1.27 0.0006 0.0011 No No
203243_s_at PDZ and LIM domain 5
PDLIM5 0.97 1.96 <0.0001 <0.0001 1.19 2.29 <0.0001 <0.0001 No No
212665_at TCDD-inducible poly(ADP-ribose) polymerase
TIPARP 1.02 2.03 <0.0001 <0.0001 0.81 1.75 <0.0001 <0.0001 No No
200897_s_at palladin, cytoskeletal associated protein
PALLD 1.06 2.09 <0.0001 <0.0001 1 1.99 <0.0001 <0.0001 Yes No
211681_s_at PDZ and LIM domain 5
PDLIM5 1.09 2.14 <0.0001 <0.0001 1.15 2.22 <0.0001 <0.0001 No No
221994_at PDZ and LIM domain 5
PDLIM5 1.14 2.21 <0.0001 <0.0001 1.24 2.37 <0.0001 <0.0001 No No
204790_at SMAD family member 7
SMAD7 1.22 2.34 <0.0001 <0.0001 0.91 1.88 <0.0001 <0.0001 No No
215596_s_at listerin E3 ubiquitin protein ligase 1
LTN1 1.23 2.35 <0.0001 <0.0001 2.24 4.74 <0.0001 <0.0001 No No
203242_s_at PDZ and LIM domain 5
PDLIM5 1.25 2.38 <0.0001 <0.0001 1.02 2.03 <0.0001 <0.0001 No No
217763_s_at RAB31, member RAS oncogene family
RAB31 1.26 2.4 <0.0001 <0.0001 0.58 1.5 <0.0001 <0.0001 No No
200907_s_at palladin, cytoskeletal associated protein
PALLD 1.3 2.45 <0.0001 <0.0001 1.09 2.13 <0.0001 <0.0001 Yes No
216804_s_at PDZ and LIM domain 5
PDLIM5 1.33 2.52 <0.0001 <0.0001 1.1 2.15 <0.0001 <0.0001 No No
214414_x_at hemoglobin, alpha 1 /// hemoglobin, alpha 2
HBA1 /// HBA2
1.34 2.53 <0.0001 <0.0001 1.07 2.1 <0.0001 <0.0001 No No
200906_s_at palladin, cytoskeletal associated protein
PALLD 1.37 2.59 <0.0001 <0.0001 1.01 2.01 <0.0001 <0.0001 Yes No
213684_s_at PDZ and LIM domain 5
PDLIM5 1.56 2.95 <0.0001 <0.0001 1.38 2.6 <0.0001 <0.0001 No No
215767_at zinc finger protein 804A
ZNF804A 1.61 3.05 <0.0001 <0.0001 1.86 3.62 <0.0001 <0.0001 No No
203708_at phosphodiesterase 4B, cAMP-specific
PDE4B 1.66 3.16 <0.0001 <0.0001 -2 0.25 <0.0001 <0.0001 No No
200633_at ubiquitin B UBB 2.11 4.32 <0.0001 <0.0001 1.28 2.43 <0.0001 <0.0001 No No

44
204035_at secretogranin II SCG2 2.16 4.46 <0.0001 <0.0001 2.38 5.2 <0.0001 <0.0001 No No
206172_at interleukin 13 receptor, alpha 2
IL13RA2 2.9 7.46 <0.0001 <0.0001 0.71 1.64 <0.0001 <0.0001 No No
aResults from triplicates for each sample (two separate experiments: parental versus MLL2-/- #1
and #2; parental versus MLL2-/- #3 and #4). bFalse discovery rate was calculated using
Significance Analysis of Microarrays (SAM). cIdentified by ChIP (citation).
dProbes that
displayed a down-regulation of 50% or more in the first experiment and were confirmed to be
significantly down-regulated in the second experiment were used for IPA.
45
References
1. Ruthenburg, A.J., C.D. Allis, and J. Wysocka, Methylation of lysine 4 on histone H3:
intricacy of writing and reading a single epigenetic mark. Mol Cell, 2007. 25(1): p. 15-
30.
2. Dou, Y., et al., Regulation of MLL1 H3K4 methyltransferase activity by its core
components. Nat Struct Mol Biol, 2006. 13(8): p. 713-9.
3. Muntean, A.G. and J.L. Hess, The pathogenesis of mixed-lineage leukemia. Annu Rev
Pathol, 2012. 7: p. 283-301.
4. Natarajan, T.G., et al., Epigenetic regulator MLL2 shows altered expression in cancer
cell lines and tumors from human breast and colon. Cancer Cell Int, 2010. 10: p. 13.
5. Prasad, R., et al., Structure and expression pattern of human ALR, a novel gene with
strong homology to ALL-1 involved in acute leukemia and to Drosophila trithorax.
Oncogene, 1997. 15(5): p. 549-60.
6. Cho, Y.W., et al., PTIP associates with MLL3- and MLL4-containing histone H3 lysine
4 methyltransferase complex. J Biol Chem, 2007. 282(28): p. 20395-406.
7. Issaeva, I., et al., Knockdown of ALR (MLL2) reveals ALR target genes and leads to
alterations in cell adhesion and growth. Mol Cell Biol, 2007. 27(5): p. 1889-903.
8. Goo, Y.H., et al., Activating signal cointegrator 2 belongs to a novel steady-state
complex that contains a subset of trithorax group proteins. Mol Cell Biol, 2003. 23(1): p.
140-9.
9. Lee, S., et al., Crucial roles for interactions between MLL3/4 and INI1 in nuclear
receptor transactivation. Mol Endocrinol, 2009. 23(5): p. 610-9.
10. Ansari, K.I., et al., HOXC6 Is transcriptionally regulated via coordination of MLL
histone methylase and estrogen receptor in an estrogen environment. J Mol Biol, 2011.
411(2): p. 334-49.
46
11. Lee, J., et al., Targeted inactivation of MLL3 histone H3-Lys-4 methyltransferase
activity in the mouse reveals vital roles for MLL3 in adipogenesis. Proc Natl Acad Sci
U S A, 2008. 105(49): p. 19229-34.
12. Cho, Y.W., et al., Histone methylation regulator PTIP is required for PPARgamma and
C/EBPalpha expression and adipogenesis. Cell Metab, 2009. 10(1): p. 27-39.
13. Parsons, D.W., et al., The genetic landscape of the childhood cancer medulloblastoma.
Science, 2011. 331(6016): p. 435-9.
14. Jones, D.T., et al., Dissecting the genomic complexity underlying medulloblastoma.
Nature, 2012. 488(7409): p. 100-5.
15. Pugh, T.J., et al., Medulloblastoma exome sequencing uncovers subtype-specific somatic
mutations. Nature, 2012. 488(7409): p. 106-10.
16. Robinson, G., et al., Novel mutations target distinct subgroups of medulloblastoma.
Nature, 2012. 488(7409): p. 43-8.
17. Morin, R.D., et al., Frequent mutation of histone-modifying genes in non-Hodgkin
lymphoma. Nature, 2011. 476(7360): p. 298-303.
18. Pasqualucci, L., et al., Analysis of the coding genome of diffuse large B-cell lymphoma.
Nat Genet, 2011. 43(9): p. 830-7.
19. Watanabe, Y., et al., Frequent alteration of MLL3 frameshift mutations in microsatellite
deficient colorectal cancer. PLoS One, 2011. 6(8): p. e23320.
20. Sjoblom, T., et al., The consensus coding sequences of human breast and colorectal
cancers. Science, 2006. 314(5797): p. 268-74.
21. Dalgliesh, G.L., et al., Systematic sequencing of renal carcinoma reveals inactivation of
histone modifying genes. Nature, 2010. 463(7279): p. 360-3.
22. Grasso, C.S., et al., The mutational landscape of lethal castration-resistant prostate
cancer. Nature, 2012. 487(7406): p. 239-43.
23. Gui, Y., et al., Frequent mutations of chromatin remodeling genes in transitional cell
carcinoma of the bladder. Nat Genet, 2011. 43(9): p. 875-8.
47
24. Zang, Z.J., et al., Exome sequencing of gastric adenocarcinoma identifies recurrent
somatic mutations in cell adhesion and chromatin remodeling genes. Nat Genet, 2012.
44(5): p. 570-4.
25. Fujimoto, A., et al., Whole-genome sequencing of liver cancers identifies etiological
influences on mutation patterns and recurrent mutations in chromatin regulators. Nat
Genet, 2012. 44(7): p. 760-4.
26. Biankin, A.V., et al., Pancreatic cancer genomes reveal aberrations in axon guidance
pathway genes. Nature, 2012.
27. Hammerman, P.S., et al., Comprehensive genomic characterization of squamous cell
lung cancers. Nature, 2012. 489(7417): p. 519-25.
28. Liu, P., et al., Identification of somatic mutations in non-small cell lung carcinomas
using whole-exome sequencing. Carcinogenesis, 2012. 33(7): p. 1270-6.
29. van Haaften, G., et al., Somatic mutations of the histone H3K27 demethylase gene
UTX in human cancer. Nat Genet, 2009. 41(5): p. 521-3.
30. Ng, S.B., et al., Exome sequencing identifies MLL2 mutations as a cause of Kabuki
syndrome. Nat Genet, 2010. 42(9): p. 790-3.
31. Guo, C., et al., Global identification of MLL2-targeted loci reveals MLL2's role in
diverse signaling pathways. Proc Natl Acad Sci U S A, 2012. 109(43): p. 17603-8.
32. Khan, I.F., R.K. Hirata, and D.W. Russell, AAV-mediated gene targeting methods for
human cells. Nat Protoc, 2011. 6(4): p. 482-501.
33. Zhang, X., et al., Epitope tagging of endogenous proteins for genome-wide ChIP-chip
studies. Nat Methods, 2008. 5(2): p. 163-5.
34. Rago, C., B. Vogelstein, and F. Bunz, Genetic knockouts and knockins in human
somatic cells. Nat Protoc, 2007. 2(11): p. 2734-46.
35. Wang, Z., Epitope tagging of endogenous proteins for genome-wide chromatin
immunoprecipitation analysis. Methods Mol Biol, 2009. 567: p. 87-98.
36. Tusher, V.G., R. Tibshirani, and G. Chu, Significance analysis of microarrays applied
to the ionizing radiation response. Proc Natl Acad Sci U S A, 2001. 98(9): p. 5116-21.

48
37. Lubitz, S., et al., Increased apoptosis and skewed differentiation in mouse embryonic
stem cells lacking the histone methyltransferase Mll2. Mol Biol Cell, 2007. 18(6): p.
2356-66.
38. Wang, P., et al., Global analysis of H3K4 methylation defines MLL family member
targets and points to a role for MLL1-mediated H3K4 methylation in the regulation of
transcriptional initiation by RNA polymerase II. Mol Cell Biol, 2009. 29(22): p. 6074-
85.
39. Ananthanarayanan, M., et al., Histone H3K4 trimethylation by MLL3 as part of
ASCOM complex is critical for NR activation of bile acid transporter genes and is
downregulated in cholestasis. Am J Physiol Gastrointest Liver Physiol, 2011. 300(5):
p. G771-81.
40. Kohroki, J., et al., ATRA-regulated Asb-2 gene induced in differentiation of HL-60
leukemia cells. FEBS Lett, 2001. 505(2): p. 223-8.
41. Guibal, F.C., et al., ASB-2 inhibits growth and promotes commitment in myeloid
leukemia cells. J Biol Chem, 2002. 277(1): p. 218-24.
42. Wolf, S., C. Haase-Kohn, and J. Pietzsch, S100A2 in cancerogenesis: a friend or a foe?
Amino Acids, 2011. 41(4): p. 849-61.
43. Lee, S.W., et al., Down-regulation of a member of the S100 gene family in mammary
carcinoma cells and reexpression by azadeoxycytidine treatment. Proc Natl Acad Sci U
S A, 1992. 89(6): p. 2504-8.
44. Feng, G., et al., Diminished expression of S100A2, a putative tumor suppressor, at early
stage of human lung carcinogenesis. Cancer Res, 2001. 61(21): p. 7999-8004.
45. Mueller, A., et al., The calcium-binding protein S100A2 interacts with p53 and
modulates its transcriptional activity. J Biol Chem, 2005. 280(32): p. 29186-93.