identification of nutrient partitioning genes participating in rice grain filling by singular value...
TRANSCRIPT

BioMed CentralBMC Genomics
ss
Open AcceResearch articleIdentification of nutrient partitioning genes participating in rice grain filling by singular value decomposition (SVD) of genome expression dataAbraham Anderson1,2, Matthew Hudson1,2, Wenqiong Chen1,2 and Tong Zhu*1,3Address: 1Torrey Mesa Research Institute, Syngenta Research and Technology, 3115 Merryfield Row, San Diego, CA 92121, USA, 2Current Address: Diversa Corporation, 4955 Directors Place, San Diego, CA 92121, USA and 3Current Address: Syngenta Biotechnology Inc., 3054 Cornwallis Road, Research Triangle Park, NC 27709, USA
Email: Abraham Anderson - [email protected]; Matthew Hudson - [email protected]; Wenqiong Chen - [email protected]; Tong Zhu* - [email protected]
* Corresponding author
AbstractBackground: In order to identify rice genes involved in nutrient partitioning, microarrayexperiments have been done to quantify genomic scale gene expression. Genes involved in nutrientpartitioning, specifically grain filling, will be used to identify other co-regulated genes, and DNAbinding proteins. Proper identification of the initial set of bait genes used for further investigationis critical. Hierarchical clustering is useful for grouping genes with similar expression profiles, butdecreases in utility as data complexity and systematic noise increases. Also, its rigid classification ofgenes is not consistent with our belief that some genes exhibit multifaceted, context dependentregulation.
Results: Singular value decomposition (SVD) of microarray data was investigated as a method tocomplement current techniques for gene expression pattern recognition. SVD's usefulness, infinding likely participants in grain filling, was measured by comparison with results obtainedpreviously via clustering. 84 percent of these known grain-filling genes were re-identified afterdetailed SVD analysis. An additional set of 28 genes exhibited a stronger grain-filling pattern thanthose grain-filling genes that were unselected. They also had upstream sequence containing motifsover-represented among grain filling genes.
Conclusions: The pattern-based perspective that SVD provides complements to widely usedclustering methods. The singular vectors provide information about patterns that exist in the data.Other aspects of the decomposition indicate the extent to which a gene exhibits a pattern similarto those provided by the singular vectors. Thus, once a set of interesting patterns has beenidentified, genes can be ranked by their relationship with said patterns.
BackgroundGrain filling aspects of nutrient partitioning are intenselystudied as they affect the yield and quality of many impor-
tant cereals. This quality can be measured in nutritionaland aesthetic terms. The grain-filling process of cerealdevelopment typically has two processes: dilatory and
Published: 10 July 2003
BMC Genomics 2003, 4:26
Received: 04 April 2003Accepted: 10 July 2003
This article is available from: http://www.biomedcentral.com/1471-2164/4/26
© 2003 Anderson et al; licensee BioMed Central Ltd. This is an Open Access article: verbatim copying and redistribution of this article are permitted in all media for any purpose, provided this notice is preserved along with the article's original URL.
Page 1 of 12(page number not for citation purposes)

BMC Genomics 2003, 4 http://www.biomedcentral.com/1471-2164/4/26
filling. Together these processes encompass the synthesis,transport, and storage of carbohydrates, fatty acids, pro-teins, and minerals. The dilatory process is characterizedby high biosynthetic activity and low dry matter accumu-lation. During the filling phase all plant resources contrib-ute toward a steady rate of starch accumulation in thestarch storage unit. Genes that influence the grain fillingprocess are particularly important in achieving the goal ofmanipulating nutrient partitioning pathways.
In Zhu et al. (2003) [1], several genes responsible for grainfilling in rice were computationally identified. There, clus-tering of gene expression profiles was used to identifygrain filling genes and their transcription factors from21,000 rice genes. The method used consisted of an initialidentification of nutrient partitioning genes based onannotation and selection of genes that potentially partici-pate in the grain-filling process by clustering of expressionprofiles via Self-Organizing Map (SOM), followed by hier-archical clustering influenced by the SOM gene ordering[2]. A set of grain filling related, nutrient partitioning geneclusters were identified via informed visual inspection ofthe hierarchical clustering results. This initial set of genesformed the sole basis for identification of a wider range ofgrain filling related genes with diverse functions, over-rep-resented cis acting regulatory elements, and associatedtranscription factors. Such an approach provided a power-ful way to associate genes with traits of interest, to identifykey regulators as putative target genes in this complicatedbiological process, and a potential method to identifystrategies for improvement of crop yield and nutrientvalue by pathway engineering. However, the identifiedgenes and their regulatory networks require thoroughfunctional validations by experimental methods such asreverse genetics. These experimental validation steps usu-ally are time-consuming and expensive. Thus, improve-ment of microarray data analysis by false positivereduction becomes necessary.
Competitive learning schemes like the Kohonen SOM [3]and hierarchical clustering are popular methods for visu-alization and identification of patterns in a large set ofgene expression profiles. SOM analysis can provide non-exclusive classifications, but requires an estimate for thenumber of classes (nodes) and is usually carried out in alow-dimensional space. Hierarchical clustering is a morefrequently used method, but visualization via one-dimen-sional lists can lead to poor resolution of related geneseven if a SOM gene ordering influences the branch flip-ping, as implemented in the software tool Cluster [2].
Recently, singular value decomposition (SVD) hasemerged as an alternative method for genomic research.Several groups have demonstrated its utility in identifyingglobal, cyclic patterns of gene expression [4,5], and its
application in reduction of experimental and biologicalnoise in microarray datasets [5,6]. SVD is a feature gener-ation technique that facilitates the exploration of multipledimensions of data variability. SVD is an operationapplied to a matrix that results in a list of vectors, whichcontain features measuring different aspects of variationin the data. One can produce multiple nonexclusive geneorderings or classifications based on significant featurevectors. The patterns exhibited by one or more feature vec-tors, singly or in combination, may correspond to biolog-ical processes.
To improve accuracy of target identification by avoidingexclusive clustering and exploring a wider range of dimen-sionality in expression pattern variation, we have exam-ined the utility of singular value decomposition inidentifying grain-filling genes. In this manuscript, wefocus on nutrient partitioning genes potentially involvedin grain filling. After evaluating the full spectrum ofexpression patterns, we address the identification of grainfilling genes by a measure of correlation with a familiarexpression pattern, conceptually conforming to grain fill-ing. In this manner we have identified several genespotentially involved in grain filling, and evaluate them bycomparison with grain filling genes identified in an earlierstudy [1]. These genes have similar expression profilesshowing significant differential expression during ricegrain development and tissue specificity to panicle andgrain. Cis-acting regulatory element surveys also supporttheir role in the grain filling process.
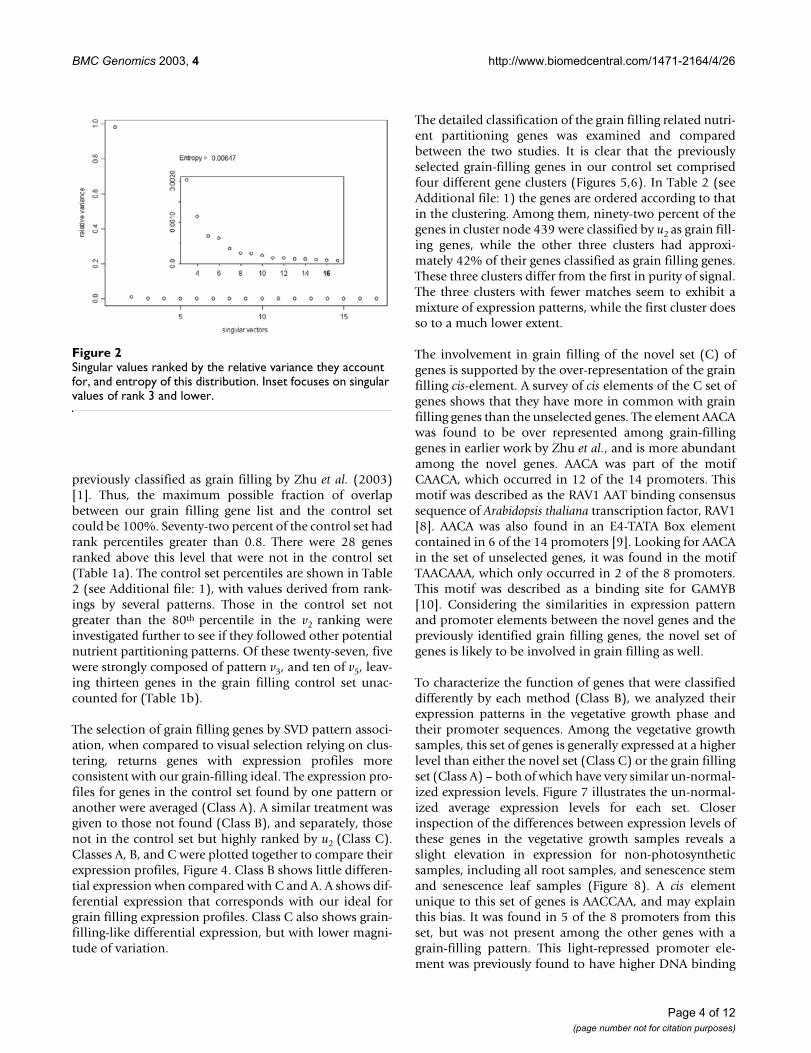
ResultsThe decomposition of a matrix of expression levels, A, pre-sented us with several interesting patterns for gene expres-sion during grain development (Figure 1). The first threepatterns are significant according to the relative variancethreshold, t, described by Everitt and Dunn (2001) [7],0.7/n (n = 491 → t = 0.00142.) The entropy in the distri-bution of relative variances is very low, indicating unevencontribution of the patterns to the expression profiles in A(Figure 2). The first pattern, v1, reflects a significant devia-tion from the basal expression level, with an insignificantvariance between experimental conditions. In addition,the coefficients of u1 have higher entropy of distributionthan the following left singular vectors, making it a weakergene classifier. v1 may represent normalized global geneexpression deviation from the project mean, and was notused to identify grain-filling genes. v2 has a significant pat-tern of variation between experiments, indicative of aprocess very similar to our grain-filling ideal. u2 was usedto sort the 491 genes. The sorted expression profiles areshown in Figure 3. We classified genes as grain filling iftheir rank percentile was greater than or equal to 0.8. Welimited our threshold to 0.8 in order to obtain a set of atleast 98 genes. The control set was a list of 98 genes
Page 2 of 12(page number not for citation purposes)

BMC Genomics 2003, 4 http://www.biomedcentral.com/1471-2164/4/26
First five singular vectors vs. developmental (lines) and histological samples (bars)Figure 1First five singular vectors vs. developmental (lines) and histological samples (bars). Sample abbreviations: p_1–3 (panicle 1–3 cm), ..., p_em (panicle during panicle emergence), g_0 (grain at zero days postanthesis), ..., g_sd (grain, soft dough), g_hd (grain, hard dough), endosp (endosperm), & coat_ms (seed coat, milk stage).
Page 3 of 12(page number not for citation purposes)
BMC Genomics 2003, 4 http://www.biomedcentral.com/1471-2164/4/26
previously classified as grain filling by Zhu et al. (2003)[1]. Thus, the maximum possible fraction of overlapbetween our grain filling gene list and the control setcould be 100%. Seventy-two percent of the control set hadrank percentiles greater than 0.8. There were 28 genesranked above this level that were not in the control set(Table 1a). The control set percentiles are shown in Table2 (see Additional file: 1), with values derived from rank-ings by several patterns. Those in the control set notgreater than the 80th percentile in the v2 ranking wereinvestigated further to see if they followed other potentialnutrient partitioning patterns. Of these twenty-seven, fivewere strongly composed of pattern v3, and ten of v5, leav-ing thirteen genes in the grain filling control set unac-counted for (Table 1b).
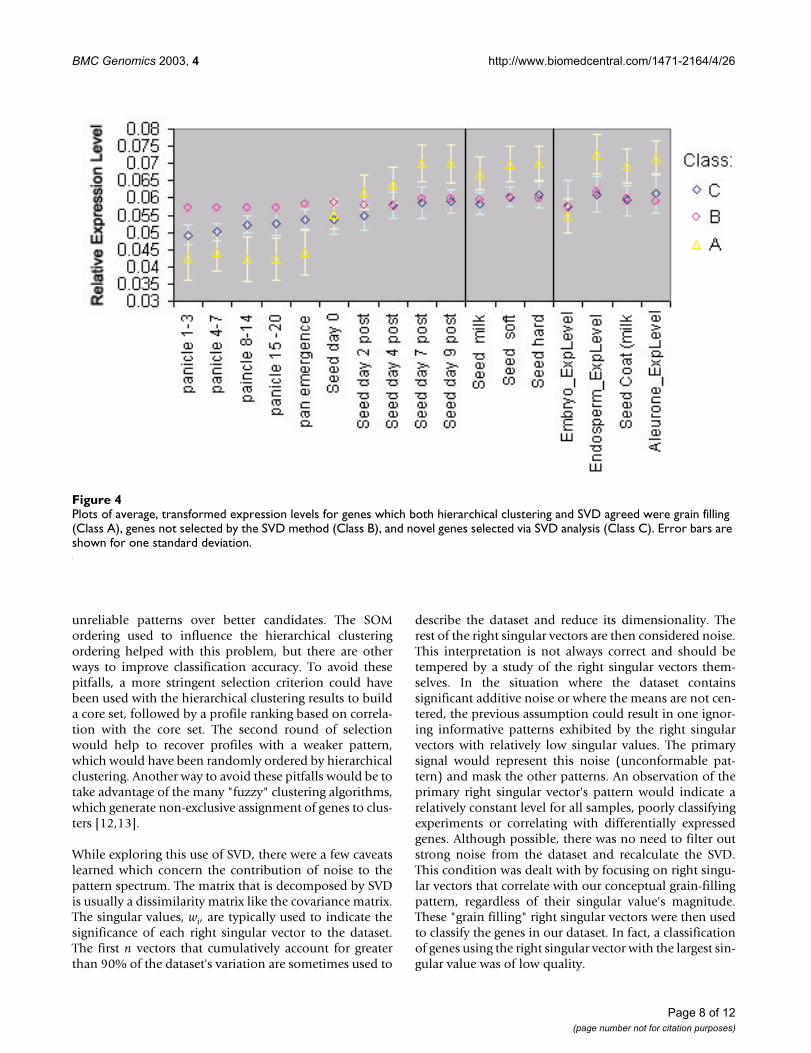
The selection of grain filling genes by SVD pattern associ-ation, when compared to visual selection relying on clus-tering, returns genes with expression profiles moreconsistent with our grain-filling ideal. The expression pro-files for genes in the control set found by one pattern oranother were averaged (Class A). A similar treatment wasgiven to those not found (Class B), and separately, thosenot in the control set but highly ranked by u2 (Class C).Classes A, B, and C were plotted together to compare theirexpression profiles, Figure 4. Class B shows little differen-tial expression when compared with C and A. A shows dif-ferential expression that corresponds with our ideal forgrain filling expression profiles. Class C also shows grain-filling-like differential expression, but with lower magni-tude of variation.
The detailed classification of the grain filling related nutri-ent partitioning genes was examined and comparedbetween the two studies. It is clear that the previouslyselected grain-filling genes in our control set comprisedfour different gene clusters (Figures 5,6). In Table 2 (seeAdditional file: 1) the genes are ordered according to thatin the clustering. Among them, ninety-two percent of thegenes in cluster node 439 were classified by u2 as grain fill-ing genes, while the other three clusters had approxi-mately 42% of their genes classified as grain filling genes.These three clusters differ from the first in purity of signal.The three clusters with fewer matches seem to exhibit amixture of expression patterns, while the first cluster doesso to a much lower extent.
The involvement in grain filling of the novel set (C) ofgenes is supported by the over-representation of the grainfilling cis-element. A survey of cis elements of the C set ofgenes shows that they have more in common with grainfilling genes than the unselected genes. The element AACAwas found to be over represented among grain-fillinggenes in earlier work by Zhu et al., and is more abundantamong the novel genes. AACA was part of the motifCAACA, which occurred in 12 of the 14 promoters. Thismotif was described as the RAV1 AAT binding consensussequence of Arabidopsis thaliana transcription factor, RAV1[8]. AACA was also found in an E4-TATA Box elementcontained in 6 of the 14 promoters [9]. Looking for AACAin the set of unselected genes, it was found in the motifTAACAAA, which only occurred in 2 of the 8 promoters.This motif was described as a binding site for GAMYB[10]. Considering the similarities in expression patternand promoter elements between the novel genes and thepreviously identified grain filling genes, the novel set ofgenes is likely to be involved in grain filling as well.
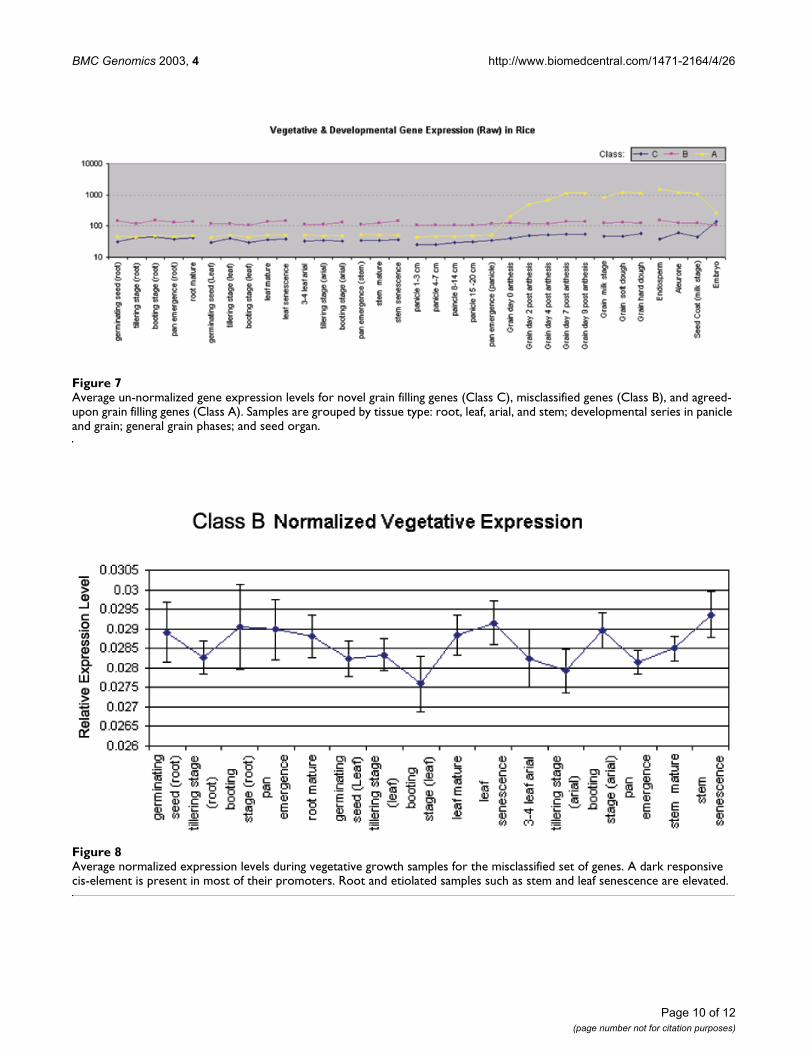
To characterize the function of genes that were classifieddifferently by each method (Class B), we analyzed theirexpression patterns in the vegetative growth phase andtheir promoter sequences. Among the vegetative growthsamples, this set of genes is generally expressed at a higherlevel than either the novel set (Class C) or the grain fillingset (Class A) – both of which have very similar un-normal-ized expression levels. Figure 7 illustrates the un-normal-ized average expression levels for each set. Closerinspection of the differences between expression levels ofthese genes in the vegetative growth samples reveals aslight elevation in expression for non-photosyntheticsamples, including all root samples, and senescence stemand senescence leaf samples (Figure 8). A cis elementunique to this set of genes is AACCAA, and may explainthis bias. It was found in 5 of the 8 promoters from thisset, but was not present among the other genes with agrain-filling pattern. This light-repressed promoter ele-ment was previously found to have higher DNA binding
Singular values ranked by the relative variance they account for, and entropy of this distributionFigure 2Singular values ranked by the relative variance they account for, and entropy of this distribution. Inset focuses on singular values of rank 3 and lower.
Page 4 of 12(page number not for citation purposes)

BMC Genomics 2003, 4 http://www.biomedcentral.com/1471-2164/4/26
activity in etiolated plants but much lower activity ingreen plants [11].
DiscussionOur association of genes to singular vectors was not exclu-sive. A gene's expression profile can be described as linearcombination of each right singular vector, and said genecan be associated with those vectors that contribute themost. Clustering provides nested clusters with mutualexclusivity among clusters at a given correlation thresh-old. When there are genes with low intensity patterns,clustering can result in groups with a mixture of patternsand low internal correlation. Sets of genes strongly corre-lated with a particular singular vector will have greaterinternal correlation. Given these differences, both meth-
ods agree on a majority of grain filling genes, which hadvery significant differential expression during grain devel-opment. This could be expected as both clustering andSVD seek to minimize the squared error.
The area of disagreement between methods concernedgenes with low differential expression. They were listed asgrain filling in the control set but were not selected withthe SVD method. These unselected genes are not any lessimportant than those identified with SVD, they simplyexhibit small changes in expression level during grain fill-ing – changes that may be insignificant due to thepresence of errors. In many cases regulatory genes havesmall changes in expression level, while target genes fur-ther along in the cascade have larger changes. The
Expression profiles that have a grain-filling pattern are grouped together in this ordering based on the influence of the second right singular vectorFigure 3Expression profiles that have a grain-filling pattern are grouped together in this ordering based on the influence of the second right singular vector. Expression levels in Embryo samples are uncorrelated with this ordering.
Page 5 of 12(page number not for citation purposes)
BMC Genomics 2003, 4 http://www.biomedcentral.com/1471-2164/4/26
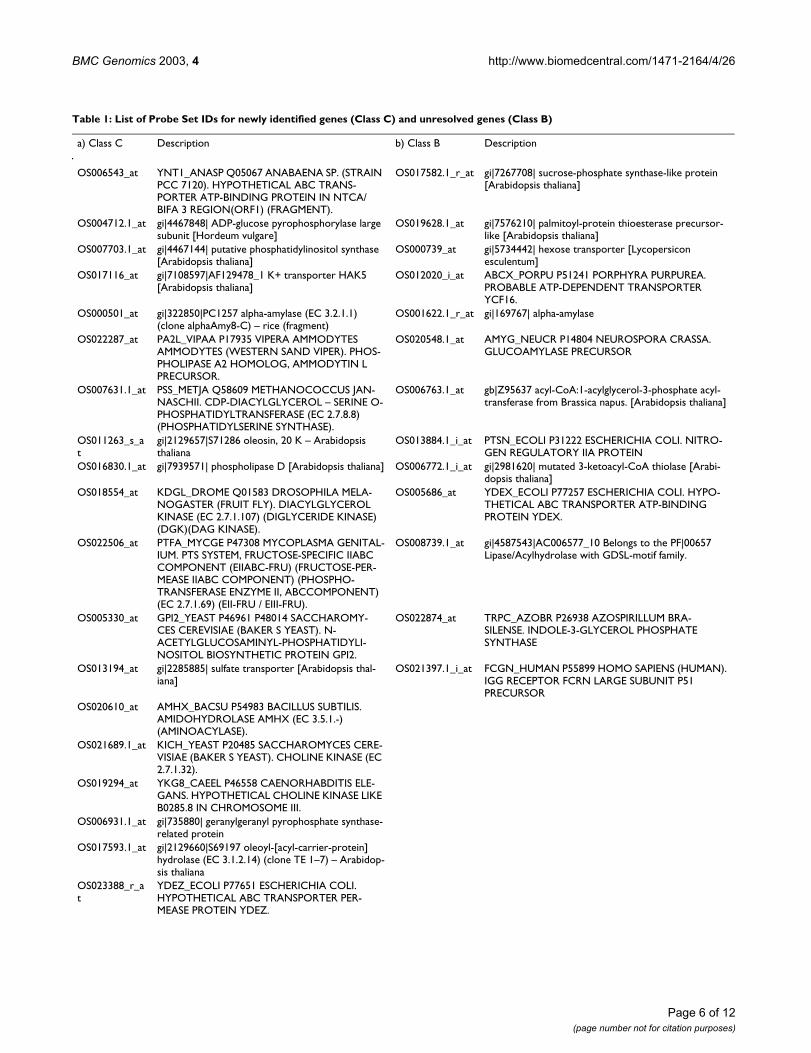
Table 1: List of Probe Set IDs for newly identified genes (Class C) and unresolved genes (Class B)
a) Class C Description b) Class B Description
OS006543_at YNT1_ANASP Q05067 ANABAENA SP. (STRAIN PCC 7120). HYPOTHETICAL ABC TRANS-PORTER ATP-BINDING PROTEIN IN NTCA/BIFA 3 REGION(ORF1) (FRAGMENT).
OS017582.1_r_at gi|7267708| sucrose-phosphate synthase-like protein [Arabidopsis thaliana]
OS004712.1_at gi|4467848| ADP-glucose pyrophosphorylase large subunit [Hordeum vulgare]
OS019628.1_at gi|7576210| palmitoyl-protein thioesterase precursor-like [Arabidopsis thaliana]
OS007703.1_at gi|4467144| putative phosphatidylinositol synthase [Arabidopsis thaliana]
OS000739_at gi|5734442| hexose transporter [Lycopersicon esculentum]
OS017116_at gi|7108597|AF129478_1 K+ transporter HAK5 [Arabidopsis thaliana]
OS012020_i_at ABCX_PORPU P51241 PORPHYRA PURPUREA. PROBABLE ATP-DEPENDENT TRANSPORTER YCF16.
OS000501_at gi|322850|PC1257 alpha-amylase (EC 3.2.1.1) (clone alphaAmy8-C) – rice (fragment)
OS001622.1_r_at gi|169767| alpha-amylase
OS022287_at PA2L_VIPAA P17935 VIPERA AMMODYTES AMMODYTES (WESTERN SAND VIPER). PHOS-PHOLIPASE A2 HOMOLOG, AMMODYTIN L PRECURSOR.
OS020548.1_at AMYG_NEUCR P14804 NEUROSPORA CRASSA. GLUCOAMYLASE PRECURSOR
OS007631.1_at PSS_METJA Q58609 METHANOCOCCUS JAN-NASCHII. CDP-DIACYLGLYCEROL – SERINE O-PHOSPHATIDYLTRANSFERASE (EC 2.7.8.8) (PHOSPHATIDYLSERINE SYNTHASE).
OS006763.1_at gb|Z95637 acyl-CoA:1-acylglycerol-3-phosphate acyl-transferase from Brassica napus. [Arabidopsis thaliana]
OS011263_s_at
gi|2129657|S71286 oleosin, 20 K – Arabidopsis thaliana
OS013884.1_i_at PTSN_ECOLI P31222 ESCHERICHIA COLI. NITRO-GEN REGULATORY IIA PROTEIN
OS016830.1_at gi|7939571| phospholipase D [Arabidopsis thaliana] OS006772.1_i_at gi|2981620| mutated 3-ketoacyl-CoA thiolase [Arabi-dopsis thaliana]
OS018554_at KDGL_DROME Q01583 DROSOPHILA MELA-NOGASTER (FRUIT FLY). DIACYLGLYCEROL KINASE (EC 2.7.1.107) (DIGLYCERIDE KINASE) (DGK)(DAG KINASE).
OS005686_at YDEX_ECOLI P77257 ESCHERICHIA COLI. HYPO-THETICAL ABC TRANSPORTER ATP-BINDING PROTEIN YDEX.
OS022506_at PTFA_MYCGE P47308 MYCOPLASMA GENITAL-IUM. PTS SYSTEM, FRUCTOSE-SPECIFIC IIABC COMPONENT (EIIABC-FRU) (FRUCTOSE-PER-MEASE IIABC COMPONENT) (PHOSPHO-TRANSFERASE ENZYME II, ABCCOMPONENT) (EC 2.7.1.69) (EII-FRU / EIII-FRU).
OS008739.1_at gi|4587543|AC006577_10 Belongs to the PF|00657 Lipase/Acylhydrolase with GDSL-motif family.
OS005330_at GPI2_YEAST P46961 P48014 SACCHAROMY-CES CEREVISIAE (BAKER S YEAST). N-ACETYLGLUCOSAMINYL-PHOSPHATIDYLI-NOSITOL BIOSYNTHETIC PROTEIN GPI2.
OS022874_at TRPC_AZOBR P26938 AZOSPIRILLUM BRA-SILENSE. INDOLE-3-GLYCEROL PHOSPHATE SYNTHASE
OS013194_at gi|2285885| sulfate transporter [Arabidopsis thal-iana]
OS021397.1_i_at FCGN_HUMAN P55899 HOMO SAPIENS (HUMAN). IGG RECEPTOR FCRN LARGE SUBUNIT P51 PRECURSOR
OS020610_at AMHX_BACSU P54983 BACILLUS SUBTILIS. AMIDOHYDROLASE AMHX (EC 3.5.1.-) (AMINOACYLASE).
OS021689.1_at KICH_YEAST P20485 SACCHAROMYCES CERE-VISIAE (BAKER S YEAST). CHOLINE KINASE (EC 2.7.1.32).
OS019294_at YKG8_CAEEL P46558 CAENORHABDITIS ELE-GANS. HYPOTHETICAL CHOLINE KINASE LIKE B0285.8 IN CHROMOSOME III.
OS006931.1_at gi|735880| geranylgeranyl pyrophosphate synthase-related protein
OS017593.1_at gi|2129660|S69197 oleoyl-[acyl-carrier-protein] hydrolase (EC 3.1.2.14) (clone TE 1–7) – Arabidop-sis thaliana
OS023388_r_at
YDEZ_ECOLI P77651 ESCHERICHIA COLI. HYPOTHETICAL ABC TRANSPORTER PER-MEASE PROTEIN YDEZ.
Page 6 of 12(page number not for citation purposes)

BMC Genomics 2003, 4 http://www.biomedcentral.com/1471-2164/4/26
increased sensitivity of pattern detection will improve ourability to extract these target genes before using them tosearch for regulatory genes with other methods. Almost allof these genes with a weak grain-filling pattern were orig-inally part of hierarchical clustering nodes with very lowinternal correlation (average pair-wise correlation). Amore stringent classification that excluded such nodeswould have resulted in a more concordant set of geneexpression profiles.
The unselected set might be misclassified in the earlierstudy [1], possibly carrying out roles important in thegrain filling process but sites physically distant from thegrain body itself. Their expression profiles did not followa pattern similar to that of known grain filling genes, andduring vegetative growth, their expression levels are con-sistently higher. These genes, in general, lacked promoterelements common to grain filling genes. They also hadconserved promoter elements that were not found ingrain filling genes. If functional in rice, their lightrepressed elements would explain the higher expressionin root, which grows in dark conditions. It is possible thatthe higher expression levels observed during stem and leafsenescence are due to suppression of photosynthesis activ-ity. Rice is a monocot plant and there are portions of stemthat are etiolated due to blockage of light from permanentleaf encirclement. During senescence, the light sensitivityof stem and leaf is biochemically reduced. This may result
in a de facto etiolated state also explaining the elevatedgene expression. The misclassification of these genes wasdue to the combined effects of including nodes with lowinternal correlation and information loss fromhierarchical clustering. It should also be noted that com-pared to the set of novel genes and the set of agreed-upongenes, a greater fraction, 0.3 vs. 0.107 & 0.115 respec-tively, of these unselected genes have potentially unrelia-ble probe sets. This unreliability stems from the inabilityto compile a full set of unique probes for these genes, andis indicated by the Probe Set ID suffixes 'r' and 'i', indicat-ing sequences for which it was not possible to pick a fullset of unique probes or for which there are fewer than fif-teen probes.
When using hierarchical clustering to classify gene expres-sion profiles, there are several drawbacks to consider.Generally, microarray data is information-rich, withmultiple dimensions of variability. The ordering of genesproduced by hierarchical clustering reduces this variabil-ity to a single dimension, which may not accurately reflectthe differences between expression profiles. As a result,closeness in this single dimension may not reflect similar-ities occurring in a higher dimensional space. These fac-tors impact difficult-to-classify profiles more significantly.In Zhu et al. (2003) [1] this lead to grain-filling genes,with less obvious expression profiles, being grouped witha mixture of other profiles, resulting in the selection of
OS014177_at YCKJ_BACSU P42200 BACILLUS SUBTILIS. PROBABLE AMINO-ACID ABC TRANSPORTER PERMEASE PROTEIN.
OS022558_i_at R104_SACPA Q92378 SACCHAROMYCES PAR-ADOXUS (YEAST). MEIOTIC RECOMBINATION PROTEIN REC104.
OS012669.1_at gi|3044212| acyl-CoA oxidase [Arabidopsis thal-iana]
OS013723_at GLGC_BACCL P30522 BACILLUS CALDOLYTI-CUS. GLUCOSE-1-PHOSPHATE ADENYLYL-TRANSFERASE (EC 2.7.7.27) (ADP-GLUCOSESYNTHASE) (ADP-GLUCOSE PYRO-PHOSPHORYLASE) (FRAGMENT).
OS022194_at NEPU_THEVU Q08751 THERMOACTINOMY-CES VULGARIS. NEOPULLULANASE (EC 3.2.1.135) (ALPHA-AMYLASE II).
OS009538_at gi|4490321| nitrate transporter [Arabidopsis thal-iana]
OS014390_at gi|9294650| lipase/acylhydrolase; myrosinase-asso-ciated protein [Arabidopsis thaliana]
OS003885_at gi|4115931| contains similarity to Guillardia theta ABC transporter (GB:AF041468) [Arabidopsis thaliana]
OS009777.1_at gi|8570057| ESTs AU056822(S20908), C26441(C12328), C28477(C61243) correspond to a region of the predicted gene.~Arabidopsis thal-iana putative acyl-coA dehydrogenase (AF049236) [Oryza sativa]
Table 1: List of Probe Set IDs for newly identified genes (Class C) and unresolved genes (Class B) (Continued)
Page 7 of 12(page number not for citation purposes)
BMC Genomics 2003, 4 http://www.biomedcentral.com/1471-2164/4/26
unreliable patterns over better candidates. The SOMordering used to influence the hierarchical clusteringordering helped with this problem, but there are otherways to improve classification accuracy. To avoid thesepitfalls, a more stringent selection criterion could havebeen used with the hierarchical clustering results to builda core set, followed by a profile ranking based on correla-tion with the core set. The second round of selectionwould help to recover profiles with a weaker pattern,which would have been randomly ordered by hierarchicalclustering. Another way to avoid these pitfalls would be totake advantage of the many "fuzzy" clustering algorithms,which generate non-exclusive assignment of genes to clus-ters [12,13].
While exploring this use of SVD, there were a few caveatslearned which concern the contribution of noise to thepattern spectrum. The matrix that is decomposed by SVDis usually a dissimilarity matrix like the covariance matrix.The singular values, wi, are typically used to indicate thesignificance of each right singular vector to the dataset.The first n vectors that cumulatively account for greaterthan 90% of the dataset's variation are sometimes used to
describe the dataset and reduce its dimensionality. Therest of the right singular vectors are then considered noise.This interpretation is not always correct and should betempered by a study of the right singular vectors them-selves. In the situation where the dataset containssignificant additive noise or where the means are not cen-tered, the previous assumption could result in one ignor-ing informative patterns exhibited by the right singularvectors with relatively low singular values. The primarysignal would represent this noise (unconformable pat-tern) and mask the other patterns. An observation of theprimary right singular vector's pattern would indicate arelatively constant level for all samples, poorly classifyingexperiments or correlating with differentially expressedgenes. Although possible, there was no need to filter outstrong noise from the dataset and recalculate the SVD.This condition was dealt with by focusing on right singu-lar vectors that correlate with our conceptual grain-fillingpattern, regardless of their singular value's magnitude.These "grain filling" right singular vectors were then usedto classify the genes in our dataset. In fact, a classificationof genes using the right singular vector with the largest sin-gular value was of low quality.
Plots of average, transformed expression levels for genes which both hierarchical clustering and SVD agreed were grain filling (Class A), genes not selected by the SVD method (Class B), and novel genes selected via SVD analysis (Class C)Figure 4Plots of average, transformed expression levels for genes which both hierarchical clustering and SVD agreed were grain filling (Class A), genes not selected by the SVD method (Class B), and novel genes selected via SVD analysis (Class C). Error bars are shown for one standard deviation.
Page 8 of 12(page number not for citation purposes)

BMC Genomics 2003, 4 http://www.biomedcentral.com/1471-2164/4/26
Genes, identified in Zhu et al. as potential grain filling genes, grouped by node from their hierarchical clusteringFigure 5Genes, identified in Zhu et al. as potential grain filling genes, grouped by node from their hierarchical clustering. It shows the cluster with genes up-regulated during the grain filling process. The detailed description of the genes is listed in Table 2 (Additional file 1).
Potential grain filling genes grouped by node from their hier-archical clusteringFigure 6Potential grain filling genes grouped by node from their hier-archical clustering. It shows three clusters with genes up-reg-ulated in specific grain samples. The detailed description of the genes is listed in Table 2 (Additional file 1).
Page 9 of 12(page number not for citation purposes)
BMC Genomics 2003, 4 http://www.biomedcentral.com/1471-2164/4/26
Average un-normalized gene expression levels for novel grain filling genes (Class C), misclassified genes (Class B), and agreed-upon grain filling genes (Class A)Figure 7Average un-normalized gene expression levels for novel grain filling genes (Class C), misclassified genes (Class B), and agreed-upon grain filling genes (Class A). Samples are grouped by tissue type: root, leaf, arial, and stem; developmental series in panicle and grain; general grain phases; and seed organ.
Average normalized expression levels during vegetative growth samples for the misclassified set of genesFigure 8Average normalized expression levels during vegetative growth samples for the misclassified set of genes. A dark responsive cis-element is present in most of their promoters. Root and etiolated samples such as stem and leaf senescence are elevated.
Page 10 of 12(page number not for citation purposes)
BMC Genomics 2003, 4 http://www.biomedcentral.com/1471-2164/4/26
As the coefficients for each right singular vector are usedto classify genes and the genes in each class should ideallyhave coefficients different from genes in other classes, thechallenge to identify a vector that produces a goodclassification can be simplified by measurement of theentropy for each vector's coefficient distribution. Vectorswith the lowest entropy, even if they have a small singularvalue, have the most ordered coefficient distribution andmay be quite useful in classifying genes into distinctgroups. We will follow up on this idea in future applica-tions of SVD to RNA dynamics.
SVD can be used to reduce the dimensionality of a dataset, but our method uses the singular vectors generated bythe decomposition to identify patterns that may relate tograin filling in rice. In this way, we attempt to avoid over-looking any dimensions of expression profile variance. Agene ranking based on similarity to interesting feature-vectors allows recovery of profiles with weaker but rele-vant grain filling patterns. This method selected geneswith greater differential expression than the questionableset presented by clustering. The newly identified genes areimportant because they represent genes that have astronger pattern of grain filling, which were not easily vis-ually identified from the hierarchical clustering. It is likelythat if the previous method only relied on SOM, more ofthese genes would have been identified. SVD providesmuch information about patterns of variability in a data-set rather than a rigid assignment of genes to clusters. Thisadded perspective, plus the ability to amplify or attenuatespecific patterns in the dataset, complements the classifi-cations given by commonly used clustering techniques.
ConclusionsWe conclude that SVD is a useful alternative method thatcomplements widely used clustering methods forstudying function of genes. The SVD identified grain-fill-ing related genes, providing additional, valuable candi-date genes for improving grain composition and yield.
MethodsDatasets usedThe dataset comprised expression levels of 491 genes in33 samples, with emphasis on the 17 samples directlyrelated to grain filling [1]. The complete dataset used isavailable at http://www.blackwell-science.com/products/journals/suppmat/PBI/PBI006/PBI006sm.htm. Based ontheir sequence annotation and functional classification[14], the 491 genes were selected because their productsare presumably involved in or associated with three majorpathways of nutrient partitioning: the synthesis and trans-port of fatty acids, carbohydrates, and proteins. The 17grain filling related tissue samples include panicle 1–3cm, panicle 4–7 cm, panicle 8–14 cm, panicle 15–20 cm,seed 0 day, seed 2 day, seed 4 day, seed 7 day, seed 9 day,
seed (soft dough), seed (hard dough), embryo,endosperm, seed coat (milk stage), aleurone, and seed(milk stage). A complete description of the experimentalprotocols used to generate this dataset can be found inZhu et al (2003) [1].
Data normalizationIn our matrix A' each row corresponded to a different geneand each column corresponded to one of 17 different con-ditions. The aij cell in A' was the expression level of gene iunder condition j. The data in A' was transformed to the n× m matrix A according to the protocol in Zhu et al. (2002)[1]. During this transformation values of aij less than 5were set equal to 5 and log2-transformed. Next, theexpression vectors were median-centered and normalizedsuch that the sum of squares for each expression vectorwas equal to one. In efforts to validate our results, we alsoinvestigated gene expression level in a wider range of sam-ples, including the 17 mentioned above, totaling 33 sam-ples. The normalization applied to this broader set wasthe same as that described for the set of 17, above. Notethat the difference in sample number will affect themedian centering and normalization steps, makingsmaller deviations from the median less obvious.
Data decompositionThe SVD theorem (Press et al., 1992) is stated in eq1 [15].U (n × q) and V (q × q) contain orthogonal vectors, and W(q × q) is a diagonal matrix of coefficients or singularvalues,
A = UWVT [1]
denoted w1, w2, ... wq. q is the rank of A, and is generallythe smaller of the two dimensions n and m. The decompo-sition was performed using the commercial softwarepackage S-PLUS™ (Insightful Co., Seattle, WA) accordingto Golub and van Loan (1996) [16]. The rows of VT, or Vtransposed, are the right singular vectors, vj. Each rightsingular vector, alone or in combination with other vec-tors, describes a pattern of variation in A that could beindicative of a biological process. The columns of U arethe left singular vectors, uj. Each coefficient, uij, indicatesthe relative contribution of pattern vj to the expressionprofile of gene i. The singular value wi indicates the rela-tive contribution of pattern vi to all gene expressionpatterns in A. The square of the singular values divided bythe sum of singular values squares defines the relative var-iance for each singular value. This relative variance indi-cates how much of the variance in A is explained by aparticular singular vector. The expression profile of anygene can be written as a linear combination of these sin-gular vectors and the singular values in W.
Page 11 of 12(page number not for citation purposes)

BMC Genomics 2003, 4 http://www.biomedcentral.com/1471-2164/4/26
Pattern recognitionThe right singular vectors that match our preconception ofa grain filling pattern of expression, for example, lowexpression during panicle development and increasingexpression during grain development, were identifiedafter A was decomposed. For each interesting pattern, vj,the genes, gi, were sorted by uij and the top 80th percentilewere selected. These top scorers were compared to 98genes previously identified as grain filling-related nutrientpartitioning genes by Zhu et al., which they used as a tem-plate for selecting other genes and transcription factorsinvolved in grain filling. In Zhu et al., the 98 genes weremanually selected by visualization of a hierarchicalclustering informed by a SOM grouping of the 491 poten-tial nutrient partitioning genes (Figures 5,6). The qualityof the ordering given by uj was assessed by plotting thepercent of the 98 found having a percentile greater than pfor all p less than 1. Similarly, the percent of those genesselected that are in the set of 98, for all p, is plotted.
We observed the entropy (E) of various distributions dur-ing our study, and the generalized formula we used isshown in Equations 2 and 3 for a vector F, containing Nscalars.
Promoter analysisAfter genes were classified, their promoter sequences wereidentified to check if pattern similarity could be related toconserved cis elements. The statistically significant ele-ments were identified with a PERL script and annotatedwith the PLACE database [17]. The PERL script identifiedmotifs among promoter sequences for a given set of genes.Those elements that matched to an annotated cis-actingregulatory DNA element from the PLACE database werethen presented. We limited our investigation to elementslocated within 2 KB of the transcriptional start site andthat had an e-value less than 3E-02. At the time of publi-cation, not all probe sets could be associated with highquality assembled upstream sequences.
Authors' ContributionsAA participated in the design of the study, carried out thecomputational analyses and drafted the manuscript. MHcontributed to the promoter analysis. WC participated inthe design of the study and discussion. TZ conceived of
the study, and participated in its design and coordination.All authors read and approved the final manuscript.
Additional material
References1. Zhu T, Budworth P, Chen W, Provart N, Chang HS, Guimil S, Estes
B, Zou G and Wang X: Transcriptional Control of Nutrient Par-titioning During Rice Grain Filling Plant Biotechnol J 2003, 1:59-70.
2. Eisen MB, Spellman PT, Brown PO and Botstein D: Cluster analysisand display of genome-wide expression patterns Proc Natl AcadSci USA 1998, 95:14863-14868.
3. Kohonen T: Self-Organization and Associative Memory 2nd edition.Springer-Verlag Telos; 1989.
4. Holter NS: Fundamental patterns underlying gene expressionprofiles: Simplicity from complexity Proc Natl Acad Sci USA 2000,97:9409-9414.
5. Alter O, Brown PO and Botstein D: Singular value decomposi-tion for genome-wide expression data processing andmodeling Proc Natl Acad Sci USA 2000, 18:10101-10106.
6. Dewey GT and Galas DJ: Dynamic models of gene expressionand classification Funct Integr Genomics 2001, 1:269-278.
7. Everitt BS and Dunn G: Applied Multvariate Data Analysis Arnold, London;2001.
8. Kagaya Y, Ohmiya K and Hattori T: RAV1, a novel DNA-bindingprotein, binds to bipartite recognition sequence through twodistinct DNA-binding domains uniquely found in higherplants Nucleic Acids Res 1999, 27:470-478.
9. Cordes S, Deikman J, Margossian LJ and Fischer RL: Interaction ofa developmentally regulated DNA-binding factor with sitesflanking two different fruit-ripening genes from tomato PlantCell 1989, 1:1025-1034.
10. Gubler F, Kalla R, Roberts JK and Jacobsen JV: Gibberellin-regu-lated expression of a myb gene in barley aleurone cells: evi-dence for Myb transactivation of a high-pl alpha-amylasegene promoter Plant Cell 1995, 7:1879-1891.
11. Degenhardt J and Tobin EM: A DNA binding activity for one oftwo closely defined phytochrome regulatory elements in anLhcb promoter is more abundant in etiolated than in greenplants Plant Cell 1996, 8:31-41.
12. Theodoridis S and Koutroumbas K: Pattern Recognition. Academic Press,San Diego, CA; 1999.
13. Gasch AP and Eisen MB: Exploring the conditional coregulationof yeast expression through fuzzy k-means clustering GenomeBiol 2002, 3:research0059.1-0059.22.
14. Goff SA, Ricke D, Lan TH, Presting G, Wang R, Dunn M, GlazebrookJ, Sessions A, Oeller P and Varma H et al.: A Draft Sequence of theRice Genome (Oryza sativa L. ssp. Japonica) Science 2002,296:92-100.
15. Press WH, Teukolsky SA, Vetterling W and Flannery BP: Numericalrecipes in C: the art of scientific computing. 2nd edition. Cambridge Uni-versity Press, Cambridge; 1992.
16. Golub G and Van Loan C: Matrix Computations. Johns Hopkins UniversityPress, Baltimore, MD; 1996.
17. Higo K, Ugawa Y, Iwamoto M and Korenaga T: Plant cis-acting reg-ulatory DNA elements (PLACE) database Nucleic Acids Res1999, 27:297-300.
E
Round P Log P
N
PF
F
F
ii
N
i
ii
ij
N
=
− ( )
[ ]
= [ ]
=
=
∑
∑
100
1002
3
1
2
2
1
Additional file 1
Click here for file[http://www.biomedcentral.com/content/supplementary/1471-2164-4-26-S1.doc]
Page 12 of 12(page number not for citation purposes)