identifying energy efficiency improvements and saving ... · es is fo rb id d e n wi th o ut pr io...
TRANSCRIPT

GRIDEE/4NT/0364174/000/00 Ed. 2015/05/11 1/110
This
docu
men
tis
the
prop
erty
ofTr
acte
belE
ngin
eerin
gS.
A.An
ydu
plic
atio
nor
tran
smis
sion
toth
irdpa
rtie
sis
forb
idde
nw
ithou
tpr
ior
writ
ten
appr
oval
Identifying Energy Efficiency improvementsand saving potential in energy networks
Interim reportRevised version 22-7-2015

IDENTIFYING ENERGY EFFICIENCY IMPROVEMENTS AND SAVING POTENTIAL IN ENERGY NETWORKS –INTERIM REPORT
GRIDEE/4NT/0364174/000/00 Ed. 2015/05/11 2/110
This
docu
men
tis
the
prop
erty
ofTr
acte
belE
ngin
eerin
gS.
A.An
ydu
plic
atio
nor
tran
smis
sion
toth
irdpa
rtie
sis
forb
idde
nw
ithou
tpr
ior
writ
ten
appr
oval
Disclaimer
This document has been prepared for the European Commission however it reflects the
views only of the authors, and the Commission cannot be held responsible for any use which
may be made of the information contained therein.
© Tractebel Engineering, Ecofys 2015 by order of: European Commission

IDENTIFYING ENERGY EFFICIENCY IMPROVEMENTS AND SAVING POTENTIAL IN ENERGY NETWORKS –INTERIM REPORT
GRIDEE/4NT/0364174/000/00 Ed. 2015/05/11 3/110
This
docu
men
tis
the
prop
erty
ofTr
acte
belE
ngin
eerin
gS.
A.An
ydu
plic
atio
nor
tran
smis
sion
toth
irdpa
rtie
sis
forb
idde
nw
ithou
tpr
ior
writ
ten
appr
oval
ForewordThis interim report has been prepared for the European Commission by a consortium composed ofTractebel Engineering and Ecofys. The correspondence between the tasks in the terms of reference andthe sections of the interim report are reported in the figure below:
The second part of the assignment will focus on demand response. A final report will be delivered at theend of the assignment and will integrate this interim report.
The project has been led by Stéphane Rapoport (Tractebel Engineering). Task leader for task 1 has been
Georgios Papaefthymiou (Ecofys) and task leader for task 2 has been Vincenzo Giordano (Tractebel
Engineering). The core team has included Gregoire Lejeune (Tractebel), Farid Comaty (Ecofys) Amelie
Bonard (CRIGEN) and Pascal Vercamer (CRIGEN).
In addition to the core team valuable contributions have been made by several of our colleagues at
Tractebel Engineering and Ecofys.
The work has been followed by Mr Massimo Maraziti of the European Commission DG-Energy. During
the study, a survey has been carried out among European DSOs, thanks to the facilitation role of
European associations EURELECTRIC, CEDEC, GEODE, EDSO4SG.
All conclusions are the responsibility of the analysis team and do not necessarily reflect the views of the
European Commission, or any of the consulted stakeholders.

IDENTIFYING ENERGY EFFICIENCY IMPROVEMENTS AND SAVING POTENTIAL IN ENERGY NETWORKS –INTERIM REPORT
GRIDEE/4NT/0364174/000/00 Ed. 2015/05/11 4/110
This
docu
men
tis
the
prop
erty
ofTr
acte
belE
ngin
eerin
gS.
A.An
ydu
plic
atio
nor
tran
smis
sion
toth
irdpa
rtie
sis
forb
idde
nw
ithou
tpr
ior
writ
ten
appr
oval
We are very grateful for all the valuable comments and suggestions received from the DG Energy
officers and the consulted organizations. Any remaining errors or omissions are the sole responsibility of
the analysis team.

IDENTIFYING ENERGY EFFICIENCY IMPROVEMENTS AND SAVING POTENTIAL IN ENERGY NETWORKS –INTERIM REPORT
GRIDEE/4NT/0364174/000/00 Ed. 2015/05/11 5/110
This
docu
men
tis
the
prop
erty
ofTr
acte
belE
ngin
eerin
gS.
A.An
ydu
plic
atio
nor
tran
smis
sion
toth
irdpa
rtie
sis
forb
idde
nw
ithou
tpr
ior
writ
ten
appr
oval
Executive Summary
Objective of the studyAccording to Article 15(2) of the Directive, Member States have to ensure, by the 30th June 2015, that:
– (a) an assessment is undertaken of the Energy Efficiency potentials of their gas andelectricity infrastructure, in particular regarding transmission, distribution, loadmanagement and interoperability, and connection to energy generating installations,including access possibilities for micro energy generators;
– (b) concrete measures and investments are identified for the introduction of cost-effective Energy Efficiency improvements in the network infrastructure, with a timetablefor their introduction.
According to collected information at the moment of finalization of the interim report, some MemberStates are finalising their assessment, while others presumably are not.
The main objective of this study is therefore to support Member States which have not yet carried out theassessment. The study also aims at defining common ground to carry out the review of the assessmentreports that will be submitted by Member States to the EC.
Perimeter of the study
Energy savings/loss reduction. Loss reduction is an important aspect of efficiency in energy grids. Todate, the electricity and gas consumption is responsible for 43% of the final energy consumption in theEU and their infrastructure losses account for 1,5% and 0.3% respectively . Losses levels vary amongMembers States. One key way to improve energy efficiency is to reduce energy wastage. In theelectricity sector this wastage is referred to as losses and in the gas sector as shrinkage [2]. Energyefficiency potential therefore implies the minimisation of wastage in both gas and electricitytransmission and distribution. The study will assess the potential of selected measures to meet thisobjective.
Planning/Operational Efficiency - The directive also considers that, in assessing grid energy efficiencymeasures, planning/operational efficiency should also be considered. This entails exploring opportunitiesto improve the efficient operation of available energy infrastructure and reduce the need for investing innew infrastructures1.
1 DG ENER guidance note http://eur-lex.europa.eu/legal-content/EN/TXT/PDF/?uri=CELEX:52013SC0450&from=EN point 57 and58, Chapter E

IDENTIFYING ENERGY EFFICIENCY IMPROVEMENTS AND SAVING POTENTIAL IN ENERGY NETWORKS –INTERIM REPORT
GRIDEE/4NT/0364174/000/00 Ed. 2015/05/11 6/110
This
docu
men
tis
the
prop
erty
ofTr
acte
belE
ngin
eerin
gS.
A.An
ydu
plic
atio
nor
tran
smis
sion
toth
irdpa
rtie
sis
forb
idde
nw
ithou
tpr
ior
writ
ten
appr
oval
This study will particularly consider the planning/operational efficiency potential in electricity grids,where, thanks to new “Smart” measures allowing active grid management (Smart Grid assets; flexibilityof distributed energy resources), a higher potential for operation efficiency is available.
In particular, detailed analysis of the impact of demand response on energy efficiency (taking a broadview on energy efficiency and encompassing losses, and planning/operational efficiency) will be carriedout in the second part of this study.
Methodological approach
The assessment of the energy efficiency potential in electricity and gas grids has been carried outaccording to the following four-step approach:
1. Identification of key measures improving the energy efficiency of gas andelectrical grids.
2. Identification and discussion of the potential of those measures in term of lossesreduction, through the identification the type of sources of losses in electricity andgas grids and a mapping between the sources of losses and the correspondingmeasures that can mitigate those losses
3. Discussion of the potential for planning/operational efficiency of each measure,looking at aspects like investment deferral, RES hosting capacity, outage reduction,power quality
4. Identify the factors that affect the potential of each measure (e.g. load demand,pressure level etc.)
The analysis is supported by examples of the observed impacts of the measures based on literaturereview and a data collection survey carried out with European system operators’ associations(Eurelectric, EDSO, GEODE, CEDEC). Around 15 European distribution system operators haveparticipated to the survey and shared their experiences and best practices (more details in ANNEX IIIand IV).
A key outcome of the study is the definition of a step-by-step methodology to guide Member States andsystem operators in the definition of energy efficiency measures for electricity and gas grids.To this end an ad-hoc decision support tool has been set-up (ANNEX V).The goal of the tool is to helpproject promoters in selecting good candidate measures and refine their Energy Efficiency strategybefore carrying out full detailed cost-benefit analyses.

IDENTIFYING ENERGY EFFICIENCY IMPROVEMENTS AND SAVING POTENTIAL IN ENERGY NETWORKS –INTERIM REPORT
GRIDEE/4NT/0364174/000/00 Ed. 2015/05/11 7/110
This
docu
men
tis
the
prop
erty
ofTr
acte
belE
ngin
eerin
gS.
A.An
ydu
plic
atio
nor
tran
smis
sion
toth
irdpa
rtie
sis
forb
idde
nw
ithou
tpr
ior
writ
ten
appr
oval
Some of the key outcomes and insights are summarized here below.
Grid Energy Efficiency - State of play in Member Stateso European associations report that most of their members have not yet been actively involved by
Member States in addressing the provisions of article 15.2. The level of mobilization in EUMember States in the implementation of the provisions of article 15.2 (definition of investmentplans to improve grid energy efficiency) appears to vary across Member States.
o Based on collected information, a number of Member States are working on the topic and wouldlikely publish their official assessments in the period after the completion of this study.
o According to information available at the time of publication of this study, Member States seemmainly to consider loss reduction initiatives in their assessments.
o Starting conditions of grids (e.g. voltage level; number of transformers) and potentials for energyefficiency improvement vary widely. In particular, the level of losses varies significantly amongMember States.
o Loss reduction is typically taken into account in grid investment decisions, however often it isnot the main driver for ad-hoc investments.
o For electricity grids,• System operators generally opt for traditional investments (replacement of assets;
reinforcements etc.) to improve grid energy efficiency (mainly targeting loss reduction)• Smart Grid-related EE measures (e.g. use of flexibility of DER) to pursue energy
efficiency are less common; the existence of regulatory barriers hindering their viability.
Mapping of losses – electricity gridso A detailed categorization of losses in electricity grids have been carried out to map out where
and why losses occur in electricity grids.o A list of factors that have a key impact on the level of losses in the system have been identified,
including:Loading (including peak demand)Number of energized transformersLengths of the feedersLevel of power qualityPresence of distributed energy resources
o The main potential for reduction of electricity grids is at distribution level, where the majority oflosses occur.
o The implementation of adequate metering systems at substations and at customers’ premises isan important first step to identify where losses are actually occurring in the distribution grid andto better target EE measures.
Mapping of losses – gas grids

IDENTIFYING ENERGY EFFICIENCY IMPROVEMENTS AND SAVING POTENTIAL IN ENERGY NETWORKS –INTERIM REPORT
GRIDEE/4NT/0364174/000/00 Ed. 2015/05/11 8/110
This
docu
men
tis
the
prop
erty
ofTr
acte
belE
ngin
eerin
gS.
A.An
ydu
plic
atio
nor
tran
smis
sion
toth
irdpa
rtie
sis
forb
idde
nw
ithou
tpr
ior
writ
ten
appr
oval
o A detailed mapping of losses in gas grids and compression stations has been carried out. Over 15sources of losses have been identified.
o A list of factors that have a key impact on the level of losses in the system have been identifiedand analysed, including:
Pressure level, volume of vented pipeLength and age of the grid, pipes and joints materialsNumber and efficiency of heaters, necessity of burnersBase or peak load compressor
Planning/Operational efficiency improvement potentialo The potential benefits of each measure in term of planning/operation efficiency have been
analysed, particularly for electricity grids where a higher potential of improvement exist. Thefollowing dimensions of planning/operational efficiency have been considered:
• Investment deferral• RES hosting capacity• Security of supply (reduction of outages)• Power quality
o The factors impacting the effectiveness of each measure and the potential cost ranges have alsobeen analysed. The factors need to be tailored to specific grid conditions to assess the cost-effectiveness of individual measures in a given context.
Drivers and regulationo Measures which require the exploitation of DER flexibility have still limited diffusion in many
Member States, often just at pilot level. Their implementation would require the definition ofnew regulatory mechanisms over how DSOs can procure and activate DER flexibility. On thistopic, a specific focus on Demand Response will be carried out in the second part of the study.
o Energy efficiency (and particularly loss reduction) is the main driver of investments when thereis the need to comply with regulatory requirements and quality standards (e.g. EcoDesigndirective). In general, loss reduction is considered as one of the variables of a larger investmentoptimization plan, but not the main driver for investmnts.
o The incentive to pursue specific investments for loss reduction is strictly related to the presenceof regulatory incentives. A wide variety of regulatory frameworks are present in EuropeanMember States, which in some cases do not explicitly support loss reduction measures.
Catalogue of measures and decision-support toolo A detailed catalogue of energy efficiency measures together with an assessment of their cost-
effectiveness has been defined for electricity and gas grids.o As the potential of these measures is very much related to the specific local grid conditions, the
analysis has focused on the assessment of key factors affecting the benefits and the costs ofselected measures. System operators then need to customize these factors to their specific localgrid conditions.

IDENTIFYING ENERGY EFFICIENCY IMPROVEMENTS AND SAVING POTENTIAL IN ENERGY NETWORKS –INTERIM REPORT
GRIDEE/4NT/0364174/000/00 Ed. 2015/05/11 9/110
This
docu
men
tis
the
prop
erty
ofTr
acte
belE
ngin
eerin
gS.
A.An
ydu
plic
atio
nor
tran
smis
sion
toth
irdpa
rtie
sis
forb
idde
nw
ithou
tpr
ior
writ
ten
appr
oval
o An excel tool has been set-up to guide project promoters in the assessment of the cost-effectiveness of different energy efficiency measures according to their local grid conditions.The tool highlights the main factors affecting the benefits and cost of each measure and providesexamples for benchmark.
Cost-effectiveness of energy efficiency measureso A number of factors can greatly impact the cost-effectiveness of energy efficiency measures,
such as:Monetary value of losses, i.e. the average price of wholesale electricity (the higher, themore cost-effective are energy efficiency measures)Loss reduction is in many cases a side-benefit of investments driven by other needs. Thecost-effectiveness of energy efficiency improvements should thus be analysed within thecontext of a larger investment plan.Parallel grid developments (e.g. roll-out of smart meters; built-in smart functionalities inDG converters etc.) make the enabling infrastructure for certain EE measures alreadyavailable, reducing their implementation costs.Energy efficiency measures could have conflicting objectives (e.g. loss reduction andhosting capacity when implementing DG voltage optimization).External factors outside the control of system operators can also greatly impact thepotential of EE measures: e.g. the development and location of DERs.
A system approach to energy efficiencyo A systemic approach should be adopted when assessing the impacts of the implementation of a
portfolio of EE measures. This could include:Synergies among EE measures, i.e. consider the whole EE program rather thanindividual EE measures. This includes the assessment of possible negative influence ofparallel implementation of measures.Synergies with on-going parallel investments in the energy system (e.g. installation ofsmart converters for DGs)Synergies with replacement/investment programs already scheduled (e.g. oversizing newlines taking into account the loss reduction potential).

IDENTIFYING ENERGY EFFICIENCY IMPROVEMENTS AND SAVING POTENTIAL IN ENERGY NETWORKS –INTERIM REPORT
GRIDEE/4NT/0364174/000/00 Ed. 2015/05/11 10/110
This
docu
men
tis
the
prop
erty
ofTr
acte
belE
ngin
eerin
gS.
A.An
ydu
plic
atio
nor
tran
smis
sion
toth
irdpa
rtie
sis
forb
idde
nw
ithou
tpr
ior
writ
ten
appr
oval
Table of contents
ACRONYMS .................................................................................................................... 13
1 INTRODUCTION ........................................................................................................ 14
1.1 Objectives of this study .............................................................................. 14
1.2 The Energy Efficiency Directive .................................................................. 14
1.3 Reading guide to this document ................................................................ 15
1.3.1 Energy efficiency measures for electricity grids ....................................... 161.3.2 Energy efficiency measures for gas grids ................................................ 16
2 POTENTIAL OF ENERGY EFFICIENCY MEASURES ON LOSS REDUCTION IN ELECTRICITYGRIDS ...................................................................................................................... 18
2.1 Understanding energy losses in electricity networks ................................ 19
2.1.1 Type: Technical/non-Technical and Variable/Fixed ................................... 202.1.2 Voltage level: transmission and distribution networks............................... 212.1.3 Components: Lines and Transformers .................................................... 222.1.4 Marginal vs Average losses ................................................................... 242.1.5 Role of DG and grid management .......................................................... 252.1.6 Reactive Losses ................................................................................... 262.1.7 Imbalances ......................................................................................... 272.1.8 Life cycle assessment: impact of losses on investment decisions ............... 27
2.2 Energy efficiency measures in electricity networks: categorisation and potential.................................................................................................................... 28
2.2.1 Energy Efficient transformers ................................................................ 312.2.2 Increasing voltage level ........................................................................ 322.2.3 Increasing line capacity ........................................................................ 322.2.4 Feed-in control .................................................................................... 332.2.5 Transformers switching ........................................................................ 352.2.6 Network reconfiguration ....................................................................... 362.2.7 Conservation voltage reduction ............................................................. 362.2.8 Voltage optimisation ............................................................................ 372.2.9 Balancing loading of lines ..................................................................... 39
2.3 Regulatory regimes to promote loss reduction in electricity grids ............ 39
2.3.1 Regulatory incentives: basic options....................................................... 39

IDENTIFYING ENERGY EFFICIENCY IMPROVEMENTS AND SAVING POTENTIAL IN ENERGY NETWORKS –INTERIM REPORT
GRIDEE/4NT/0364174/000/00 Ed. 2015/05/11 11/110
This
docu
men
tis
the
prop
erty
ofTr
acte
belE
ngin
eerin
gS.
A.An
ydu
plic
atio
nor
tran
smis
sion
toth
irdpa
rtie
sis
forb
idde
nw
ithou
tpr
ior
writ
ten
appr
oval
2.3.2 State of play of regulatory mechanisms targeting loss reduction................ 41
3 POTENTIAL OF MEASURES ON PLANNING/OPERATIONAL EFFICIENCY IN ELECTRICITYGRIDS ...................................................................................................................... 43
3.1 Impact of selected energy efficiency measures on operational efficiency 44
3.1.1 High efficiency transformers.................................................................. 443.1.2 Expanding line capacity ........................................................................ 453.1.3 Increasing voltage level ........................................................................ 473.1.4 Demand response ................................................................................ 483.1.5 Feed-in control of distributed generation & storage ................................. 493.1.6 Network reconfiguration ....................................................................... 513.1.7 Switching off redundant transformers .................................................... 523.1.8 Voltage optimisation ............................................................................ 523.1.9 Conservation Voltage Reduction (CVR) ................................................... 543.1.10 Balancing 3-phase loads ....................................................................... 55
4 COST-EFFECTIVENESS OF ENERGY EFFICIENCY MEASURES IN ELECTRICITY GRIDS ........ 56
4.1 Assessment of cost-effectiveness .............................................................. 56
4.2 Synthesis of the cost effectiveness of the measures ................................. 57
5 ASSESSMENT OF THE ENERGY EFFICIENCY POTENTIAL IN GAS GRIDS .......................... 61
5.1 Understanding Energy Losses in gas networks .......................................... 61
5.1.1 Mapping of losses in gas transmission network........................................ 645.1.2 Mapping of losses in compression stations .............................................. 655.1.3 Mapping of losses in gas distribution network ......................................... 65
5.2 Energy efficiency measures in gas networks: categorisation and potential66
5.2.1 Gas transmission network: energy efficiency measures and reduction potential 675.2.2 Compressor stations: energy efficiency measures and reduction potential .. 685.2.3 Distribution grids: energy efficiency measures and reduction potential ....... 69
6 ASSESSMENT OF COST-EFFECTIVENESS OF SELECTED ENERGY EFFICIENCY MEASURES -GAS ......................................................................................................................... 71
6.1 Gas Transmission Network......................................................................... 71
6.2 Gas Compressor Stations ........................................................................... 72
6.3 Gas Distribution Network ........................................................................... 73

IDENTIFYING ENERGY EFFICIENCY IMPROVEMENTS AND SAVING POTENTIAL IN ENERGY NETWORKS –INTERIM REPORT
GRIDEE/4NT/0364174/000/00 Ed. 2015/05/11 12/110
This
docu
men
tis
the
prop
erty
ofTr
acte
belE
ngin
eerin
gS.
A.An
ydu
plic
atio
nor
tran
smis
sion
toth
irdpa
rtie
sis
forb
idde
nw
ithou
tpr
ior
writ
ten
appr
oval
ANNEX I - PARAMETERS INFLUENCING THE IMPLEMENTATION AND THE COST-EFFECTIVENESS OF THE MEASURES – DETAILED ANALYSIS .......................................... 76
ANNEX II ENERGY EFFICIENCY MEASURES IN EUROPEAN MEMBER STATES: SURVEY............ 87
Level of mobilization in Member States regarding the implementation of article 15.289Summary of key insights of the survey .............................................................. 91Energy efficiency measures implemented by survey respondents .......................... 93
ANNEX III - SURVEY - QUESTIONNAIRE FORMAT ............................................................... 96
ANNEX IV - TOOL FOR RANKING MEASURES ACCORDING TO THEIR COST-EFFECTIVENESS 101
BIBLIOGRAPHY ............................................................................................................. 107

IDENTIFYING ENERGY EFFICIENCY IMPROVEMENTS AND SAVING POTENTIAL IN ENERGY NETWORKS –INTERIM REPORT
GRIDEE/4NT/0364174/000/00 Ed. 2015/05/11 13/110
This
docu
men
tis
the
prop
erty
ofTr
acte
belE
ngin
eerin
gS.
A.An
ydu
plic
atio
nor
tran
smis
sion
toth
irdpa
rtie
sis
forb
idde
nw
ithou
tpr
ior
writ
ten
appr
oval
ACRONYMS
Capital Expenditure CAPEX
CHP Combined Heat and Power
Prosumers Consumers with local generation
DR Demand Response
DER Distributed Energy Resources
DG Distributed Generation
DMS Distribution Management System
DSO Distribution System Operator
EE Energy Efficiency
EV Electrical Vehicle
NPV Net Present Value
O&M Operation and maintenance costs
OMS Outage Management System
OPEX Operational Expenditure
PV Photo voltaic electricity generation
RES Renewable Energy Sources
SAIDI System Average Interruption Duration Index
SCADA Supervisory Control and Data Acquisition
TSO Transmission System Operator
VRES Variable Renewable Energy Sources

IDENTIFYING ENERGY EFFICIENCY IMPROVEMENTS AND SAVING POTENTIAL IN ENERGY NETWORKS –INTERIM REPORT
GRIDEE/4NT/0364174/000/00 Ed. 2015/05/11 14/110
This
docu
men
tis
the
prop
erty
ofTr
acte
belE
ngin
eerin
gS.
A.An
ydu
plic
atio
nor
tran
smis
sion
toth
irdpa
rtie
sis
forb
idde
nw
ithou
tpr
ior
writ
ten
appr
oval
1 INTRODUCTION
1.1 Objectives of this study
According to Article 15(2) of the Directive, Member States have to ensure, by the 30th June 2015, that:
– (a) an assessment is undertaken of the Energy Efficiency potentials of their gas andelectricity infrastructure, in particular regarding transmission, distribution, loadmanagement and interoperability, and connection to energy generating installations,including access possibilities for micro energy generators;
– (b) concrete measures and investments are identified for the introduction of cost-effective Energy Efficiency improvements in the network infrastructure, with a timetablefor their introduction.
According to collected information at the moment of finalization of the interim report, some MemberStates are finalising their assessment, while others presumably are not.
The main objective of this study is therefore to support Member States which have not yet carried out theassessment. The study also aims at defining common ground to carry out the review of the assessmentreports that will be submitted by Member States to the EC.
The analysis is supported by examples of the observed impacts of the measures based on literaturereview and a data collection survey carried out with European system operators’ associations.
Finally the study aims at integrating the result of the analysis in an easy-to use decision support tool, tobe used by system operators to screen most cost-effective energy efficiency investments.
1.2 The Energy Efficiency Directive
The 2012 Energy Efficiency Directive (EED) establishes a set of binding measures to help the EU reachits 20% energy efficiency target by 2020 [1]. The Directive states that 1.5% of the average final energyconsumption in the period 2010-2012 needs to be saved annually from 2014 onwards till 2020. Toachieve that, energy efficiency improvements throughout the whole value chain of the energy sector arerequired, that is from generation-transmission-distribution to consumption of any energy carrier to bedelivered to the industry, building or transportation sector.
Article 15 of the EED targets specifically the transmission and distribution sector of electricity and gasand requires thus Member states to perform an assessment of the energy efficiency potential of theirrespective infrastructure.

IDENTIFYING ENERGY EFFICIENCY IMPROVEMENTS AND SAVING POTENTIAL IN ENERGY NETWORKS –INTERIM REPORT
GRIDEE/4NT/0364174/000/00 Ed. 2015/05/11 15/110
This
docu
men
tis
the
prop
erty
ofTr
acte
belE
ngin
eerin
gS.
A.An
ydu
plic
atio
nor
tran
smis
sion
toth
irdpa
rtie
sis
forb
idde
nw
ithou
tpr
ior
writ
ten
appr
oval
Loss reduction is a key aspect of energy efficiency in energy grids. To date, the electricity and gasconsumption is responsible for 43% of the final energy consumption in the EU and their infrastructurelosses account for 1,5% and 0.3% respectively2. Losses levels vary among Members States. One key wayto improve energy efficiency is to reduce energy wastage. In the electricity sector this wastage is referredto as losses and in the gas sector as shrinkage [2]. Energy efficiency potential therefore implies theminimisation of wastage in both gas and electricity transmission and distribution networks. Energysavings that can be provided by investing in measures aiming at reducing those grid losses can besignificant, depending on the local situation.
Moreover, the directive also considers that grid energy efficiency measures should go beyond lossreduction and also take into account planning/operational efficiency. This entails exploringopportunities to improve the efficient operation of available energy infrastructure and reduce the need forinvesting in new infrastructures3.
This study will particularly consider the planning/operational efficiency in electricity grids, where,thanks to new “Smart” measures allowing active grid management, a higher potential for improvement isavailable. In particular, a detailed analysis of the impact of demand response on operational efficiencywill be carried out in the second part of this study.
1.3 Reading guide to this document
For sake of brevity and readability, the main text reports the key results and messages of the analysis.A more detailed description of all the analysis that has been carried out is reported in the Annexes:
ANNEX I reports detailed analysis of the parameters affecting the potential and the cost-effectiveness of EE measures.ANNEX II and III report the results and the questionnaire of the stakeholders’ survey.ANNEX IV describes in detail the decision support tool (excel file) that synthetises the analysisin a step-by-step methodology.
The interim report is organized in two main parts. A first part analyses the potential and the cost-effectiveness of energy efficiency measures in electricity networks, whereas the second part carries outthe same analysis for gas networks.
2 Ecofys analysis from EuroStat database3 See DG ENER guidance note http://eur-lex.europa.eu/legal-content/EN/TXT/PDF/?uri=CELEX:52013SC0450&from=EN point 57an d 58, Chapter E

IDENTIFYING ENERGY EFFICIENCY IMPROVEMENTS AND SAVING POTENTIAL IN ENERGY NETWORKS –INTERIM REPORT
GRIDEE/4NT/0364174/000/00 Ed. 2015/05/11 16/110
This
docu
men
tis
the
prop
erty
ofTr
acte
belE
ngin
eerin
gS.
A.An
ydu
plic
atio
nor
tran
smis
sion
toth
irdpa
rtie
sis
forb
idde
nw
ithou
tpr
ior
writ
ten
appr
oval
1.3.1 Energy efficiency measures for electricity grids
Energy efficiency measures for electricity grids are analysed in chapters 2 and 3. Chapter 4 provides asummary of the cost-effectiveness of the selected energy efficiency measures.The study considers three categories of energy efficiency measures for electricity grids:
Traditional ones (replacement/reinforcement)Network management (e.g. Smart Grid assets)Flexibility of distributed energy resources (Feed-in control).
Table 1-1 provides a mapping of the perimeter of the study for the energy efficiency measures inelectricity grids.
The second part of the study carries out a dedicated focus on the feed-in control category, especially ondemand response. In particular, the use of DR flexibility in planning and operation will be thoroughlyexplored.
EE Measures for electricity gridsGrid energy efficiency – electricity grids
Loss reduction Planning/Operational efficiency
Traditional(replacement/reinforcements)
Chapter 2 Chapter 3
Smart Network Management Chapter 2 Chapter 3
Feed-in control (flexibility ofdistributed energy resources)
Chapter 2 Chapter 3
Specific focus on Demand Response in second part of the report
Table 1-1 - Perimeter of the study for energy efficiency measures in electricity grids
1.3.2 Energy efficiency measures for gas grids
Energy efficiency measures for gas grids are analysed in chapters 5 and 6. Selected measures have beencategorized as follows:
Measures for transmission gridsMeasures for compression stationsMeasures for distribution grids
The analysis has mainly focused on the potential for reduction of gas shrinkage in the gas system.Error! Reference source not found. reports the perimeter of the study for the energy efficiencymeasures in gas grids.

IDENTIFYING ENERGY EFFICIENCY IMPROVEMENTS AND SAVING POTENTIAL IN ENERGY NETWORKS –INTERIM REPORT
GRIDEE/4NT/0364174/000/00 Ed. 2015/05/11 17/110
This
docu
men
tis
the
prop
erty
ofTr
acte
belE
ngin
eerin
gS.
A.An
ydu
plic
atio
nor
tran
smis
sion
toth
irdpa
rtie
sis
forb
idde
nw
ithou
tpr
ior
writ
ten
appr
oval
EE Measures for gas gridsPotential for reduction of gas
shrinkageCost-effectiveness of measures
Transmission grids Chapter 5 Chapter 6
Compression stations Chapter 5 Chapter 6
Distribution grids Chapter 5 Chapter 6
Table 1-2 - Perimeter of the study for energy efficiency measures in gas grids
IDENTIFYING ENERGY EFFICIENCY IMPROVEMENTS AND SAVING POTENTIAL IN ENERGY NETWORKS –INTERIM REPORT
GRIDEE/4NT/0364174/000/00 Ed. 2015/05/11 18/110
This
docu
men
tis
the
prop
erty
ofTr
acte
belE
ngin
eerin
gS.
A.An
ydu
plic
atio
nor
tran
smis
sion
toth
irdpa
rtie
sis
forb
idde
nw
ithou
tpr
ior
writ
ten
appr
oval
2 POTENTIAL OF ENERGY EFFICIENCY MEASURES ONLOSS REDUCTION IN ELECTRICITY GRIDS
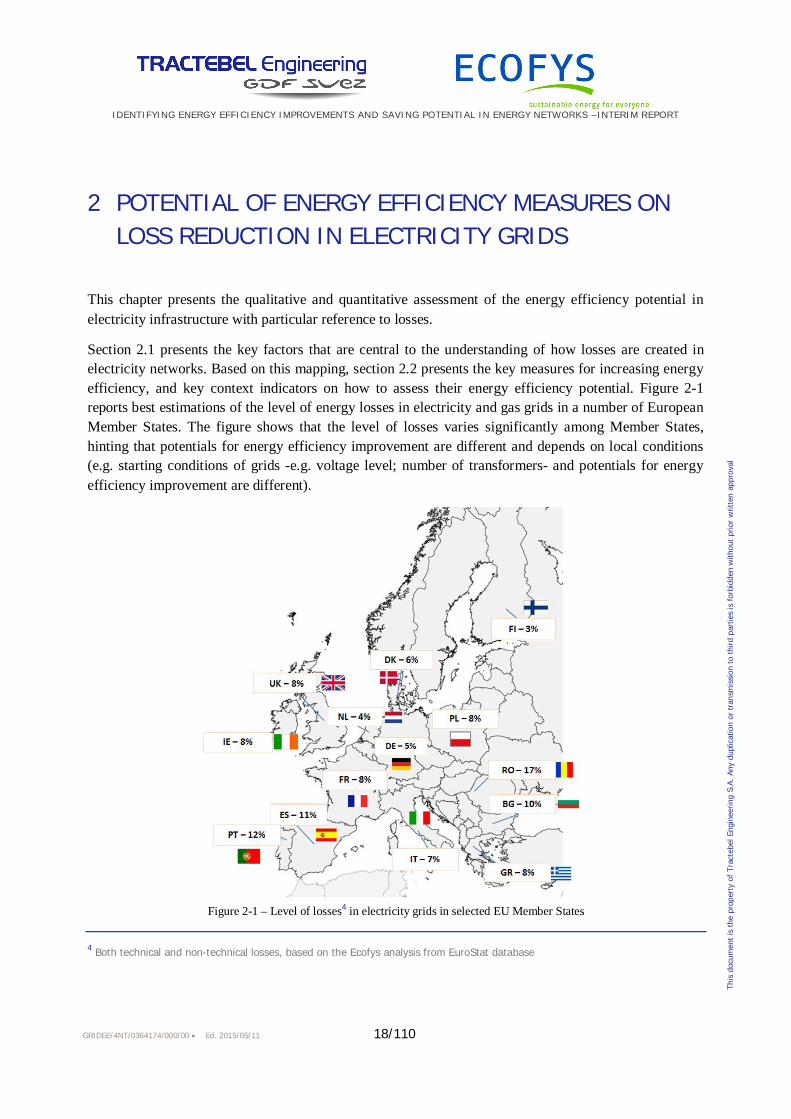
This chapter presents the qualitative and quantitative assessment of the energy efficiency potential inelectricity infrastructure with particular reference to losses.
Section 2.1 presents the key factors that are central to the understanding of how losses are created inelectricity networks. Based on this mapping, section 2.2 presents the key measures for increasing energyefficiency, and key context indicators on how to assess their energy efficiency potential. Figure 2-1reports best estimations of the level of energy losses in electricity and gas grids in a number of EuropeanMember States. The figure shows that the level of losses varies significantly among Member States,hinting that potentials for energy efficiency improvement are different and depends on local conditions(e.g. starting conditions of grids -e.g. voltage level; number of transformers- and potentials for energyefficiency improvement are different).
Figure 2-1 – Level of losses4 in electricity grids in selected EU Member States
4 Both technical and non-technical losses, based on the Ecofys analysis from EuroStat database

IDENTIFYING ENERGY EFFICIENCY IMPROVEMENTS AND SAVING POTENTIAL IN ENERGY NETWORKS –INTERIM REPORT
GRIDEE/4NT/0364174/000/00 Ed. 2015/05/11 19/110
This
docu
men
tis
the
prop
erty
ofTr
acte
belE
ngin
eerin
gS.
A.An
ydu
plic
atio
nor
tran
smis
sion
toth
irdpa
rtie
sis
forb
idde
nw
ithou
tpr
ior
writ
ten
appr
oval
2.1 Understanding energy losses in electricity networks
Energy losses in electricity grids are created through a set of parallel mechanisms which affect thedifferent network components. In order to analyse the impacts and potential of energy efficiencymeasures, one should understand how losses are created through these mechanisms and how losses aremapped in electricity grids.
Figure 2-2 presents the key factors on the mapping of losses (to allow the quantification of where lossesoccur in the system), and further presents the key mechanisms for losses creation (for a betterunderstanding of how measures could lead to losses reduction). In total there are 8 key dimensions tocategorize energy losses in electricity networks, presented in the following sections.

IDENTIFYING ENERGY EFFICIENCY IMPROVEMENTS AND SAVING POTENTIAL IN ENERGY NETWORKS –INTERIM REPORT
GRIDEE/4NT/0364174/000/00 Ed. 2015/05/11 20/110
This
docu
men
tis
the
prop
erty
ofTr
acte
belE
ngin
eerin
gS.
A.An
ydu
plic
atio
nor
tran
smis
sion
toth
irdpa
rtie
sis
forb
idde
nw
ithou
tpr
ior
writ
ten
appr
oval
Figure 2-2: Categorisation of losses in electricity networks: Mapping and key mechanisms [3], [2], [4]
2.1.1 Type: Technical/non-Technical and Variable/Fixed
Electrical losses can be divided into technical losses, which refer to energy transformed to heat and noiseduring the transmission and therefore physically lost, and non-technical losses, which refer to energydelivered and consumed, but for some reason not recorded as sales (such as theft). A general rule ofthumb is that technical losses can rise up to 12%. When system losses exceed this limit, they are mostprobably due to increased non-technical losses [5]. In general technical losses can be split into [6]:
Variable losses (also referred to as load or copper losses), occur due to the heating effect of energypassing through conductors in lines and cables and also in the copper in transformers. They vary inproportion to the square of the current and in proportion to the conductor resistance. In essence,measures to reduce variable losses can be understood under these two main influencing factors andhow they apply in the global system: they either aim to reduce the system power flows or to reducethe resistance of the transportation paths. In general, variable losses contribute roughly to two thirdsto three quarters of the total power system technical losses.Fixed losses (also referred to as non-load or iron losses), refer to energy needed for the energisationof transformers5 or conductors. These losses are invariant with current and depend mainly on thenumber of energised components. In this respect, measures to reduce fixed losses mainly aim to
5 This refers to the energy needed for the operation of the magnetic fields that enable the operation of transformers.

IDENTIFYING ENERGY EFFICIENCY IMPROVEMENTS AND SAVING POTENTIAL IN ENERGY NETWORKS –INTERIM REPORT
GRIDEE/4NT/0364174/000/00 Ed. 2015/05/11 21/110
This
docu
men
tis
the
prop
erty
ofTr
acte
belE
ngin
eerin
gS.
A.An
ydu
plic
atio
nor
tran
smis
sion
toth
irdpa
rtie
sis
forb
idde
nw
ithou
tpr
ior
writ
ten
appr
oval
reduce the number of energised components or to increase their efficiency. In general they contributeto roughly one quarter to one third of the total network losses.6
2.1.2 Voltage level: transmission and distribution networks
Electrical losses are directly affected by the voltage level: increasing the voltage level leads to areduction of system currents and therefore of the respective energy losses. A consultation on thetreatment of losses by network operators was conducted by the European Regulators’ Group forElectricity and Gas7 for fourteen EU countries in 2008 and since, no update to the study has beencompleted8. Table 2-1 illustrates the percentage of losses per system level in selected EU countries from[7]. The average losses in transmission networks (TNs) in EU vary between 1-2.6% while fordistribution networks (DNs) between 2.3-13.4% [7]. This variation has mainly to do with the historicaldevelopment and current state of the grids in each country with regard to age, design etc. In general,distribution networks present the highest losses and the highest energy efficiency potential and thereforeare the focus of this study.
Table 2-1: Percentage of losses in transmission and distribution networks in selected EU countries.
6 Another source of fixed losses are corona losses, which occur in high voltage lines. They vary with the voltage level and thephysical wire diameter and with weather conditions such as rain and fog and are generally a very small percentage of the overallsystem losses.7 Referred to today as the Council of European Energy Regulators
8 Eurostat provides data on for total system losses for each EU country in 2014 but the breakdown of this data does not exist

IDENTIFYING ENERGY EFFICIENCY IMPROVEMENTS AND SAVING POTENTIAL IN ENERGY NETWORKS –INTERIM REPORT
GRIDEE/4NT/0364174/000/00 Ed. 2015/05/11 22/110
This
docu
men
tis
the
prop
erty
ofTr
acte
belE
ngin
eerin
gS.
A.An
ydu
plic
atio
nor
tran
smis
sion
toth
irdpa
rtie
sis
forb
idde
nw
ithou
tpr
ior
writ
ten
appr
oval
2.1.3 Components: Lines and Transformers
Power lines and transformers are the primary components of the infrastructure in electricity networks. Akey difference is that only variable losses occur in lines, while transformers are responsible for bothfixed and variable losses. Figure 2-3 presents how losses are distributed between these two keycategories of components for the different voltage levels and different EU countries. As can be seen, themajority of losses occur close to the customer, on low voltage (LV) networks followed by mediumvoltage (MV) grids. A high variation in energy losses in transformers can be observed, primarily due tothe age of the assets.
Figure 2-3: Mapping of losses based on voltage level and components for different EU countries (FR: [8], [9]; GER: [10], [11],[12], [13], [14]; UK: [2], [5], [15]; EU: [16], GIS Data)
In Figure 2-3, the sum of the losses of the EHV and HV grids in each country falls in the general rangeof transmission losses for transformers and lines expressed in the top row of the figure. For example, inGermany, transmission losses sum to 37% of the total grid losses which falls in the range of 13% and42%. The transmission losses are specifically high in this country compared to France and the UK, bothat 25%. This is due to high international transits and internal transits from north to south [17]. Similarly,the distribution of losses is not uniform across countries and depends on the specific grid conditions. Forexample, in France and UK line losses are higher in the MV grid compared to the LV grid, and inFrance, losses in LV transformers are higher than in LV lines, whereas in Germany losses are highest inLV lines. We discuss further the factors that affect the losses in each component.

IDENTIFYING ENERGY EFFICIENCY IMPROVEMENTS AND SAVING POTENTIAL IN ENERGY NETWORKS –INTERIM REPORT
GRIDEE/4NT/0364174/000/00 Ed. 2015/05/11 23/110
This
docu
men
tis
the
prop
erty
ofTr
acte
belE
ngin
eerin
gS.
A.An
ydu
plic
atio
nor
tran
smis
sion
toth
irdpa
rtie
sis
forb
idde
nw
ithou
tpr
ior
writ
ten
appr
oval
Transformers are the system components presenting both fixed and variable losses. Typically a third ofthe total system technical losses occur in transformers while fixed losses account for about two thirds oftotal transformer losses. The operational efficiency of transformers depends on the loading. The peakefficiency of distribution transformers reaches 99.4% at approximately 40-50% of rated capacity [18]. Inthe EU the average loading of distribution transformers in electricity distribution companies is 18,9%, farbelow optimal, rendering their efficiency at 98.38% [18]. Since transformers run round the clock formore than 40 years, a 0.1% marginal increase in efficiency of a transformer population leads tosignificant loss reductions. [18] conducted a unique study in 2008 comparing the operating efficiency ofnewly purchased versus the existing fleet of distribution transformers in electricity distributioncompanies across the EU. Figure 2-4 illustrates the results. On average, the efficiency of distributiontransformers in the E.U has the potential to increase by 0.35%.
Figure 2-4 Efficiency of distribution sector transformer population and market [18]
Lines
Power lines are the primary source of losses as indicated in Figure 2-3. Power line losses can beconsidered almost entirely as variable losses and are proportional to the conductor resistance and to thesquare of the current. Resistance of the line is equal to , where:
L is the length of the line, thus long lines have a higher R and higher lossesA is the cross sectional area , thus thicker lines lead to decreased line losses
the resistivity, which depends on the material of the line (copper oraluminium) and its temperature, hence a heated line leads to higher losses
The current represents the power flow fluctuation and has a quadratic effect which is discussed below.

IDENTIFYING ENERGY EFFICIENCY IMPROVEMENTS AND SAVING POTENTIAL IN ENERGY NETWORKS –INTERIM REPORT
GRIDEE/4NT/0364174/000/00 Ed. 2015/05/11 24/110
This
docu
men
tis
the
prop
erty
ofTr
acte
belE
ngin
eerin
gS.
A.An
ydu
plic
atio
nor
tran
smis
sion
toth
irdpa
rtie
sis
forb
idde
nw
ithou
tpr
ior
writ
ten
appr
oval
2.1.4 Marginal vs Average losses
The currents in a system vary based on the system loading. The variable losses are the sum of the lossesfor all operational instances, comprising of operational instances of high loading (marginal losses) and ofnormal loading (average losses). Average line losses are more often used when estimating power losses,due to the fact that they are measured by meters, while measuring marginal line losses requires advancedand expensive meters [19]. Since variable losses are proportional to the square of the current, marginallosses have a much higher contribution to the total sum. This is shown as an example in Figure 2-5where the losses from 3 cases of system loading are presented. In all cases the same energy istransported, but the loading profiles present a different variability. Smoother loading profiles lead tosignificant losses reduction, up to 20% for a flat profile.
Figure 2-5 Impact of smoothing the system loading on the reduction of variable losses
Therefore, losses increase disproportionally when the system loading is higher, which is actually whenthey cost more, since normally these are the cases when power prices are higher. Furthermore they createan increase in the system loading exactly at the times when there are less available generation resources.In this respect, efficiency measures that help reduce the marginal loading of the system would have ahigher contribution to the reduction of system losses [20].

IDENTIFYING ENERGY EFFICIENCY IMPROVEMENTS AND SAVING POTENTIAL IN ENERGY NETWORKS –INTERIM REPORT
GRIDEE/4NT/0364174/000/00 Ed. 2015/05/11 25/110
This
docu
men
tis
the
prop
erty
ofTr
acte
belE
ngin
eerin
gS.
A.An
ydu
plic
atio
nor
tran
smis
sion
toth
irdpa
rtie
sis
forb
idde
nw
ithou
tpr
ior
writ
ten
appr
oval
2.1.5 Role of DG and grid management
In the latest years, distribution networks experience increasing penetration levels of distributedgeneration (DG), in the form of small-to-medium size generating units connected in medium and lowvoltage networks. A large share of these units consists of renewable generators, namely wind turbines,CHP or PV panels. The general expectation has been that locating generation closer to demand couldreduce losses since the distance over which electricity is transported is shortened and the number ofvoltage transformation levels is reduced. [21] However, this is only true when the energy generated byDG and variable RES (VRES) units is consumed locally (synchronised to load, local balancing). [22] Inreality, such local balancing does not occur, either due to lack of a proper operational market frameworkor due to the stochastic nature of the prime energy mover (in the case of VRES). This unbalancedoperation can lead to increased network flows (and thus losses), often translated into reverse flows fromdistribution networks to transmission systems. Figure 2-6 presents the expected effect of increasingshares of non-synchronised DG to distribution network losses. In particular, losses are expected todecrease for low penetration levels, due to the fact that no significant reverse flows are expected but aftera certain level they increase due to the increased power flows they incur to the system. For example, [23]shows a study case in a LV grid in Switzerland where grid losses reach a maximum reduction of 20% at25% PV penetration. At a penetration level of 50%, they are equivalent to the case when there was noPV and further increase if more PV panels are installed.
Figure 2-6: Impact of increasing DG penetration level and asynchronism of generation and demand to grid losses [12]

IDENTIFYING ENERGY EFFICIENCY IMPROVEMENTS AND SAVING POTENTIAL IN ENERGY NETWORKS –INTERIM REPORT
GRIDEE/4NT/0364174/000/00 Ed. 2015/05/11 26/110
This
docu
men
tis
the
prop
erty
ofTr
acte
belE
ngin
eerin
gS.
A.An
ydu
plic
atio
nor
tran
smis
sion
toth
irdpa
rtie
sis
forb
idde
nw
ithou
tpr
ior
writ
ten
appr
oval
2.1.6 Reactive Losses
Currents in electricity systems comprise of the vector sum of two components, active (responsible for thetransmission of active power) and reactive currents (responsible for the energy alternately stored andreleased by inductors and/or capacitors). Reactive losses are due to the circulation of reactive currents,which are increased when the power factor9 is deviating from unity, and when voltage deviations areobserved. Local voltage control actions (reactive power injection or absorption) are the most widelyaccepted means for supporting voltages and reducing reactive losses in distribution networks. Intraditional distribution networks (comprising mainly of loads), the voltage drops at the end of the linedue the consumption of reactive power by the line when it is highly loaded. The placement of capacitorsfor local injection of reactive power to compensate for those losses is the state of the art solution forvoltage support. In [24] it is demonstrated that the use of such device reduce reactive losses by up to45% compared to the case where reactive power is transmitted from an external grid to compensate forthe voltage deviation. In distribution networks comprising of loads and DG, situations of over-voltagesare observed if the DG output exceeds the load. In [25] a case study analyses the effect of DG on thevoltage deviations of a 10 kV test distribution feeder with five equally distributed load of 0.5 MW each.Variable capacities of DG are connected to node 4.
.
Figure 2-7: Voltage profile of the test feeder for different generating scenarios [25]
9 Power factor is a ratio between the real power and apparent power flowing through a conductor.
IDENTIFYING ENERGY EFFICIENCY IMPROVEMENTS AND SAVING POTENTIAL IN ENERGY NETWORKS –INTERIM REPORT
GRIDEE/4NT/0364174/000/00 Ed. 2015/05/11 27/110
This
docu
men
tis
the
prop
erty
ofTr
acte
belE
ngin
eerin
gS.
A.An
ydu
plic
atio
nor
tran
smis
sion
toth
irdpa
rtie
sis
forb
idde
nw
ithou
tpr
ior
writ
ten
appr
oval
Figure 2-7 demonstrates that all possible load/DG scenarios need to be studied to assess the decrease ofreactive losses in the system. In this specific case a 3.2 MW DG capacity synchronised with the loadwould lead to almost no voltage deviation, hence minimizing reactive losses. However, in reality,utilities do not have control on the allocation or the size of DG that will be installed in their distributiongrid. Therefore different voltage support actions with different impacts are used. We discuss them in thenext section on voltage optimisation.
2.1.7 Imbalances
Electricity networks comprise three phase systems which (especially in distribution grids) serve single ordual phase loads. Imbalances in the loading between the three phases lead unavoidably to increasedcurrents in at least one phase, which increase marginal losses. Typically, imbalances occur on all parts ofthe low voltage network due to customers who use one or two phases with different load consumptions.In order to rebalance the network it is necessary to reconfigure phase loading to ensure that this capturesthe development of loads. This is normally done based on maximum customer load and cannot capturethe fluctuations of load profiles over time. In this respect, some imbalance is unavoidable [3]
2.1.8 Life cycle assessment: impact of losses on investment decisions
Losses are one key contributor to operational expenditures in power networks. Typically, optimalinvestment decisions translate in finding the components configuration that minimise the sum of initialinvestments and lifetime costs (Lifecycle costing – LCC). Due to the long lifetime of the network assets,adopting a LCC approach that includes losses can steer decision making when included in investmentanalysis. In the case of transformers, LCC shows that the purchase of energy efficient equipment couldbe optimal decision regardless of the higher initial capital costs. [18] Similarly, in the case of lines, anddue to the characteristics of variable losses, a LCC optimal decision leads to increased line capacities forreduction of losses. In distribution network design, the inclusion of the cost of losses leads to muchlower utilisation rates of the assets (thus higher installed capacities) in contrast to the practice of usingthe assets as much as possible to increase capital efficiency. [26] Consequently, there is a trade-offbetween the cost of financing surplus capacity and the cost of losses.

IDENTIFYING ENERGY EFFICIENCY IMPROVEMENTS AND SAVING POTENTIAL IN ENERGY NETWORKS –INTERIM REPORT
GRIDEE/4NT/0364174/000/00 Ed. 2015/05/11 28/110
This
docu
men
tis
the
prop
erty
ofTr
acte
belE
ngin
eerin
gS.
A.An
ydu
plic
atio
nor
tran
smis
sion
toth
irdpa
rtie
sis
forb
idde
nw
ithou
tpr
ior
writ
ten
appr
oval
2.2 Energy efficiency measures in electricity networks:categorisation and potential
Figure 2-8 presents the key energy efficiency measures and their categorisation in two main categories,a) the ‘traditional’ measures of component replacement, and b) measures that achieve a reduction oflosses by an improved management of the power system, either by controlling the network infeeds (localbalancing) or by grid management actions (such as network reconfiguration, voltage control, orelimination of imbalances).
Figure 2-8: Categorisation of key energy efficiency measures in electricity networks
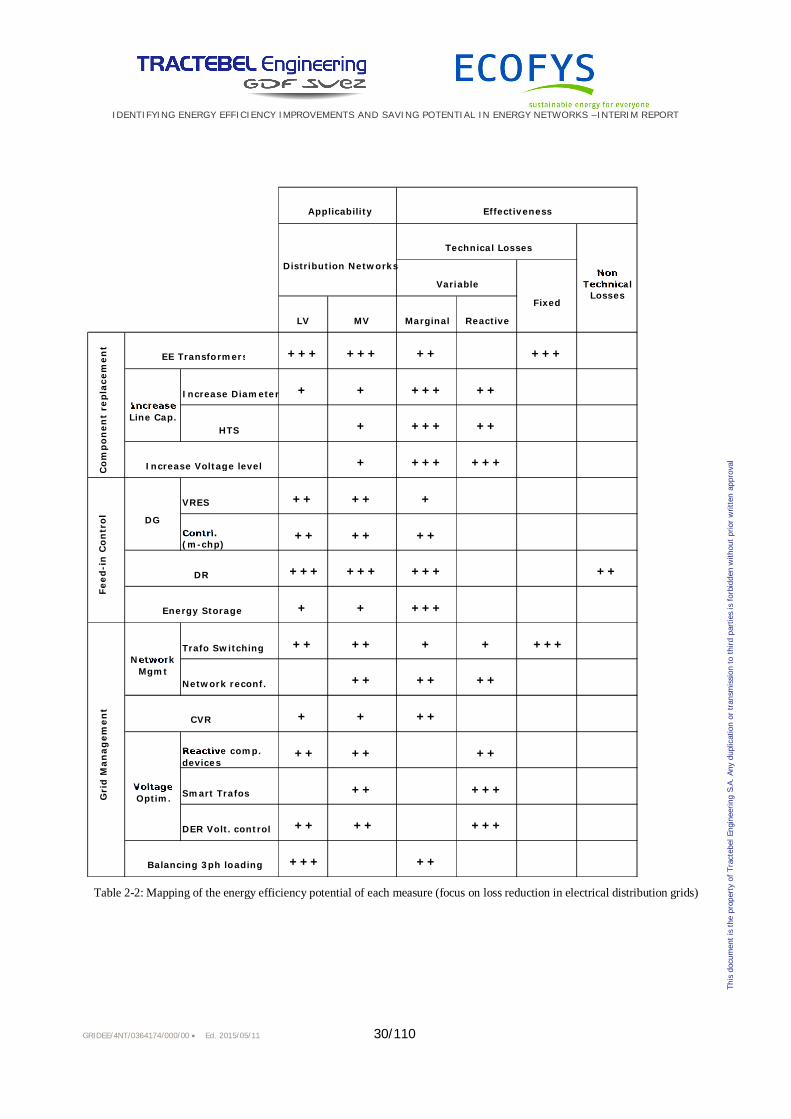
The loss reduction potential of each measure can be in principle analysed by the factors presented in theprevious section. Table 2-2 presents a mapping of the energy efficiency potential of each measure withrespect to the categorisation of losses presented in section 2.1 (table refers to distribution networks, asthey present the highest share of losses in the electricity system). As can be seen, each measure affects aset of factors and therefore the potential of each measure will depend on how losses are mapped in thespecific grid. The table presents two dimensions which together map the potential, firstly theapplicability of each measure on different voltage levels and secondly the effectiveness for loss reductionwhen the measure is applied. The combination of the two dimensions allows the estimation of thepotential, e.g. measures of high effectiveness but of poor applicability would rank low on potential.
E-EE gridMeasures
Componentreplacement
EETransformers
Increase Linecapacity
IncreaseVoltage level
Systemmanagement
Feed-inControl
DG
VRES
Controllable(micro-chp)
DemandResponse
EnergyStorage
Grid Mgmt
NetworkMgmt
Trafoswitching
Networkreconfiguration
CVRVoltageControl
On Load TapChanging Trafo
Reactive powercompensation(e.g. DFACTS)
DER Voltagecontrol
Balance 3-phline loading

IDENTIFYING ENERGY EFFICIENCY IMPROVEMENTS AND SAVING POTENTIAL IN ENERGY NETWORKS –INTERIM REPORT
GRIDEE/4NT/0364174/000/00 Ed. 2015/05/11 29/110
This
docu
men
tis
the
prop
erty
ofTr
acte
belE
ngin
eerin
gS.
A.An
ydu
plic
atio
nor
tran
smis
sion
toth
irdpa
rtie
sis
forb
idde
nw
ithou
tpr
ior
writ
ten
appr
oval
Concerning variable losses, a key differentiator is the point where the measure is applied. Systemloading at each voltage level corresponds to the sum of the loadings from the networks in underlyingvoltage levels. Therefore, measures generally affect losses from the network level where applied andupwards, making energy efficiency measures that apply to lower voltage levels the most efficient. Atypical example on this is demand response and demand flattening actions: applying such measure to LVnetworks will lead to a flattening of profiles to the higher system levels also, inducing a chain of lossreduction towards the upper levels. This also means that losses at the LV grid will only be influenced bymeasures at this voltage level, such as customer side demand response.
IDENTIFYING ENERGY EFFICIENCY IMPROVEMENTS AND SAVING POTENTIAL IN ENERGY NETWORKS –INTERIM REPORT
GRIDEE/4NT/0364174/000/00 Ed. 2015/05/11 30/110
This
docu
men
tis
the
prop
erty
ofTr
acte
belE
ngin
eerin
gS.
A.An
ydu
plic
atio
nor
tran
smis
sion
toth
irdpa
rtie
sis
forb
idde
nw
ithou
tpr
ior
writ
ten
appr
oval
Table 2-2: Mapping of the energy efficiency potential of each measure (focus on loss reduction in electrical distribution grids)
LV MV Marginal Reactive
+++ +++ ++ +++
Increase Diameter + + +++ ++
HTS + +++ ++
+ +++ +++
VRES ++ ++ +
Contrl.(m-chp)
++ ++ ++
+++ +++ +++ ++
+ + +++
Trafo Switching ++ ++ + + +++
Network reconf. ++ ++ ++
+ + ++
Reactive comp.devices
++ ++ ++
Smart Trafos ++ +++
DER Volt. control ++ ++ +++
+++ ++Balancing 3ph loading
Gri
dM
anag
emen
t
DR
Energy Storage
Feed
-in
Co
ntr
ol
CVR
DG
NetworkMgmt
VoltageOptim.
Applicability
EE Transformers
Increase Voltage levelCo
mp
on
ent
rep
lace
men
t
IncreaseLine Cap.
Distribution Networks
Variable
Fixed
Technical Losses
Effectiveness
NonTechnical
Losses
IDENTIFYING ENERGY EFFICIENCY IMPROVEMENTS AND SAVING POTENTIAL IN ENERGY NETWORKS –INTERIM REPORT
GRIDEE/4NT/0364174/000/00 Ed. 2015/05/11 31/110
This
docu
men
tis
the
prop
erty
ofTr
acte
belE
ngin
eerin
gS.
A.An
ydu
plic
atio
nor
tran
smis
sion
toth
irdpa
rtie
sis
forb
idde
nw
ithou
tpr
ior
writ
ten
appr
oval
2.2.1 Energy Efficient transformers
The key mechanism is the replacement of transformers with energy efficient ones10, which in most casesare larger and with higher capital cost. As transformers are responsible for both variable and fixed lossesin the system and their replacement is easier than changing cables or lines, this option presents a goodloss reduction potential, and affects almost all factors of losses, as shown in Table 2-2. As shown inFigure 2-3 most losses in transformers occur in distribution grids, therefore the potential of the measurein lower voltage levels is higher.
The asset replacement strategy depends on the state of the population, characterized by the age, size andtype of transformers. For an optimal investment decision the cost of losses should be taken into accountin a full LCC analysis. Such LCC estimation shows that efficient transformers have a payback period of2-13 years compared to less-efficient models when the cost of the lost energy is included to the cost ofpurchase [5].
The lifetime of transformers is typically around 40 years. In many cases however, assets are stilloperational beyond this point, but with significantly lower efficiency levels. As shown in [18], 20% ofthe oldest distribution transformers (installed before 1974) are responsible for 35% of the fixed lossesand 30% of the variable losses in the EU, approximately a total of 38 TWh of losses per year. Replacingthem with energy efficient transformers can help reducing these losses by 80% [5], leading to an annualsaving of 30TWh, equivalent to the annual electricity consumption of Denmark [27]. Furthermore, [28]quantified the impact of implementing the MEPS11 of the Ecodesign Directive till 2025 and found thatenergy savings of 84 TWh could be achieved compared to a business as usual scenario.
Western Power Distribution (DSO in UK) conducted a cost and benefit analysis including the values oflosses to know whether their transformers needs to be replaced. [3] The outcome of the study shows thatit is only beneficial to oversize their smallest units (pole or ground mounted) and to replace earlier thanplanned all pre-1958 ground mounted distribution transformers. The expected savings per annum reaches2.76 GWh, 97% coming from the replacement of the old transformers.
1010 Energy efficient transformers have reduced variable and fixed losses. To reduce variable losses, the resistance of thewires needs to be decreased, which can be done by increasing the cross sectional area or by using materials with a lowerresistance. To reduce fixed losses, one way is to use materials with better magnetic properties.
11 This option of the Mandatory Energy Performance Standards requires newly installed transformers to follow Top Efficientlevel of EN 50464-1 for Tier 1 (2015) and Least Life Cycle Cost for Tier 2 (2020).

IDENTIFYING ENERGY EFFICIENCY IMPROVEMENTS AND SAVING POTENTIAL IN ENERGY NETWORKS –INTERIM REPORT
GRIDEE/4NT/0364174/000/00 Ed. 2015/05/11 32/110
This
docu
men
tis
the
prop
erty
ofTr
acte
belE
ngin
eerin
gS.
A.An
ydu
plic
atio
nor
tran
smis
sion
toth
irdpa
rtie
sis
forb
idde
nw
ithou
tpr
ior
writ
ten
appr
oval
2.2.2 Increasing voltage level
Increasing voltage level reduces the currents required to distribute the same amount of electricity,increases current capacity of the grid and reduces substantially voltage drops and line losses. It presentsfurther indirect benefits such as reduction of probability of short circuits, increase of quality of supplyand it increases the DG hosting capacity. The measure typically applies to MV networks, where multiplevoltage levels are possible (e.g. 10kV and 20kV). In cases where the insulation coordination allows bothvoltage levels, it can be applied by changing only the transformers. In most cases however this is not thecase and a full renewal of all network components is necessary, which implies high costs. The measure isparticularly interesting to aging MV networks as it comes at little extra cost to up-rate the voltage [5].
As shown in Table 2-2, the applicability of the measure is mainly on MV grids and is deemed rather lowsince only a limited number of networks will fulfil the respective conditions for applying this measure.On the other hand, the potential of the method on reducing variable losses is high, in the cases thissolution is chosen.
The measure was applied in large scale in Ireland for upgrading the MV rural networks from 10kV to20kV [28]. These networks were designed in the 50’s for lower typical household consumptions and loaddensities, and were severely loaded and experiencing very poor voltage regulation. The costs of 20kVconversion were little more than those of rebuilding in 10kV, yet the voltage drop were halved, thermalcapacity doubled and losses reduced by 75%.
2.2.3 Increasing line capacity
Increasing cross-sectional area of cables leads to reduction of variable losses. Typically, doubling cablerating leads to a reduction of losses by a factor of four. However, once a cable is installed, it becomesexpensive to make alterations to the cable, since civil works cost element of replacing a cable outweighsany loss reduction benefits. The key opportunity to reduce losses therefore exists at the time that thecable is initially installed or replaced [3]. An alternative approach is to make use of high-temperaturesuperconductors (HTS) which present no resistance when they are cooled down at -180°C and can carryfive times the current of a conventional cable system with the same outer dimensions. The losses fromthis system are due to the energy needed to operate the cooling mechanism. [29]
As shown in Table 2-2, the applicability of cable up-rating is deemed medium, and the measure shouldbe applied in cases on new line installations or replacements. Applicability of HTS is deemed rather low,mainly for cases of high currents that need to be transported over relatively short distances. Bothmeasures have a high potential to reduce variable losses.
A CBA conducted by Western Power Distribution showed that is beneficial to uprate all the existing MVunderground cables from 6.6kV to 11 kV. The planning is to replace 700 km of cables per year andsavings are estimated at 3GWh per year. The study also showed that it is not beneficial to uprate the11kV network as these higher voltage network cables support adjacent networks in times of fault. [3]

IDENTIFYING ENERGY EFFICIENCY IMPROVEMENTS AND SAVING POTENTIAL IN ENERGY NETWORKS –INTERIM REPORT
GRIDEE/4NT/0364174/000/00 Ed. 2015/05/11 33/110
This
docu
men
tis
the
prop
erty
ofTr
acte
belE
ngin
eerin
gS.
A.An
ydu
plic
atio
nor
tran
smis
sion
toth
irdpa
rtie
sis
forb
idde
nw
ithou
tpr
ior
writ
ten
appr
oval
A 1 km 10 kV HTS cable was installed in 2014 to replace several 110kV underground cables connectingtwo 10 kV substations in Essen Germany. The cost of the energy needed to cool the cable down toeliminate its resistance over its lifecycle is found to be 15% lower than the cost of compensating lossesin conventional 110 kV cables. HTS are mentioned as the best technical and economically viablesolution to avoid the necessary extension of the 110 kV grid in urban areas. [29]
2.2.4 Feed-in control
This measure refers to applying control actions for local balancing of demand and supply in distributiongrids, which leads to reduction of variable losses due to two key factors, the reduction of energytransportation distance (energy is consumed locally) and the reduction of marginal losses (by a flatteningof flow profiles). This local balancing can be performed by three options for control actions, of supply(DG), of demand (demand response actions) or of energy storage (can be considered as supply anddemand)12. Under this measure the control of active power is considered. (Control of reactive power ofDGs is analysed under the Voltage Optimisation section).
The potential of this measure depends on three key factors, namely the ability for spatial and temporalmatching and the underlying technical limitations.
Spatial matching: it relates to the system architecture, namely DG penetration levels and relativeposition of dispersed supply and demand; a general rule of thumb is that the measure is moreeffective when supply and demand are close and when it is of similar rating.Temporal matching: it refers to the operational framework that should coordinate local balancing;such a framework is most of the times non-existent. Network losses are generally reduced for lowDG penetration levels, mainly due to the fact that independent of the coordination scheme generationdoes not exceed demand. For higher penetration levels however, this lack of coordination translatesinto reverse power flows and to a gradual increase of system losses (see Figure 2-6).Technical limitations: refer to the specific flexibility characteristics of the technology which revealthe degree of local coordination that can be achieved. Such limitations include DG controllability,demand elasticity and potential for peak shifting/clipping and the size and flexibility of the storagedevices.
12 New demand such as Electric Vehicles and Heat pumps are included in these categories, but with specific flexibility characteristics andlimitations due to their primary operation.

IDENTIFYING ENERGY EFFICIENCY IMPROVEMENTS AND SAVING POTENTIAL IN ENERGY NETWORKS –INTERIM REPORT
GRIDEE/4NT/0364174/000/00 Ed. 2015/05/11 34/110
This
docu
men
tis
the
prop
erty
ofTr
acte
belE
ngin
eerin
gS.
A.An
ydu
plic
atio
nor
tran
smis
sion
toth
irdpa
rtie
sis
forb
idde
nw
ithou
tpr
ior
writ
ten
appr
oval
As can be seen in Table 2-2, although VRES are generally present in MV and LV grids, theireffectiveness to perform local balancing actions is deemed rather low, mainly due to the fact that suchactions translate into reduction/curtailment of active power production. Controllable DG present amedium effectiveness, since although they are technically capable, they cannot perform such actions dueto lack of enabling operational framework. Demand response presents a high applicability and higheffectiveness on reduction of technical losses, which however depends on the technical potential ofdemand (peak shifting/clipping potential). This option presents also a medium potential for reduction ofnon-technical losses, since they are most of the time combined to smart metering infrastructure thatenables better monitoring of the creation of non-technical losses. Finally, energy storage presents a higheffectiveness on local balancing but a rather low applicability due to the low implementation of storagein distribution grids.
This impact is discussed in [30], where the potential of demand response from residential customers inreducing marginal losses of a Swedish distribution network is investigated. Results show that thisreduction varies from 4%, (if 10% of the peak load is shifted) to a maximum of 18%, if the load profileis flattened. The Model City Mannheim project proved effectively after having developed, installed andtested smart control systems in 1000 households that the price elasticity of customers to variable tariffswas 10% [31], which means that 10% of the demand could be shifted when the price of electricityincreased by 10%. In other terms, the 4% reduction of marginal losses mentioned in [30] is feasible.This translates into annual savings of 350 MWh, equivalent to the electricity consumption of 55households in Sweden [32].
The IMPROGRESS project analysed the impact of distributed generation on three distribution networkin Germany, Spain and Netherlands [33]. The different characteristics of each area were taken account:medium and low voltage networks, urban and semi-urban areas, number of customer, shares of wind andPV and CHP and a forecast for load demand and DG penetration till 2020 was applied. The areas studiedare Aranjuez in Spain (industrial, wind and CHP), Mannheim in Germany (residential, lots of PV roofand micro-CHP) and Kop van Noord (lots of wind and CHP) in the Netherlands. The feed-in controlaction consisted on one hand of curtailing VRES or storing the excess power in an electric heat boilerand on the other shifting the demand from periods with low DG penetration to those where most CHPunits were running. The study showed that if feed-in control is practiced instead of expanding the LVgrid to cope with the forecast growth of DG until 2020, 97 €/kWDG in Netherlands can be saved, 77€/kWDG in Germany and 73 €/kWDG in Spain. The potential savings calculation includes the Net PresentValue of the electrical losses that would have been caused by the increasing penetration levels of DG ineach distribution grids.

IDENTIFYING ENERGY EFFICIENCY IMPROVEMENTS AND SAVING POTENTIAL IN ENERGY NETWORKS –INTERIM REPORT
GRIDEE/4NT/0364174/000/00 Ed. 2015/05/11 35/110
This
docu
men
tis
the
prop
erty
ofTr
acte
belE
ngin
eerin
gS.
A.An
ydu
plic
atio
nor
tran
smis
sion
toth
irdpa
rtie
sis
forb
idde
nw
ithou
tpr
ior
writ
ten
appr
oval
In [34], energy storage is used to shift load from peak to off-peak period and the impact on reducingtransmission and distribution losses is analysed. The authors developed a set of normalized charts toquantify the saved T&D losses as a function of the size of the energy storage device, its efficiency andthe load shifting potential (i.e the ratio of the off-peak to peak load). Based on an existing 1 MW batterystorage system installed for shifting a peak load from 20 MW to 6 MW in a 12 kV distribution feeder inVirginia USA, the authors estimate that 1 to 3% of T&D losses could be saved which translates in 180 to330 MWh year of energy saved including the storage losses. The authors demonstrate that it is morebeneficial to distribute small size storages at different locations rather than using a big size at a singlesite to maximize the reduction of T&D losses.
Within [14] the German Federal Ministry of Economics (BMWi) examines various measures to improvethe integration of VRES into the distribution grids. One of the key findings is that the curtailment of 1%of the annual feed-in of VRES reduces the necessary grid extensions by 30%. A curtailment of 3% of theenergy annually produced by VRES would be sufficient to avoid 40% of the required grid extensions.The effectiveness of curtailment measures rapidly decreases if more than 3% of the annual feed-in ofVRES is curtailed.
2.2.5 Transformers switching
Fixed losses can be reduced without replacing equipment by reducing the number of energisedtransformers in the system. This can be achieved by eliminating transformation steps or by switching offtransformers. Elimination of transformation steps could be achieved by direct coupling of higher voltagelevels to lower ones without the use of intermediate transformers (use of a single transformation step).Alternatively, switching off transformers could be possible in periods of low demand for configurationswhere multiple transformers are required in a substation to meet peak load or for redundancy. This canbe achieved via an ‘Auto Stop Start’ System that allows to periodically de-energise redundanttransformers in substations.
As shown in Table 2-2, the potential of the measure is high on reduction of fixed losses. In addition toreducing the fixed losses, this measure also reduces the variable (and marginal) losses by improving ofthe loading of the energised transformers. The effectiveness of the measure in different voltage levelsdepends on the redundancy configurations used. In this respect, the measure is especially effective inMV or LV networks where redundant transformers are often in use.
Case studies show a 75% loss reduction in MV networks, equivalent to the loss reduction achieved byupgrading the 11kV network to 20 kV, however at about 1% of the upgrade cost. The project is inexecution phase led by the Scottish and Southern Electric Power Distribution and will end in 2018 tovalidate the scale of loss reductions (640 MWh/year) and to confirm that repeated switching did notimpact the asset lives and the supply security. [35].

IDENTIFYING ENERGY EFFICIENCY IMPROVEMENTS AND SAVING POTENTIAL IN ENERGY NETWORKS –INTERIM REPORT
GRIDEE/4NT/0364174/000/00 Ed. 2015/05/11 36/110
This
docu
men
tis
the
prop
erty
ofTr
acte
belE
ngin
eerin
gS.
A.An
ydu
plic
atio
nor
tran
smis
sion
toth
irdpa
rtie
sis
forb
idde
nw
ithou
tpr
ior
writ
ten
appr
oval
2.2.6 Network reconfiguration
The measure involves changing network topology at the distribution level dynamically by usingautomated switching actions. Typical implementations are Smart Feeder Switching (SFS) and AdvancedDistribution Management Systems (ADMS). The configuration of the network has an effect on losses interms of the distance the electricity is transported. MV networks are typically configured as open loopsand are controlled in order to be able to isolate faults and restore power. As the demand changes spatiallyand in time, it is often the case that the configuration of a network is not the optimal one for the specificdemand situation. There might therefore be some scope for reducing losses by reconfiguring thenetwork, to provide shorter, more direct paths to where highest demand is situated. SFS and ADMS aretypical implementation for performing automated switching actions on distribution feeder systemsenabling a reduction of distribution system losses [36], [15], [37].
As shown in Table 2-2, the measure involves reduction of variable losses mainly in MV networks, wheresuch configurations are employed and its potential is defined as medium. The potential depends on thereconfiguration frequency and the spatial and temporal variations of power demand. A limitation may beif the switch-disconnector equipment is designed for a limited number of operations per lifetime (e.g.1.000) [15], which limits the applicability of control actions. Typically, for systems with high penetrationlevels of intermittent DG (especially wind generators), which experience higher and random spatial andtemporal demand variations, higher switching frequencies are necessary.
Results from field pilot projects reported in [15] show that network reconfiguration may lead to atheoretical reduction of losses of 40% for an hourly reconfiguration (which however cannot be applieddue to limitations of the switching equipment), and up to 20%, 10%, 4% if the reconfiguration is madeon a weekly, seasonal or yearly basis respectively.
2.2.7 Conservation voltage reduction
Conservation Voltage Reduction (CVR) is a reduction of active power delivered to demand resultingfrom a reduction of feeder voltage within the operational ranges. CVR schemes typically contain twofundamental components: a) reactive power compensation, achieved through the operation of shuntcapacitors in order to maintain the power factor at the substation transformer within a prescribed band,and b) voltage optimization, achieved through the operation of substation voltage regulators in order toregulate the voltage at specific end of line points within a prescribed range. In this way the peak load andthe annual energy consumption are reduced. [9] When applied on LV networks, the measure can beapplied by changing settings at the primary substation [3].

IDENTIFYING ENERGY EFFICIENCY IMPROVEMENTS AND SAVING POTENTIAL IN ENERGY NETWORKS –INTERIM REPORT
GRIDEE/4NT/0364174/000/00 Ed. 2015/05/11 37/110
This
docu
men
tis
the
prop
erty
ofTr
acte
belE
ngin
eerin
gS.
A.An
ydu
plic
atio
nor
tran
smis
sion
toth
irdpa
rtie
sis
forb
idde
nw
ithou
tpr
ior
writ
ten
appr
oval
The applicability of the method depends on the type of load in the system. The method typically applieswell to ‘voltage dependent’ loads such as filament lamps and resistive heating13. However, increasinglymore load is ‘voltage independent’, as it is fed via a switched mode power supply, which effectivelychanges its impedance based on voltage (such as HF fluorescent, LED, PCs VFD fed motors). Thereforelowering voltage may not, in all circumstances, lead to the demand savings as desired and could actuallyincrease losses. [2] Therefore, the measure is considered of low applicability and medium effectiveness,as presented in Table 2-2.
According to [38], utilities applying CVR may expect to see 1% reductions in electricity consumptionfor every 1% reduction in voltage. Detailed analysis of CVR schemes in US show that they can lead topeak demand reduction of 1 to 2.5% [38] and annual energy reduction of 4% [9] Western PowerDistribution is planning a voltage reduction trial in the South Wales area on their MV networks from11.4kV to 11.3kV and anticipates reduction of 95MWh which will reduce the customer bills by acalculated €13M each year and carbon emissions by 41 000 tonnes a year. [39]
2.2.8 Voltage optimisation
Voltage optimisation refers to reduction of reactive losses by the application of local voltage controlactions (reactive power injection or absorption) aiming at local correction of the power factor. Theplacement of capacitors for local injection of reactive power is the state of the art solution for voltagesupport for passive networks (networks including mainly loads). In distribution networks comprising ofloads and DGs, the fluctuating generation profiles lead to situation of over-voltages (when localgeneration exceeds demand) or under-voltages (in situations of high demand and no DG production).Voltage support actions should therefore be performed dynamically and react to the conditions in eachoperational instance in order to optimise the feeder voltage profiles.
This is made possible through recent improvements in sensors, communications, control algorithms, andinformation processing technologies that allow to monitor voltage levels throughout the distributionsystem. This information is sent to devices that can adjust voltage regulating equipment and capacitorbanks on distribution feeders in near-real time enabling quick adjustments in response to constantlychanging load and voltage conditions. Options to perform such actions are installing smart reactivepower compensation devices (e.g. D-FACTS, see [40]), using on-load tap changing (OLTC) voltagecontrol actions at the distribution transformers [41], or by using the capabilities of converters for powerfactor correction [12] in the case of converter-connected DG14.
13 As the resistance of these devices is largely fixed, applying a lower voltage reduces the current drawn, less power istransferred and hence overall load is reduced.14 Typically converters can adjust the power factor at the point of connection, by changing the injection or consumption ofreactive power.

IDENTIFYING ENERGY EFFICIENCY IMPROVEMENTS AND SAVING POTENTIAL IN ENERGY NETWORKS –INTERIM REPORT
GRIDEE/4NT/0364174/000/00 Ed. 2015/05/11 38/110
This
docu
men
tis
the
prop
erty
ofTr
acte
belE
ngin
eerin
gS.
A.An
ydu
plic
atio
nor
tran
smis
sion
toth
irdpa
rtie
sis
forb
idde
nw
ithou
tpr
ior
writ
ten
appr
oval
As shown in Table 2-2, there are difference between the applicability and effectiveness of the options.Smart reactive power compensation devices are applied mainly on MV grids but their applicability isconsidered medium mainly due to cost limitations. Their effectiveness is high, since they can be appliedto specific grid points. The applicability of OLTC is considered medium and their effectiveness is alsodeemed medium, since their operation can be limited in cases when multiple feeders are connected to thetransformer (voltage control actions from OLTC affect all feeders at the same time and this may lead toconflicts). [25] DER voltage control is considered as a highly effective option with medium applicabilitymainly due to the fact that DER should be converter connected and because the effectiveness ofcontrolling voltage profiles by controlling reactive power from DG is best applied to feeders with lowresistance to reactance (R/X) ratio [23]. As shown in [23] reactive power control from PV panels in a LVgrid (<1kV) in Switzerland would not be effective if the line diameters connecting the panels to thefeeder were not larger than 50 mm2, i.e. the R/X ratio lower than 5.
In [38], the results from 26 voltage optimisation programs are reported. The voltage optimisationanalysis focused on CVR and on reduction of energy losses along feeders, by automated switching ofcapacitor banks. Results reported that for the 31 feeders under investigation half of witnessed line lossreductions in the range of 0% to 5%, and 5 feeders experienced loss reductions greater than 5%. Feederswith the worst baseline power factors (i.e., those with the highest amount of inductive loads) showed thegreatest reductions in line losses. Overcompensation was observed in some feeders, which resulted inline loss increases.
In [12] a study case is presented, investigating the role of reactive power compensation coming from DGon decreasing grid losses in the North of Germany. The analysis involves two MV grid areas of similarsize in load and number of connected customers but with different DG penetration levels with respect toload demand (Area 1 with 45% and Area 2 with 146%). The DG mix analysed consisted of 90% windpower plants and 10% biomass plants. The results shows that grid losses would decrease by 15% in Area1 if DG plants were adapting their power factor between a ±0,05 window but would increase by 3% inArea 2. The results confirm that the effectiveness of reactive power provision from DG plants isdependent on the grid topology and DG penetration level.
In [41] a study case is presented, investigating the role of dynamically controlled OLTC on decreasinggrid losses. Six additional wind generation sites of 14 MW are connected to a generic MV radialdistribution system in the UK which needs to supply an annual energy demand of 215 GWh and a peakload of 38MW. If the wind generation sites are operating at a fixed unit power factor, the OLTC helpsreduce grid losses annually from 2,8% to 2.3%, saving 1 GWh per year, equivalent to the average annualconsumption of 240 houses in the UK [42]. [14] states that a full penetration of OLTC in Germanywould reduce the average yearly grid expansion costs by 10%.

IDENTIFYING ENERGY EFFICIENCY IMPROVEMENTS AND SAVING POTENTIAL IN ENERGY NETWORKS –INTERIM REPORT
GRIDEE/4NT/0364174/000/00 Ed. 2015/05/11 39/110
This
docu
men
tis
the
prop
erty
ofTr
acte
belE
ngin
eerin
gS.
A.An
ydu
plic
atio
nor
tran
smis
sion
toth
irdpa
rtie
sis
forb
idde
nw
ithou
tpr
ior
writ
ten
appr
oval
2.2.9 Balancing loading of lines
As mentioned, imbalances are a common phenomenon in LV networks where single- or double-phasecustomers are connected to the three-phase system. These imbalances lead to having one phase carryinghigher currents, giving rise to variable losses. The measure is to statically or dynamically transfer loadsfrom one feeder to another to balance the total load across multiple feeders and transformers. As thedemand changes in time, optimally balancing should be performed in short time periods and reacting todemand changes. [2]
The applicability of the measure is considered high and is limited to LV networks, as presented in Table2-2. Its effectiveness is considered medium, depending on the frequency of balancing that can beachieved.
As discussed in [3], imbalances in the LV network can lead to neutral currents of around 35% of thephase current. The annual potential savings from imbalance correction in this respect are in the order of€70 to €110 per kilometre of LV network. An analysis of the effect of load balancing on the reduction ofpower losses in 12 feeders of a LV distribution power network in Russia is presented in [43]. The resultsshow that the reduction of technical power losses after load balancing varies from 0% to 16% dependingon each feeder configuration. A total of 13 MWh could be saved per year equivalent on average to theannual consumption of 100 customers. It is important to note that this specific regional power networkalready experienced high distribution losses of 18% in 2007. Reference [44] suggests the use of three-phase balancing PV units that are able to inject more power in one phase than in the other phasescompared to single-phase PV units that inject only in one phase. The case study of typical Belgian LVnetwork proves that the three phase balancing PV units could help decrease grid losses by 30% saving 7GWh per year.
2.3 Regulatory regimes to promote loss reduction inelectricity grids
2.3.1 Regulatory incentives: basic options
Various regulatory incentives exist to motivate network operators in investing in energy efficiency(particularly loss reduction) in their networks. Some key options are reported below.

IDENTIFYING ENERGY EFFICIENCY IMPROVEMENTS AND SAVING POTENTIAL IN ENERGY NETWORKS –INTERIM REPORT
GRIDEE/4NT/0364174/000/00 Ed. 2015/05/11 40/110
This
docu
men
tis
the
prop
erty
ofTr
acte
belE
ngin
eerin
gS.
A.An
ydu
plic
atio
nor
tran
smis
sion
toth
irdpa
rtie
sis
forb
idde
nw
ithou
tpr
ior
writ
ten
appr
oval
TECHNICAL STANDARDS FOR CONDUCTORS AND TRANSFORMERS
A very effective measure that leads to an overall improvement in efficiency is setting mandatorystandards on a European level. In such cases, the national regulatory design should allow a higherCAPEX allowance to grid operators as savings in OPEX will over-compensate them in the long run.Based on the EU Ecodesign Regulation, new power transformers installed after July 2015 need tomeet a minimum energy efficiency standard.
FINANCIAL INCENTIVES
In general financial incentives to increase efficiency can be of various forms, e.g. grants, loans or taxbreaks. They can also be set via lower interest rates for energy-efficient investments. To furthermotivate and simplify investments, specific energy-efficiency budgets can be set up. Given that thetransmission and distribution networks are regulated industries, the most appropriate way to deliverfinancial incentives would seem to be via the existing regulations.Another option regulators can use is setting individual targets for network losses for grid operatorswhich can be a mechanism that financially penalises or rewards deviations from the target. This canbe a strong incentive for grid operators to improve in operational performance while leaving themfree space to decide on the most effective measure.
OBLIGATION OR CERTIFICATE SCHEMES
With obligations or certificates for energy efficiency and energy savings, grid operators are givenspecific shares of losses (and savings) that they have to meet, just like the option of financialincentives. In many schemes, there is also the option to trade certificates to meet the obligation. Incase of not conforming to the obligation, penalties (financial or not) can be set to promote actions tomeet the obligation which is a key difference to financial incentives.
VOLUNTARY AGREEMENTS
Regulators can start by setting voluntary agreements with grid operators which would comprise non-binding guidelines e.g. for a maximum share of grid losses in power transmission and distribution. Itcan acquire the market participants’ attention on the issue and provide alignments on grid operation.
INFORMATION CAMPAIGNS TO OVERCOME LACK OF MOTIVATION
There are two potential areas where lack of information might influence: with the regulators notunderstanding completely the case for energy efficiency and not setting the proper regulatoryframework and with grid operators not having all the information for a business decision. Aninformation campaign about best practices set up by the regulator can overcome such barriers.

IDENTIFYING ENERGY EFFICIENCY IMPROVEMENTS AND SAVING POTENTIAL IN ENERGY NETWORKS –INTERIM REPORT
GRIDEE/4NT/0364174/000/00 Ed. 2015/05/11 41/110
This
docu
men
tis
the
prop
erty
ofTr
acte
belE
ngin
eerin
gS.
A.An
ydu
plic
atio
nor
tran
smis
sion
toth
irdpa
rtie
sis
forb
idde
nw
ithou
tpr
ior
writ
ten
appr
oval
2.3.2 State of play of regulatory mechanisms targeting loss reduction
The following key insights regarding regulatory mechanisms to support grid energy efficiency measures(particularly regarding loss reduction) have been derived from the survey with European systemoperators carried out within this study (see ANNEX II):
o The incentive to pursue specific investments for loss reduction is strictly related to the presenceof regulatory incentives. A wide variety of regulatory frameworks are present in EuropeanMember States, which in some cases do not explicitly support energy efficiency measures.
o Energy efficiency (and particularly loss reduction) is the main driver of investments when thereis the need to comply with regulatory requirements and quality standards (e.g. EcoDesigndirective). In general, loss reduction is considered as one of the variables of a larger investmentoptimization plan.
o Energy Efficiency measures which require the exploitation of DER flexibility have still limiteddiffusion in many Member States, often just at pilot level. Their implementation would requirethe definition of new regulatory mechanisms over how DSOs can procure and activate DERflexibility.
Table 2-3 presents a synthesis of the different mechanisms in force among the respondents.
Bonus/malus following the level oflosses
DSOs from the Slovak Republic, Sweden (for 2016), the UK andPortugal report that they have specific incentives that directlytarget loss reduction, in form of bonuses or penalties dependingon the perfomances.
Cost reduction (Revenue capregulation)
DSOs from Bulgaria and The Netherlands report that they areincentivised to perform losses reductions since it is part of theircosts, and since the regulation targets a general reduction of thecost. Loss reduction is therefore not a first driver if other costreduction opportunities are found.
Maximum loss threshold DSOs from Bulgaria, Czech Republic, France and Germanyreport that they have an obligation to respect a given lossthreshold, overpassing them leading to audit or non-recognition ofthe costs. However, this gives no incentives to go further if theircurrent loss level is under the limit.
Benchmark among other DSOs DSOs from Spain report that loss reduction is addressed by abenchmarking of all Spanish DSOs on their performance toreduce losses.
Table 2-3 - Regulatory incentives for energy efficiency measures highlighted by survey respondents

IDENTIFYING ENERGY EFFICIENCY IMPROVEMENTS AND SAVING POTENTIAL IN ENERGY NETWORKS –INTERIM REPORT
GRIDEE/4NT/0364174/000/00 Ed. 2015/05/11 42/110
This
docu
men
tis
the
prop
erty
ofTr
acte
belE
ngin
eerin
gS.
A.An
ydu
plic
atio
nor
tran
smis
sion
toth
irdpa
rtie
sis
forb
idde
nw
ithou
tpr
ior
writ
ten
appr
oval
More generally, it is clear that proper regulatory incentives are necessary to stimulate loss reductioninvestments. Absence of such regulation often brings the opposite effect, and acts as disincentive fornetwork operators. There are two main elements in the tariff regulations which may act as an incentive ordisincentive to invest in energy efficiency measures of the grid:
a. the way the tariff is calculated, which determines the amount that can be charged to theconsumer; and
b. Whether there is an incentive regulation for minimising operational costs.
Tariffs are usually calculated on the basis of all relevant operational costs of transmission anddistribution of electricity. In this respect, grid operators can transfer the costs for purchasing energy tomake up for losses directly to the consumers. A clear disincentive to invest in loss reduction measures istypically the case when the regulatory framework does not introduce a cap to the amount of losses thatcan be transferred to the customer, combined to financial penalties for trespassing the limit. In suchcases, infrastructure investment decisions are based on the minimisation of capital costs only, withoutincluding of the operational life cycle costs. Hence low cost, and subsequently non-energy efficientequipment is chosen over advanced efficient equipment.

IDENTIFYING ENERGY EFFICIENCY IMPROVEMENTS AND SAVING POTENTIAL IN ENERGY NETWORKS –INTERIM REPORT
GRIDEE/4NT/0364174/000/00 Ed. 2015/05/11 43/110
This
docu
men
tis
the
prop
erty
ofTr
acte
belE
ngin
eerin
gS.
A.An
ydu
plic
atio
nor
tran
smis
sion
toth
irdpa
rtie
sis
forb
idde
nw
ithou
tpr
ior
writ
ten
appr
oval
3 POTENTIAL OF MEASURES ONPLANNING/OPERATIONAL EFFICIENCY INELECTRICITY GRIDS
In this chapter we analyse the impact of measures proposed in chapter 2 on the broader aspects ofefficiency in infrastructure design and operation.
In particular we consider planning/operational efficiency in terms of:
Optimization of investment planning - Traditionally, new capacity investments (gridreinforcement or expansion) have been directly related to the increase of demand. With thegrowing penetration of distributed generation, increasing the hosting capacity of DG is alsobecoming an important driver of grid planning decisions.
In this respect, the new options offered by active grid management hold a significant potential inoptimizing the long term planning process. In particular, the use of flexibility of distributedenergy resources is currently being explored as an alternative to traditional grid reinforcements15
16. A specific focus on the use of demand flexibility to optimize grid planning decisions will becarried out in the second part of this study.
Investments in assets replacements could also be optimized. Measures presented in chapter 2 canin fact contribute to decrease stressful conditions in the grid that could lead to faults ofcomponents and a reduction of their useful life.
Optimization of grid operation - The reduction of losses is one important aspect of theoptimization of grid operation. It has been extensively analysed in chapter 2 and will not betaken into account in this chapter. Other value streams for optimization of grid operation (OPEXreduction) iInclude:
Reduction of outage times (e.g. via implementation of network automation)Improvement of quality of supply and reduction of customer complaintsReduction of maintenance costs (e.g. by minimizing stressful operating conditions forgrid assets)…
15 Regulatory Recommendations for the Deployment of Flexibility, EC Smart Grid Task Force Expert Group 3, January 2015
16 Study on the effective integration of Distributed Energy Resources for providing flexibility to the electricity system, Report toThe European Commission, April 2015https://ec.europa.eu/energy/sites/ener/files/documents/5469759000%20Effective%20integration%20of%20DER%20Final%20ver%202_6%20April%202015.pdf

IDENTIFYING ENERGY EFFICIENCY IMPROVEMENTS AND SAVING POTENTIAL IN ENERGY NETWORKS –INTERIM REPORT
GRIDEE/4NT/0364174/000/00 Ed. 2015/05/11 44/110
This
docu
men
tis
the
prop
erty
ofTr
acte
belE
ngin
eerin
gS.
A.An
ydu
plic
atio
nor
tran
smis
sion
toth
irdpa
rtie
sis
forb
idde
nw
ithou
tpr
ior
writ
ten
appr
oval
In the following sections, we analyze in detail the factors affecting the cost-effectiveness of each of theproposed measures considering key aspects of planning/operational efficiency.
Implementation examples and best practices collected in the stakeholder survey (ANNEX III) and inrelated literature are used for illustration.
3.1 Impact of selected energy efficiency measures onoperational efficiency
3.1.1 High efficiency transformers
Planning/Operational efficiency Assets to deploy
Investment planning Grid operation Hardware Software Communication
Technologystandardization
Lighter weight
Technology standardisation
Reduced fault rate
High efficiencyTransformers
Possible benefits on planning/operational efficiency
Benefits on investment planningSome benefits could be achieved in term of investmentoptimization. Indeed, limiting the number of technologiespresent on the grid may lead to stronger purchasingpositions in the market, depending of the local marketorganisation, and may also lead to O&M cost reduction(less various types of operation).
In case of pole-mounted transformers, lightertransformers might also reduce the need for investmentsin pole replacements.
Enexis (The Netherlands) is replacing olderMV/LV transformers with existing but morerecent transformers (left over from otherregular replacements, such as capacityincrease). 150 transformers have been alreadyreplaced out of their 53000 MV/LVtransformers, at an average cost of 5300€/transformers. 0.1% of loss reduction isestimated to results from those replacements,which shows a significant potential since only0.3% of the assets have been replaced.

IDENTIFYING ENERGY EFFICIENCY IMPROVEMENTS AND SAVING POTENTIAL IN ENERGY NETWORKS –INTERIM REPORT
GRIDEE/4NT/0364174/000/00 Ed. 2015/05/11 45/110
This
docu
men
tis
the
prop
erty
ofTr
acte
belE
ngin
eerin
gS.
A.An
ydu
plic
atio
nor
tran
smis
sion
toth
irdpa
rtie
sis
forb
idde
nw
ithou
tpr
ior
writ
ten
appr
oval
Benefits on grid operations
Aging transformers might present a higher fault rate than up-to-date transformers. Replacing mostproblematic assets will save O&M cost. According to the economic assessment carried out by the Asia-Pacific Economic Cooperation [46], replacing transformers in order to comply with current performancestandards leads to long-term savings, including additional operation cost saving (in each of the 20studied countries, positive net present values were observed in their 2016-2030 plans).
Assets to deploy - Investments costs
The costs of a transformer have a wide range of variability depending on the power rating. In [45],astudy from the Indian government, it was showed that cost differences are high between their “1 star”and the “5 star” transformers of small power rating (50% of difference for a 25 kVA transformer) butthose difference get smaller at higher power (27% for a 200 kVA transformers, for a cost estimated at3390 €17 for 5 star transformer). However, according to a study carried out in the Asia Pacific EconomicCopperaiton [46], it appears that, installed capacity being equal, the cost-effectiveness of switching tohigher standard is higher when replacing small transformers. Cost-effectiveness can be maximized if themeasure is implemented within a planned asset replacement campaign. For instance, when replacingtransformers at the end of their useful life, CEZ (DSO in Czech Republic), has found it economicallyconvenient to opt for upper class transformers despite a 20% higher price, thanks to energy efficiencyimprovements.
3.1.2 Expanding line capacity
Planning/Operational efficiency Assets to deploy
Investment planning Grid operation Hardware Software Communication
Standardization Reduced SAIDI
Improve voltage quality
Cables None None
Possible benefits on planning/operational efficiency
Benefits on investment planningSome optimization of investment planning can be achieved via the limitation of the number of the cablessizes in use. In fact this can lead to standardization of equipment on the network, and thus to an averagepurchase price reduction.
17 Change rate $ to €: 1$ = 0.894 € (11/05/2015)

IDENTIFYING ENERGY EFFICIENCY IMPROVEMENTS AND SAVING POTENTIAL IN ENERGY NETWORKS –INTERIM REPORT
GRIDEE/4NT/0364174/000/00 Ed. 2015/05/11 46/110
This
docu
men
tis
the
prop
erty
ofTr
acte
belE
ngin
eerin
gS.
A.An
ydu
plic
atio
nor
tran
smis
sion
toth
irdpa
rtie
sis
forb
idde
nw
ithou
tpr
ior
writ
ten
appr
oval
Benefits on grid operationsOversizing the conductors decreases the impedance of the line, resulting in lower voltage drop.Therefore, a positive impact on voltage quality of the grid should be obtained.
A limitation of the current flowing through the line could reduce the probability of default (and the agingof the line). Moreover, by standardizing the line type, higher standardization of field works could beachieved, reducing the overall O&M costs.
Assets to deploy - Investments costs
It is difficult to give an accurate cost for such a measure,since it strictly depends on the implementationconditions (overhead lines or underground cables, size,voltage level, type of conductors, etc.). However, thecost of oversizing line sections can be relatively small inthe case of installation works (particularly in case ofcables) which are already planned. Western PowerDistribution (see [3]) decided to size up their currentstandard LV cables to discontinue their smallest-sizeMV cables. The study shows that sizing up 95mm²cables to 185mm² adds a cost of 14€/m18, whileexcavation costs range between 70€/m and 140€/m.
18 Change rate £ to €: 1£=1.3793 € (11/05/2015)
Východoslovenská distribu ná (DSOfrom Slovak republic) has increased themaximal conductor section of their LVnetwork from 70mm² to 150mm². While thefirst driver of this measure was to reachhigher voltage quality, they expect anominal losses reduction of up to 20% atpeak load, and 5% on average (dependingon the intensity of operation). The increasein investment was minimized and managedby process changes in the procurementprocedure. The asset costs represent up to10% of the project costs. However, a fullroll-out was deemed to be too costly, due tocosts of other grid elements such as poles.

IDENTIFYING ENERGY EFFICIENCY IMPROVEMENTS AND SAVING POTENTIAL IN ENERGY NETWORKS –INTERIM REPORT
GRIDEE/4NT/0364174/000/00 Ed. 2015/05/11 47/110
This
docu
men
tis
the
prop
erty
ofTr
acte
belE
ngin
eerin
gS.
A.An
ydu
plic
atio
nor
tran
smis
sion
toth
irdpa
rtie
sis
forb
idde
nw
ithou
tpr
ior
writ
ten
appr
oval
3.1.3 Increasing voltage level
Planning/Operational efficiency Assets to deploy
Investment planning Grid operation Hardware Software Communication
Deferred capacityinvestment
Life time extension
Technologystandardisation
Increase DG hostingcapacity
Improvement of voltagequality
Reduction of DG curtailment
Improvement of continuity ofsupply
Fitted lines cables
HV/MVsubstations:
TransformersMV cells(protections,switches…)Rails
MV/LVsubstations:
MV cells(protections,switches…)
Transformers
None None
Possible benefits on planning/operational efficiency
Benefits on investment planningSince increasing the voltage level reduces the current flowing through the conductors to meet the samepower, networks reinforcement can be deferred. This is particularly true if only a limited number ofassets need to be replaced. In their plan (see in [47]) to convert their rural 10kV network to 20kV, theIrish DSO operator ESB Networks aims to double their thermal capacity while reducing peak losses.Future investments to expand the grid could also be reduced thanks to an optimization of the number ofsubstations.
As shown in [48], power line aging is mainly due to itstemperature profiles along its lifetime. This temperatureprofile depends on the ambient air, the weather, type ofsoil, etc. but also the temperature generated by the carriedcurrent. Generally, less heavily utilized assets presentlower risks of overheating. This could extend theirlifetime.
A higher voltage level might also increase DG Hostingcapacity.
Vattenfal (Sweden) is carrying out anoptimisation of voltages levels in theirregional grids. The analysis is performedarea per area, taking into account thenetwork topology and the load level. 5 to15% of loss reduction has been observed inareas where voltage increase has beenadopted.

IDENTIFYING ENERGY EFFICIENCY IMPROVEMENTS AND SAVING POTENTIAL IN ENERGY NETWORKS –INTERIM REPORT
GRIDEE/4NT/0364174/000/00 Ed. 2015/05/11 48/110
This
docu
men
tis
the
prop
erty
ofTr
acte
belE
ngin
eerin
gS.
A.An
ydu
plic
atio
nor
tran
smis
sion
toth
irdpa
rtie
sis
forb
idde
nw
ithou
tpr
ior
writ
ten
appr
oval
Finally, reducing the number of voltage levels across the grid allows stronger standardization of networktechnologies. As discussed in the previous section, this can lead to benefits both in terms of CAPEX andOPEX.
Benefits on grid operationsA higher voltage level typically leads to better voltage quality (less significant voltage drop along thelines - for example [47] reports that a 10kV to 20kV conversion can halve the voltage drop/rise for agiven power withdrawn/injected).
According to [49], a decentralized grid (more small transformers closer to the consumer), beside leadingto high loss reduction (47% in reported case studies), also improves the reliability of the system (failurehours/years 4-5 times lower).
Assets to deploy - Investments costs
The cost of this measure strictly depends on the specific implementation scenario. A detailed study mustbe carried out to estimate the full cost of such a measure (e.g. assessment of which additional assets needto be replaced to sustain the new voltage level etc.).
A plan for voltage level increase can also be pursued by targeting a progressive increase of the share ofthe HV/MV grid with respect to the LV grid when undertaking new grid investments. In their replies tothe survey, the system operators HEDNO (Greece) and EDP (Portugal) indicate that their plan of lossreduction foresees a progressive increase of the number of MV/LV substations.
3.1.4 Demand response
Planning/Operational efficiency Assets to deploy
Investment planning Grid operation Hardware Software Communication
Line extended lifetime
Deferred capacityinvestment
DG hosting capacityincrease
SAIDI reduction
Lower DG curtailment
Smart Meter
Sensors for feedersmonitoring
Ripple controlinjector
Radio
Optic fibre
PLC
GSM

IDENTIFYING ENERGY EFFICIENCY IMPROVEMENTS AND SAVING POTENTIAL IN ENERGY NETWORKS –INTERIM REPORT
GRIDEE/4NT/0364174/000/00 Ed. 2015/05/11 49/110
This
docu
men
tis
the
prop
erty
ofTr
acte
belE
ngin
eerin
gS.
A.An
ydu
plic
atio
nor
tran
smis
sion
toth
irdpa
rtie
sis
forb
idde
nw
ithou
tpr
ior
writ
ten
appr
oval
Possible benefits on planning/operational efficiency
Benefits on investment planningThe implementation of demand response allows shaving peak loads, reducing the need of grid capacityincrease and possibly extending the lifetime of the assets (by reducing their utilisation). Demandresponse could also increase the DG hosting capacity of the grid, by allowing local balancing of DGunits injection. Grid reinforcements might therefore be deferred/avoided.
Detailed analysis of the impact of demand response on grid planning will be carried out in the secondpart of this study.
Benefits on grid operationsDemand response can be used to prevent loads in feeders or other assets to reach critical values thatmight determine asset faults. In this way, the average SAIDI can be reduced. Moreover, flexible loadcontrol synchronized with local DG units could reduce to a reduction of DG energy curtailment due toover/under voltage or to line overloading.
Assets to deploy - Investments costs
The on-going implementation of smart metering infrastructure in most European Member States isproviding the enabling infrastructure to carry out demand response activation, increasing the cost-effectiveness of this measure for energy efficiency.
Other necessary assets to deploy include grid sensors to increase the observability of the grid,particularly in terms of feeder loading, to adapt the DSOs activation of demand response to actual gridconditions.
Finally, another possible option for DSOs to activate demand response consists in adopting Time-of-Usetariffs based on ripple control. In this case, DSO’s might have to invest in local ripple injectors.
3.1.5 Feed-in control of distributed generation & storage
Planning/Operational efficiency Assets to deploy
Investment planning Grid operation Hardware Software Communication
Line extended lifetime
Deferred capacityinvestment
Customers’ investments
DG hosting capacityincrease
Power Quality problemsreduction
Voltage problems reduction
Lower restoration operations
Converter with“smart”functionalities
Smart Meter
Storage system
Extra connectionslines
Radio
Optic fibre
PLC
GSM

IDENTIFYING ENERGY EFFICIENCY IMPROVEMENTS AND SAVING POTENTIAL IN ENERGY NETWORKS –INTERIM REPORT
GRIDEE/4NT/0364174/000/00 Ed. 2015/05/11 50/110
This
docu
men
tis
the
prop
erty
ofTr
acte
belE
ngin
eerin
gS.
A.An
ydu
plic
atio
nor
tran
smis
sion
toth
irdpa
rtie
sis
forb
idde
nw
ithou
tpr
ior
writ
ten
appr
oval
Possible benefits on planning/operational efficiency
Benefits on investment planningAn efficient feed-in control (including reactive power management) can lead to capacity investmentdeferral, by reducing the peak demand from the MV/LV substation. Reducing peak demand can alsotypically reduce the aging of the component.
Benefits on grid operationsAs seen in [51], efficient DG converters might providecompensation in term of harmonics, voltage, reactivepower and phase balancing control. This might reducecomplaints from clients and the number of fieldinterventions.
Assets to deploy - Investments costs
In the case of a control strategy with directcommunication link between DG units and the DSO(for DSOs to send set-points for the DG controlsystem), an important cost item is related to thecommunication infrastructure between the DG unitsand the DSO.
It is worth mentioning that DG converters on the market are increasingly equipped with built-in SmartFunctionalities, with limited cost premiums. Retrofitting costs need to be foreseen for older-generationconverters to enable them for more advanced feed-in control schemes.
Storage system may also be coupled with DG units to provide a better feed-in control. In that case, thecost accrues to the DG owner. According to [50], storage systems could also be installed by DSOs whendemand growth is uncertain, as a temporary solution to defer investment, letting time to assess whichreinforcement are really needed
ERDF (France) is studying theimplementation of local voltage regulator toperform reactive power management of DGon the MV grid. The choice of the finalsystem has been based on a trade-off betweenthe gain on hosting capacity and the gain onvoltage losses, and its optimized value of thereactive to active power ratio and a reactivepower regulation based on voltage. Thesystem is currently in implemented two caseson their MV grid. The expectation is areduction of 2-3% in losses, and to an overallcost reduction of 5% compared to a case withno reactive power control, thanks to avoidedreinforcement. OPEX reduction is alsoexpected, since the system self-adapts whennew DG are connected.

IDENTIFYING ENERGY EFFICIENCY IMPROVEMENTS AND SAVING POTENTIAL IN ENERGY NETWORKS –INTERIM REPORT
GRIDEE/4NT/0364174/000/00 Ed. 2015/05/11 51/110
This
docu
men
tis
the
prop
erty
ofTr
acte
belE
ngin
eerin
gS.
A.An
ydu
plic
atio
nor
tran
smis
sion
toth
irdpa
rtie
sis
forb
idde
nw
ithou
tpr
ior
writ
ten
appr
oval
3.1.6 Network reconfiguration
Planning/Operational efficiency Assets to deploy
Investment planning Grid operation Hardware Software Communication
Deferred capacityinvestment
Line extended lifetime
Reduced fault rate
Reduced restoration time
Improved voltage quality
Remote controlledswitches andreclosers insubstation
Feeders monitoringsystem
AdvanceSCADA/DMS
Controlsoftware
Radio
Optic fiber
PLC
GSM
Possible benefits on planning/operational efficiency
Benefits on investment planningThe drivers of automatic grid reconfiguration are typically loss reduction and reduced number ofinterrupted customers. However, a better balance between the different feeders reduces the peaks onthose lines, therefore potentially reducing the aging of the lines, and reducing replacement costs.
Benefits on grid operationsIncreasing the number of remotely controlled switches reduces the number of substations to be inspectedwhen a fault occurs. In a study ( [52]) carried out by the US Department of Energy within 5 utilities, theuse of remotely controlled switches reduced the number of interrupted customer by 35%. The use ofautomatic control for fault management leads this number to 55%. By better balancing the load in thefeeders, voltage drop can also be reduced.
According to [53], a simulation of an automation algorithm to control the AES Sul grid (Brazil) showedthat a 8.2% reduction of interrupted customer per year can be achieved. Moreover, the solution preventsfault occurrences by reconfiguring the grid before a critical value is reached. The benefits are particularlyhigh in the case of rural networks.
Assets to deploy - Investments costs
The main cost item of the measure is the installation of remotely controlled switches and reclosers and(if not already available) of the associated communication infrastructure. According to [36], various U.S.utilities report that they have implemented this measure at a cost ranging between 18.750 € and 35.750 €per installed switch, including software, monitoring and communication system. For example, Adams-Colombia Cooperative mentioned a cost of 20.400 € for an overhead switch and 35.750 € for anunderground one. Voltage level is one of the key drivers of the cost value.

IDENTIFYING ENERGY EFFICIENCY IMPROVEMENTS AND SAVING POTENTIAL IN ENERGY NETWORKS –INTERIM REPORT
GRIDEE/4NT/0364174/000/00 Ed. 2015/05/11 52/110
This
docu
men
tis
the
prop
erty
ofTr
acte
belE
ngin
eerin
gS.
A.An
ydu
plic
atio
nor
tran
smis
sion
toth
irdpa
rtie
sis
forb
idde
nw
ithou
tpr
ior
writ
ten
appr
oval
However, it is possible to implement network reconfiguration manually, without relying on a remotecommunication system, and still capture interesting benefits, particularly on loss reduction. Enexis (DSOin The Netherlands) (manually) reconfigured the open points in 300 MV loops out of 44000km of theirMV grid, achieving a loss reduction of 0.5%, at a reported cost of 670€/loop (according to their replies tothe survey).
3.1.7 Switching off redundant transformers
Planning/Operational efficiency Assets to deploy
Investment planning Grid operation Hardware Software Communication
Asset extended lifetime Remotely controlledtransformers switches
AdvancedSCADA/DMSControlsoftware
RadioOptic fiberPLCGSM
Possible benefits on planning/operational efficiency
Benefits on investment planning
Switching off redundant transformers reduces their use and aging, possibly deferring needs forreplacements.
Assets to deploy - Investments costs
Switching off/on redundant transformers can be performed manually. However, this critically increasesthe restoration time in case of the loss of the energized transformer. Implementation of remote and/orautomatically controlled switches is thus to be preferred. The cost of transformer switches may varysignificantly, depending on their power rating.
3.1.8 Voltage optimisation
Planning/Operational efficiency Assets to deploy
Investment planning Grid operation Hardware Software Communication
Line extended lifetime
Increase networkcapacity
Increase DG hostingcapacity
Power Quality problemsreduction
Voltage problems reduction
Facilitate DG integration
D-Facts: MV/LVSTATCOM, SSSC…
Capacitor banks
On-Load Tap changetransformers
Voltage sensors
Smart Meters
AdvancedSCADA/DMS
Controlsoftware(centralizedsystem)
Radio
Optic fibre
PLC
GSM

IDENTIFYING ENERGY EFFICIENCY IMPROVEMENTS AND SAVING POTENTIAL IN ENERGY NETWORKS –INTERIM REPORT
GRIDEE/4NT/0364174/000/00 Ed. 2015/05/11 53/110
This
docu
men
tis
the
prop
erty
ofTr
acte
belE
ngin
eerin
gS.
A.An
ydu
plic
atio
nor
tran
smis
sion
toth
irdpa
rtie
sis
forb
idde
nw
ithou
tpr
ior
writ
ten
appr
oval
Possible benefits on planning/operational efficiency
Benefits on investment planning
Optimization of reactive power flows allows betterexploitation of line capacity, reducing lines loading andpossibly increasing their useful life. Voltage optimisationcan also compensate the voltage rise/drop due to DGinjection, allowing more units to be connected on the grid.In [56], it was shown that voltage control through on-loadtap changing transformer was cost-efficient to increase thegrid hosting capacity, deferring expensive linereinforcement.
Benefits on grid operationsReactive power management systems can be equipped to compensate harmonics injections.By regulating the voltage level of the grid, complains due to over/under-voltage can be mitigated andDG curtailment reduced.
Assets to deploy - Investments costs
Different options exist to carry out voltage optimization. In a substation, On-Load Tap Changing (OLTP)transformers can be installed to keep voltage within an acceptable range while optimising the operationof the grid. This solution can be more cost-effectively pursued by foreseeing an OLTP when replacing anexisting transformer.
Devices injecting or absorbing reactive power can also be installed in various places of the grid. Ideally,the best reactive power reduction and power factor correction is performed by placing compensationdevices the closest to the load. However, due to installation and operation cost, a trade-off is to be foundbetween cost, loss reduction and voltage constraints [54]. The length of the network and the voltagestability of the system are therefore key parameters.
Different technologies (fixed capacitors banks, STATCOM, etc. ) can be adopted. It should be noticedthat, according to [55], self-commutated compensators have the highest impact on losses while having alower cost than synchronous condenser or static compensator technologies. Manually controlled/remotecontrolled capacitor banks could also be considered. The cost of the system will depend on the KVArrating of the installed devices.
To ensure more granular voltage optimisation, feeders voltage sensors or Smart Meters can also beinstalled to adjust the voltage regulation to the actual grid voltage profiles.
CEZ (Bulgaria) plans to install capacitors andharmonics filtering equipment in two 110kV/20kVsubstations and in one 110kV/20kV substation. CEZestimates an investment costs 176k€/substation of
expense and CEZ expects a saving of 474k€/annum,coming from less power quality problems to becompensated to the customers, less complaints overvoltage fluctuation, reduction of losses, reduction ofequipment overheating and their aging.
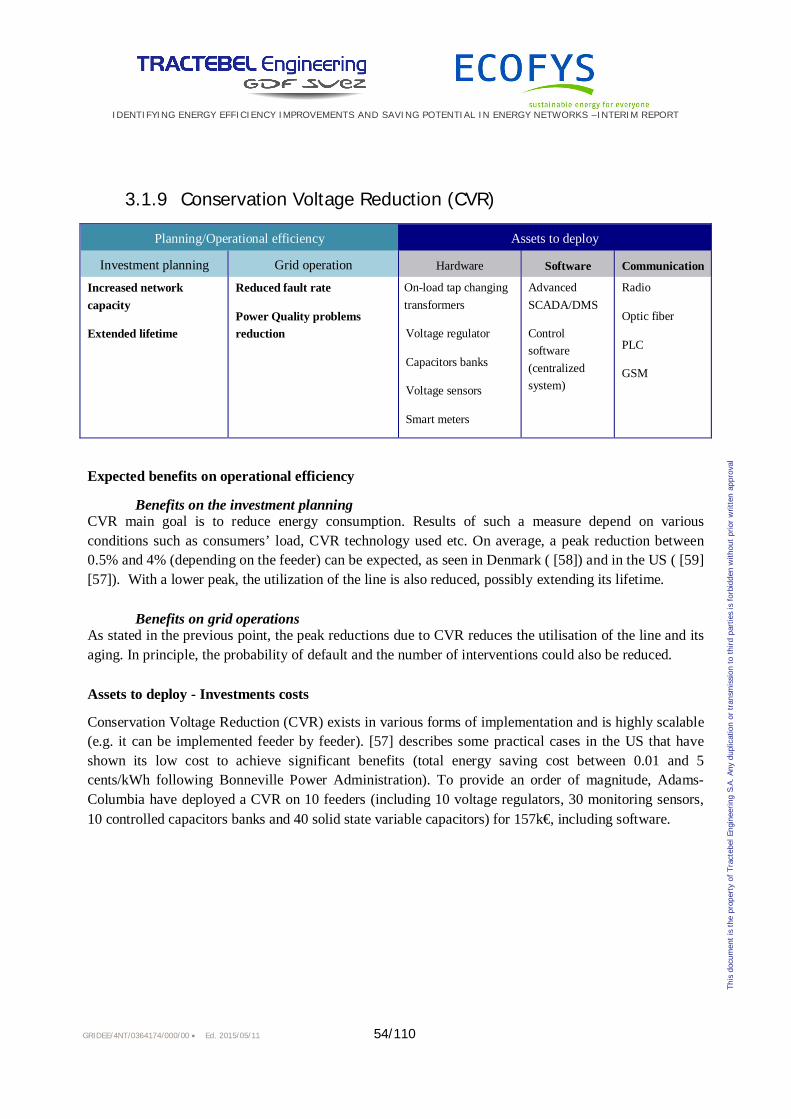
IDENTIFYING ENERGY EFFICIENCY IMPROVEMENTS AND SAVING POTENTIAL IN ENERGY NETWORKS –INTERIM REPORT
GRIDEE/4NT/0364174/000/00 Ed. 2015/05/11 54/110
This
docu
men
tis
the
prop
erty
ofTr
acte
belE
ngin
eerin
gS.
A.An
ydu
plic
atio
nor
tran
smis
sion
toth
irdpa
rtie
sis
forb
idde
nw
ithou
tpr
ior
writ
ten
appr
oval
3.1.9 Conservation Voltage Reduction (CVR)
Planning/Operational efficiency Assets to deploy
Investment planning Grid operation Hardware Software Communication
Increased networkcapacity
Extended lifetime
Reduced fault rate
Power Quality problemsreduction
On-load tap changingtransformers
Voltage regulator
Capacitors banks
Voltage sensors
Smart meters
AdvancedSCADA/DMS
Controlsoftware(centralizedsystem)
Radio
Optic fiber
PLC
GSM
Expected benefits on operational efficiency
Benefits on the investment planningCVR main goal is to reduce energy consumption. Results of such a measure depend on variousconditions such as consumers’ load, CVR technology used etc. On average, a peak reduction between0.5% and 4% (depending on the feeder) can be expected, as seen in Denmark ( [58]) and in the US ( [59][57]). With a lower peak, the utilization of the line is also reduced, possibly extending its lifetime.
Benefits on grid operationsAs stated in the previous point, the peak reductions due to CVR reduces the utilisation of the line and itsaging. In principle, the probability of default and the number of interventions could also be reduced.
Assets to deploy - Investments costs
Conservation Voltage Reduction (CVR) exists in various forms of implementation and is highly scalable(e.g. it can be implemented feeder by feeder). [57] describes some practical cases in the US that haveshown its low cost to achieve significant benefits (total energy saving cost between 0.01 and 5cents/kWh following Bonneville Power Administration). To provide an order of magnitude, Adams-Columbia have deployed a CVR on 10 feeders (including 10 voltage regulators, 30 monitoring sensors,10 controlled capacitors banks and 40 solid state variable capacitors) for 157k€, including software.

IDENTIFYING ENERGY EFFICIENCY IMPROVEMENTS AND SAVING POTENTIAL IN ENERGY NETWORKS –INTERIM REPORT
GRIDEE/4NT/0364174/000/00 Ed. 2015/05/11 55/110
This
docu
men
tis
the
prop
erty
ofTr
acte
belE
ngin
eerin
gS.
A.An
ydu
plic
atio
nor
tran
smis
sion
toth
irdpa
rtie
sis
forb
idde
nw
ithou
tpr
ior
writ
ten
appr
oval
3.1.10 Balancing 3-phase loads
Planning/Operational efficiency Assets to deploy
Investment planning Grid operation Hardware Software Communication
Line extended lifetime
Deferred capacityinvestment
Reduced neutral fault rate
Power Quality improvement
LV phases switches inMV/LV substation
Feeders loadmonitoring system
Three-phasesconnections
Phase switches atconnections
Smart meters
AdvancedSCADA/DMS
Controlsoftware(centralizedsystem)
Radio
Optic fibre
PLC
GSM
Expected benefits on operational efficiency
Benefits on the investment planningUnbalanced feeders lead to higher currents flowing in one of the single-phase lines, which might reachits limit faster than the others. Balancing phases might thus extend the lifetime of the lines.
Benefits on grid operationsPhase balancing reduces intervention and complaints due to Power Quality problems. Problems resultingfrom current in neutral lines can be reduced (up to 35% of the phase current could circulate in severallines according to [3]), since no zero current is flowing in a perfectly balanced system.
Assets to deploy - Investments costs
Various techniques can be considered to perform phase balancing.
1. Phase-switching between single-phase line can already be performed manually on a regular basis(seasonal for instance) to create a more balanced three-phase system, based on long term feedersload measurement. It is clearly the cheapest approach but the impact is limited.
2. The above technique can also be performed automatically, based on load measurements tooptimise the impact.
3. Switches at connections: a more effective phase balancing can be performed by dynamicallyswitching the phase a user is connected to, according to the user’s load. This requires to have athree-phase connection for every single-phase user, and to have Smart Meters to measure thecurrent. This technique is however much more expensive than the previous one.
4. Balancing DG injection: according to [60], replacing three-phase inverters by three single-phaseinverters can control the injection phase by phase to balance the network.

IDENTIFYING ENERGY EFFICIENCY IMPROVEMENTS AND SAVING POTENTIAL IN ENERGY NETWORKS –INTERIM REPORT
GRIDEE/4NT/0364174/000/00 Ed. 2015/05/11 56/110
This
docu
men
tis
the
prop
erty
ofTr
acte
belE
ngin
eerin
gS.
A.An
ydu
plic
atio
nor
tran
smis
sion
toth
irdpa
rtie
sis
forb
idde
nw
ithou
tpr
ior
writ
ten
appr
oval
4 COST-EFFECTIVENESS OF ENERGY EFFICIENCY
MEASURES IN ELECTRICITY GRIDS
The goal of this chapter is to analyze in detail the cost-effectiveness of Energy Efficiency for electricitygrids. The excel tool described in ANNEX V provides a step-by-step decision support to carry out theassessment.
4.1 Assessment of cost-effectiveness
Cost-effectiveness of each measure is defined as the ratio between the associated benefits and costs. Thisentails looking at the benefits and the implementation costs associated to each energy efficiencymeasure. Apart from reducing energy losses, ad discussed in previous chapters, it is considered that EEmeasures could also provide additional benefits in terms of reduction of OPEX (e.g. restoration time,power quality issues etc.) for the DSO and of avoidance of grid investments (CAPEX reduction).
The analysis consists in individual assessment of all potential benefits and of implementation costs ofenergy efficiency measures. The output is a ranking of individual energy efficiency measures accordingto their cost-effectiveness.
The proposed methodology is synthetized in Figure 4-1.
The assessment of the cost-effectiveness of energy efficiency measures has the following characteristics:
Focus on individual EE measures – The focus is on detailed assessment ofindividual EE measures. The analysis does not consider the perspective of a largerinvestment plan which also includes a set of EE measures.Assessment of grid energy efficiency benefits according to the following keydimensions
o Reduction of grid losseso Deferral/avoidance of grid investmentso Increase of RES hosting capacityo Reduction of outages (security of supply)o Power Quality
Analysis of implementation costs and of factors affecting costs - The assessmentof the investment costs of each measure is done considering the capital andoperational costs and the factors affecting them. Moreover, we also look intooptions for optimization of investments (e.g. replacing assets at the end of usefullife).

IDENTIFYING ENERGY EFFICIENCY IMPROVEMENTS AND SAVING POTENTIAL IN ENERGY NETWORKS –INTERIM REPORT
GRIDEE/4NT/0364174/000/00 Ed. 2015/05/11 57/110
This
docu
men
tis
the
prop
erty
ofTr
acte
belE
ngin
eerin
gS.
A.An
ydu
plic
atio
nor
tran
smis
sion
toth
irdpa
rtie
sis
forb
idde
nw
ithou
tpr
ior
writ
ten
appr
ovalFigure 4-1 - Methodology for assessment of cost-effectiveness of individual EE measures
4.2 Synthesis of the cost effectiveness of themeasures
Table 4-1, Table 4-3 –, and Error! Reference source not found. provide a synthetic qualitativeindication of levels of benefits and costs of the different measures. The assessment assumes the stand-alone implementation of a given measure (no synergies with other measures or other investments) on aper-unit basis.
Clearly, as mentioned, the cost-effectiveness of each measure strongly depends on the specific gridconditions where it is implemented. Provided qualitative value are only intended to provide initialguidance in comparing the different measures. Table 4-4 summarizes the key factors to consider whencustomizing the cost effectiveness analysis of ach measures to the specific grid conditions. A detailedanalysis of these factors is provided in Annex I.
Ranking of EE measures

IDENTIFYING ENERGY EFFICIENCY IMPROVEMENTS AND SAVING POTENTIAL IN ENERGY NETWORKS –INTERIM REPORT
GRIDEE/4NT/0364174/000/00 Ed. 2015/05/11 58/110
This
docu
men
tis
the
prop
erty
ofTr
acte
belE
ngin
eerin
gS.
A.An
ydu
plic
atio
nor
tran
smis
sion
toth
irdpa
rtie
sis
forb
idde
nw
ithou
tpr
ior
writ
ten
appr
oval
Component replacement
Measure Lossreduction
Deferredinvestment
REShostingcapacity
Securityof supply
Powerquality
improvement
Cost
Type Level
EETransformers
++/+++ +/0 + + -Delta cost in case of
planned replacement /new installation
-Full cost in case ofproactive replacement
Low tohigh
Oversizing linecapacity
+++ ++ + -Delta cost in case ofplanned replacement /new installation
-Full cost in case ofproactive replacement
Low tohigh
Increasevoltage level
+++ +++ ++ + -Limited adaptation (incase of already voltagecompliant equipment)
-Massive replacementof all equipment
Low tovery high
Table 4-1 – Efficiency & cost of component replacement measures
Grid management
Measure Lossreduction
Deferredinvestment
REShostingcapacity
Securityof supply
Powerquality
improvement
Cost
Type Level
Networkreconfig.
++ + ++ ++ -Mainly software in caseof existing remote
switches
-Full installation ofsoftware and remoteswitches
Low tohigh
Transformerswitching
+/+++ ++ - -Labour work only incase of manual switching
-Full installation of newremote switches
Very lowtomedium
Voltage opt. +++/++ + +++ +++ - Mainly software in caseof existing equipment
-Full new equipmentdeployment (e.gcapacitor/OLTP)
Mediumto high
CVR ++ ++ ++ ++ - Mainly software in caseof existing equipment
-Full new equipmentdeployment (e.g
Medium

IDENTIFYING ENERGY EFFICIENCY IMPROVEMENTS AND SAVING POTENTIAL IN ENERGY NETWORKS –INTERIM REPORT
GRIDEE/4NT/0364174/000/00 Ed. 2015/05/11 59/110
This
docu
men
tis
the
prop
erty
ofTr
acte
belE
ngin
eerin
gS.
A.An
ydu
plic
atio
nor
tran
smis
sion
toth
irdpa
rtie
sis
forb
idde
nw
ithou
tpr
ior
writ
ten
appr
oval
capacitor/OLTP)
Bal. 3-ph.Load
++ + + ++ -Labour work only in
case of manual switching
-Full installation of newremote switches
Low tohigh
Table 4-2 – Efficiency & cost of grid management measures
Feed-in control
Measure Lossreduction
Deferredinvestment
REShostingcapacity
Securityof supply
Powerquality
improvement
Cost
Type Level
Demandresponse
+++ +++ ++ ++ Depending on theregulation
Low tomedium
DG control +/++ ++ ++ ++ ++ Depending on theregulation
Low tomedium
Table 4-3 –– Efficiency & cost of feed-in control measures

IDENTIFYING ENERGY EFFICIENCY IMPROVEMENTS AND SAVING POTENTIAL IN ENERGY NETWORKS –INTERIM REPORT
GRIDEE/4NT/0364174/000/00 Ed. 2015/05/11 60/110
This
docu
men
tis
the
prop
erty
ofTr
acte
belE
ngin
eerin
gS.
A.An
ydu
plic
atio
nor
tran
smis
sion
toth
irdpa
rtie
sis
forb
idde
nw
ithou
tpr
ior
writ
ten
appr
oval
Hig
hef
ficie
ncy
trans
form
ers
Expa
ndin
glin
eca
paci
ty
Incr
ease
volta
gele
vel
Net
wor
kre
conf
igur
atio
n
Switc
hing
-off
redu
ndan
ttra
nsfo
rmer
s
Dem
and
resp
onse
Feed
-inco
ntro
l&st
orag
e
Vol
tage
optim
isat
ion
Con
serv
atio
nV
olta
geR
egul
atio
n
Bal
anci
ng3-
phas
elo
ad
Factorsimpactingtheefficiencyof themeasure
Load rate X X X X X X X X XAge of the assets X XFault rate X X X X XHigh harmonics problems X XTransformers power rating XGrid length X XVoltage issues X X X X XFeeders load unbalance XNumber of switches XAverage restoration time XPresence of a repartition grid XNumber of transformers in parallel XDG curtailment level X XDistance between DG and consumersPower factor XDG penetration rate XNumber of voltage level XVoltage level XNeutral conductors issues X
Factorsimpactingthe cost ofthemeasure
Overhead underground grid X X X X X X XUrban rural network X X X X XTransformers accessibility XAge of the assets X XOther replacement/expansion plans X X X X X X X XTechnology standardization X X XAsset fitted for an upper voltage XGrid expansion / load growth XVoltage level X XDG integration XPenetration of the communication system X X X X XFlexibility market XSmart Meter roll-out plan X X X XDG incentive to customer XCombination with CVR XLV consumers’ density XLV substation density X
Table 4-4 – Factors impacting the overall efficiency and the cost of the measures

IDENTIFYING ENERGY EFFICIENCY IMPROVEMENTS AND SAVING POTENTIAL IN ENERGY NETWORKS –INTERIM REPORT
GRIDEE/4NT/0364174/000/00 Ed. 2015/05/11 61/110
This
docu
men
tis
the
prop
erty
ofTr
acte
belE
ngin
eerin
gS.
A.An
ydu
plic
atio
nor
tran
smis
sion
toth
irdpa
rtie
sis
forb
idde
nw
ithou
tpr
ior
writ
ten
appr
oval
5 ASSESSMENT OF THE ENERGY EFFICIENCY
POTENTIAL IN GAS GRIDS
5.1 Understanding Energy Losses in gas networks
The natural gas transmission and distribution system consists of a complex network of pipelines. Asdetailed in Table 5-1, in the European Union, it represents more than 2150 thousand kilometres ofpipelines.
Table 5-1: Length of gas transmission and distribution pipelines in Europe (Source: Gas Infrastructure Europe)

IDENTIFYING ENERGY EFFICIENCY IMPROVEMENTS AND SAVING POTENTIAL IN ENERGY NETWORKS –INTERIM REPORT
GRIDEE/4NT/0364174/000/00 Ed. 2015/05/11 62/110
This
docu
men
tis
the
prop
erty
ofTr
acte
belE
ngin
eerin
gS.
A.An
ydu
plic
atio
nor
tran
smis
sion
toth
irdpa
rtie
sis
forb
idde
nw
ithou
tpr
ior
writ
ten
appr
oval
In order to ensure that natural gas remains pressurized during its transmission (and more rarely during itsdistribution), compression, by means of compressor stations, is required periodically along the pipelines.
The following simplified diagram shows a typical natural gas transmission and distribution network.
Figure 5-1: Typical natural gas transmission and distribution network
Energy losses due to gas transmission and distribution have been considered in this study to be naturalgas shrinkage (gas losses and own consumption) and own electricity consumption. Figure 5-2 reports thelosses level among representative Member States.

IDENTIFYING ENERGY EFFICIENCY IMPROVEMENTS AND SAVING POTENTIAL IN ENERGY NETWORKS –INTERIM REPORT
GRIDEE/4NT/0364174/000/00 Ed. 2015/05/11 63/110
This
docu
men
tis
the
prop
erty
ofTr
acte
belE
ngin
eerin
gS.
A.An
ydu
plic
atio
nor
tran
smis
sion
toth
irdpa
rtie
sis
forb
idde
nw
ithou
tpr
ior
writ
ten
appr
oval
Figure 5-2 – Level of losses19 in gas grids in selected EU Member States
Compressor stations are the largest sources of gas use on a gas distribution and transmission network.Electricity consumption can be important as well on compressor stations, when electricity is used to runcompressors.
Gas losses can arise from multiple causes. They have been grouped in three categories:
Vented emissions: Direct gas releases to the atmosphere of natural gas resultingfrom equipment design, regular process operations, maintenance activities, oremergency releases (e.g. process designed flow to the atmosphere through seals orvent pipes, equipment blowdown for maintenance or an emergency, and directventing of gas used to power equipment (such as pneumatic devices)).
19 Both technical and non-technical losses, based on the Ecofys analysis from EuroStat database

IDENTIFYING ENERGY EFFICIENCY IMPROVEMENTS AND SAVING POTENTIAL IN ENERGY NETWORKS –INTERIM REPORT
GRIDEE/4NT/0364174/000/00 Ed. 2015/05/11 64/110
This
docu
men
tis
the
prop
erty
ofTr
acte
belE
ngin
eerin
gS.
A.An
ydu
plic
atio
nor
tran
smis
sion
toth
irdpa
rtie
sis
forb
idde
nw
ithou
tpr
ior
writ
ten
appr
oval
Fugitive emissions: Unintentional leaks of gas from piping and associatedequipment components (e.g. leaks from valve seals, packing or leaks resulting fromcorrosion, faulty connections). Such emissions can occur on many different parts ofthe network and are very difficult to estimate.Emissions due to incidents: Inadvertent damages to pipelines may also cause gasemissions.
A mapping of energy losses due to gas distribution and transmission is presented in the three followingsections.
5.1.1 Mapping of losses in gas transmission network
Gas transmission is achieved by means of high pressure underground pipelines. These pipelines areusually made of steel that is coated and cathodically protected20.
Figure 6 reports the mapping of mechanisms leading to losses in gas transmission network. These lossescan be either natural gas emissions from pipelines (vented, fugitive or caused by incidents), electricityused for pipeline cathodic protection or gas to fuel heaters at regulation stations.
Figure 5-3: Mapping of losses in gas transmission network
20 Cathodic protection is a technique of running an electric current through the pipe to prevent corrosion and rusting.

IDENTIFYING ENERGY EFFICIENCY IMPROVEMENTS AND SAVING POTENTIAL IN ENERGY NETWORKS –INTERIM REPORT
GRIDEE/4NT/0364174/000/00 Ed. 2015/05/11 65/110
This
docu
men
tis
the
prop
erty
ofTr
acte
belE
ngin
eerin
gS.
A.An
ydu
plic
atio
nor
tran
smis
sion
toth
irdpa
rtie
sis
forb
idde
nw
ithou
tpr
ior
writ
ten
appr
oval
5.1.2 Mapping of losses in compression stations
Along the transmission (and sometimes the distribution) networks, compressor stations are placed atregular interval. When gas enters the compressor station, it is compressed by either natural gas fuelledengines or turbines, or electric motors.
Figure 8 reports the mapping of mechanisms leading to losses in gas compressor stations. Fuel used tocompress gas is the most important source of gas and electricity consumption. Gas losses can be due tovented emissions from compressors, valves and pneumatic-driven devices or fugitive emissions.
Figure 5-4: Mapping of losses in gas compressor stations
5.1.3 Mapping of losses in gas distribution network
Natural gas is distributed to residential and small industrial customers through medium to low pressureunderground pipelines (distribution mains and service lines). Pipeline materials can be very differentdepending on the localization, the pressure and the age of the network. For example, oldest distributionmains were constructed from cast iron pipes and yarn/lead joints or unprotected steel. New materials aremainly cathodically protected steel and plastic (e.g. polyethylene).

IDENTIFYING ENERGY EFFICIENCY IMPROVEMENTS AND SAVING POTENTIAL IN ENERGY NETWORKS –INTERIM REPORT
GRIDEE/4NT/0364174/000/00 Ed. 2015/05/11 66/110
This
docu
men
tis
the
prop
erty
ofTr
acte
belE
ngin
eerin
gS.
A.An
ydu
plic
atio
nor
tran
smis
sion
toth
irdpa
rtie
sis
forb
idde
nw
ithou
tpr
ior
writ
ten
appr
oval
Figure 7 reports the mapping of mechanisms leading to losses in gas transmission grids. Losses can bedue to natural gas emissions and gas or electricity consumption. Gas emissions can vary widelydepending on the pipeline material as fugitive emissions from older networks are much higher than morerecent ones. Gas or electricity consumption can differ from one network to another, depending onsituations (e.g. existence of cathodically protected steel, heaters at regulation stations).
Figure 5-5: Mapping of losses in gas distribution grids
5.2 Energy efficiency measures in gas networks:categorisation and potential
Energy efficiency measures in gas networks are considered in this study to be minimisation of gas lossesand own gas and electricity consumption. The three following sections present various energy efficiencymeasures associated to transmission network, compressor stations and distribution network.

IDENTIFYING ENERGY EFFICIENCY IMPROVEMENTS AND SAVING POTENTIAL IN ENERGY NETWORKS –INTERIM REPORT
GRIDEE/4NT/0364174/000/00 Ed. 2015/05/11 67/110
This
docu
men
tis
the
prop
erty
ofTr
acte
belE
ngin
eerin
gS.
A.An
ydu
plic
atio
nor
tran
smis
sion
toth
irdpa
rtie
sis
forb
idde
nw
ithou
tpr
ior
writ
ten
appr
oval
5.2.1 Gas transmission network: energy efficiency measures and reductionpotential
The table below reports the list of measures addressing the sources of loss in gas transmission networkidentified in the previous section. It also describes the reduction potential of each measure and identifiesthe key factors affecting this potential.
Opportunities to improve energy efficiency measures in gas distribution networks are mainly related tonatural gas losses. Measures to reduce vented gas during maintenance operation (e.g. allow customers touse natural gas in order to lower the pressure in the affected section of pipe or gas recompression) canpotentially lead to substantial minimisation of losses. For example, a 80% reduction of gas losses can beachieved when gas is recompressed instead of vented before maintenance ( [61]).
Category oflosses Type of losses Associated measures
Qualitativepotential Key factors
Natural gaslosses
Maintenanceoperations
Reduction of vented gas ++ Pressure level, volumeof vented pipe
Recompression ++ Pressure level, volumeof vented pipe
Permanent losses dueto age and gas gridtype
Inspection andmaintenance programs + Length and age of the
network
Third party damages
Mapping, relation withcontractors, emergencycall centers…
+
Length of the network,pressure level,sensitivity of the pipearea (urban or rural,works area…)
Automatic shut-off valves +
Length of the network,pressure level,sensitivity of the pipearea (urban or rural,works area…)
Gas orelectricity ownconsumption
Fuel to heat facilities(at regulation stations)
Improved burner designand avoid heating whenpossible
+Number and efficiencyof heaters, necessity ofburners
Electricity forcathodic protection (-) (-) (-)
Table 5-2: Mapping of energy efficiency measures –Transmission

IDENTIFYING ENERGY EFFICIENCY IMPROVEMENTS AND SAVING POTENTIAL IN ENERGY NETWORKS –INTERIM REPORT
GRIDEE/4NT/0364174/000/00 Ed. 2015/05/11 68/110
This
docu
men
tis
the
prop
erty
ofTr
acte
belE
ngin
eerin
gS.
A.An
ydu
plic
atio
nor
tran
smis
sion
toth
irdpa
rtie
sis
forb
idde
nw
ithou
tpr
ior
writ
ten
appr
oval
5.2.2 Compressor stations: energy efficiency measures and reductionpotential
Table 5-3 reports the list of measures addressing the sources of loss in compressor stations identified inthe previous section. It also describes the reduction potential of each measure and identifies the keyfactors affecting this potential.
Category oflosses
Type of losses Associated measures Qualitativepotential Specific key factors
Naturalgaslosses
Compressors starts /shutdowns andblowdowns
Optimal strategies for cyclingon- and off-line +++ Base or peak load
compressorReduction of vented gas (nodepressurizing aftershutdown…)
+++ Base or peak loadcompressor
Pressure safety valvesand gas-drivenpneumatic devices
Replacement of high bleeddevices + Number of high bleed
devicesInstallation of compressedair/electric systems ++ Number of gas-driven
pneumatic devicesFugitive emissionsfrom compressors(seals…)
Inspection and maintenanceand replacement of seals ++ Inspection frequency, type
of seals to be replaced
Fugitive emissionsfrom equipment’s notin compression service
Inspection and maintenance + Inspection frequency
Gas ownconsumption
Engines (reciprocatinginternal combustion)
Optimization of equipmentdispatch
++ Number and capacity ofcompressors(Pressure and flowregulation)
Increased efficiency (retrofitcontrol)
++ Compressor efficiency(before and after engineretrofit)
Replacement with a moreefficient unit
+++ Compressor efficiency(before and after enginereplacement)
Gas turbines
Optimization of equipmentdispatch
+ Number and capacity ofcompressors(Pressure and flowregulation)
Replacement with a moreefficient unit
+ Compressor efficiency(before and after gasturbine replacement)
Table 5-3: Mapping of the energy efficiency potential of each measure –Compression

IDENTIFYING ENERGY EFFICIENCY IMPROVEMENTS AND SAVING POTENTIAL IN ENERGY NETWORKS –INTERIM REPORT
GRIDEE/4NT/0364174/000/00 Ed. 2015/05/11 69/110
This
docu
men
tis
the
prop
erty
ofTr
acte
belE
ngin
eerin
gS.
A.An
ydu
plic
atio
nor
tran
smis
sion
toth
irdpa
rtie
sis
forb
idde
nw
ithou
tpr
ior
writ
ten
appr
oval
Measures to improve energy efficiency in compressor stations can be either technical solutions (e.g.replacement of seals) or optimized work practices (e.g. optimal strategies for cycling compressors on-and off-line).
Various solutions can be implemented to reduce gas losses. For example, a Marcogaz report ( [61])describes the replacement of pneumatic actuators with devices operated by compressed air in acompressor station in Italy that enabled gas emissions to be reduced by 45%. Another example is thereduction of gas emissions when taking compressor off-line. This can be achieved by keepingcompressors pressurized (estimated emission savings: around 30% for a base load compressor ( [62])).
Gas and electricity consumption can be reduced when replacing old engines or gas turbines with moreefficient units. Another option is to optimize equipment dispatch (e.g. optimisation of pipeline systemoperations in order to operate compressors at their nominal capacity and avoid as much as possiblecompressor starts and shutdowns).
5.2.3 Distribution grids: energy efficiency measures and reduction potential
Table 5-4 reports the list of measures addressing the sources of loss in gas distribution network identifiedin the previous section. It also describes the reduction potential of each measure and identifies the keyfactors affecting this potential.
The most efficient way to reduce gas losses is to replace or repair/reline old grey cast iron pipes withyarn/lead joints, as they are responsible for the highest emissions. For example, a program ofreplacement of old pipes in the UK is expected to achieve 10 times lower emissions than previously ([61]).
Third party damages to gas distribution pipes can be another important cause of gas losses. Safety is theprimary driver to reduce these gas losses. Emissions can be reduced when implementing measures toprevent damages (e.g. enhancement of the grid mapping accuracy or training and technical guidanceprovided to contractors in charge of digging works). For example, reduction of the number of third partydamages (with gas emissions) of around 30% during the period 2010-2014 has been achieved in a Frenchgas network (GrDF, 2015).

IDENTIFYING ENERGY EFFICIENCY IMPROVEMENTS AND SAVING POTENTIAL IN ENERGY NETWORKS –INTERIM REPORT
GRIDEE/4NT/0364174/000/00 Ed. 2015/05/11 70/110
This
docu
men
tis
the
prop
erty
ofTr
acte
belE
ngin
eerin
gS.
A.An
ydu
plic
atio
nor
tran
smis
sion
toth
irdpa
rtie
sis
forb
idde
nw
ithou
tpr
ior
writ
ten
appr
oval
Category oflosses
Type of losses Associated measures Qualitativepotential Key factors
Naturalgaslosses
Pneumatic emissions Reduction of vented gas + Number of gas-drivenpneumatic devices
Maintenanceoperations
Reduction of vented gas + Pressure level, volume ofvented pipe
Recompression + Pressure level, volume ofvented pipe
Permanent losses dueto age and gas grid type
Inspection and maintenanceprograms ++ Length and age of the
network
Pressure management NA Length and age of thenetwork
Permeability ofmaterials and joints
Replacement or repair/reliningof old pipes +++ Length and age of the grid,
pipes and joints materials
Third party damages
Mapping, relation withcontractors, emergency callcenters, protection of pipes insensitive areas, shut-off valves
++
Length of the grid, pressurelevel, sensitivity of the pipearea (urban or rural, worksarea…)
Gas orelectricity ownconsumption
Fuel to heat facilities(at regulation stations)
Improved burner design andavoid heating when possible +
Number and efficiency ofheaters, necessity ofburners
Electricity for cathodicprotection (-) (-) (-)
Table 5-4: Mapping of the energy efficiency potential of each measure –Distribution network

IDENTIFYING ENERGY EFFICIENCY IMPROVEMENTS AND SAVING POTENTIAL IN ENERGY NETWORKS –INTERIM REPORT
GRIDEE/4NT/0364174/000/00 Ed. 2015/05/11 71/110
This
docu
men
tis
the
prop
erty
ofTr
acte
belE
ngin
eerin
gS.
A.An
ydu
plic
atio
nor
tran
smis
sion
toth
irdpa
rtie
sis
forb
idde
nw
ithou
tpr
ior
writ
ten
appr
oval
6 ASSESSMENT OF COST-EFFECTIVENESS OF SELECTEDENERGY EFFICIENCY MEASURES - GAS
In the following we analyze more in detail the cost-effectiveness of energy efficiency measures withmost relevant potential at transmission, distribution and compressor station level.
The excel tool described in ANNEX V provides a step-by-step decision support to carry out theassessment.
6.1 Gas Transmission Network
Table 6-1 describes the type of implementation costs and an estimation of cost levels associated tomeasures with a significant reduction potential in gas transmission network.
Avoiding emissions during maintenance has significant energy efficiency potential. However, somemeasures can be quite expensive and may be not economically relevant in all cases (e.g. recompressionof gas before maintenance with a mobile compressor unit). Less costly measures, with minor facilitymodifications, can also be implemented (e.g. use inert gases and pigs to perform pipeline purges insteadof venting).
Additional benefits are less greenhouse gas emissions.
Categoryof losses Type of losses Associated
measures
Qualitativereductionpotential
Type of costs Costlevel
Naturalgas losses
Maintenanceoperations
Reduction ofvented gas ++
Capital costs (minor facilitymodifications), operating costs(maintenance), labour costs
+
Recompression ++ Capital costs (pump-downcompressor), labour costs +++
Table 6-1: Type of implementing costs and estimated cost levels – Transmission network
Examples of implementation costs are given in Table 6-2. These figures give an order of magnitude andshould be considered with caution since situations may differ from one network to another.

IDENTIFYING ENERGY EFFICIENCY IMPROVEMENTS AND SAVING POTENTIAL IN ENERGY NETWORKS –INTERIM REPORT
GRIDEE/4NT/0364174/000/00 Ed. 2015/05/11 72/110
This
docu
men
tis
the
prop
erty
ofTr
acte
belE
ngin
eerin
gS.
A.An
ydu
plic
atio
nor
tran
smis
sion
toth
irdpa
rtie
sis
forb
idde
nw
ithou
tpr
ior
writ
ten
appr
oval
Measure Capital costs estimation Operating costs estimationReduction of vented gas (Useinert gases and pigs to performpipeline purges)
- $500 (for 2 miles of 10-inch diameterpipeline) ( [62],2011)
Reduction of vented gas (Injectblowdown gas into low pressuremains or fuel gas system)
$1,000 (minor facilitymodifications: additional piping)( [62],2011)
-
Recompression (mobilecompressor unit)
200,000 € (for one case with 630,000 Nm3 natural gas saved from venting) (
[61])Table 6-2: Implementation costs of measures – Examples – Transmission network
6.2 Gas Compressor Stations
Table 6-3 describes the type of implementation costs and an estimation of cost levels associated tomeasures with a significant reduction potential in compressor stations.
Possible measures that can be applied within compressor stations can vary widely. Some of them can beimplemented with no (or nearly no) costs (e.g. avoid compressor depressurization after shutdown).Conversely, an engine replacement with a more efficient unit represents a very expensive investment.
Overall, these measures can contribute to improve operational efficiency, less greenhouse gas emissionsand cost savings due to reduction of gas losses and own gas consumption.
Category oflosses Type of losses Associated measures
Qualitativereductionpotential
Type of costs Costlevel
Natural gaslosses
Compressorsstarts / shutdownsand blowdowns
Optimal strategies forcycling on- and off-line
+++ Labour costs +
Reduction of ventedgas (nodepressurizing aftershutdown…)
+++
No costs (with the option:no depressurizing aftershutdown) or minor capitaland labour costs with otheroptions
+
Pressure safetyvalves and gas-driven pneumaticdevices
Installation ofcompressedair/electric systems
++ Capital costs (compressedair/electric systems) ++
Fugitiveemissions fromcompressors(seals…)
Inspection andmaintenance andreplacement of seals
++
Capital costs (seals),operating costs(maintenance), labourcosts
++
Gas ownconsumption
Engines(reciprocating
Optimization ofequipment dispatch ++ Labour costs +

IDENTIFYING ENERGY EFFICIENCY IMPROVEMENTS AND SAVING POTENTIAL IN ENERGY NETWORKS –INTERIM REPORT
GRIDEE/4NT/0364174/000/00 Ed. 2015/05/11 73/110
This
docu
men
tis
the
prop
erty
ofTr
acte
belE
ngin
eerin
gS.
A.An
ydu
plic
atio
nor
tran
smis
sion
toth
irdpa
rtie
sis
forb
idde
nw
ithou
tpr
ior
writ
ten
appr
oval
internalcombustion) Increased efficiency
(retrofit control) ++
Capital costs (minorengine modification),operating costs(maintenance), labourcosts
++
Replacement with amore efficient unit +++
Capital costs (newcompressor), operatingcosts (gas or electricity +maintenance), labour costs
+++
Table 6-3: Type of implementing costs and estimated cost levels – Compressor stations
Examples of implementation costs are given in Table 6-4. These figures give an order of magnitude andshould be considered with caution since situations may differ from one compressor station to another.
Measure Capital costs estimation Operating costs estimationOptimal strategies for cycling on- andoff-line
- Labour (very variable costsdepending on available equipmentand optimization possibilities)
Reduction of vented gas (nodepressurizing after shutdown)
- -
Reduction of vented gas (Keepcompressor pressurized and route gasto fuel system or install static seal)
< $5,000 for one compressor ( [62], 2006)
Installation of compressed air/electricsystems
$45,000 to $75,000 (per facility) -
Inspection and maintenance(identification of leaks and cost-effective repairs)
- $26,248 (average value, for onecompressor station) ( [62], 2003)
Replacement of seals (compressor rodpacking system replacement)
$5,346 ($2008) (per compressor)(US EPA, 2014)
-
Replacement with a more efficient unit(case of an electric compressor)
$6,050,000 (per 5 reciprocatingcompressors replaced) (EPA GasSTAR Program, 2011)
$6,200,000 (per 5 reciprocatingcompressors replaced) (EPA GasSTAR Program, 2011)
Table 6-4: Implementation costs of measures – Examples – Compressor stations
6.3 Gas Distribution Network
Table 6-5 describes the type of implementation costs and an estimation of cost levels associated tomeasures with a significant reduction potential in gas distribution network.

IDENTIFYING ENERGY EFFICIENCY IMPROVEMENTS AND SAVING POTENTIAL IN ENERGY NETWORKS –INTERIM REPORT
GRIDEE/4NT/0364174/000/00 Ed. 2015/05/11 74/110
This
docu
men
tis
the
prop
erty
ofTr
acte
belE
ngin
eerin
gS.
A.An
ydu
plic
atio
nor
tran
smis
sion
toth
irdpa
rtie
sis
forb
idde
nw
ithou
tpr
ior
writ
ten
appr
oval
As stated previously, replacement of grey cast iron pipes with polyethylene pipes can reducesignificantly gas emissions. This measure can be very expensive, especially in urban areas. This should,however, be put in balance with associated benefits (higher safety level, less greenhouse gas emissions,cost savings due to reduced gas losses and lower repair costs over the next decades).
Less costly measures can be implemented as well (e.g. prevention of third party damages, improvementin inspection and maintenance programs) and will contribute to a greater safety of the network, lessgreenhouse gas emissions and cost savings due to reduction of gas losses.
Category oflosses Type of losses
Associatedmeasures
Qualitativereductionpotential
Type of costsCostlevel
Natural gaslosses
Permanent losses dueto age and gas gridtype
Inspection andmaintenanceprograms
++Operating costs(maintenance),labour costs
+
Permeability ofmaterials and joints
Replacement orrepair/relining of oldpipes
+++
Capital costs (newpipes or liners),operating costs(maintenance),labour costs
+++
Third party damages
Mapping, relationwith contractors,emergency callcenters, protection ofpipes in sensitiveareas, shut-off valves
++
Mainly labour costsCapital costs (forprotection of pipesand shut-off valves)
Variable
Table 6-5: Type of implementing costs and estimated cost levels – Distribution network
Examples of implementation costs are given in Table 6-6. These figures give order of magnitudeestimation and should be considered with caution since situations may differ from one network toanother.

IDENTIFYING ENERGY EFFICIENCY IMPROVEMENTS AND SAVING POTENTIAL IN ENERGY NETWORKS –INTERIM REPORT
GRIDEE/4NT/0364174/000/00 Ed. 2015/05/11 75/110
This
docu
men
tis
the
prop
erty
ofTr
acte
belE
ngin
eerin
gS.
A.An
ydu
plic
atio
nor
tran
smis
sion
toth
irdpa
rtie
sis
forb
idde
nw
ithou
tpr
ior
writ
ten
appr
oval
Measure Capital costs estimation Operating costs estimation
Improvement in inspection andmaintenance programs(increased walking survey)
-
$11,000 for a pipeline system of 2,900miles (labour costs: $10,000 andadditional equipment: $1,000) ( [62],2011)
Replacement of grey cast ironpipes with PE pipes
200,000 € (per km) ( [63])> $1,000,000 (for 1 mile of cast iron main replacement) ( [64])
Insert gas main flexible liners(for cast iron and unprotectedsteel)
$10,000 (for 1 mile of cast iron mainand 1 mile of unprotected steel servicelines) ( [62], 2011)
Mapping, relation withcontractors, emergency callcenters
- Mainly labour (Very variable costsdepending on implemented measures)
Shut-off valves (for servicelines)
$6,300 (for 350 valves installed) ([62], 2011) -
Table 6-6: Implementation costs of measures – Examples – Distribution network

IDENTIFYING ENERGY EFFICIENCY IMPROVEMENTS AND SAVING POTENTIAL IN ENERGY NETWORKS –INTERIM REPORT
GRIDEE/4NT/0364174/000/00 Ed. 2015/05/11 76/110
This
docu
men
tis
the
prop
erty
ofTr
acte
belE
ngin
eerin
gS.
A.An
ydu
plic
atio
nor
tran
smis
sion
toth
irdpa
rtie
sis
forb
idde
nw
ithou
tpr
ior
writ
ten
appr
oval
ANNEX I - PARAMETERS INFLUENCING THEIMPLEMENTATION AND THE COST-EFFECTIVENESS OFTHE MEASURES – DETAILED ANALYSIS
1. HIGH EFFICIENCY TRANSFORMERS
Factors affecting benefits
Grid Parameters Efficiency impact
Transformer load rate The optimal efficiency of a transformer is reached at a loading of 30-40 of ratedcapacity. The potential for energy savings can therefore higher by first replacingoverloaded/underloaded transformers and oversize/downsize the new ones to reachthe optimal operating point (clearly, oversizing costs must be taken into account inthe evaluation).
Age of the transformers Old transformers are the main contributors to losses, since they had to meet lessstringent efficiency standards. The study on transformer replacement carried the inthe APEC ( [46]) regions show that for instance, an old efficiency standard 25kVAtransformer in Russia has a 98% efficiency, compared to 98.9% for 1500 kVA.New standards allow them to reach respectively an efficiency of 99.5% and 99.7%).
Transformers fault rate Regularly defective transformers can be targeted to improve the quality of supplyand reduce the O&M cost.
High harmonicsproblems
If a transformer encounters non-linear loading and therefore harmonics problems,losses due to Eddy currents might appear and reduce the efficiency of thetransformers (Simulations carried out in [65] on 200 kVA transformer showed anefficiency reduction from 98.1% to 96.5% due to harmonics). New transformersequipped with harmonics filters, better core structure, etc. might improve theoperating efficiency.
Factors affecting costs
Work constraints Cost impact
Transformersaccessibility
The conditions of installation works (outside, overhead, underground, in a privatebuilding, etc.) can have a significant impact on implementation costs.
Transformer powerrating
According to the study made on the APEC countries [46], extra-cost related toswitching to higher standards is more cost-effective with small transformers.However, in case of proactive replacement, transformers of medium power ratingreplacement are more cost-effective than replacing small or very large ones.

IDENTIFYING ENERGY EFFICIENCY IMPROVEMENTS AND SAVING POTENTIAL IN ENERGY NETWORKS –INTERIM REPORT
GRIDEE/4NT/0364174/000/00 Ed. 2015/05/11 77/110
This
docu
men
tis
the
prop
erty
ofTr
acte
belE
ngin
eerin
gS.
A.An
ydu
plic
atio
nor
tran
smis
sion
toth
irdpa
rtie
sis
forb
idde
nw
ithou
tpr
ior
writ
ten
appr
oval
Investment optimisation Cost impact
Age of the transformer The residual value of an old transformer can be close to zero. Its replacement hasthus a limited accounting impact.
Other replacement plans/ new transformers
As already explained, transformers can be replaced for various reasons, and it iscost-effective to seize those occasions to implement low-loss transformers.Moreover, the implementation of a new transformer can be coordinated with avoltage increase plan or plan to perform voltage control (by installing on-load tapchanging transformers).
In general, changing the minimal requirements for all new transformers improvethe long term efficiency of the asset population
Technologystandardizationopportunities
Limiting the number of technologies present on the grid leads to O&M costreduction (less variability in the types of operation; lower cost in maintenance andprocurement)
2. EXPANDING LINE CAPACITY
Factors affecting benefits
Grid Parameters Efficiency impact
Age of the network The use of new cables with up-to-date technological standards can reduce the risksof defaults/malfunctioning and improve continuity of supply.
Load rate Heavily loaded feeders generate higher losses. Heavily loaded feeders are also thekey target of replacement plans, to increase grid capacity. From an energyefficiency perspective, the cost-effectiveness of this measure is clearly maximizedwhen carried out within a replacement plan which aims at reducing congestions andtakes also into account the minimization of losses.
Fault rate When replacing lines presenting a high fault rate, due to previous faults, isolationdamages, etc., oversizing of the lines can be considered.
Factors affecting costs
Work constraints Cost impact
Overhead / undergroundgrid
Excavation works cost are much higher (depending on the area) than laying linesoverhead. All benefits being equal, targeting the replacement of overhead lines ismore cost-effective.
Urban / rural areas Cables or overhead lines installation can be made more quickly and more easily in

IDENTIFYING ENERGY EFFICIENCY IMPROVEMENTS AND SAVING POTENTIAL IN ENERGY NETWORKS –INTERIM REPORT
GRIDEE/4NT/0364174/000/00 Ed. 2015/05/11 78/110
This
docu
men
tis
the
prop
erty
ofTr
acte
belE
ngin
eerin
gS.
A.An
ydu
plic
atio
nor
tran
smis
sion
toth
irdpa
rtie
sis
forb
idde
nw
ithou
tpr
ior
writ
ten
appr
oval
rural area, resulting in lower cost.
Investment optimisation Cost impact
Age of the network Targeting the replacement of old cables is more cost-effective thanks to their lowerresidual value.
Replacement planalready scheduled
As stated in the previous points, various drivers could lead to a line replacementplan. Opportunities to introduce new line size standard have to be taken intoaccount. Synergies can here be found with an increase of the voltage level, wherelines replacement may be needed to fit the new voltage level.
Technologystandardizationopportunities
Limiting the number of technologies present on the grid leads to O&M costreduction (less various types of operation; optimization of purchasing operations)
3. INCREASING VOLTAGE LEVEL
Factors affecting benefits
Grid Parameters Efficiency impact
Feeders length An increase of voltage level could be particularly useful in rural areas, whichtypically present longer feeders.
Feeders load rate Current in the conductors is directly proportional to the voltage level. Heavilyloaded feeders generate the highest marginal losses and would benefit the mostfrom a voltage increase.
Fault rate Lines with higher fault rate could be firstly addressed when considering thismeasure.
Current voltageproblems
If there are known local voltage problems (due to DG for instance), increasingvoltage on those feeders could reduce clients complains and O&M cost. If DGinjection must be curtailed due to too high voltage rise, increasing line voltagewould have a mitigation effect.
Factors affecting the costs
Work constraints Cost impact
Number of already fittedassets
A key point in the cost-effectiveness of the measure is the number of assets(feeders, transformers, etc.) to be replaced. If the insulation level of the asset issufficient to stand higher voltages, the measure can be less costly to deploy.Otherwise the measure can be highly CAPEX intensive. In LV, going from a 230V

IDENTIFYING ENERGY EFFICIENCY IMPROVEMENTS AND SAVING POTENTIAL IN ENERGY NETWORKS –INTERIM REPORT
GRIDEE/4NT/0364174/000/00 Ed. 2015/05/11 79/110
This
docu
men
tis
the
prop
erty
ofTr
acte
belE
ngin
eerin
gS.
A.An
ydu
plic
atio
nor
tran
smis
sion
toth
irdpa
rtie
sis
forb
idde
nw
ithou
tpr
ior
writ
ten
appr
oval
to 400V network represent more significant cost (need of a four-lines network,three-phases user installation adaptation, etc.)
Underground /overheadgrid
If the implementation of the measure requires asset replacement (and particularlycable replacements), an underground grid will much more expensive to replace
Rural /urban area Asset replacement is easier and less costly in rural area, where the accessibility ofthe installation is easier and where less work constraints are generally to beencountered.
Investment optimisation Cost impact
Grid expansion / loadgrowth
If a grid expansion is envisaged to the future load growth, the voltage levelsupplying those zones has to be considered, especially if the expansion will requirehigh feeder length. Feeders of higher voltage are cheaper (a 34.5kV feeder can be45% cheaper than a 12.5kV lines [66]), but on the other substations equipment ismore expensive. Substation density per feeder is a key point when assessing themeasure.
Age of the network Targeting assets at the end of their lifetime is more cost-effective thanks to theirlower residual value.
Technologystandardizationopportunities
Limiting the number of technologies present on the grid leads to O&M costreduction (less various types of operation; optimization of purchasing operations).A limitation of the number of voltages level also limits the number of transformersto be installed in the upper voltage level.
Combination withtransformers, substationsor lines replacementplans
All planned asset replacement actions represent an opportunity to increase thenumber of asset fitted for higher voltages
DG integration plan If it is planned to invest in the grid to improve the hosting capacity of distributedgeneration, the opportunity to increase voltage level should be assessed.
4. DEMAND RESPONSE
Factors affecting the benefits
Grid Parameters Efficiency impact
Feeder load rate Critically loaded feeders can be firstly address by such a measure.
DG curtailment Feeders where the DG’s are often curtailed will benefit from an interruptible load,especially if curtailment compensation is to be paid by the grid operator.
Factors affecting costs

IDENTIFYING ENERGY EFFICIENCY IMPROVEMENTS AND SAVING POTENTIAL IN ENERGY NETWORKS –INTERIM REPORT
GRIDEE/4NT/0364174/000/00 Ed. 2015/05/11 80/110
This
docu
men
tis
the
prop
erty
ofTr
acte
belE
ngin
eerin
gS.
A.An
ydu
plic
atio
nor
tran
smis
sion
toth
irdpa
rtie
sis
forb
idde
nw
ithou
tpr
ior
writ
ten
appr
oval
Work constraints Cost impact
Flexibility market How the flexibility can be purchased is a key component, its price will impact theday-to-day flexibility activation
Investment optimisation Cost impact
Smart Meter roll-outplan
When and to which extent the smart meters will be placed on the network is to takeinto account to define which feeders will be targeted first.
Penetration of thecommunication system
As the above, the extent to which the load can be easily controlled thanks to anexisting communication tool impact the cost of measure deployment.
5. FEED-IN CONTROL OF DISTRIBUTED ENERGY GENERATION & STORAGE
Factors affecting the benefitsGrid Parameters Efficiency impact
Level of harmonics Harmonics injected in the network by consumer appliances can lead to PowerQuality problems and to an increase of losses in the transformers Incentives toplace efficient inverters can be made where high levels of harmonics are met.
Feeder load rate Loss reduction is always most important to be performed on highly loaded feeder.However, depending on the situation, DG can sometimes increase the load rate.Storage solution could also be envisaged.
Distance between DGand consumers
The placement on a DG unit on a feeder can have a significant impact on theincrease/decrease of losses. In [66], it has been demonstrated that, depending on theload pattern, an optimal placement on a radial feeder can lead to a loss reductionbetween 71% and 86%.
Poor power factor Advanced inverter can enhance the Power Factor by controlling theinjection/absorption of reactive power. Incentives to promote those inverters wherea local poor power factor is known can be made.
Voltage quality problems Following the above, good inverters can control the reactive power and thereforethe voltage. Local voltage problems, especially those leading to a bad DGintegration, can be solved by good inverters.
Factors affecting costs
Work constraints Cost impact
Overhead / underground If extra connections works are carried out, excavation works will increase the costs.

IDENTIFYING ENERGY EFFICIENCY IMPROVEMENTS AND SAVING POTENTIAL IN ENERGY NETWORKS –INTERIM REPORT
GRIDEE/4NT/0364174/000/00 Ed. 2015/05/11 81/110
This
docu
men
tis
the
prop
erty
ofTr
acte
belE
ngin
eerin
gS.
A.An
ydu
plic
atio
nor
tran
smis
sion
toth
irdpa
rtie
sis
forb
idde
nw
ithou
tpr
ior
writ
ten
appr
oval
grid
Participation to the userasset cost
Depending on the local regulation, DSO can participate to the cost of the inverter topromote efficient equipment.
Investment optimisation Cost impact
Smart Meter roll-outplan
With a complete access to the local consumption data, an inverter or its centralisedcontrol can make the best forecast and control. A Smart Meter roll-out is a goodopportunity to improve the grid efficiency.
Penetration of thecommunication system
The choice of the control solution (stand-alone, centralised or decentralised) can bemade depending on the existing communication system on the targeted grid.
6. NETWORK RECONFIGURATION
Factors affecting benefits
Grid Parameters Efficiency impact
Number of switches /substation on a feeder
The impact in terms of reduction of losses and of restoration times highly dependson the number of remote switches which are included in the grid reconfiguration.The optimal balance between number of switches and level of benefits should beassessed depending on the specific grid conditions. According to the Synergirdstudy [67], moving the open-point in the middle of the loop can lead to 66% ofreduction compared to an end of loop open-point on a feeder with 4 substations,but this reduction can go up to 73% in the case of 16 substations loop.
Current unbalancebetween feeders
A load repartition of 70%/30% between two feeders can lead to 1.4 times the lossesin a case of a 50%/50% repartition ( [68]). This makes it clear that the first feedersto be addressed by such a measure should be feeders with strong unbalances.
Current averagerestoration time
Feeders with an high restoration time, due to the distance between switches, theaccessibility of the installations, the number of switches to be controlled, etc.highly benefits from the implementation of remote switches. EnergyUnited (NorthCarolina – see in [36]) reduced its Customer Minutes Interrupted (CMI) of 90% onspecific feeders thanks to automatically remote controlled switches.
Current fault rate Feeders with a high fault rate would particularly benefit from this solution,reducing the total yearly interruption time.
Presence of sub-transmission / reparationgrid
Repartition grids carry more load and impact more consumers than the final grid ona same voltage level.
Factors affecting the costs

IDENTIFYING ENERGY EFFICIENCY IMPROVEMENTS AND SAVING POTENTIAL IN ENERGY NETWORKS –INTERIM REPORT
GRIDEE/4NT/0364174/000/00 Ed. 2015/05/11 82/110
This
docu
men
tis
the
prop
erty
ofTr
acte
belE
ngin
eerin
gS.
A.An
ydu
plic
atio
nor
tran
smis
sion
toth
irdpa
rtie
sis
forb
idde
nw
ithou
tpr
ior
writ
ten
appr
oval
Work constraints Cost impact
Overhead / undergroundgrid
Installation of switches on overhead lines does not represent major workInstallation cost for underground grid would be significantly higher.
Urban / rural areas Field deployment of remotely controlled switches is generally easier and less costlyin a more rural area, where installations can be more easily accessible.
Voltage level Higher voltage levels require switches of higher insulation, which are moreexpensive.
Investment optimisation Cost impact
Existing assets Feeders already equipped with remotely controlled switches would mainly needsoftware adaptation to integrate new functionalities (e.g. for balancing load; forreducing restoration time). Investment will be much lower than in the cases wherethe implementation and integration of new switches is to be foreseen.
Substation renovationplans
Old substations which must be restored can be easily targeted by such a plan.
Penetration of thecommunication system
The implementation cost of this solution could greatly be diminished if a robustcommunication system already exits.
7. SWITCHING OFF REDUNDANT TRANSFORMERS
Factors affecting the benefits
Grid Parameters Efficiency impact
Number of transformersin parallel
Substations including more than two transformers working in parallel are expectedto have higher energy efficiency potential.
Load rate At a certain load rate level (according to [67]), it might become more efficient interm on losses to connect both transformers to feed the load at the same time. Loadpattern of one substation must be measured to assess the best transformersoperation mode.
Low transformers faultrate / Low SAIDI
Switching off redundant transformers has the negative side effect to increase therestoration time, since the transformer needs to be magnetised before reaching itsfull operation mode. The measure will be more efficient in case of feeders with alow transformer fault rate and a non-critical SAIDI. In the case of manualswitching, the restoration time and cost increase significantly.
Factors affecting the costs

IDENTIFYING ENERGY EFFICIENCY IMPROVEMENTS AND SAVING POTENTIAL IN ENERGY NETWORKS –INTERIM REPORT
GRIDEE/4NT/0364174/000/00 Ed. 2015/05/11 83/110
This
docu
men
tis
the
prop
erty
ofTr
acte
belE
ngin
eerin
gS.
A.An
ydu
plic
atio
nor
tran
smis
sion
toth
irdpa
rtie
sis
forb
idde
nw
ithou
tpr
ior
writ
ten
appr
oval
Investment optimisation Cost impact
Substation renovationplans
Transformers switches replacement will be optimised if other works are to becarried out in the targeted substation.
8. VOLTAGE OPTIMISATION
Factors affecting the benefits
Grid Parameters Efficiency impact
Low power factor The lower the power factor, the higher the potential benefits of reactive powercompensation. Specific analysis shall be carried out to select most suitable feedersto be targeted.
Voltage stabilityproblems
Feeders where known voltage problems exist could be firstly targeted.
DG penetration rate Feeders with high levels of DG injection can be affected by voltage problems andthus could represent good candidate for the implementation of the measure.
Low (advanced) DGpenetration rate.
If DG units on the feeders already performed voltage control, CVR would beredundant.
Feeders load rate Power factor correction is expected to be particularly effective on heavily loadedfeeders, leading to higher benefits in terms of reduction of losses and ofcongestions.
Number of voltage level If power factor correction is performed in an upper level of the grid, the effect willimpact all the downstream levels. Implementing reactive power compensation on afew places on a sub-transmission grid can be more cost effective thanimplementing it in various locations at lower voltage level.
Length of the network Following the above, the longer the path between the reactive consumption and thecompensation device, the higher the losses.
Line specificcharacteristic
According to [23], a low R/X ratio leads to a less efficient reactive power controlby DG converters.
Factors affecting the costs
Grid Parameters Efficiency impact
Underground/Overheadgrid
The installation cost is significantly higher in the case of an underground grid.Installation of capacitors banks or voltage regulator on overhead lines does notinvolve major works.

IDENTIFYING ENERGY EFFICIENCY IMPROVEMENTS AND SAVING POTENTIAL IN ENERGY NETWORKS –INTERIM REPORT
GRIDEE/4NT/0364174/000/00 Ed. 2015/05/11 84/110
This
docu
men
tis
the
prop
erty
ofTr
acte
belE
ngin
eerin
gS.
A.An
ydu
plic
atio
nor
tran
smis
sion
toth
irdpa
rtie
sis
forb
idde
nw
ithou
tpr
ior
writ
ten
appr
oval
Urban / rural grid Accessibility of the installation is easier in rural condition. Moreover, long feedersin rural areas are the most subject to voltage drops.
Voltage level Voltage level has a significant impact on the cost of one capacitor. According to[69], purchase cost for 4.16kV capacitors is 20$/kvar and 25$/kvar at 13.8kV.
Investment optimisation Efficiency impact
Combination with CVR Assets for voltage optimisation at the LV level can also be leveraged to performConservation Voltage Reduction (CVR), as presented in the following section.
Smart meter-roll outplan
Implementation of Smart Meters would greatly increase the observability of thegrid (measures regarding voltage profile and reactive/active power flows)supporting the implementation of voltage optimization measures.
Substation renovationplan
Works to be carried out in substations can be opportunities to install capacitorsbanks.
Penetration of thecommunication system
Depending on where Volt/VAR control assets will be installed and on their number,the availability of a robust communication system is important, and must be takeninto account.
9. CONSERVATION VOLTAGE REDUCTION
Factors affecting benefits
Grid Parameters Efficiency impact
Feeders load rate CVR is highly scalable. Targeting only specific highly loaded feeders can alreadylead to a major losses reduction (the U.S. Department of Energy determined in[59] that if only 40% of all feeders would have been equipped with CVR, 80% ofthe target can be reached, and 37% of the objective when deployed only on 10% ofthe feeder). The main impact of CVR can be achieved with a limited cost. Test canbe made before deploying the solution.
Voltage Stabilityproblems
Feeders encountering regularly voltage problems may be the first target of a CVRdeployment plan.
Number of final LVcustomers
CVR objective is to reduce the end-user consumption by reducing voltage level(while remaining in the required nominal voltage range). Therefore, the morecustomers are connected on the LV, the more effective the impact will be in termof losses reduction and on peak reduction, leading to customer’s peak reductionand to investments deferral.
Factors affecting costs

IDENTIFYING ENERGY EFFICIENCY IMPROVEMENTS AND SAVING POTENTIAL IN ENERGY NETWORKS –INTERIM REPORT
GRIDEE/4NT/0364174/000/00 Ed. 2015/05/11 85/110
This
docu
men
tis
the
prop
erty
ofTr
acte
belE
ngin
eerin
gS.
A.An
ydu
plic
atio
nor
tran
smis
sion
toth
irdpa
rtie
sis
forb
idde
nw
ithou
tpr
ior
writ
ten
appr
oval
Work constraints Cost impact
Overhead / undergroundgrid
The installation cost will be significantly higher in the case of an underground grid.Installation of capacitors banks or voltage regulator on overhead does not representmajor works.
Urban / rural areas Field deployment of CVR will be facilitated in a more rural area, whereinstallations can be easily accessible. Moreover, rural grids are usually not meshed,allowing an easier voltage control.
Investment optimisation Cost impact
Existing assets Feeders already equipped with capacitors banks, feeder voltage sensors or on-loadtap changing transformers only needs automation to perform CVR.
Smart meter roll-outplan
End-users voltage monitoring facilitates and optimizes the implementation of themeasure, and limits the number of voltage sensors to deploy.
Transformersreplacement plan
To be more effective, the first substation targeted by the measure might be oneswhere transformers have to be replaced. On-load tap changing transformers cantherefore be installed.
Penetration of thecommunication system
In the case of centralized CVR, the implementation will be facilitated if a robustcommunication system already exits.
10. BALANCING 3-PHASE LOADS
Factors affecting benefits
Grid Parameters Efficiency impact
Feeders load rate The higher the power demand on one feeder, the more the imbalance will have aneffect on the losses and on the cable capacity.
Neutral conductors loadrate
Current flowing in neutral conductors also results in losses in a 4-lines system, andcan cause protections to work in case of overloading. Feeders with frequentlyoverloaded neutral conductors can be firstly addressed.
Neutral conductors faultrate
As the above, fault related to the neutral conductors can be reduced, as no currentwould normally flow in it.
Factors affecting the cost
Work constraints Cost impact
Overhead / underground Installing switches and replacing connections can be made cheaper in an overhead

IDENTIFYING ENERGY EFFICIENCY IMPROVEMENTS AND SAVING POTENTIAL IN ENERGY NETWORKS –INTERIM REPORT
GRIDEE/4NT/0364174/000/00 Ed. 2015/05/11 86/110
This
docu
men
tis
the
prop
erty
ofTr
acte
belE
ngin
eerin
gS.
A.An
ydu
plic
atio
nor
tran
smis
sion
toth
irdpa
rtie
sis
forb
idde
nw
ithou
tpr
ior
writ
ten
appr
oval
grid grid.
Urban / rural grid Switches installations can be cheaper if an easy access is available.
LV consumers’ density The more LV consumers, the more adaptation work will be need to perform anoptimal balancing. Grid with less but more important connection will require lessworks, but might be less accurate.
LV substation density As the above, the number of LV substations is important to assess to which extendand with accuracy the measure can be implemented.
Investment optimisation Cost impact
LV substation renovationplan
If LV substations are to be renovated, it presents an opportunity to installed phaseswitches.
Connectionsreplacements plan
Every connection replacement is an opportunity to increase the number of three-phases connection.
Smart Meters roll-outplan
Phase connection balancing requires measuring the instantaneous load. If SmartMeter are to be installed, such measures will be provided.

IDENTIFYING ENERGY EFFICIENCY IMPROVEMENTS AND SAVING POTENTIAL IN ENERGY NETWORKS –INTERIM REPORT
GRIDEE/4NT/0364174/000/00 Ed. 2015/05/11 87/110
This
docu
men
tis
the
prop
erty
ofTr
acte
belE
ngin
eerin
gS.
A.An
ydu
plic
atio
nor
tran
smis
sion
toth
irdpa
rtie
sis
forb
idde
nw
ithou
tpr
ior
writ
ten
appr
oval
ANNEX II ENERGY EFFICIENCY MEASURES INEUROPEAN MEMBER STATES: SURVEY
In order to collect experiences and best practices from the field and to integrate the views of mainstakeholders in this study, a survey was carried out among stakeholders with respect to theimplementation of energy efficiency measures in gas and electricity grids. Mainly DSOs have beentargeted, as most of losses occur at distribution level. European DSO associations (EURELECTRIC,GEODE, EDSO, CEDEC) have been involved to facilitate the distribution of the questionnaire
In particular, the survey aimed at collecting information about:
Their experience with the implementation of grid energy efficiency measuresThe Regulatory mechanisms in place in their country to incentivise the implementation ofenergy efficiency measures.Their view on the list of energy efficiency measures proposed in this study
The detailed description of the questions in the survey and the detailed list of respondents is reported inANNEX I.
Despite numerous attempts it was not possible to have CEER’s view on the regulatory mechanisms toincentivise energy efficiency measures and their view on the level of mobilization in the implementationof article 15.2 in their members’ countries.
A total of 16 replies have been collected, providing a good geographical coverage of EU Member States.Since the great majority of respondents were electricity DSOs, in this chapter we will mainly focus onthe experiences of DSOs in electricity grids. Figure 0-1 reports the list of respondents.
Collected responses have provided very useful insights in the implementation of grid energy efficiencymeasures by DSOs in different Member States, facing different grid conditions.

IDENTIFYING ENERGY EFFICIENCY IMPROVEMENTS AND SAVING POTENTIAL IN ENERGY NETWORKS –INTERIM REPORT
GRIDEE/4NT/0364174/000/00 Ed. 2015/05/11 88/110
This
docu
men
tis
the
prop
erty
ofTr
acte
belE
ngin
eerin
gS.
A.An
ydu
plic
atio
nor
tran
smis
sion
toth
irdpa
rtie
sis
forb
idde
nw
ithou
tpr
ior
writ
ten
appr
oval
Figure 0-1 - Overview of respondents to the survey

IDENTIFYING ENERGY EFFICIENCY IMPROVEMENTS AND SAVING POTENTIAL IN ENERGY NETWORKS –INTERIM REPORT
GRIDEE/4NT/0364174/000/00 Ed. 2015/05/11 89/110
This
docu
men
tis
the
prop
erty
ofTr
acte
belE
ngin
eerin
gS.
A.An
ydu
plic
atio
nor
tran
smis
sion
toth
irdpa
rtie
sis
forb
idde
nw
ithou
tpr
ior
writ
ten
appr
oval
Level of mobilization in Member States regarding the implementation ofarticle 15.2
According to collected information, the level of mobilization in EU Member States in theimplementation of the provisions of article 15.2 (definition of investment plans to improve grid energyefficiency) appears to be generally limited. European associations report that most of their members havenot yet been actively involved by Member States in addressing the provisions of article 15.2. However,as was confirmed, a number of Member States are working on the topic and would likely publish theirassessments in the period after the completion of this study.
Examples of available information from some Member States include:
UK:
o OFGEM (UK regulator) is carrying out a study to comply with the requirements of theregulation [2]. A separate assessment of energy networks in Northern Ireland is beingprepared by the Northern Ireland Authority for Utility Regulation.
o In this context, OFGEM has launched a survey among UK system operators to collectbest practices and information to
Assess the energy efficiency potentials of the gas and electricity infrastructureof Great BritainIdentify a list of concrete measures and investments for the introduction of cost-effective energy efficiency improvements in the network infrastructure, with atimetable for their introduction.
o Findings have to be delivered before or on 30th June 2015 to the Secretary of State.
FINLAND:o The proposal for the transposed legislation was discussed and handled in the Finnish
Parliament during autumn 2014 and the legislation has come in force beginning of 2015.o In May 2015, the Finnish Ministry of Employment and Economy together with the
Energy Authority have launched a survey on fulfilling the requirements of Article 15(2).Authorities have also invited other stakeholders (like Finnish Energy Industries andFinnish Gas Association) to join the survey. The survey is carried out by LappeenrantaUniversity of Technology (LUT) and will end in June 2015.
o The main topics of the survey are:the technical losses and the overall efficiency of the systemthe technical losses of the Finnish electric system are around 1%- so thefocus will be more on the overall energy efficiency of the system,including distributed generation, demand response and energy storage.New technology like smart meters, smart grids and LVDC (LowVoltage Direct Current) distribution system will have a big role.

IDENTIFYING ENERGY EFFICIENCY IMPROVEMENTS AND SAVING POTENTIAL IN ENERGY NETWORKS –INTERIM REPORT
GRIDEE/4NT/0364174/000/00 Ed. 2015/05/11 90/110
This
docu
men
tis
the
prop
erty
ofTr
acte
belE
ngin
eerin
gS.
A.An
ydu
plic
atio
nor
tran
smis
sion
toth
irdpa
rtie
sis
forb
idde
nw
ithou
tpr
ior
writ
ten
appr
oval
the concrete measures and investment will also be identified
BELGIUM
o In the context of the implementation of the article 15.2 by 30th June 2015, Synergrid(federation of electricity and gas network operators in Belgium) carried out anassessment of the energy efficiency potentials of gas and electricity infrastructure,together with the energy regulators (FORBEG, Forum for Regulatory Bodies).
o The scope of the study considers energy efficiency in a larger sense than just thereduction of losses. In particular, the study looks at:
1. Potential for reduced grid losses and reduced energy consumption bythe network operators.2. Potential to improve the efficient operation of available energyinfrastructure, which in turn could allow reducing the need for investingin new infrastructure
o Categories of measures that will be considered:Investing measures by the network operatorsOperational measures by the network operatorsChanging the behaviour of the consumers, considering incentivizingMechanisms (e.g. tariffs by Time-of-Use, or flexibility vs. capacitytariffs)
o A public (shorter) version of the report has been made available. The document willserve as support for regulator to review the investment plans from the grid operators.
SWEDEN:
o The Swedish Energy Agency has carried out a study to assess the energy efficiencypotential of gas and electricity grid in Sweden.
o The energy saving potential in grid infrastructure is considered to be relative low,although not to be neglected
The main share of the loss reduction potential in electricity grids by 2030 couldbe obtained by changing the location of electricity generation units. This ishowever outside the responsibility of grid operators.The potential that is achievable through measures conducted by the gridcompanies themselves is around 175GWh/year by 2020 and 400GWh/year by2030. In relation to total losses, these potentials are quite small: 4% by 2020 and7% by 2030.Standards for new transformers through the EcoDesign Directive are expected toincentivise energy efficiency improvements.

IDENTIFYING ENERGY EFFICIENCY IMPROVEMENTS AND SAVING POTENTIAL IN ENERGY NETWORKS –INTERIM REPORT
GRIDEE/4NT/0364174/000/00 Ed. 2015/05/11 91/110
This
docu
men
tis
the
prop
erty
ofTr
acte
belE
ngin
eerin
gS.
A.An
ydu
plic
atio
nor
tran
smis
sion
toth
irdpa
rtie
sis
forb
idde
nw
ithou
tpr
ior
writ
ten
appr
oval
Losses in gas grids are considered very limited and therefore investments inenergy efficiency measures would not be justified.
o A key remark made by the study is that reduction of losses should not be the main driverof grid investments, as that can lead to sub-optimal solutions. It is important to adopt asystems approach for energy efficiency.
o In this respect, the introduction of regulatory incentives to improve more efficientnetwork operations are expected to support investment plans which take also lossreduction into account.
Summary of key insights of the survey
The following insights have been derived from the analysis of the survey respondents. Further literatureanalysis has been carried out to further validate received replies:
State of play in Member Stateso Significant differences across Member States concerning the level of losses.o Starting conditions of grids (e.g. voltage level; number of transformers) and potentials
for energy efficiency improvement are different. Transposition of best practices shouldbe done with care.
Driverso Energy efficiency within larger grid investment decision plans - Energy efficiency is
typically taken into account in grid investment decisions, however often it is not themain driver. Energy efficiency is considered as one of the variables of a largerinvestment optimization plan. The importance of energy efficiency as a criterion in gridinvestment decisions clearly depends on the existence of regulatory incentives to reducelosses.
o Compliance with energy efficiency obligations: In specific cases, energy efficiencyinvestments (particularly concerning loss reduction) are undertaken to comply withregulatory requirements and quality standards (e.g. compliance with the EcoDesigndirective leading to installation of higher efficiency transformers)
Mapping of losseso Electricity losses mainly occur at distribution levelo The implementation of adequate metering systems at substations and at customers’
premises is an important first step to identify where losses are actually occurring in thedistribution grid.
o The following factors have a key impact on the level of losses in the systemLoading (including peak demand)

IDENTIFYING ENERGY EFFICIENCY IMPROVEMENTS AND SAVING POTENTIAL IN ENERGY NETWORKS –INTERIM REPORT
GRIDEE/4NT/0364174/000/00 Ed. 2015/05/11 92/110
This
docu
men
tis
the
prop
erty
ofTr
acte
belE
ngin
eerin
gS.
A.An
ydu
plic
atio
nor
tran
smis
sion
toth
irdpa
rtie
sis
forb
idde
nw
ithou
tpr
ior
writ
ten
appr
oval
Number of energized transformersLengths of the feeders and grid voltage levelsLevel of power qualityPresence of distributed energy resources
Catalogue of energy efficiency measureso A variety of energy efficiency measures exist, and their potential is very much related to
the specific local grid conditions.o In general, system operators opt for traditional investments (replacement of assets;
reinforcements etc.) to improve grid energy efficiency.
Factors impacting grid energy efficiency potential outside control and responsibility of systemoperators
o Smart Grid-related EE measures (e.g. feed-in control) are less common: in many casesthe right regulatory framework is not in place to make them a viable option.
o External factors outside the control of system operators can also greatly impact thepotential of EE measures: e.g. the development and location of DERs.
Cost-effectivenessIn general, a number of factors can greatly impact the cost-effectiveness of energy efficiency measures,including:
o Monetary value of losses, i.e. the average price of wholesale electricity (the higher, themore cost-effective are EE measures)
o Loss reduction is a side-benefit of investments driven by other needs. Therefore the cost-effectiveness of an energy efficiency measure depends on additional benefits in terms ofCAPEX/OPEX reduction.
o When implementing EE measures, additional benefits in terms of reduction of CAPEXand OPEX should be considered. However, for some measures, a trade-off needs to befound between improvement of energy losses and other benefits (e.g. trade-off withhosting capacity for DER voltage measure).
o Parallel developments (e.g. roll-out of smart meters; built-in smart functionalities in DGconverters etc.) make the enabling infrastructure for certain EE measure alreadyavailable, reducing their implementation costs.
o Most adopted EE measures concern implementation of higher efficiency assets (e.g.higher capacity cable; higher efficiency transformers) within a planned assetreplacement strategy. An overall investment optimization strategy is therefore key toensure that most cost-effective energy efficiency measures are implemented.

IDENTIFYING ENERGY EFFICIENCY IMPROVEMENTS AND SAVING POTENTIAL IN ENERGY NETWORKS –INTERIM REPORT
GRIDEE/4NT/0364174/000/00 Ed. 2015/05/11 93/110
This
docu
men
tis
the
prop
erty
ofTr
acte
belE
ngin
eerin
gS.
A.An
ydu
plic
atio
nor
tran
smis
sion
toth
irdpa
rtie
sis
forb
idde
nw
ithou
tpr
ior
writ
ten
appr
oval
Energy efficiency measures implemented by survey respondents
Figure 0-2 provides a brief synthesis of grid energy efficiency measures implemented by respondents.The survey results show that classical measures such as transformers replacement and line capacityincrease are the most commonly adopted measures, as their implementation fits with traditionalreplacement programs, where old or inefficient assets are targeted. Reactive power Management is alsowell adopted, since voltage quality and distributed generation can also be addressed.
Figure 0-2 - Grid energy efficiency measures in electricity grids adopted by survey respondents
Table 0-1 shows examples of achieved energy efficiency results thanks to implemented measures:
0
2
4
6
8
10
12
Num
bero
fDSO
adop
ting
the
mea
sure
Number of DSOs adopting the measure

IDENTIFYING ENERGY EFFICIENCY IMPROVEMENTS AND SAVING POTENTIAL IN ENERGY NETWORKS –INTERIM REPORT
GRIDEE/4NT/0364174/000/00 Ed. 2015/05/11 94/110
This
docu
men
tis
the
prop
erty
ofTr
acte
belE
ngin
eerin
gS.
A.An
ydu
plic
atio
nor
tran
smis
sion
toth
irdpa
rtie
sis
forb
idde
nw
ithou
tpr
ior
writ
ten
appr
oval
Measures Implementation example Highlights of lossreduction
Costs Additionalbenefits
High efficiencytransformers
VSD is replacing 100transformers/year since2011 – 10% have beenreplaced so far.CEZ Bulgaria replacedtheir four 110kV/20kVtransformers with thehighest losses.Enexis is replacing theiroldest MV/LVtransformers by morerecent re-use transformers.
VSD expects 8.5% oflosses reduction.CEZ Bulgaria saved6.7 k€/year on lossesper replacedtransformer.In the UK, low losstransformers appear asone the most efficientsolution.
For CEZ CzechRepublic, costsincrease of atleast 20%.Enexis isreplacing oldMV/KVtransformers for5.3k€/transfo
Higher qualityof supply, loweroverheating
Increasing linecapacity
VSD increase theirmaximum cross section oftheir LV lines from 70mm²to 150mm².
Belgian DSO’s aredeveloping a tool toincorporate losses in theselection of the minimalcable section.
VSD expects onaverage a 5% (locallyup to 20%) reduction oflosses,
Higher voltagequality, lowerprobability offault, increasecapacity
Voltageoptimisation /Reactive powermanagement
CEZ Bulgaria equippedthree of their 110kV/10-20kV substation withcapacitors and harmonicsfiltering units.
CEZ Czech Republic isconducting a pilot projectwhere 20 synchronousgenerators in 110kVreceive set point in voltageand reactive power.
ErDF implementedVolt/Var control ofdistributed generation.2-3% of loss reductionis reported.
CEZ Czech Republicperformed a lossreduction of 7% perline, leading to 2.5%overall reduction.
CEZ Bulgariaequipped 3110kV/MVsubstation at acost of 528k€
DistributedGenerationintegration
Optimisation ofthe voltageprofile
Increase voltagelevel
Vattenfal is currentlystudying area per area atoptimising the voltagelevel in their regional grid.
HEDNO and EDP
Vattenfal expects a 5%to 15% loss reductionfrom the increase involtage levels, withlocally 25-30%

IDENTIFYING ENERGY EFFICIENCY IMPROVEMENTS AND SAVING POTENTIAL IN ENERGY NETWORKS –INTERIM REPORT
GRIDEE/4NT/0364174/000/00 Ed. 2015/05/11 95/110
This
docu
men
tis
the
prop
erty
ofTr
acte
belE
ngin
eerin
gS.
A.An
ydu
plic
atio
nor
tran
smis
sion
toth
irdpa
rtie
sis
forb
idde
nw
ithou
tpr
ior
writ
ten
appr
oval
increased the number ofhigher voltagetransformers, thusincreasing the share ofhigher voltage portion ofthe grid.
HEDNO and EDPincreased the number ofhigher voltagetransformers, thusincreasing the share ofhigher voltage portionof the grid.
ConservationVoltageReduction
Stromnetz Berlin hasalready conducted voltagereduction
According to anOFGEM study, theincrease share ofvoltage-insensitiveloads is underminingthe potential of thismeasure.
Table 0-1 - Highlights of energy efficiency measures in electricity grids implemented by survey respondents

IDENTIFYING ENERGY EFFICIENCY IMPROVEMENTS AND SAVING POTENTIAL IN ENERGY NETWORKS –INTERIM REPORT
GRIDEE/4NT/0364174/000/00 Ed. 2015/05/11 96/110
This
docu
men
tis
the
prop
erty
ofTr
acte
belE
ngin
eerin
gS.
A.An
ydu
plic
atio
nor
tran
smis
sion
toth
irdpa
rtie
sis
forb
idde
nw
ithou
tpr
ior
writ
ten
appr
oval
ANNEX III - SURVEY - QUESTIONNAIRE FORMAT
A Project CONTEXT and goal of the QUESTIONNAIRE
• According to Article 15(2) of the Directive, Member States shall ensure, by 30 June 2015, that:– (a) an assessment is undertaken of the energy efficiency potentials of their gas and
electricity infrastructure, in particular regarding transmission, distribution, loadmanagement and interoperability, and connection to energy generating installations,including access possibilities for micro energy generators;
– (b) concrete measures and investments are identified for the introduction of cost-effective energy efficiency improvements in the network infrastructure, with a timetablefor their introduction.
• The European Commission has recently launched a study to provide support to Member States infulfilling the requirements of article 15.2 of the Energy Efficiency Directive
– The study is titled “Measures for grid energy efficiency in gas and electricity grids”– The European Commission considers that cooperation of relevant stakeholders (system
operators, regulatory authorities) is a key element to maximize the pertinence and impactof the study.
• The goal of this questionnaire is to collect data and best practices from system operators:• Description of energy efficiency measures for electricity grids (measures for reducing
technical losses)• Description of energy efficiency measures for gas grids (measures for reducing gas
losses and for optimizing use of energy in grid operations)
B Survey Part 1 - Energy efficiency in electricity grids
1. Please provide a description of your specific grid conditions :
Average number of customers per KM2
Average length of feeders
Number of customers
Number of voltage levels in the grid?

IDENTIFYING ENERGY EFFICIENCY IMPROVEMENTS AND SAVING POTENTIAL IN ENERGY NETWORKS –INTERIM REPORT
GRIDEE/4NT/0364174/000/00 Ed. 2015/05/11 97/110
This
docu
men
tis
the
prop
erty
ofTr
acte
belE
ngin
eerin
gS.
A.An
ydu
plic
atio
nor
tran
smis
sion
toth
irdpa
rtie
sis
forb
idde
nw
ithou
tpr
ior
writ
ten
appr
oval
Length of the network per voltagelevel?
Number of transformers?
Average age of transformers?
Level of losses on the grid in the lastfive years?
2 Please provide a short description of the on-going and planned energy efficiencymeasures (measures for reducing technical losses):
Are there any regulatory incentives toreduce grid energy losses?
Which energy efficiency measures havebeen taken so far?
Which energy efficiency measures areyou planning?
3 Please find below a proposed list of energy efficiency measures. Could you pleaseprovide your comments?

IDENTIFYING ENERGY EFFICIENCY IMPROVEMENTS AND SAVING POTENTIAL IN ENERGY NETWORKS –INTERIM REPORT
GRIDEE/4NT/0364174/000/00 Ed. 2015/05/11 98/110
This
docu
men
tis
the
prop
erty
ofTr
acte
belE
ngin
eerin
gS.
A.An
ydu
plic
atio
nor
tran
smis
sion
toth
irdpa
rtie
sis
forb
idde
nw
ithou
tpr
ior
writ
ten
appr
oval
4 Please provide a description, as detailed as possible, of energy efficiency measures youhave implemented or are planning to implement.
DESCRIPTION OF ENERGY EFFICIENCY MEASURES –ELECTRICITY GRIDS
Which measure? Please describe.
Level of penetration of the measure?(e.g. number of impacted feeders,transformers…)
Which losses reduction has beenobserved (%)?
Which factors have a high sensitivityon the cost-effectiveness of themeasure? (e.g. age of asset, peakload,…)
Additional Benefits? (reduction ofCAPEX/OPEX,…)
Estimation of the cost of the measure?
Which lessons learned to optimize theimplementation of this measure?
C Survey Part 2 - Energy efficiency in gas grids
1 Please provide a description of your specific grid conditions by filling in this table:
Average number of customers per Km2
Number of customers
Number of pressure levels in the grid?
Length of the network per pressurelevel?

IDENTIFYING ENERGY EFFICIENCY IMPROVEMENTS AND SAVING POTENTIAL IN ENERGY NETWORKS –INTERIM REPORT
GRIDEE/4NT/0364174/000/00 Ed. 2015/05/11 99/110
This
docu
men
tis
the
prop
erty
ofTr
acte
belE
ngin
eerin
gS.
A.An
ydu
plic
atio
nor
tran
smis
sion
toth
irdpa
rtie
sis
forb
idde
nw
ithou
tpr
ior
writ
ten
appr
oval
Number of pressure reduction stations?
Average age of gas heaters in pressurereduction stations?
Level of losses on the grid in the lastfive years?
2 Please provide a short description of the on-going and planned energy efficiencymeasures (measures for reducing gas shrinkage and for optimizing use of energy ingrid operations)
Are there any regulatory incentives toimprove grid energy efficiency (i.e.reduction of gas losses and of use ofenergy)?
Which energy efficiency measures havebeen taken so far?
Which energy efficiency measures areyou planning?
3 Please find below a proposed list of energy efficiency measures. Could you pleaseprovide your comments?
Measures for reducing energy use for grid operation (e.g. optimization of compression; pressure profiles)
Gas heatingIncrease the use of multistage regulator lines, lines insulation, heat exchanger…Use of high-efficiency gas heaters in pressure reduction stationsUse of CHP
Cathodic protection Autonomous generation through solar panelsQuantity of gas delivered to LP users Optimization of the delivered pressure
Reduce transmission needs by using decentralizedgeneration
Biogas plantsStoragePower-to-gasMeasures for reducing gas losses
Scheduled for operationLower pressure through a closed by LP-gridOptimization of the valves placed on the grid to reduce the volume to evacuateIncrease the use of mobile flow interrupter
Unscheduled (leakages)
Replacement of old pipes to PE pipes% of steel pipes cathodically protectedNumber of valves on the networkUse of automatic flow-stopper on grid and connectionsLimitations of the operating pressure
Assessment of lossesSmart MetersFrequency of leakage detections

IDENTIFYING ENERGY EFFICIENCY IMPROVEMENTS AND SAVING POTENTIAL IN ENERGY NETWORKS –INTERIM REPORT
GRIDEE/4NT/0364174/000/00 Ed. 2015/05/11 100/110
This
docu
men
tis
the
prop
erty
ofTr
acte
belE
ngin
eerin
gS.
A.An
ydu
plic
atio
nor
tran
smis
sion
toth
irdpa
rtie
sis
forb
idde
nw
ithou
tpr
ior
writ
ten
appr
oval
4 Please provide a description, as detailed as possible, of energy efficiency measures youhave implemented or are planning to implement. Please include additional slides todescribe additional measures.
DESCRIPTION OF ENERGY EFFICIENCY MEASURES –ELECTRICITY GRIDSWhich measure? Please describe.Level of penetration of themeasure? (e.g. number ofimpacted pipelines/pressurestations)Which losses reduction has beenobserved (%)?Which factors have a highsensitivity on the cost-effectiveness of the measure?(e.g. pressure level, age ofasset,…)Additional Benefits? (reductionof CAPEX/OPEX,…)Estimation of the cost of themeasure?Which lessons learned tooptimize the implementation ofthis measure?

IDENTIFYING ENERGY EFFICIENCY IMPROVEMENTS AND SAVING POTENTIAL IN ENERGY NETWORKS –INTERIM REPORT
GRIDEE/4NT/0364174/000/00 Ed. 2015/05/11 101/110
This
docu
men
tis
the
prop
erty
ofTr
acte
belE
ngin
eerin
gS.
A.An
ydu
plic
atio
nor
tran
smis
sion
toth
irdpa
rtie
sis
forb
idde
nw
ithou
tpr
ior
writ
ten
appr
oval
ANNEX IV - TOOL FOR RANKING MEASURESACCORDING TO THEIR COST-EFFECTIVENESS
An excel tool has been set-up to guide project promoters in the assessment of the cost-effectiveness ofdifferent energy efficiency measures according to their local grid conditions. The tool highlights themain factors affecting the benefits and cost of each measure and provides examples for benchmark.
The goal of the tool is to help project promoters in selecting good candidate measures and come up withan overall Energy Efficiency strategy.
This document is the support to an Excel tool, whose goal is to help the user to make up a qualitativecost-efficiency ranking. Those forewords aim to present the general methodology behind this tool.
The analysis provided through the tool is divided in two mains steps:
1. Measure by measure impact and cost assessment2. Ranking of those measure in term of efficiency and cost
The figure here below shows the schematic organisation of the tool:

IDENTIFYING ENERGY EFFICIENCY IMPROVEMENTS AND SAVING POTENTIAL IN ENERGY NETWORKS –INTERIM REPORT
GRIDEE/4NT/0364174/000/00 Ed. 2015/05/11 102/110
This
docu
men
tis
the
prop
erty
ofTr
acte
belE
ngin
eerin
gS.
A.An
ydu
plic
atio
nor
tran
smis
sion
toth
irdpa
rtie
sis
forb
idde
nw
ithou
tpr
ior
writ
ten
appr
oval
Step 1 – Measure by measure analysis
The goal of this step is to assess, on one hand, the impact of one measure on the user’s specific gridlosses, investment planning and grid operations, and, on the other hand, to assess the cost of itsimplementation. It is important to note here that all the final assessment is on the user’s hands, withstrong guidelines provided by the Task 1 and 2, presented in this report. The analysis to be done for onemeasure is presented in figure 2.

IDENTIFYING ENERGY EFFICIENCY IMPROVEMENTS AND SAVING POTENTIAL IN ENERGY NETWORKS –INTERIM REPORT
GRIDEE/4NT/0364174/000/00 Ed. 2015/05/11 103/110
This
docu
men
tis
the
prop
erty
ofTr
acte
belE
ngin
eerin
gS.
A.An
ydu
plic
atio
nor
tran
smis
sion
toth
irdpa
rtie
sis
forb
idde
nw
ithou
tpr
ior
writ
ten
appr
oval
The elements providing by the present report and being the guidelines of the tool are classified as follow:
Grid factors: losses, CAPEX and OPEX reduction highly depends of the specific conditions ofeach grid, such as the current technology in use, the fault rate, the average of assets,…Implementation constraints: present the elements of the grid how influence the cost of work,such as the situation of the lines (underground/overhead), facility of access, age of the assetsPlanned investments: list other investments which may provide opportunities for synergies andreduce implementation costs.Asset list: list of the assets which should be implemented for the measure.
Step 1.1 – Impact assessment
The users will be guided in the tool following open question, based on open questions, in order to allowthe user to build a complete analysis in function of his own grid factors. Each measure should beassessed independently from the others, as well as each factor, following an exhibit as presented downhere:
MEASURE N Loss reduction Investment planningimpact
Grid operationimpact
Open question to guideexperts reflexions
Current load rate? Future capacity needs? Fault rate?
Possible penetration?
Grid factors
Grid factors
Loss impact
Plannedinvestments
Implementationconstraints
Assets list
Costassessment
Invest. Planning impact
Grid op. impact
Grid factors

IDENTIFYING ENERGY EFFICIENCY IMPROVEMENTS AND SAVING POTENTIAL IN ENERGY NETWORKS –INTERIM REPORT
GRIDEE/4NT/0364174/000/00 Ed. 2015/05/11 104/110
This
docu
men
tis
the
prop
erty
ofTr
acte
belE
ngin
eerin
gS.
A.An
ydu
plic
atio
nor
tran
smis
sion
toth
irdpa
rtie
sis
forb
idde
nw
ithou
tpr
ior
writ
ten
appr
oval
Expected impact … … …
It is important to repeat at this point that the expected impact here is a totally free judgement from theuser. It will serve as basis for the ranking of the measure in the next step.
Step 1.2 – Cost assessment
Secondly, the cost assessment of the measure has to be performed. As for the impact assessment, openquestions guide the user to assess his costs in his own case, based on the local work constraints, the assetlist for a measure and the current investments already planned for the concerned assets. It is especiallyfor this last point that the final exhibit (presented here below) of this cost assessment make a parallelismbetween all the measure and the planned investment, asset by asset, in order the identify replacementalready in the pipe and synergies between measures. If such synergies appear, the measure list should beadapted, and a new assessment should be done, taking this time the merged measures into account.
Investment currently planned Measure 1 Measure 2
Asset 1
Asset 2
Asset …
Step 2 – Ranking of the measures (pair-wise comparison)
Based on the step 1 analysis, the user should rank the measures between them, for each KPI and for thecost. This is performed in the tool through a Multi-Criteria Analysis. The principle is the following:
1. For one KPI, each measure is weighted in front of the others, between 0.1 (very low efficiencycompared to the other measure) and 9 (highly efficient).
2. A relative priority is then given for each measure (the higher the score, higher was the efficiencyof the measure in front of all the others). An exemple of those two first step is given below

IDENTIFYING ENERGY EFFICIENCY IMPROVEMENTS AND SAVING POTENTIAL IN ENERGY NETWORKS –INTERIM REPORT
GRIDEE/4NT/0364174/000/00 Ed. 2015/05/11 105/110
This
docu
men
tis
the
prop
erty
ofTr
acte
belE
ngin
eerin
gS.
A.An
ydu
plic
atio
nor
tran
smis
sion
toth
irdpa
rtie
sis
forb
idde
nw
ithou
tpr
ior
writ
ten
appr
oval
Measure 1 Measure 2 Measure 3 Measure… Relativepriorities
Measure 1 1 1/3 1/2 … 0,3
Measure 2 3 1 2 … 0,17
Measure 3 2 0.5 1 … 0,04
Measure…
… … … 1 …
3. A priority should also be given to the KPIs. A MCA comparison is also perform between eachKPI. The ranking is made by taking into account the current level of losses, the targeted level,the regulatory framework, the presence of incentive aiming to reduce losses, CAPEX, OPEX…The relative priority calculated for each KPI is used to weight the different priorities given toone measure between them.
4. The sum of the weighted priorities gives the overall ranking of the efficiency of the measures,such as showed in exhibit xxx.
KPI 1 KPI 2 KPI 3 Weightedpriorities
KPIs weights 0,5 0,2 0,3
Measure 1 0,3 0,02 0,4 0,29
Measure 2
Measure 3
Measure … … … … …
5. Following the same rules, a ranking of the costs is performed, and is used as qualitativeassessment of the costs.

IDENTIFYING ENERGY EFFICIENCY IMPROVEMENTS AND SAVING POTENTIAL IN ENERGY NETWORKS –INTERIM REPORT
GRIDEE/4NT/0364174/000/00 Ed. 2015/05/11 106/110
This
docu
men
tis
the
prop
erty
ofTr
acte
belE
ngin
eerin
gS.
A.An
ydu
plic
atio
nor
tran
smis
sion
toth
irdpa
rtie
sis
forb
idde
nw
ithou
tpr
ior
writ
ten
appr
oval
6. The final cost-efficiency ranking is given by the ratio . It is important to note
the results provided here are qualitative, and should only be used to identify which measureshould be further investigate in more quantitative way. The graph provided here below give anexemple of the results, where “quick wins” and ‘must do” can be easily identified.
High efficiencytransformers
Increase of linescapacities
Increase of thevoltage level
Demandresponse
DistributedGeneration
Networkreconfiguration
Reactive powermanagement
CVR
Balancing 3phases-loading
0.00 1.00 2.00 3.00 4.00
Final score/cost

IDENTIFYING ENERGY EFFICIENCY IMPROVEMENTS AND SAVING POTENTIAL IN ENERGY NETWORKS –INTERIM REPORT
GRIDEE/4NT/0364174/000/00 Ed. 2015/05/11 107/110
This
docu
men
tis
the
prop
erty
ofTr
acte
belE
ngin
eerin
gS.
A.An
ydu
plic
atio
nor
tran
smis
sion
toth
irdpa
rtie
sis
forb
idde
nw
ithou
tpr
ior
writ
ten
appr
oval
BIBLIOGRAPHY
[1] European Commission, “Energy Efficiency Directive,” 12 October 2012. [Online].Available: http://eur-lex.europa.eu/legal-content/EN/TXT/?qid=1399375464230&uri=CELEX:32012L0027. [Accessed January2015].
[2] OFGEM, “An assessment of the energy efficiency potential of the gas and electricityinfrastructure of Great Britain,” 2014.
[3] Western Power Distribution, “Losses Strategy,” 2015.
[4] Ecofys, “Flexibility options in Electricity Systems,” Berlin, Germany, 2014b.
[5] Waide Strategic Efficiency, “PROPHET II: The potential for global energy savings fromhigh-efficiency distribution transformers,” 2014.
[6] KEMA , “Analysis of Insufficient Regulatory Incentives for Investments into ElectricNetworks. An Update.,” 2009.
[7] ERGEG, “ Treatment of Losses by Network Operators. doi:Ref: E08-ENM-04-03,” 2008.
[8] M. Oddi, F. Gorgette and G. Roupioz, “ERDF experience in reducing network losses,” inProceedings 20th International Conference on Electricity Distribution CIRED, Prague,2009.
[9] K. Schneider, F. Tuffner, J. Fuller and R. Singh, “Application of Automated Controls forVoltage and Reactive Power Management - Initial Results,” U.S Department of Energy,2012.
[10] Bundesnetzagentur, Bundeskartellamt, “Monitoringbericht 2014,” Bonn, 2014.
[11] TEN Thüringer Energienetze GmbH, “Netzverluste,” 2014.
[12] W. Heckmann, L. Hamann, M. Braun, H. Barth, J. Dasenbrock, C. MA, T. Reimann and A.Scheidler, “Detailed analysis of network losses in a million customer distrbution grid withhigher penetration of distributed generatrion,” in 22nd International Conference onElectricity Distribution, Stockholm, 2013.
[13] TenneT TSO GmbH, “Netzverluste,” 2014.
[14] BMWi, “Verteilernetzstudie,” 2012.
[15] M. Clemence, R. Coccioni and A. Glatigny, “Schneider Electric White Paper: How UtilityElectrical Distribution Networks can Save Energy in the Smart Grid Era,” SchneiderElectric, 2013.
[16] Eurelectric, “Power Distribution in Europe - Facts & Figures,” 2013.
[17] C.-A. Sylvie, “ERGEG public consultation on "Treatment of Losses by Network Operators,”EnBW Energie Baden-Württemberg, 2008.
[18] F. Topalis, W. Irrek and R. Targosz, “Strategies for development and diffusion of EnergyEfficient Distribution Transformers,” SEEDT Project, 2008.
[19] L. Fickert, W. Spitzl, E. Schmautzer, W. Brandauer, TU Graz and Wien Energie StromnetzGmbH, “Strategien zur Minimierung von Netzverlusten,” in 6. InternationaleEnergiewirtschaftstagung an der TU Wien, Wien, 2009.

IDENTIFYING ENERGY EFFICIENCY IMPROVEMENTS AND SAVING POTENTIAL IN ENERGY NETWORKS –INTERIM REPORT
GRIDEE/4NT/0364174/000/00 Ed. 2015/05/11 108/110
This
docu
men
tis
the
prop
erty
ofTr
acte
belE
ngin
eerin
gS.
A.An
ydu
plic
atio
nor
tran
smis
sion
toth
irdpa
rtie
sis
forb
idde
nw
ithou
tpr
ior
writ
ten
appr
oval
[20] J. Lazar and X. Baldwin, “Valuing the Contribution of Energy Efficiency to AvoidedMarginal Line Losses and Reserve Requirements,” Regulatory Assistance Project, 2011.
[21] S. Kalambe and A. Ganga, “Loss minimization techniques used in distribution network:bibliographical survey,” Renewable and Sustainable Energy Reviews 29, pp. 184-200,2014.
[22] G. Papaefthymiou, P. Zonneveld, E. Coster and L. van der Sluis, “Calculation of gridlosses with the aid of stochastic modeling of wind turbines and loads,” in 16th PowerSystems Computation Conference. Vol. 2, 2008.
[23] C. Bucher, “Analysis and Simulation of Distribution Grids with Photovoltaics,” ETH Zürich,Zürich, 2014.
[24] S. Abbott, B. Fox and D. Morrow, “Distribution Network Voltage SUpport UsingSensitivitzßbased Dispatch of Distributed Generation,” 2013.
[25] E. Coster, J. Myrzik, B. Kruimer and W. Kling, “Integration Issues of DistributedGeneration in Distribution Grids,” Proceedings of the IEEE, vol. 99, no. 1, pp. 28-39,2011.
[26] S. ur , G. Strbac and X. Zhang, “Effect of losses in design of distribution circuits,” IEEProceedings Gener.Transm. Distrib., , Vols. 148, No. 4, no. 4, 2001.
[27] IEA, “Electricity Information,” 2014.
[28] K. Niall and A. Walsh, “Maximising benefits from distribution losses management - AnESBN perspective,” Frankfurt, 2011.
[29] F. R. D. A. Merschel and N. K. I. o. T. Mathias, “The AmpaCity Project,” T&D WorldMagazine, 23 Dec 2013.
[30] E. Koliou , T. Eklund, L. Söder , C. Bartusch, K. Alvehag and R. Hakvoort, “EconomicImpact of Demand Response on Costs to Distribution System Operators,” KTH RoyalInstitute of Technology, Stockholm, 2013.
[31] MVV Energie AG, IWES, IBM, IFEU, IZES, Papendorf Software Engineering, Power PlusCommunication AG, Universität Duisburg-Essen, “Modellstadt Mannheim,” 2013.
[32] B. Bergesen, L. Groth, B. Langseth, I. Magmussen, D. Spilde and J. Toutain, “Energyconsumption 2012 - Household energy consumption,” Norwegian Water Resources andEnergy Directorate, 2012.
[33] C. L. U. F. M. I. E. ECN, “Market and regulatory incentives for cost efficient integration ofDG in the electricity system,” 2010.
[34] A. Nourai, V. Kogan and C. M. Schafer, “Load Leveling Reduces T&D Line losses,” 2007.
[35] Southern Energy Power Distribution, “Low Energy Automated Networks,” Low CarbonNetworks, 2014.
[36] NRECA, Pinney and CRN, “Costs and Benefits of Smart Feeder Switching,” 2013.
[37] D. Pinney, “Costs and Benefits of Smart Feeder Switching: Quantifying the operatingvalue of SFS,” National Rural Electric Cooperative Association, for U.S. DOE/NETL, 2013.
[38] U.S Department of Energy, “Application of Automated Controls for Voltage and ReactivePower Management - Initial Results,” Smart Grid Investment Grant Program, 2012.
[39] Western Power Distribution, Accenture, “Low Voltage Network Templates Summaryreport,” 2014.
[40] D. Divan, “Improving power line utilization and performance with D-FACTS devices,”

IDENTIFYING ENERGY EFFICIENCY IMPROVEMENTS AND SAVING POTENTIAL IN ENERGY NETWORKS –INTERIM REPORT
GRIDEE/4NT/0364174/000/00 Ed. 2015/05/11 109/110
This
docu
men
tis
the
prop
erty
ofTr
acte
belE
ngin
eerin
gS.
A.An
ydu
plic
atio
nor
tran
smis
sion
toth
irdpa
rtie
sis
forb
idde
nw
ithou
tpr
ior
writ
ten
appr
oval
2005.
[41] L. F. Ochoa and G. P. Harrison, “Minimising Energy Losses: Optimal Accomodation andSmart Operation of Renewable Distributed Generation,” 2010.
[42] UK Government, “Domestic energy consumption in the UK between 1970 and 2013,”Department of Energy and Climate Change, 2014.
[43] D. K.Chembe, “Reduction of Power Losses Using Phase Load Balancing Method in PowerNetworks,” World Congress on Engineering and Computer Science Vol I, 2009.
[44] S. Weckx, C. Gonzales and J. Driesen, “Reducing Grid Losses and Voltage Unbalance withPV inverters,” in PES General Meeting-Conference & Exposition IEEE, National Harbor,MD, 2014.
[45] L. B. N. Laboratory, “Cost-Effective Potential for Imporved Energy Efficiency of KeyElectrical Products in India,” 2006.
[46] Ernest Orlando Lawrence Berkeley National Laboratory, “Energy Efficiency Potental forDistribution Transformers in the APEC Economies,” 2013.
[47] European Commission, “Evaluation of Smart Grid projects within the Smart Grid TaskForce Expert Group 4 (EG4),” European Commission, 2013.
[48] J. Hechenbergerova, P. Musilek, E. Pelikan and D. Koval, “Identification of critical agingsegments and hotspots of power transmission lines,” in 9th International Conference onEnvironment and Electrical Engineering , 2010.
[49] M. Lupescu, “Improving the energy efficiency by reducing the losses in the low-voltagepower distribution grid,” U.P.B. Sci. Bull., Series C, Vol. 72, Iss. 4, 2010 , 2010.
[50] The Energy Storage Association, “T&D Upgrade Deferral,” [Online]. Available:http://energystorage.org/energy-storage/technology-applications/td-upgrade-deferral.[Accessed 24 04 2015].
[51] N. Grass, G. Kerber, M. Sebeck and R. Keck, Grass, N.;Kerber, G.;Sebeck,M.;Keck,R..
[52] U.S. Department of Energy, “Fault Location, Isolation, and Service RestorationTechnologies Reduce Outage Impact and Duration,” 2014.
[53] D. Bernardon and L. L. Pfitscher, “Automatic reconfiguration of distribution networksusing smart grid concepts,” in 10th IEEE/IAS International Conference on IndustryApplications (INDUSCON), 2012.
[54] A. Shammah, A. Azmy and A. Abou El-Ela, “Optimal Sitting and Sizing of CapacitorsBanks in Distribution Networks using Heuristic Algorithms,” Journal of Electrical Systems,Vols. 9-1, pp. 1-12, 2013.
[55] J. Dixon, L. Morán, J. rodirguez and R. Domke, “Reactive Power CompensationTechnologies, State-of-the-Art Review,” Proceedings of the IEEE, Vol. 93, December2005.
[56] M. Meuser and H. H.-J. Vennegeerts, “IMPROVED GRID INTEGRATION OF DISTRIBUTEDGENERATION IN EXISTING NETWORK STRUCTURES,” in 21st International Conference onElectricity Distribution, Frankfurt, 2011.
[57] NRECA-DOE smart grid demonstration project, “Costs and Benefits of ConservationVoltage Reduction – CVR Warrants Careful Examination,” 2013.
[58] “ Article 15.2. Approach and examples from Denmark,” 2014.
[59] U. D. o. Energy, “Evaluation of Conservation Voltage Reduction on a National Level,”2010.

IDENTIFYING ENERGY EFFICIENCY IMPROVEMENTS AND SAVING POTENTIAL IN ENERGY NETWORKS –INTERIM REPORT
GRIDEE/4NT/0364174/000/00 Ed. 2015/05/11 110/110
This
docu
men
tis
the
prop
erty
ofTr
acte
belE
ngin
eerin
gS.
A.An
ydu
plic
atio
nor
tran
smis
sion
toth
irdpa
rtie
sis
forb
idde
nw
ithou
tpr
ior
writ
ten
appr
oval
[60] S. Weckx, C. Gonzalez DeMiguel and P. Vingerhoets, “Phase switching and phasebalancing to cope with a massive photovoltaic penetration,” in 22nd InternationalConference on Electricity Distribution, Stockholm, 2013.
[61] Marcogaz, “Reduction of methane emissions in the European gas industry,” 2008.
[62] US EPA, “Natural Gas STAR Program”.
[63] Ecofys, “Economic Evaluation of Methane Emission Reduction in the Extraction, Transportand Distribution of Fossil Fuels in the EU,,” 2001.
[64] ICF, “Economic analysis of methane emission reduction opportunities in the U.S. onshoreoil and natural gas industries,” 2014.
[65] A. Al-Badi, A. Elmoudi and I. Metwally, “Losses Reduction In Distribution Transformers,”in Proceedings of the International Multiconference of Engineers and Compute ScienstisVol II, 2011.
[66] Electrical Engineering Portal, “Electrical Engineering Portal - Primary Distribution VotlageLevels,” 10 August 2012. [Online]. Available: http://electrical-engineering-portal.com/primary-distribution-voltage-levels. [Accessed April 2015].
[67] B. Sampath Kumar and Inamdar, “Loss Reduction by Optimal Placement of DistributedGeneration on A Radial feeder,” ACEEE Int. J. on Electrical and Power Engineering,Vol.02, No. 01, pp. 24-29, 2011.
[68] Synergrid, “Etude de Synergrid pour la réalisation de l’article 15.2 de la Directived’efficacité énergétique 2012/27/EU du Parlement Européen et le Conseil du 25 octobre2012,” 2015.
[69] Energeia, Department of Resources, Energy and Tourism, “Energy EfficiencyOpportunities in Electricity Networks - Findings of industry trials for the extension of theEEO program to network businesses,” Australian Government, 2013.
[70] Operation Technology Inc., “Optimal Capacitor Placement: Cost Benefits Due to LossReduction,” etap.com, Irvine.
[71] H. Saboori and H. Abdi, “Application of a Grid Scale Energy Storage System to ReduceDistribution Network Losses,” 2010.
[72] energynautics, “Kurzgutachten zur Eigenstromerzeugung in Rheinland-Pfalz,” 2014.
[73] NRECA; CRN - Cooperative Research Network, “Costs and Benefits of Smart FeederSwitching - Quantifying the Operating Value of SFS - Initial Findings,” 2013.
[74] PRCI, “Methods to Reduce the Greenhouse Gas Footprint from Pipeline Compressor andPump Stations,” 2014.
[75] Ecofys, “Methane from fugitive emissions,” 2009