identifying facility siting raw risk and the risk
TRANSCRIPT

©2016 aeSolutions
Craig Shell & Stephen W. Kelly aeSolutions Publication
Oct 21, 2012 Page 1
Identifying Facility Siting Raw Risk and the Risk Reduction Decision Process
Craig Shell Director of Process Safety
[email protected] aeSolutions, Greenville, South Carolina, USA
Stephen W. Kelly Senior Process Engineer
[email protected] Huntsman Corporation, Conroe, Texas, USA
Abstract
One of the outcomes of a facility siting study is the presentation of information to the facility site
leadership team so they can recognize all of the hazards that can impact buildings intended for
occupancy. It is this hazard recognition and risk reduction process that will be discussed in this paper.
The authors will present a methodology for completing a facility siting assessment that starts with
identifying a MCE, followed by breaking the MCE into additional credible events, and identifying
likelihood and additional safeguards needed to manage the risk.
The authors will present examples to illustrate this process and how different models affect the results.
Hazard scenarios to be presented include leaks from flammable storage and transfer systems resulting
in outdoor vapor cloud explosions as well as explosions within a building. Through these examples,
differences in hazard impacts will be presented. Various likelihood references and resultant risk rankings
will be shown. Based on these risk rankings and a tolerable risk criteria, proposed safeguards necessary
to close a gap will be described. Presenting information in this manner allows the site leadership team
to better allocate resources more effectively in minimizing facility siting risks.
Introduction
Since the BP Texas City incident, facility siting studies have been identified by regulators as being one of
the more deficient process safety requirements based on OSHA’s Refinery & Chemical National
Emphasis Programs (NEP). One reason for this may be that some facility siting studies in the past have
been conducted by applying a methodology based on a fixed and limited number of hazard event
scenarios that are generally of very high severity and low likelihood (i.e. MCE). In these studies, a limited
effort was expended to review the critical plant process conditions and define all of the maximum
credible event(s) (MCE) and credible event scenarios for those hazards with reasonable probability of
occurrence. These scenarios generally have lower severity with higher likelihoods but can still impact
occupied buildings. The consequence of these fixed number of hazard event scenarios were then
quantified to assess impacts to buildings intended for occupancy. Owners and Operators of these
facilities were then left with trying to determine the true risks at the facility and what could be done to
©2016 aeSolutions
Craig Shell & Stephen W. Kelly aeSolutions Publication
Oct 21, 2012 Page 2
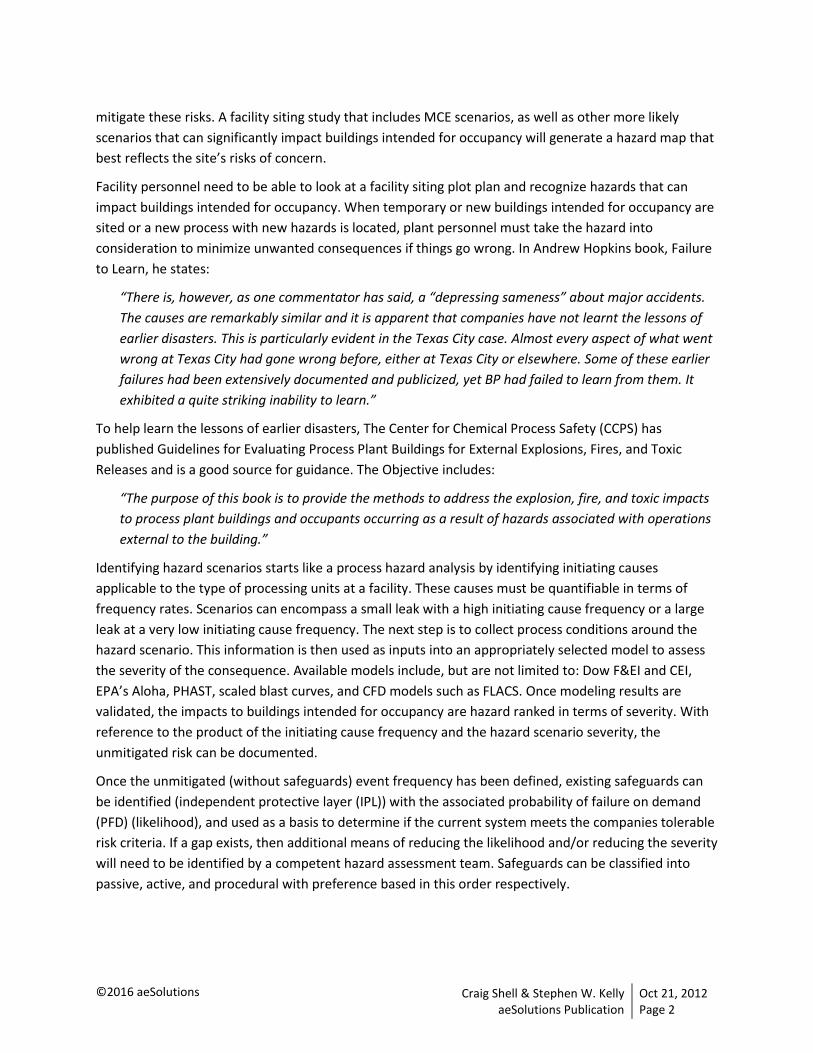
mitigate these risks. A facility siting study that includes MCE scenarios, as well as other more likely
scenarios that can significantly impact buildings intended for occupancy will generate a hazard map that
best reflects the site’s risks of concern.
Facility personnel need to be able to look at a facility siting plot plan and recognize hazards that can
impact buildings intended for occupancy. When temporary or new buildings intended for occupancy are
sited or a new process with new hazards is located, plant personnel must take the hazard into
consideration to minimize unwanted consequences if things go wrong. In Andrew Hopkins book, Failure
to Learn, he states:
“There is, however, as one commentator has said, a “depressing sameness” about major accidents.
The causes are remarkably similar and it is apparent that companies have not learnt the lessons of
earlier disasters. This is particularly evident in the Texas City case. Almost every aspect of what went
wrong at Texas City had gone wrong before, either at Texas City or elsewhere. Some of these earlier
failures had been extensively documented and publicized, yet BP had failed to learn from them. It
exhibited a quite striking inability to learn.”
To help learn the lessons of earlier disasters, The Center for Chemical Process Safety (CCPS) has
published Guidelines for Evaluating Process Plant Buildings for External Explosions, Fires, and Toxic
Releases and is a good source for guidance. The Objective includes:
“The purpose of this book is to provide the methods to address the explosion, fire, and toxic impacts
to process plant buildings and occupants occurring as a result of hazards associated with operations
external to the building.”
Identifying hazard scenarios starts like a process hazard analysis by identifying initiating causes
applicable to the type of processing units at a facility. These causes must be quantifiable in terms of
frequency rates. Scenarios can encompass a small leak with a high initiating cause frequency or a large
leak at a very low initiating cause frequency. The next step is to collect process conditions around the
hazard scenario. This information is then used as inputs into an appropriately selected model to assess
the severity of the consequence. Available models include, but are not limited to: Dow F&EI and CEI,
EPA’s Aloha, PHAST, scaled blast curves, and CFD models such as FLACS. Once modeling results are
validated, the impacts to buildings intended for occupancy are hazard ranked in terms of severity. With
reference to the product of the initiating cause frequency and the hazard scenario severity, the
unmitigated risk can be documented.
Once the unmitigated (without safeguards) event frequency has been defined, existing safeguards can
be identified (independent protective layer (IPL)) with the associated probability of failure on demand
(PFD) (likelihood), and used as a basis to determine if the current system meets the companies tolerable
risk criteria. If a gap exists, then additional means of reducing the likelihood and/or reducing the severity
will need to be identified by a competent hazard assessment team. Safeguards can be classified into
passive, active, and procedural with preference based in this order respectively.

©2016 aeSolutions
Craig Shell & Stephen W. Kelly aeSolutions Publication
Oct 21, 2012 Page 3
Identifying Hazard Scenarios
The facility siting example presented in this paper involves the receipt, unloading, storage and transfer
of ethylene oxide (EO). Figure 1 is a plot plan showing the overall layout of the plant. EO is received on
the east side of the plant primarily from railcars. The material is unloaded by use of an unloading pump
into a 20,000 gal horizontal storage tank that is located nearby. An unloading operator shelter
constructed of a steel frame sheet metal building is located just south of the EO storage tank. From the
storage tank, EO is pumped to batch reactors in Area A located in the center of the plant, and Area B
located on the west side of the plant.
The EO unloading and storage area is outdoors while the reactors in Area A and B are located inside a
steel frame sheet metal building. In addition, each reactor area has a control room next to the reactor
buildings constructed of cement block. Several buildings intended for occupancy are located on the
south east and south side of the plant. These buildings are constructed of cement block and steel frame
sheet metal.
To understand what facility siting hazards may exist, a review of the company and industry incidents was
conducted. Incident reports collected by the facility and discussions during team meetings added to the
list of hazard scenarios reviewed. Many raw material manufacturers compile and issue guidance
documents to assist facilities that receive and handle their chemicals. For EO, an Ethylene Oxide Product
Stewardship Guidance Manual1 (EO Manual) was published and contains various historical incidents that
can be used as a guide for developing facility siting hazard scenarios. This EO Manual includes the
following statement:
“Note that in most EO contamination incidents and EO decomposition incidents, the majority of the
damage has resulted from an EO vapor cloud explosion.”
It is the loss of containment of EO that will be discussed in this paper. Many hazards associated with
facility siting studies involve leaks from transfer operations. In the CCPS book, Guidelines for Evaluating
Process Plant Buildings for External Explosions, Fires, and Toxic Releases, Table 8.1 Frequency and
Probability Assessment lists factors that can be used to determine explosion frequencies.
Examples of different types of piping leaks that may be appropriate in a facility siting study are listed in
Table 1. This table also includes several Recognized and Generally Accepted Good Engineering Practice
(RAGAGEP) resources that are available for use in setting initiating cause frequencies for the listed
hazard scenarios.
1 The Ethylene Oxide Product Stewardship Guidance Manual was prepared by the American Chemistry Council's Ethylene Oxide/Ethylene Glycols Panel, third edition.

©2016 aeSolutions
Craig Shell & Stephen W. Kelly aeSolutions Publication
Oct 21, 2012 Page 4
Hazard Scenarios Raw Risk and Resultant Severity
CCPS in Guidelines for Evaluating Process Plant Buildings for External Explosions, Fires, and Toxic
Releases, Analysis in the Approach Selection section notes:
“… An owner/operator may opt for a phased approach to building siting evaluation with the level of
detail increasing with each step. This phased approach may consist of a consequence-based
assessment using conservative assumptions as an initial step. More detailed consequence analysis
that use process specific information may be used as a subsequent step to sharpen the pencil.”
A typical MCE may involve the full bore rupture of a transfer pipe or rupture of a tank. If the hazard does
not impact buildings intended for occupancy, then no further assessment is required. However, if
buildings intended for occupancy are impacted, then a further assessment is required to ensure the
individuals inside these buildings are adequately protected. CCPS has published a very useful
compilation of models that can be used for facility siting, Guidelines for Vapor Cloud Explosion, Pressure
Vessel Burst, BLEVE and Flash Fire Hazards. A list of various modeling tools that were used to model
hazard consequences can be found in Table 2.
EO has both toxic and flammable properties of concern. In this paper, the authors will present facility
siting issues generated from the flammable characteristics of EO. Conservative TNT modeling was used
for the MCE scenarios, which included pipe and tank ruptures. Based on this modeling several buildings
intended for occupancy were impacted therefore additional more detail modeling was required.
For overpressure impacts due to releases of EO at the unloading, storage, transfer, and reactor areas,
several different refined explosion models were used to assess nearby buildings intended for occupancy
and to assess inherently safer designs. The results of the dispersion modeling for hazard scenarios are
listed in Tables 3 and 4.
For the existing plant configuration, several issues appeared. The first concern is associated with
outdoor releases during low wind speeds. Figure 2 depicts a wind rose diagram and shows calm (< 0.5
m/s) periods of up to 10% of the year. This amount of time was considered sufficient to be of a concern.
The second concern involved potential releases of flammables inside the reactor buildings. Based on
dispersion modeling, the concentration indoors could reach the lower flammable limit (LFL) and
therefore result in an overpressure hazard and impact buildings intended for occupancy. Indoor releases
are of particular concern because of a lack of natural ventilation that aids in the dispersion of flammable
releases.
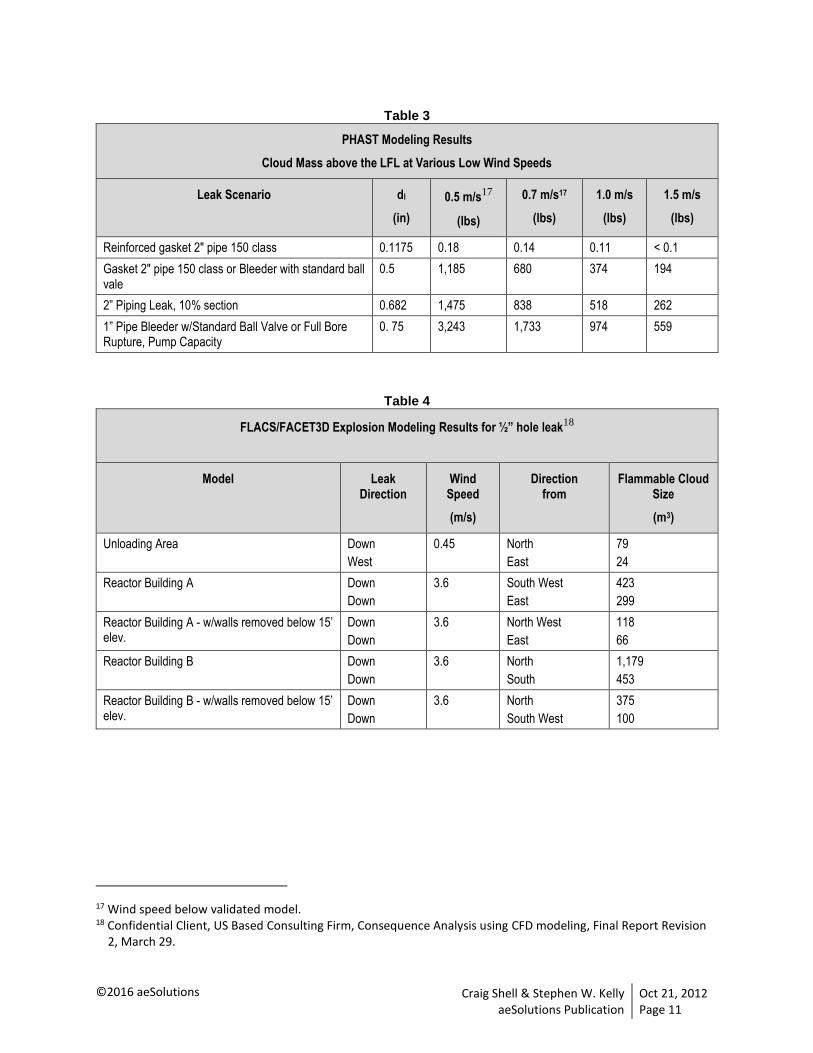
To assess flammable cloud size for various hazard scenarios, PHAST was used to assess the mass in the
cloud above the LFL for outdoor releases. Table 3 shows that the leak hole size has a significant effect on
the size of the flammable cloud. Of particular concern is whether the flammable cloud size is sufficiently
large to generate an overpressure hazard. Lees10 looked at historical overpressure incidences from
outdoor releases and noted that a certain amount of material is required to be release before a credible
overpressure hazard exists. In the FM Global Property Loss Prevention Data Sheets 7-42, Guidelines for
Evaluating the Effects of Vapor Cloud Explosions Using a TNT Equivalency Method, flammable materials

©2016 aeSolutions
Craig Shell & Stephen W. Kelly aeSolutions Publication
Oct 21, 2012 Page 5
are classified into three categories and each category has a listed minimum mass. These classes and
associated minimum mass above the LFL for outdoor releases are:
Class I materials, 5 tons
Class II materials, 1 ton
Class III materials, 1000 lbs
In the FM Global guidance document, EO is considered a Class III material. Based upon the information
in Table 3 and FM Global guidance, scenarios at low wind speeds were an area that warranted further
investigation. It should be noted that PHAST dispersion software is limited to >1 m/s and so
overpressure hazards below 1 m/s could not be accurately modeled with this software.
Because of this limitation, CFD modeling was conducted to assess flammable cloud size and resultant
overpressure hazards for outdoor releases at low wind speeds as well as indoor releases in the reactor
buildings. Figure 3 shows Reactor Building A area with buildings located near reactors. In this area one
can see that the sides of the building facing the release point are the short sides of the buildings. Figure
4 shows Reactor Building B area that only has one building, the control room, located near the reactors.
In this area one can see that the side of the building facing the release point is the long side of the
building.
The results of the CFD dispersion modeling are presented in Table 4. Also included in Table 4 are the
wind directions that resulted in the maximum and minimum flammable cloud sizes. Overpressure
hazards are shown in Figures 5 and 6 for the three areas of concern: Unloading Area, Reactor Building A,
and Reactor Building B. It should be noted that the control room building orientation in reference to the
release point and wind direction has an impact on the flammable cloud size and therefore the resultant
overpressure hazard distances. These results indicate:
Unloading Area – This area of the plant has low confinement and congestion, which results in the
lowest flammable cloud size and overpressure distances compared to the other two reactor areas.
The results from this scenario are presented in Figures 5 and 6.
Reactor Building A and B – These two areas of the plant have a high degree of confinement due to
being indoors, which results in unacceptable damage to buildings intended for occupancy.
Reactor Building A with walls removed below 15’ elevation – In order to improve natural
ventilation in this area, the sheet metal walls, starting at grade up to 15’ elevation, were removed.
CFD modeling results indicated that removing walls below 7’ did not decrease the flammable cloud
size and damage to buildings intended for occupancy. This area of the plant has moderate
confinement and congestion which results in the next lowest flammable cloud size and overpressure
distances compared to the other areas. The results from this scenario are presented in Figures 5 and
6.
Reactor Building B with walls removed below 15’ elevation – These results mirror Reactor Building
A. This area of the plant has moderate confinement and congestion, which results in the highest
flammable cloud size and overpressure distances compared to the other areas. This can be
attributed to the building’s orientation near the release point. The Reactor Building B control room

©2016 aeSolutions
Craig Shell & Stephen W. Kelly aeSolutions Publication
Oct 21, 2012 Page 6
is perpendicular to the wind direction for the largest flammable cloud case whereas buildings near
Reactor A have no large face area perpendicular to the wind direction even though the Reactor A
area has more objects around the release point. The results from this scenario are presented in
Figures 5 and 6.
Risk Ranking and Identifying Safeguards
After having identified the hazards and severity, API RP-752 recommends that a mitigation plan be
developed that includes both mitigation measures and schedule for completing them. Safeguards can
be classified into three categories as presented in API RP-752 2009, Table 1 Hierarchy of Mitigation
Measures. Listed in order of priority they are:
Passive
Active
Procedural
To evaluate what mitigation opportunities can be implemented, a PHA team was assembled and a list of
recommended safeguards was identified to meet the company’s tolerable risk criteria (see Table 5). Of
most importance are the passive mitigation measures that represent inherently safer design:
Replace with reinforced gasket (inner and outer rings)
Replace or reduce any bleeder to < ½” port diameter
Remove Reactor Building panels below 15’ elevation
Relocate Control Rooms operations away from the hazard or upgrade the Control Room to
withstand the overpressure hazard
Design and Upgrade Buildings Intended for Occupancy based on Overpressure Hazards
Barricade around Exposed Piping and Equipment
The PHA Team presented these recommendations to the Site Leadership Team (SLT) for acceptance and
assigned a responsible individual to track closure of the accepted recommendation. The facility siting
study will be kept current through the site’s Management of Change (MOC) program and will be
revalidated in five years.

©2016 aeSolutions
Craig Shell & Stephen W. Kelly aeSolutions Publication
Oct 21, 2012 Page 7
Conclusions
Based on this facility siting study, several key factors were identified:
1) Facility siting studies should be used as a tool to help companies learn the lessons of earlier disasters
to minimize the risk of future major accidents.
2) Review of company and industry incidents can aid in the selection of the MCE and more refined
credible hazard scenarios that have the potential to impact buildings intended for occupancy.
3) A phased approach to building siting evaluations with the level of detail increasing with each step
will focus a company’s resources on the hazards of concern.
4) Each hazard scenario identified must be assessed with the appropriate modeling tool. Individuals
tasked with completing a facility siting evaluation must be aware of the basis and limitations of each
tool to ensure that it is being applied appropriately.
5) Outdoor releases during periods of low wind speed can be a hazard of concern and should be
investigated based on local weather conditions for the plant.
6) Indoor process units handling flammable materials can present a significant hazard of concern.
7) The location of walls and building orientation near a flammable release point can affect the
dispersion and associated hazard consequence.
8) Identifying safeguards in priority order starting with ones that are passive, and then active, followed
by procedural to meet a company’s tolerable risk will result in reducing the chances of an unwanted
major accident. Once these safeguards are accepted by the site leadership team, they will be
assigned to a responsible individual who will track the recommendation to closure to ensure that
the safeguard is implemented in a reasonable amount of time.

©2016 aeSolutions
Craig Shell & Stephen W. Kelly aeSolutions Publication
Oct 21, 2012 Page 8
Table 1
Summary of Potential Leak Scenarios and Initiating Cause Frequencies
Initiating Cause Size of Release Frequency Range from Literature (per year)
Full Bore Rupture:
Pump Capacity
Mobile Equipment Impact3
10-2 to 10-4
Crane Drop of Heavy Equipment2
10-3 to 10-4 per lift
Piping residual failure – 100 m – Full Breach2
10-5 to 10-6 per 100m
Nominal diameter < 75 mm per m of pipe length4
1x10⁻⁶ per m
75 mm < nominal diameter < 150 mm per m of pipe length3
3x10⁻⁷ per m
Nominal diameter > 150 mm per m of pipe length3
1x10⁻⁷ per m
Human error:
1” Pipe Bleeder w/Standard Ball Valve, or ¾” Pipe Bleeder w/Full Port Ball Valve
¾” Pipe Bleeder w/Standard Ball Valve
d1 = ¾”
d1 = ½”
Human Factor for general error of omission4
Human Factor for error in routine simple operation4
Piping Leak (10% section)2
10-3 to 10-4 per 100 m
Leak with an effective diameter of 10% of the nominal diameter, up to a maximum of 50 mm
0.1
Nominal diameter < 75 mm per m of pipe length3
5x10⁻⁶ per m
75 mm < nominal diameter < 150 mm per m of pipe length3
2x10⁻⁶ per m
Nominal diameter > 150 mm per m of pipe length3
5x10⁻⁷ per m
2 LOPA, Table 5.1, pg 71, CCPS 2001 3 Bevi Risk Assessments version 3.2, 2009 4 Human Reliability Analysis, AIChE Journal Vol 20 No.2 March 1974

©2016 aeSolutions
Craig Shell & Stephen W. Kelly aeSolutions Publication
Oct 21, 2012 Page 9
Summary of Potential Leak Scenarios and Initiating Cause Frequencies
Initiating Cause Size of Release Frequency Range from Literature (per year)
Pump Seal Failure2
Centrifugal pumps and centrifugal compressors3
10-1 to 10-2
Canned (without gasket) Catastrophic failure
Leak (10 % diameter) 0.1
1x10⁻⁵
5x10⁻⁵
With gasket
Reciprocating pumps and reciprocating compressors3
Catastrophic failure
Leak (10 % diameter) 0.1
Catastrophic failure
Leak (10 % diameter) 0.1
1x10⁻⁴
4.4x10⁻³
1x10⁻⁴
4.4x10⁻³
Non-Metallic Leak – Gasket Leak2 10-2 to 10-6
Hole size based on raised face gap between bolt holes
Hole size based on small diameter pipe (<3”) and ¼ gasket
Reinforced Gasket/Packing Blowout2
Reinforced Gasket Leak between Adjacent
Bolt Holes, =1.5mm
10-2 to 10-6
Hole size based on raised face between bolt holes
Hole size based on small diameter pipe (<3”) and ¼ gasket
= equivalent hole diameter of leak (in), = pipe diameter (in), = flange bolt hole diameter (in), = number of
flange bolts, = pipe flange raised face diameter (in), = bolt diameter (in), = width of flange gasket (in)

©2016 aeSolutions
Craig Shell & Stephen W. Kelly aeSolutions Publication
Oct 21, 2012 Page 10
Table 2
Modeling Tools for Toxic and Flammable Hazards
CEI5 Toxic Impacts
Aloha6 Toxic and Radiant Thermal Impacts
F&EI7 Radiant Thermal Impacts
PHAST8 Toxic, Radiant Thermal, and Explosion Impacts
API9 Jet Fire Impacts
Cone10 Jet Fire Impacts
TNT11 Explosion Impacts
Tang12 Explosion Impacts
Baker-Strehlow-Tang13 Explosion Impacts
TNO Multi-Energy14 Explosion Impacts
FLACS15and FACET3D16 Explosion Impacts
5 Chemical Exposure Index (CEI) Method, Dow, 2nd Edition 6 U.S. Environmental Protection Agency, Emergency Management 7 Fire and Explosion Index (F&EI) Method, Dow, 7th Edition 8 DNV Technica’s Process Hazard Analysis Software Tool (PHAST) 9 Cook, J., Bahrami, Z., Whitehouse, R.J., 1990, A comprehensive program for calculation of flame radiation levels, J.
Loss Prev. Process Ind. v3 (1990) pp150-155. 10 Johnson, A. D., Brightwell, H. M., and Carsley, A. J., 1994, A model for predicting the thermal radiation hazard
from large scale horizontally released natural gas jet fires, Trans. IChemE., Vol. 72, Part B (1994) pp 157-166 11 Lees, F. P., 1996, Loss prevention in the process industries, 2nd Edition 12 Tang, M.J., Cao, C.Y., and Baker, Q.A., “Blast Effects from Vapor Cloud Explosions”, International Loss Prevention
Symposium, Bergen, Norway, June 1996 13 Tang, M. J. and Baker, Q. A., 1999, A New Set of Blast Curves from Vapour Cloud Explosion, Process Safety
Progress, Volume 18, No. 4, pp 235 - 240, Winter 1999 14 TNO "Yellow Book", 1997, Methods for the calculation of physical effects due to releases of hazardous materials
(liquids and gases), Eds: van den Bosch, C. J. H. and Weterings, R. A. P. M. (1997), Chapter 5: Vapor Cloud Explosions, Mercx, W. P. M. and van den Berg, A. C.
15 Flame Acceleration Simulator (FLACS), Version 9.1 release 3, GexCon, Bergen, Norway, April 2011. 16 Facility Assessment and Consequence Evaluation Tool (FACET3D), Version 11.8.1, ABS Consulting, 2011
©2016 aeSolutions
Craig Shell & Stephen W. Kelly aeSolutions Publication
Oct 21, 2012 Page 11
Table 3
PHAST Modeling Results
Cloud Mass above the LFL at Various Low Wind Speeds
Leak Scenario dl
(in)
0.5 m/s17
(lbs)
0.7 m/s17
(lbs)
1.0 m/s
(lbs)
1.5 m/s
(lbs)
Reinforced gasket 2" pipe 150 class 0.1175 0.18 0.14 0.11 < 0.1
Gasket 2" pipe 150 class or Bleeder with standard ball vale
0.5 1,185 680 374 194
2” Piping Leak, 10% section 0.682 1,475 838 518 262
1” Pipe Bleeder w/Standard Ball Valve or Full Bore Rupture, Pump Capacity
0. 75 3,243 1,733 974 559
Table 4
FLACS/FACET3D Explosion Modeling Results for ½” hole leak18
Model Leak Direction
Wind Speed
(m/s)
Direction from
Flammable Cloud Size
(m3)
Unloading Area Down
West
0.45 North
East
79
24
Reactor Building A Down
Down
3.6 South West
East
423
299
Reactor Building A - w/walls removed below 15’ elev.
Down
Down
3.6 North West
East
118
66
Reactor Building B Down
Down
3.6 North
South
1,179
453
Reactor Building B - w/walls removed below 15’ elev.
Down
Down
3.6 North
South West
375
100
17 Wind speed below validated model. 18 Confidential Client, US Based Consulting Firm, Consequence Analysis using CFD modeling, Final Report Revision
2, March 29.

©2016 aeSolutions
Craig Shell & Stephen W. Kelly aeSolutions Publication
Oct 21, 2012 Page 12
Table 5
Risk Reduction Options by Hazard Scenario
Hazard Scenario Independent Protection Layer (IPL)
Gasket Leak Passive - Inherently safer design:
Replace with reinforced gasket (inner and outer rings)
Active - Consequence Mitigation System (CMS)
Gas Detection, Isolation, and Deluge
Bleeder Vale Left Open Passive - Inherently safer design:
Replace or reduce any bleeder to < ½” port diameter
Remove Reactor Building Panels Below 15’ Elev.
Relocate Control Rooms Away from Hazard
Design and Upgrade Buildings Intended for Occupancy based on Overpressure Hazards or relocate to buildings away from the hazard area
Active – Consequence Mitigation System (CMS)
Gas Detection, Isolation, and Deluge
Procedural - Administrative:
Standard Operating Procedure (SOP)LOTO Checklist and Diagram of Valves to be Manipulated
Standard Operating Procedure (SOP) Open Ended Line Inspection prior to Restart
Piping Leak due to Corrosion
Procedural - Administrative:
RAGAGEP review of Piping for Chemical Service
Mechanical Integrity (MI) Program
Pipe Rupture due to impact Passive - Inherently safer design:
Barricade around Exposed Piping and Equipment
Procedural - Administrative:
Crane Lift Evaluation Program

©2016 aeSolutions
Craig Shell & Stephen W. Kelly aeSolutions Publication
Oct 21, 2012 Page 13
Figure 1 – Facility Plot Plan

©2016 aeSolutions
Craig Shell & Stephen W. Kelly aeSolutions Publication
Oct 21, 2012 Page 14
Figure 2 – Wind Rose

©2016 aeSolutions
Craig Shell & Stephen W. Kelly aeSolutions Publication
Oct 21, 2012 Page 15
Figure 3 - Reactor Building A (Looking North West)18
Figure 4 - Reactor Building B (Looking South West)18

©2016 aeSolutions
Craig Shell & Stephen W. Kelly aeSolutions Publication
Oct 21, 2012 Page 16
Figure 5 - Site Free-Field Pressure Contours18
Figure 6 - Site Free-Field Positive Impulse Contours18

©2016 aeSolutions
Craig Shell & Stephen W. Kelly aeSolutions Publication
Oct 21, 2012 Page 17
Disclaimer
The following paper is provided for educational purposes. While the authors have made reasonable
efforts in the preparation of this document, aeSolutions makes no warranty of any kind and shall not be
liable in any event for incidental or consequential damages in connection with the application of this
document.