ieee 802.3 ethernet working group communication trends, the ieee 802.3 ethernet bandwidth assessment...
TRANSCRIPT

IEEE 802.3 Industry Connections Bandwidth Assessment 19th July 2012
IEEE 802.3 Ethernet Working Group Communication
From: IEEE 802.3 Ethernet Working Group1
Subject: IEEE Industry Connections Ethernet Bandwidth Assessment
Date: 19th July 2012
Approval: Agreed to at IEEE 802.3 Plenary meeting, San Diego, 19th July 2012
During the IEEE P802.3ba 40Gb/s and 100Gb/s Ethernet project, it was observedthat the bandwidth requirements for core networking and computing applicationswere growing at different rates, driving the need to develop the two new wirelineEthernet speeds. In order to maintain an ongoing understanding of the industrybandwidth trends, the IEEE 802.3 Ethernet Bandwidth Assessment Ad Hoc wascreated. The scope of this ad hoc was to focus on gathering information thatwould enable an assessment of the bandwidth needs for Ethernet wirelineapplications, including, but not limited to, core networking and computing.
The attached assessment is the culmination of the open 2011 industryassessment performed by the ad hoc. It includes a summary of the data broughtforward by individuals throughout the Ethernet ecosystem. All contributedinformation is solely the perspective of the respective contributors. It should benoted that all submitted data should be considered a snapshot of the perceivedbandwidth requirements at the time of submission.
Sincerely,
David Law
Chair, IEEE 802.3 Ethernet Working Group
1The views expressed in this document solely represent the views of the IEEE 802.3 Working Group, and do not necessarily represent a position of the IEEE, the IEEE Standards Association, or IEEE 802.
i

IEEE 802.3 Industry Connections Bandwidth Assessment 19th July 2012
IEEE 802.3 BWA Ad Hoc Report, 19th July 2012
IEEE 802.3™ Industry Connections Ethernet Bandwidth AssessmentPrepared by the
IEEE 802.3 Ethernet Working Group
This is a report on the future bandwidth needs of Ethernet wireline applications.
This report can be found at the following URL:-
http://www.ieee802.org/3/ad_hoc/bwa/BWA_Report.pdf
Copyright © 2012 by the Institute of Electrical and Electronics Engineers, Inc.All rights reserved. Published 19 July 2012.
Reproduction and distribution of this document in whole or in part by any medium is permitted. Appropriateacknowledgement of the source and ownership of the material should be made with any such reproductionand distribution.
IEEE and 802 are registered trademarks in the U.S. Patent & Trademark Office, owned by The Institute ofElectrical and Electronics Engineers, Incorporated.
Participants
The following individuals were officers and members of the IEEE 802.3 working group when this reportwas approved.
David J. Law, IEEE 802.3 Working Group ChairWael William Diab, IEEE 802.3 Working Group Vice-Chair
Adam Healey, IEEE 802.3 Working Group SecretarySteven B. Carlson, IEEE 802.3 Working Group Executive Secretary
Valerie Maguire, IEEE 802.3 Working Group Treasurer
John D’Ambrosia, IEEE 802.3 Industry Connections Bandwidth Assessment Ad Hoc ChairPete Anslow, IEEE 802.3 Industry Connections Bandwidth Assessment Ad Hoc Editor
Abaye, AliAbbas, GhaniAbbott, JohnAllard, MichelAmleshi, PeerouzAnderson, JonBalasubramanian, KoussalyaBalasubramanian, VittalBaldwin, ThananyaBarnett, BarryBarr, David
Barrass, HughBeaudoin, DenisBelopolsky, YakovBennett, MichaelBhatt, VipulBhoja, SudeepBliss, WilliamBooth, BradBoyd, EdwardBraun, Ralf-PeterBreuer, Dirk
Brophy, TimothyBrown, AlanBrown, KevinBrown, MatthewBugg, MarkBusse, RobertCarroll, J. MartinChadha, MandeepChalupsky, DavidChang, FrankChang, Fuhlim
ii

IEEE 802.3 Industry Connections Bandwidth Assessment 19th July 2012
Chen, Chung-JueCheng, WhelingChou, JosephChoudhury, GolamCideciyan, RoyCole, Christopher R.Cui, KaiDai, EugeneDawe, PiersDiamond, PatrickDiminico, ChrisDonahue, CurtisDonnay, BethDove, DanDudek, MikeDwelley, DavidElbakoury, HeshamEstes, DavidEwen, JohnFarhoodfar, ArashFlatman, AlanForbes, HarryFrazier, HowardFu, HongyanGanga, Ilango S.Ghiasi, AliGiannakopoulos, DimitriosGoergen, JoelGrimwood, MichaelGrow, RobertGundubogula, SudhakarGustlin, MarkHajduczenia, MarekHamano, HiroshiHammond, BernieHeath, JeffreyHidaka, YasuoHou, VictorHuang, XiIrwin, ScottIshida, OsamuIsono, HidekiIwadate, HirotakeJain, RajeevJewell, JackJiang, HongtaoJiang, WenbinJimenez, AndrewKasturia, SanjayKawatsu, YasuakiKim, YongKimmitt, MylesKing, JonathanKipp, ScottKodama, SatoshiKolesar, Paul
Kolze, TomKono, MasashiKosanovich, KeithKramer, GlenKvist, BengtLackner, HansLamb, LowellLarsen, WayneLatchman, RyanLaubach, MarkLe Cheminant, GregLewis, DavidLi, Mike PengLingle, RobertLiu, AlexanderLusted, KentLutz, SharonMaki, Jeffery J.Mallette, EdwinMarris, ArthurMatsuda, ShougoMcclay, PhilMcCormack, Michael S.Mcdermott, ThomasMcDonough, JohnMcNarney, MartinMeghelli, MounirMei, RichardMeier, WolfgangMellitz, RichardMisek, BrianMoeller, MerrickMontreuil, LeoMoore, CharlesMuller, ShimonNikolich, PaulNishihara, SusumuNoll, KevinNordin, RonaldNorthcott, PhilipNowell, MarkOfelt, DavidOssman, ValyPalkert, TomPanguluri, SeshaPark, JisangParthasarathy, VasuPatel, PravinPepeljugoski, PetarPepper, GeraldPerrie, RandyPetrilla, JohnPimpinella, RickPowell, WilliamProdan, RichardRabinovich, Rick
Rahman, SaifurRan, AdeeRemein, DuaneRessl, MichaelRiani, JamalSalinger, JorgeSalunke, VineetSambasivan, SamSchmitt, MatthewSearles, ShawnSela, OrenShanbhag, MeghaShang, Song QuanShariff, MasoodShellhammer, StephenSheth, SiddharthShrikhande, KapilSlavick, JeffSolomon, JoeSommers, ScottSparrowhawk, BryanSprague, EdwardSt Peter, MatthewStassar, PeterSugawa, JunSuzuki, Ken-IchiSwanson, SteveSzczepanek, AndreTawa, KatsuhisaTazebay, MehmetTeixeira, AntonioThompson, GeoffreyTracy, NathanTremblay, FrancoisTrowbridge, StephenUlm, JohnUmnov, AlexanderVaden, Sterling A.Valle, StefanoVanderlaan, PaulWagner, RobertWang, Zhong FengWarland, TimWarren, DavidWinkel, LudwigWong, ChingWoodruff, BillWu, WendyZambell, AndrewZang, meiyanZeng, LiZhang, JamesZhao, WenyuZimmerman, GeorgeZivny, Pavel
iii
IEEE 802.3 Industry Connections Bandwidth Assessment 19th July 2012
Contents
Executive summary............................................................................................................................. 1
1. Abbreviations...................................................................................................................................... 1
2. Introduction......................................................................................................................................... 2
2.1 Overview..................................................................................................................................... 32.2 Assessment limitations ............................................................................................................... 4
3. Key findings........................................................................................................................................ 4
3.1 Introduction................................................................................................................................. 43.2 Visual Networking Index............................................................................................................ 43.3 Storage growth ............................................................................................................................ 73.4 Data center ................................................................................................................................ 11
3.4.1 Server bandwidth scenarios .......................................................................................... 113.4.2 High performance computing ....................................................................................... 133.4.3 Data center bandwidth scenarios .................................................................................. 143.4.4 Global data centers........................................................................................................ 14
3.5 Data intensive science............................................................................................................... 173.6 Financial sector ......................................................................................................................... 183.7 Cable data ................................................................................................................................. 213.8 Optical Transport Network ....................................................................................................... 273.9 European peering ...................................................................................................................... 31
4. Assessment........................................................................................................................................ 36
4.1 Peripheral growth trends ........................................................................................................... 364.2 Network growth trends ............................................................................................................. 374.3 Variation factors ....................................................................................................................... 374.4 Summary................................................................................................................................... 38
5. References......................................................................................................................................... 39
iv
IEEE 802.3 Industry Connections Bandwidth Assessment 19th July 2012
Executive summary
The release of this assessment completes a year-long effort by the IEEE 802.3 Industry Connections Ether-net Bandwidth Assessment Ad Hoc to provide an updated view of industry bandwidth trends impactingEthernet wireline applications. Maintaining an ongoing understanding of bandwidth trends should be benefi-cial to a future higher speed study group, as the time necessary to develop this knowledge is significant, asevident by the effort exerted by this ad hoc.
This assessment builds upon the work of the 2007 IEEE 802.3 Higher Speed Study Group (HSSG), whichobserved that core networking and computing applications were growing at different rates. The bandwidthassociated with core networking was observed, on average, to be doubling every eighteen months. On theother hand, the bandwidth capability associated with high volume x86 servers and computing applications,fueled by Moore's Law, was doubling every twenty-four months [1].
Input was submitted from eleven source presentations, which looked at a variety of application spacesincluding servers, data center networks, high performance computing, financial markets, carrier and cableoperators, Internet exchanges, and the scientific community. In addition to the different application spaces,data on different geographical regions was also explored. This data can be thought of in two different man-ners: end-station applications, which initiated the transmission and receipt of the data, and network aggrega-tion nodes.
The 2007 HSSG observed that the computing end-station application was growing at a slower pace than theaggregation networks. This ad hoc obtained data from multiple sources that indicated the continuation of thetrend that the bandwidth requirements of aggregation nodes were growing at a faster rate than end-stationapplications. Furthermore, while there was a wide variation in aggregated bandwidth needs, the observedtrend that the doubling every eighteen months on average of bandwidth requirements associated with corenetworking is still a reasonable approximation.
If the current trend continues, then this translates to an increase in traffic of a factor of 10 by 2015 comparedto 2010 and by a factor of 100 by 2020. While this is the forecasted bandwidth capacity requirement, noassumptions regarding a given interface speed have been made by the ad hoc. Such bandwidth requirementsmight be serviced by a given higher interface speed or some parallel configuration of lower speeds. It is leftto future standards activities to determine the best way to service these application spaces.
1. Abbreviations
This document contains the following abbreviations:
1GbE 1 Gb/s Ethernet10GbE 10 Gb/s Ethernet40GbE 40 Gb/s Ethernet100GbE 100 Gb/s Ethernet3D TV three-dimensional televisionBW bandwidthCAGR compound annual growth rateCMTS cable modem termination systemDAC digital-to-analog converterDAS direct attached storageDOCSIS Data Over Cable Service Interface SpecificationDS downstreamEPON Ethernet passive optical networkFCoE Fibre Channel over Ethernet
1
IEEE 802.3 Industry Connections Bandwidth Assessment 19th July 2012
HDTV high-definition televisionHHP house-holds passedHPC high performance computingHSSG Higher Speed Study GroupI/O input/outputIP Internet ProtocoliSCSI Internet small computer system interfaceISP Internet service providerIXP Internet exchange pointLAN local area networkLAG link aggregationLHC Large Hadron ColliderLOM LAN on motherboardMAN metropolitan area networkMSO multi-system operatorNAS network attached storageNIC network interface cardOEM original equipment manufacturerOTN Optical Transport NetworkP2P peer-to-peerPC personal computerPCIe Peripheral Component Interconnect ExpressQAM quadrature amplitude modulationRFOG radio frequency over glassSAN storage area networkSMB small and medium businessUS upstreamVOD video on demandWAN wide area networkx86 a family of architectures based on the Intel® 8086 CPU
2. Introduction
During the 2007 incarnation of the IEEE 802.3 Higher Speed Study Group (HSSG), there was a significantamount of debate regarding whether two rates of Ethernet were needed. Multiple meetings and presentationswere necessary to resolve this debate, and ultimately, it was agreed that core networking and computingapplications were growing at different rates. The bandwidth associated with core networking was observed,on average, to be doubling every eighteen months, while the bandwidth capability associated with high vol-ume x86 servers and computing applications, fueled by Moore's Law, was doubling every twenty-fourmonths [1]. These observations, illustrated in Figure 1, drove the rate objectives for the two new wirelineEthernet speeds that were developed by the IEEE P802.3ba Task Force - 40 Gigabit Ethernet and100 Gigabit Ethernet.
2

IEEE 802.3 Industry Connections Bandwidth Assessment 19th July 2012
Looking ahead, the exponential growth cited by multiple end-users was such that they told the HSSG thatwork on the next speed of Ethernet needed to begin once 100 Gigabit Ethernet was completed [2], [3], [4].This need is corroborated by the bandwidth growth rate for core networking illustrated in Figure 1, where400 Gb/s is shown as needed by 2013 and 1 Tb/s is shown as needed by 2015. As “The Great Rate Debate”was a source of delay during the effort to develop the next rate of Ethernet beyond 10 Gb/s, it was realizedthat a pro-active effort to provide an updated view of industry bandwidth trends impacting Ethernet wirelineapplications would be beneficial to the Ethernet industry and future standards efforts targeting an Ethernetrate beyond 100 Gb/s. Thus, the IEEE 802.3 Industry Connections Ethernet Bandwidth Assessment Ad Hocwas created.
2.1 Overview
The IEEE 802.3 Industry Connections Ethernet Bandwidth Assessment Ad Hoc was formed in early 2011.Its scope was to focus on gathering information that would enable an assessment of the bandwidth needs forEthernet wireline applications including, but not limited to, core networking and computing. The gatheredinformation forms the basis for an assessment that can be used for future reference by an appropriate relatedstandards activity. It should be noted that the role of this ad hoc was solely to gather information, and notmake recommendations or create a call-for-interest for the next speed of Ethernet.
To gather this information, the ad hoc sought out contributions from individuals from various applicationareas and made a public request for information [5]. The following individuals presented their informationto the ad hoc at various meetings and teleconferences throughout 2011:
• Scott Kipp, Brocade, “Data Center Bandwidth Scenarios” [6];
• Andy Bach, NYSE Euronext, “Bandwidth Demand in the Financial Industry - The Growth Contin-ues”[7];
Figure 1—2007 IEEE 802.3 HSSG bandwidth demand projections
3

IEEE 802.3 Industry Connections Bandwidth Assessment 19th July 2012
• Kimball Brown, LightCounting, “Server Bandwidth Scenarios - Signposts for 40G/100G ServerConnections” [8];
• Tom Cloonan, Arris, “Bandwidth Trends on the Internet... A Cable Data Vendor's Perspective” [9];
• Scott Kipp, Brocade, “Storage Growth and Ethernet” [10];
• Mark Nowell, Cisco, “Cisco Visual Networking Index (VNI) Global IP Traffic Forecast Update;2010 - 2015” [11];
• Petar Pepeljugoski and Paul Coteus, IBM, “Bandwidth needs in HPC taking into account link redun-dancy” [12];
• Xi Huang, Huawei, “Bandwidth Needs in Core and Aggregation nodes in the Optical Transport Net-work” [13];
• Henk Steenman, AMS-IX / Euro-IX, “The European Peering Scene” [14];
• Lone Hansen, BSRIA, “Global Data Centres Presentation IEEE” [15];
• Eli Dart, ESnet, “Data Intensive Science Impact on Networks” [16].
All contributed information is solely the perspective of the respective contributors.
2.2 Assessment limitations
Given the magnitude of the task, it is understandable that there were a number of limitations faced by the adhoc during the course of this assessment:
• As approved, the duration of the Ad Hoc was for a maximum duration of 18 months [17]. This timeduration placed a limit on the amount of data that could be gathered. This is countered, however, bythe fact that the longer the duration of the information gathering, the more the data becomes datedand potentially inaccurate. It should be noted that all submitted information should be considered asnapshot of the perceived bandwidth requirements at the time of submission.
• Bandwidth forecasts based on past trends may not be an accurate predictor of future bandwidthrequirements. Other influences such as, but not limited to, emerging bandwidth intensive applica-tions, availability of technologies to support higher bandwidth needs, costs, and standardizationefforts may have an impact on bandwidth requirements. Also, the potential inaccuracy in any fore-casted data will grow the further out in time one looks.
• There are underlying assumptions regarding market adoption of technologies and the continuationof businesses and consumers utilizing applications (present, emerging, and yet to be developed) thatrequire increasing bandwidth capabilities.
3. Key findings
3.1 Introduction
The following is a summary of the key findings from all contributed information. All contributed informa-tion is the sole perspective of the respective contributors. It should be noted that all submitted data should beconsidered a snapshot of the perceived bandwidth requirements at the time of submission.
3.2 Visual Networking Index
This section discusses the overall global IP network and the various trends within the network that arebehind the on-going bandwidth explosion being seen throughout the network [11].
4

IEEE 802.3 Industry Connections Bandwidth Assessment 19th July 2012
As noted in the 2007 IEEE 802.3 Higher Speed Study Group (HSSG) Tutorial [18], the bandwidth explosioneverywhere was being driven by the increase in the number of users, increased access methodologies andrates, and increased services (such as, but not limited to, video on demand, social media, etc.). It was sim-plistically captured by Equation (1). While simplistic, this equation provides a meaningful way to under-stand the underlying forces driving the never-ending bandwidth explosion networking has beenexperiencing.
Globally, the number of Internet users is forecast to increase from 1.9 billion users in 2010 to 3 billion Inter-net users in 2015. Table 1 breaks down these numbers by region.
The number of Internet users alone is insufficient information, as a single end-user may have multiple typesof devices. It is forecast that in 2015 there will be nearly 15 billion fixed and mobile networked devices andmachine-to-machine connections. The increase in the number of consumer broadband devices affects band-width in a number of ways. It enables a consumer to be continuously consuming bandwidth, as well as to beconsuming bandwidth on multiple devices simultaneously. Also, different consumer broadband devicesenable different applications, which may have greater traffic generation capability. For example, Table 2compares the amount of traffic on a fixed network that newer, next-generation devices will create, using thetraffic created by a 32-bit laptop as a baseline [11].
In addition to these increases, a 4 times increase in fixed broadband speeds is forecast for 2015, as the aver-age fixed broadband speed of 7 Mb/s in 2010 is expected to rise to 28 Mb/s in 2015 [19]. Table 3 tabulatesthe growth of average broadband speeds for the 2010 to 2015 time period [11].
These forecasts are all for average fixed broadband speeds. However, in 2015 68 % of all broadband con-nections are forecast to be at least 5 Mb/s, 40 % will be at least 10 Mb/s, and 3 % will be at least 100 Mb/s[11].
Increased no of users
xIncreased access rates and methods
xIncreased services
=Bandwidth explosion
(1)
Table 1—2015 Regional forecast of users and connections
RegionInternet
users (million)
Network connections
(billion)
North America 288 2.2
Latin America 260 1.3
Western Europe 314 2.3
Central/Eastern Europe 201 0.902
Asia Pacific 1330 5.8
Japan 116 0.727
Middle East & Africa 495 1.3
5

IEEE 802.3 Industry Connections Bandwidth Assessment 19th July 2012
As described in Equation (1) with the increase in access capabilities and applications, one would expectincreased bandwidth usage. This expectation is observed by various forecasts [11]:
• Traffic per average Internet user will grow from 7.3 gigabyte per month to 24.8 gigabyte per month
• Traffic per average Internet household will grow from 17.1 gigabyte per month to 61.8 gigabyte permonth
• Global consumer Internet traffic / applications will have a 34 % compound annual growth rate(CAGR) from 2010 to 2015 and reach nearly 60 exabytes per month. (1 exabyte is 1018 bytes.)
• Consumer Internet video will experience a 48 % CAGR from 2010 to 2015 and reach approximately35 exabytes per month.
• Internet video (including video calling) will increase from 40 % to approximately 61 % of all con-sumer Internet traffic [19].
Taking all of these trends into consideration, it is forecast that from 2010 to 2015 global IP traffic will expe-rience a 4-fold increase from 20 exabyte per month in 2010 to 81 exabyte per month in 2015, a 32 % CAGR.Table 4 provides a breakdown of predicted IP traffic for 2015 by region [11].
Mobile data will experience a 92 % CAGR between 2010 and 2015, but still only account for 7.77 % of theoverall traffic in 2015. Fixed/Wired will experience a 24 % CAGR during the same period, and account for46.1 % of the overall traffic in 2015. Finally, Fixed/Wi-Fi® will experience a 39 % CAGR over this period,and account for 46.2 % of all traffic. Figure 2 summarizes the global IP traffic by local access technology[11].
Table 2—Fixed network traffic generation comparison
Device Traffic multiplier
Tablet 1.1
64-bit Laptop/PC 1.9
Internet enabled HDTV 2.9
Gaming console 3.0
Internet enabled 3D TV 3.2
Table 3—Growth of broadband speeds by region
Region2010
(Mb/s)2015
(Mb/s)Growth factor
North America 7.5 27 3.7
Latin America 2.8 8 2.9
Western Europe 9.2 36 3.9
Central/Eastern Europe 6.1 20 3.3
Asia Pacific 5.5 25 4.6
Japan 15.5 64 4.1
Middle East & Africa 2.8 7 2.5
6

IEEE 802.3 Industry Connections Bandwidth Assessment 19th July 2012
3.3 Storage growth
The total amount of data created or replicated on the planet in 2010 was over 1 zettabyte (1 zettabyte is 1021
bytes) - that’s 143 GB for each of the 7 billion people on the planet [10].
According to the “Digital Universe” study [10], stored data is growing at 40 % to 50 % per year (i.e., dou-bling every two years) compared to IP traffic growth of 30 % to 40 % per year. While 75 % of this data iscreated by individuals, enterprises have some responsibility for 80% of it at some point in its life. 25 % ofdata is generated by machines and that is growing fast with sensors and remote monitoring on the increase.
Table 4—2015 Regional IP traffic forecast
Region IP Traffic (exabyte/month)
Growth factor since 2010 (CAGR)
North America 22.3 3 x (26 %)
Latin America 4.7 7 x (48 %)
Western Europe 18.9 4 x (32 %)
Central/Eastern Europe 3.7 5 x (39 %)
Asia Pacific 24.1 4 x (35 %)
Japan 4.8 3 x (27 %)
Middle East & Africa 2.0 8 x (52 %)
Figure 2—Global IP traffic by local access technology
7

IEEE 802.3 Industry Connections Bandwidth Assessment 19th July 2012
Over the next decade, the number of servers (physical and virtual) is expected to grow by a factor of 10, stor-age is expected to grow by a factor of 50 (see Figure 3) and the number of files is expected to grow by a fac-tor of 75 [10].
One example of a large data source is the Large Hadron Collider [10] which generates 15 petabyte of dataper year (1 petabyte is 1015 bytes) which is then replicated at 11 Tier 1 storage sites around the world (150+petabyte of storage) and partially replicated at a further 160 Tier 2 sites requiring an additional 150+ pet-abyte of storage per year.
There are a number of ways to access storage from the network [10] as shown in Figure 4.
Figure 3—Storage growth
8

IEEE 802.3 Industry Connections Bandwidth Assessment 19th July 2012
External storage sales was about 17 exabyte in 2011 and is projected to grow to about 90 exabyte in 2015(About 1 % of the digital universe as shown in Figure 3). Ethernet-based storage is expected to grow to over50 % of storage capacity in 2015 [10]. See Figure 5.
Figure 4—Storage access arrangements
Figure 5—Ethernet based storage growth
9

IEEE 802.3 Industry Connections Bandwidth Assessment 19th July 2012
Some discernible trends in storage are [10]:
• Application migration benefits from networked storage compared to direct attached storage;
• Cloud computing requires major data moves;
• Virtual Desktop Infrastructure (VDI) leads to centralized storage and increased network traffic;
• Solid State Drives (SSDs) or flash storage leads to higher bandwidth demands on the network.
Cloud computing offers the vision of hosting and scaling applications from the data center to the cloud pro-vider or another data center on demand [10]. To enable this transition, the data needs to be exchanged ormirrored from the primary data center to the cloud provider or secondary data center first. See Figure 6.
From the total storage of 7.9 zettabyte projected to be needed in 2015, 0.8 zettabyte (10 %) is expected to bein maintained in a cloud and 1.4 zettabyte (20 %) is expected to be “touched” by cloud computing serviceproviders [10].
Virtual Desktop Infrastructure (VDI) as depicted in Figure 7 enables centralized management and simpleupgrades to software and applications at the expense of an increase in LAN traffic [10].
Figure 6—Data mirroring between storage arrays
10

IEEE 802.3 Industry Connections Bandwidth Assessment 19th July 2012
3.4 Data center
3.4.1 Server bandwidth scenarios
This section will cover information related to server bandwidth scenarios [8].
Today, 90 % of server units in the market are based on the x86 architecture. Figure 8 shows LightCounting'sforecast of the transition of 1GbE server ports to 10GbE server ports. In 2011 10GbE server ports accountfor about 17 % of the total, but this is forecast to grow to 59 % in 2014.
This growth is fueled by the capabilities of PCIe (Peripheral Component Interconnect Express). Table 5 tab-ulates the total bandwidths (both directions) for the different generations of PCIe and Figure 9 plots the PCIebandwidth (both directions) for x8 links by generation.
Figure 7—Virtual desktop infrastructure architecture
Figure 8—LightCounting forecast: server transition, 1GbE to 10GbE
11

IEEE 802.3 Industry Connections Bandwidth Assessment 19th July 2012
From an Ethernet perspective, PCIe 3.0 can support 40 Gb/s in a x8 configuration. It is anticipated that thenext generation of PCIe will support 100 Gb/s in a x8 configuration, but the future of PCIe was unknown atthe time of writing this assessment. It was suggested that PCIe 4.0 would enable dual 100GbE server portsstarting in 2015 [8].
A view of how the I/O bandwidth for servers is expected to grow over the next few years is shown inTable 6. This perspective is based on three definitions of classes for servers:
• Free: A large portion of server buyers will only implement what is offered as the base configuration.These buyers would choose the "Free" option.
• Performance: Users who demand more I/O performance due to virtualization or, in some cases, thedesire to converge the SAN and LAN networks within the rack.
• Fringe: Users who demand the most possible bandwidth. The servers that would need this band-width would typically be the high end 4 or 8 socket versions (translating into 40 or 80 cores inIntel’s Romley cycle, and huge amounts of memory).
Table 5—PCIe bandwidth (both directions)
Link width
x1 x2 x4 x8 x16
PCIe 1.x (gigabyte/s) 0.5 1 2 4 8
PCIe 2.x (gigabyte/s) 1 2 4 8 16
PCIe 3.0 (gigabyte/s) 2 4 8 16 32
Figure 9—PCI Bandwidth by generation
12

IEEE 802.3 Industry Connections Bandwidth Assessment 19th July 2012
3.4.2 High performance computing
This section describes observations of bandwidth needs in high performance computing (HPC) [12].
During the 2006 IEEE 802.3 Call-For-Interest for a Higher Speed Ethernet Study Group, it was observedthat during the period of 1993 to 2005 performance, as measured by average gigaflops per second, had pro-ceeded in a very predictable linear manner for High Performance Computing: every four years correspondedto a 10x leap in processing power [20]. See Figure 10.
At this point in time, the US government is targeting an exascale machine by 2019, which is more than twoorders of magnitude in performance improvement over today’s fastest machines [12].
While single line data rates are anticipated to increase, it is not anticipated that they will grow by a corre-sponding two orders of magnitude in performance, hence it is anticipated that increased parallelism will be
Table 6—Server interconnect scenarios
Year Free Performance Fringe
2011 2 x 1GbE LOM 2 x 1GbE LOMn x 1GbE NIC
2 x 1GbE LOMn x 10GbE NIC
2012 2 x 1GbE LOM Option 2 x 10GbE LOM Option 2 x 10GbE LOM Optionn x 40GbE NIC
2014 2 x 10GbE LOM Option 2 x 10GbE LOM Optionn x 10GbE NIC
2 x 40GbE LOM Optionn x 40GbE NIC
2016 2 x 10GbE LOM Option 2 x 10GbE LOM Optionn x 40GbE NIC
2 x 40GbE LOM Optionn x 100GbE NIC
Figure 10—Observed HPC performance trend from 2006 HSSG CFI
13

IEEE 802.3 Industry Connections Bandwidth Assessment 19th July 2012
necessary to meet the performance requirements for system interconnects in order to meet the necessary per-formance targets.
Current Ethernet link technologies do not employ lane redundancy. There is a concern that the use ofincreased parallelism will make these links more vulnerable to failure. Failure analysis indicates an unac-ceptable number of single fiber fails for a typical HPC/server environment.
It has been suggested by the authors that at least 400 Gb/s will be needed for future HPC/server environ-ments. It has also been suggested that investment in extra bandwidth for lane redundancy is also necessary.
3.4.3 Data center bandwidth scenarios
This section discusses potential bandwidth scenarios by looking at different server configurations and thenlooking at the bandwidth throughout the data center network [6].
Four types of intra / inter cluster traffic were identified: 1) Within a rack; 2) Between racks; 3) Cluster-to-cluster; and 4) Server-to-link. Their characteristics are defined in Table 7.
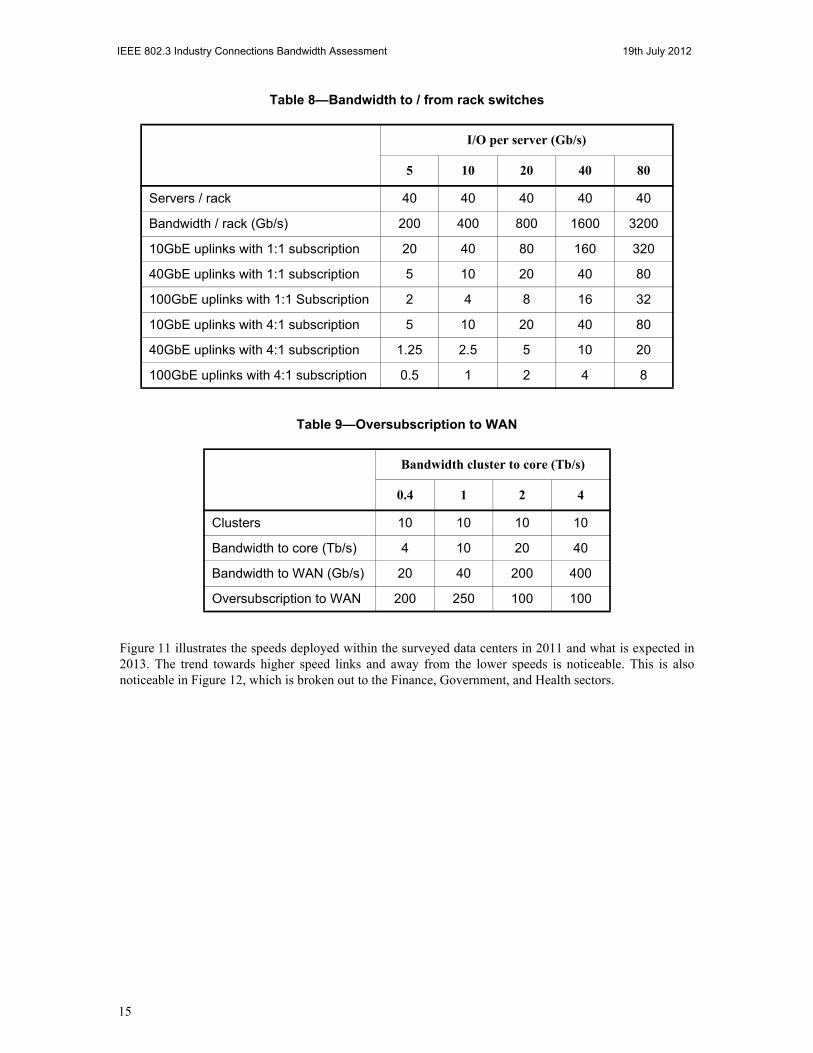
The bandwidth to and from rack switches, based on various I/O capabilities per server, number of uplinks,and different subscription rates is tabulated in Table 8.
The bandwidth of a cluster will then depend on the number of racks within a given cluster. For example, a40 server rack might produce anywhere from 0.4 to 3.2 terabit per second (Tb/s). A cluster, consisting oftwenty-five of these racks, would produce 10 to 80 Tb/s. Typically, there is a high oversubscription rate tothe wide area network (WAN), as illustrated in Table 9. High oversubscription rates occur because usersdon't perceive a need for 1:1 subscription and won't pay for it.
3.4.4 Global data centers
This section covers the findings of an international survey conducted by BSRIA [15]. The scope of theonline survey included individuals from the United States, United Kingdom, Germany, France, India, andChina in the following sectors:
• Government (federal, military, state, and local)
• Finance and insurance
• Healthcare (and pharmaceutical)
• Education (primary, secondary, and universities)
• Professional and information services
• Co-location, co-hosting, and carrier hotels.
Table 7—Types of communication
No of switches Latency(No of switches)
No of links Reach
Within a rack 1 1 2 Few meters
Between racks within a cluster 3 3 4 < 100 m
Cluster to cluster 5+ 5+ 6 100’s of m
Server to Internet 3+ 3+ plus router 4+ 100’s of m
14
IEEE 802.3 Industry Connections Bandwidth Assessment 19th July 2012
Figure 11 illustrates the speeds deployed within the surveyed data centers in 2011 and what is expected in2013. The trend towards higher speed links and away from the lower speeds is noticeable. This is alsonoticeable in Figure 12, which is broken out to the Finance, Government, and Health sectors.
Table 8—Bandwidth to / from rack switches
I/O per server (Gb/s)
5 10 20 40 80
Servers / rack 40 40 40 40 40
Bandwidth / rack (Gb/s) 200 400 800 1600 3200
10GbE uplinks with 1:1 subscription 20 40 80 160 320
40GbE uplinks with 1:1 subscription 5 10 20 40 80
100GbE uplinks with 1:1 Subscription 2 4 8 16 32
10GbE uplinks with 4:1 subscription 5 10 20 40 80
40GbE uplinks with 4:1 subscription 1.25 2.5 5 10 20
100GbE uplinks with 4:1 subscription 0.5 1 2 4 8
Table 9—Oversubscription to WAN
Bandwidth cluster to core (Tb/s)
0.4 1 2 4
Clusters 10 10 10 10
Bandwidth to core (Tb/s) 4 10 20 40
Bandwidth to WAN (Gb/s) 20 40 200 400
Oversubscription to WAN 200 250 100 100
15

IEEE 802.3 Industry Connections Bandwidth Assessment 19th July 2012
Table 10 provides insight into deployed media on a per speed basis. Details regarding the information inTable 10 are not available for further exploration.
Table 10—Media deployment
Media 10 G 40 G 100 G
Over copper point-to-point links 33 % 11 % 11 %
Over copper structured cable 26 % 38 % 23 %
Over OM3 / OM4 multimode fiber cable 25 % 29 % 41 %
Over single-mode fiber cable 13 % 21 % 20 %
Figure 11—Data center study - percentage of links by speed
Figure 12—Speeds in finance, government, and health
16

IEEE 802.3 Industry Connections Bandwidth Assessment 19th July 2012
3.5 Data intensive science
Modern science is becoming increasingly dependent on high speed data networks and is generating everincreasing amounts of traffic [16].
Perhaps the best known example of this is the Large Hadron Collider (LHC) at CERN. The ATLAS detectoralone generates very large data sets (transfers of tens of terabytes are routine) with automated data distribu-tion to two tiers of storage sites [10] over multiple continents.
The ATLAS detector generates ~1 petabyte per second from the instrument (1 petabyte is 1015 bytes) and amulti-stage trigger farm reduces this to ~200 to 400 megabyte/s with additional data from event reconstruc-tion. This data is then distributed to multiple international collaborating organizations via 10 to 40 Gb/s linksout to large repositories in Europe, North America, and Asia as well as 5 to 10 Gb/s links to analysis centersworldwide [16]. This will increase over time as the LHC is upgraded.
A second example data source is genome sequencing [16]. While this field is clearly in its infancy, a signifi-cant increase in the data it is generating can already be seen. This increase is coming from two directions:
• Per-instrument data rate is increasing significantly (~10x over 5 years)
• Cost of sequencers is plummeting (10x over 5 years) – Human genome sequencing cost $10,500 inJuly 2011 from $8.9 million in July 2007 – NYTimes
The use of genomics (and hence the need to transfer genomics data) is expanding very rapidly as the scienceimproves and new applications are discovered.
Many of the instruments used in basic science research are essentially high-resolution digital cameras andthe data rates from these instruments are increasing with the capabilities of the instruments [16]. Someinstruments in development will be able to collect terabits per second of data internally but there is notenough I/O capability on the chip to get all the data out so some level of on-chip data reduction will berequired. Transfer or streaming of the resulting data to computing resources will then be necessary. This istypically at about 2.5 Gb/s today, but with a significant growth curve going forward.
An example of a new experiment that is currently under development is the Square Kilometer Array (SKA)[16]. This is a very large radio telescope in the southern hemisphere with approximately one square kilome-ter of combined signal collection area. This will have ~2800 receivers in the telescope array with mostreceivers within a 180 km diameter area. There is an average run of about 100 km to the central correlatorwhich receives about 2 petabytes of data per second. Data will then be distributed to international collabora-tors with an expected rate of about100 Gb/s from the correlator to other analysis centers worldwide. Otherexperiments that are likely to generate large amounts of data include sensor networks, ITER, etc.
The very structure of modern science assumes there is a network interconnecting all parts of the collabora-tion [16]. Large, unique facilities (e.g. LHC, SKA, ITER) provide a focus for all members of a field withdata distributed to scientists and analysis results distributed among collaborators. Data analysis using localresources also drives data movement. For example, a large simulation run at a supercomputer center fol-lowed by secondary analysis at home institution. The modern trend is towards large data sets with increasingscope for collaboration over analysis where scientific productivity is gated on data analysis. In the generalcase both data moved to analysis and analysis moved to data must be supported.
The Energy Sciences network (ESnet) provides a data network that links scientists at national laboratories,universities and other research institutions. Figure 13 shows how the traffic on this network has evolvedfrom January 1990 to August 2011. This network is expecting 100 petabytes per month of data in 2015 [16].
17

IEEE 802.3 Industry Connections Bandwidth Assessment 19th July 2012
Networks for data intensive science have somewhat different characteristics from other networks. For agiven bandwidth, they have much larger per-flow rates and a much smaller flow count. There is often a sig-nificant fraction (10 to 50 %) of link bandwidth in a single flow (often over intercontinental distances). Infuture, data rates are expected to continue to increase due to sensor data rate scaling with semiconductorcapabilities and large facilities replicating data multiple times within large collaborations [16]. Science net-works are expected to continue to see a different traffic profile with relatively small flow count and rela-tively large flow rates (which does not favor LAG-like implementations).
3.6 Financial sector
This section examines the bandwidth demand in the financial industry [7].
Figure 13—ESnet accepted traffic (petabytes per month)
18

IEEE 802.3 Industry Connections Bandwidth Assessment 19th July 2012
The financial industry's use of networking technology has grown significantly. For example, Figure 14 dem-onstrates how the total number of messages per second for options data, equities trades, equities quotes, andorder traffic has grown exponentially over the past few years.
Another example is shown in Figure 15, which illustrates how source data from one data center was thendistributed via multicast into the public network and the resulting bandwidth impact.
Figure 14—Financial industry and messaging
Figure 15—Bandwidth distributed to the financial community
19

IEEE 802.3 Industry Connections Bandwidth Assessment 19th July 2012
Figure 16 illustrates an exemplar external network.
The next generation network will employ a flat layer 2 approach with reaches of approximately 1000 feetneeded. Within an example data center environment, a number of interesting relevant data points were pro-vided. There are approximately 10,000 servers that are mostly 2U and 4U rack servers with some blade serv-ers. At the time of the presentation in mid 2011, there were more 1GbE servers than 10GbE servers, but10GbE servers were being deployed that year, and it was indicated that 40GbE servers would be deployed in2012. The servers were described as "off-the-shelf x86 servers from major OEM", which deploy x8 PCIeslots. The typical servers being deployed have six 10GbE ports and / or eight 1GbE ports. A top-of-rack(ToR) configuration is used, with two switches provided for every three racks. Multimode fiber links arebeing used for short reach connections to the top-of-rack switches. Furthermore, the data center core band-width was described as 18.35 Tb/s [21].
The optical footprint of a single center includes support for 170 lambdas, based on 10G and 100G wave-lengths that support 1GbE and 10GbE circuits for a total delivery of 2.87 Tb/s. The 100G wavelengths bearfurther consideration - initially the plan for the specific data center specified four 100G wavelengths, butultimately thirteen 100G wavelengths were deployed. At the time of the presentation the thirteen 100Gwavelengths were being used to support delivery of one hundred and thirty 10GbE circuits. There was astated immediate need for terabit links for the core network and external links [21].
Additionally, the financial industry is known to be sensitive to latency. Low latency data is uncompressed,and requires more bandwidth. The financial industry is looking for latency numbers to be reduced from mil-liseconds to microseconds.
Figure 16—Exemplar external network
20

IEEE 802.3 Industry Connections Bandwidth Assessment 19th July 2012
3.7 Cable data
This section discusses the bandwidth trends for the cable industry and also aims to predict that trend in thefuture. The various devices involved in the cable infrastructure [9] are shown in Figure 17.
The bandwidth related terms that are used in this section are defined according to Figure 18.
The average consumed bandwidth is used quite extensively for traffic engineering calculations (determininghow much capacity is required to satisfy a given Service Group (pool) of subscribers).
Figure 17—The cable infrastructure
Figure 18—Bandwidth related terms
21

IEEE 802.3 Industry Connections Bandwidth Assessment 19th July 2012
Data for the maximum permitted downstream bandwidth over time is plotted in Figure 19 [9]. This plot(which is on a logarithmic vertical scale) shows a roughly constant rate of increase in maximum permitteddownstream bandwidth of about 1.5 times per year over the 29 years from 1982 to 2011.
This trend (a 50% Compound Annual Growth Rate (CAGR) for a high end user’s Internet connection speed)is called “Nielsen's Law of Internet bandwidth”. If this trend were to be continued, it would predict a maxi-mum permitted downstream bandwidth of about 300 Mb/s by 2016.
Data for the average downstream byte consumption for a typical 40k HHP (House-Holds Passed) head-endover time is plotted in Figure 20 [22]. This plot (which is also on a logarithmic vertical scale) predicts anaverage downstream byte consumption in a 40k HHP head-end of about 8.51015 bytes by 2016 which is anincrease of roughly 10 times over the average downstream byte consumption seen in 2011.
Data for the average downstream bandwidth over time is plotted in Figure 20 [9]. This plot (which is also ona logarithmic vertical scale) predicts an average downstream bandwidth of about 3.5 Mb/s by 2016 which isan increase of roughly 10 times over the average downstream bandwidth seen in 2011.
Figure 19—Maximum permitted downstream bandwidth trend
22

IEEE 802.3 Industry Connections Bandwidth Assessment 19th July 2012
Data for the maximum permitted upstream bandwidth over time is plotted in Figure 21 [9]. This plot (whichis on a logarithmic vertical scale) shows a roughly constant rate of increase in maximum permitted upstreambandwidth of about 1.1 times per year. Upstream bandwidth is comprised of two types of traffic: protocolmessages (e.g., HTTP GETs, TCP ACKs, etc.) and uploads (e.g., P2P torrents, web page inputs, FTP trans-fers). The protocol message bandwidth is predictable [9] and so it should increase in line with the rate ofdownstream bandwidth increase. The upload bandwidth is harder to predict [9] as it is highly dependent onthe popularity of apps at any given time. For example when P2P represented a large percentage of the trafficin 2008, upstream bandwidth was ~41 % of downstream bandwidth. However, when over-the-top IP video(delivery of video content from sources other than the ISP) became popular in 2010, upstream bandwidthdropped to be only ~28 % of downstream bandwidth.
Figure 20—Average downstream byte consumption trend
23

IEEE 802.3 Industry Connections Bandwidth Assessment 19th July 2012
If the maximum permitted upstream bandwidth trend continues to grow at a 10 % CAGR, then it would beexpected rise to ~8 Mb/s by 2016. However, indicators are that this upstream trend could grow at a muchfaster rate in the next four years.
Data for the average upstream byte consumption for a typical 40k HHP (House-Holds Passed) head-endover time is plotted in Figure 22 [22]. This plot (which is also on a logarithmic vertical scale) predicts anaverage downstream byte consumption in a 40k HHP head-end of about 4.21014 bytes by 2016 which is anincrease of roughly 2.7 times over the average downstream byte consumption seen in 2011.
Figure 21—Maximum permitted upstream bandwidth trend
24

IEEE 802.3 Industry Connections Bandwidth Assessment 19th July 2012
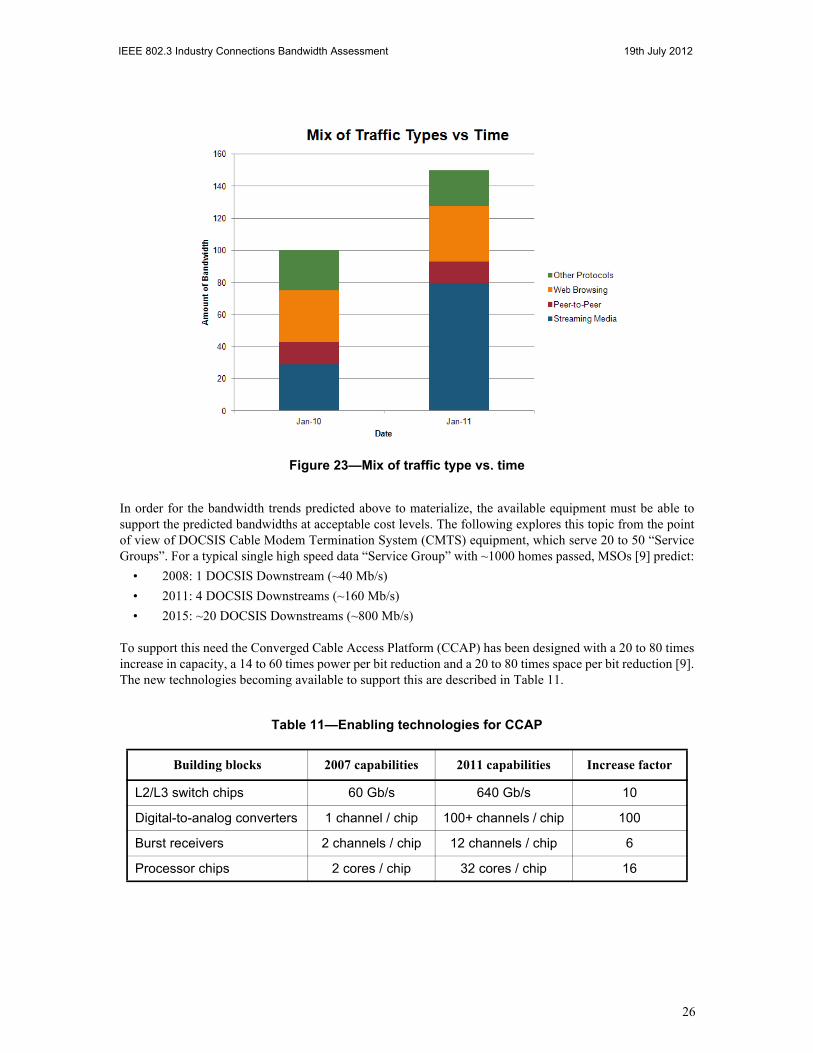
In the period since 2009, there has been a rapid uptake of over-the-top IP video which has helped drive thecontinual increase in downstream consumption that is shown in Figure 20. This transition has also changedthe mix of traffic types carried over the cable networks. These changes can be clearly viewed withinFigure 23.
The increase in average downstream bandwidth per subscriber during the period 1Q 2010 to 1Q 2011 [9] isshown in Figure 23.
Figure 22—Average upstream byte consumption trend
25
IEEE 802.3 Industry Connections Bandwidth Assessment 19th July 2012
In order for the bandwidth trends predicted above to materialize, the available equipment must be able tosupport the predicted bandwidths at acceptable cost levels. The following explores this topic from the pointof view of DOCSIS Cable Modem Termination System (CMTS) equipment, which serve 20 to 50 “ServiceGroups”. For a typical single high speed data “Service Group” with ~1000 homes passed, MSOs [9] predict:
• 2008: 1 DOCSIS Downstream (~40 Mb/s)
• 2011: 4 DOCSIS Downstreams (~160 Mb/s)
• 2015: ~20 DOCSIS Downstreams (~800 Mb/s)
To support this need the Converged Cable Access Platform (CCAP) has been designed with a 20 to 80 timesincrease in capacity, a 14 to 60 times power per bit reduction and a 20 to 80 times space per bit reduction [9].The new technologies becoming available to support this are described in Table 11.
Table 11—Enabling technologies for CCAP
Building blocks 2007 capabilities 2011 capabilities Increase factor
L2/L3 switch chips 60 Gb/s 640 Gb/s 10
Digital-to-analog converters 1 channel / chip 100+ channels / chip 100
Burst receivers 2 channels / chip 12 channels / chip 6
Processor chips 2 cores / chip 32 cores / chip 16
Figure 23—Mix of traffic type vs. time
26
IEEE 802.3 Industry Connections Bandwidth Assessment 19th July 2012
3.8 Optical Transport Network
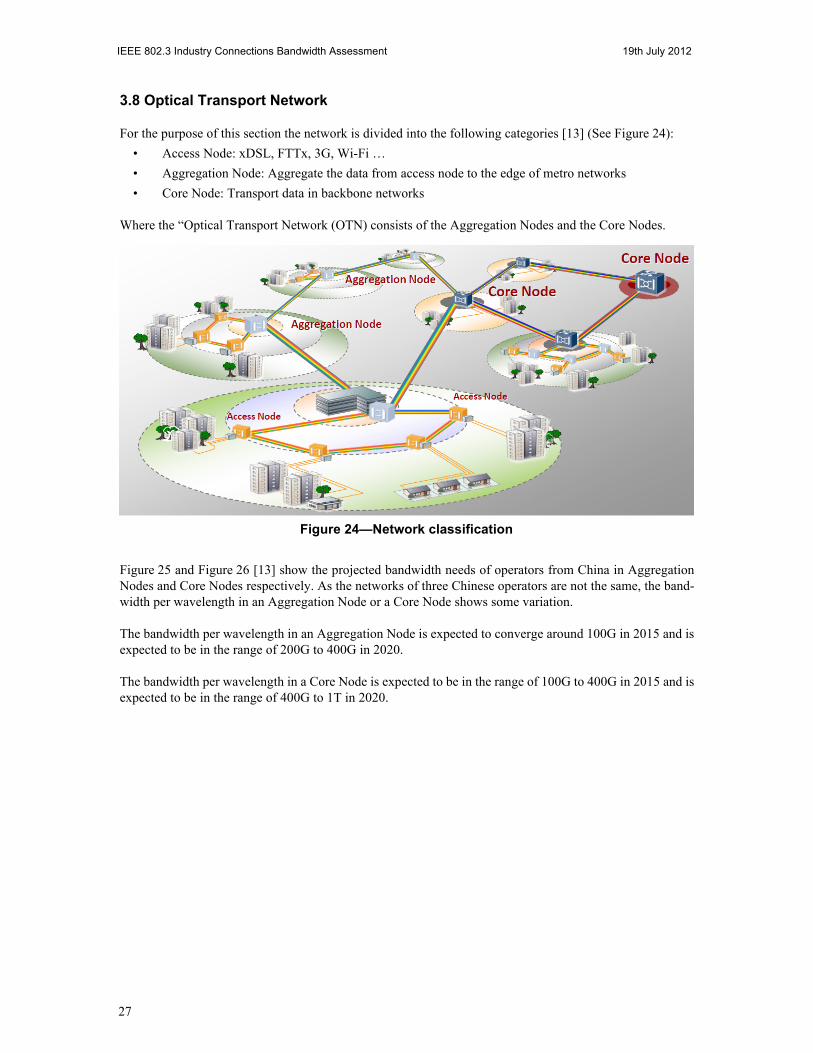
For the purpose of this section the network is divided into the following categories [13] (See Figure 24):
• Access Node: xDSL, FTTx, 3G, Wi-Fi …
• Aggregation Node: Aggregate the data from access node to the edge of metro networks
• Core Node: Transport data in backbone networks
Where the “Optical Transport Network (OTN) consists of the Aggregation Nodes and the Core Nodes.
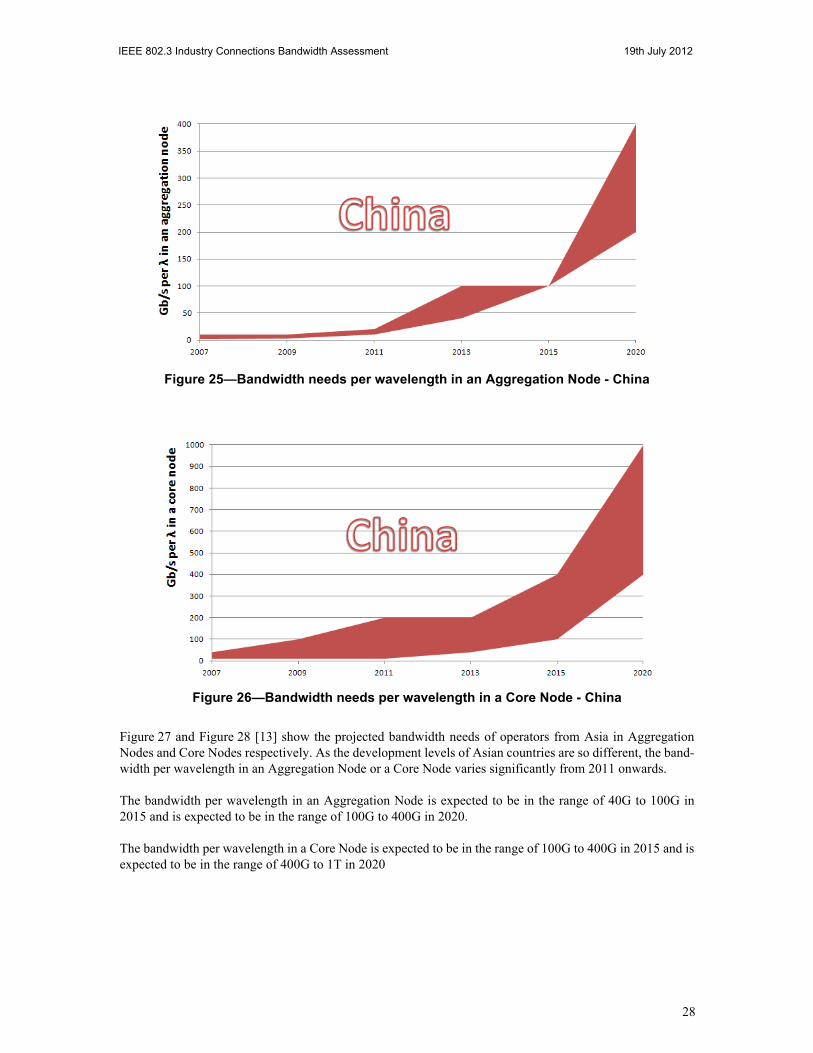
Figure 25 and Figure 26 [13] show the projected bandwidth needs of operators from China in AggregationNodes and Core Nodes respectively. As the networks of three Chinese operators are not the same, the band-width per wavelength in an Aggregation Node or a Core Node shows some variation.
The bandwidth per wavelength in an Aggregation Node is expected to converge around 100G in 2015 and isexpected to be in the range of 200G to 400G in 2020.
The bandwidth per wavelength in a Core Node is expected to be in the range of 100G to 400G in 2015 and isexpected to be in the range of 400G to 1T in 2020.
Figure 24—Network classification
27
IEEE 802.3 Industry Connections Bandwidth Assessment 19th July 2012
Figure 27 and Figure 28 [13] show the projected bandwidth needs of operators from Asia in AggregationNodes and Core Nodes respectively. As the development levels of Asian countries are so different, the band-width per wavelength in an Aggregation Node or a Core Node varies significantly from 2011 onwards.
The bandwidth per wavelength in an Aggregation Node is expected to be in the range of 40G to 100G in2015 and is expected to be in the range of 100G to 400G in 2020.
The bandwidth per wavelength in a Core Node is expected to be in the range of 100G to 400G in 2015 and isexpected to be in the range of 400G to 1T in 2020
Figure 25—Bandwidth needs per wavelength in an Aggregation Node - China
Figure 26—Bandwidth needs per wavelength in a Core Node - China
28

IEEE 802.3 Industry Connections Bandwidth Assessment 19th July 2012
Figure 29 and Figure 30 [13] show the projected bandwidth needs of operators from Africa in AggregationNodes and Core Nodes respectively. Due to the large difference in economic development, Africa shows amuch lower rate of increase for bandwidth demand than Asia.
The bandwidth per wavelength in an aggregation node is expected to be up to 40G in 2015 and is expected tobe up to 100G in 2020.
The bandwidth per wavelength in an core node is expected to be up to 200G in 2015 and is expected to be upto 400G in 2020.
Figure 27—Bandwidth needs per wavelength in an Aggregation Node - Asia
Figure 28—Bandwidth needs per wavelength in a Core Node - Asia
29

IEEE 802.3 Industry Connections Bandwidth Assessment 19th July 2012
Figure 29—Bandwidth needs per wavelength in an Aggregation Node - Africa
Figure 30—Bandwidth needs per wavelength in a Core Node - Africa
30
IEEE 802.3 Industry Connections Bandwidth Assessment 19th July 2012
3.9 European peering
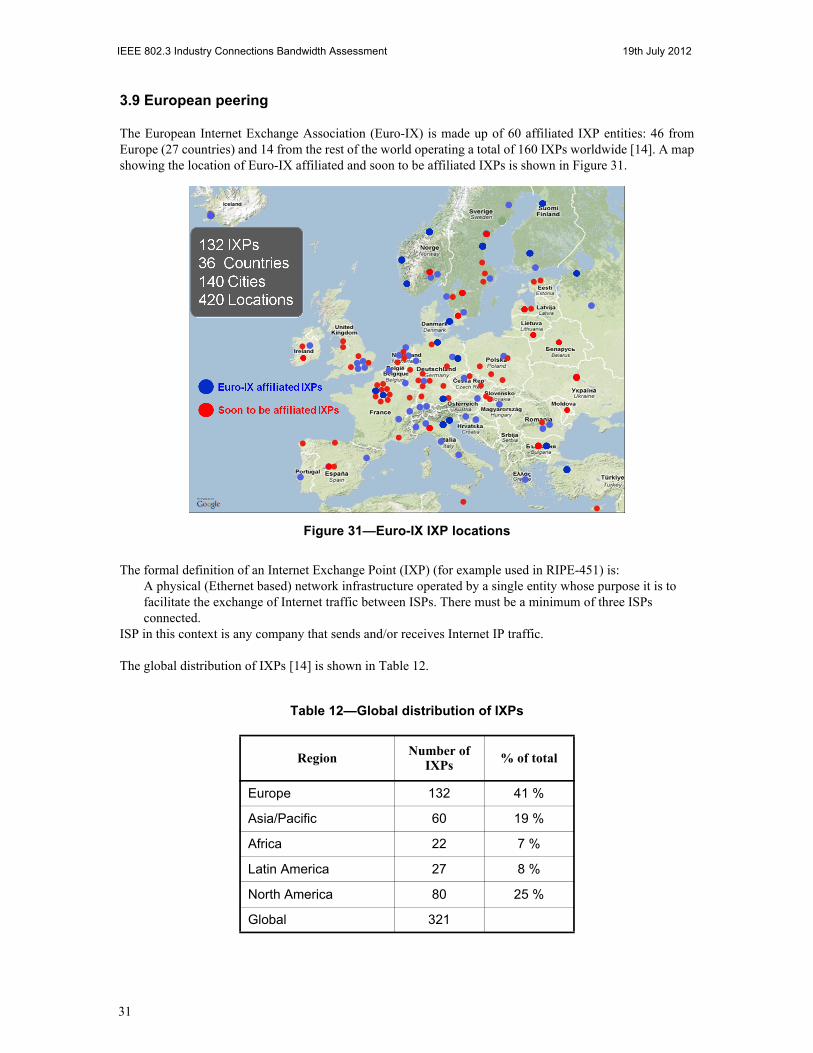
The European Internet Exchange Association (Euro-IX) is made up of 60 affiliated IXP entities: 46 fromEurope (27 countries) and 14 from the rest of the world operating a total of 160 IXPs worldwide [14]. A mapshowing the location of Euro-IX affiliated and soon to be affiliated IXPs is shown in Figure 31.
The formal definition of an Internet Exchange Point (IXP) (for example used in RIPE-451) is:A physical (Ethernet based) network infrastructure operated by a single entity whose purpose it is to facilitate the exchange of Internet traffic between ISPs. There must be a minimum of three ISPs connected.
ISP in this context is any company that sends and/or receives Internet IP traffic.
The global distribution of IXPs [14] is shown in Table 12.
Table 12—Global distribution of IXPs
RegionNumber of
IXPs% of total
Europe 132 41 %
Asia/Pacific 60 19 %
Africa 22 7 %
Latin America 27 8 %
North America 80 25 %
Global 321
Figure 31—Euro-IX IXP locations
31
IEEE 802.3 Industry Connections Bandwidth Assessment 19th July 2012
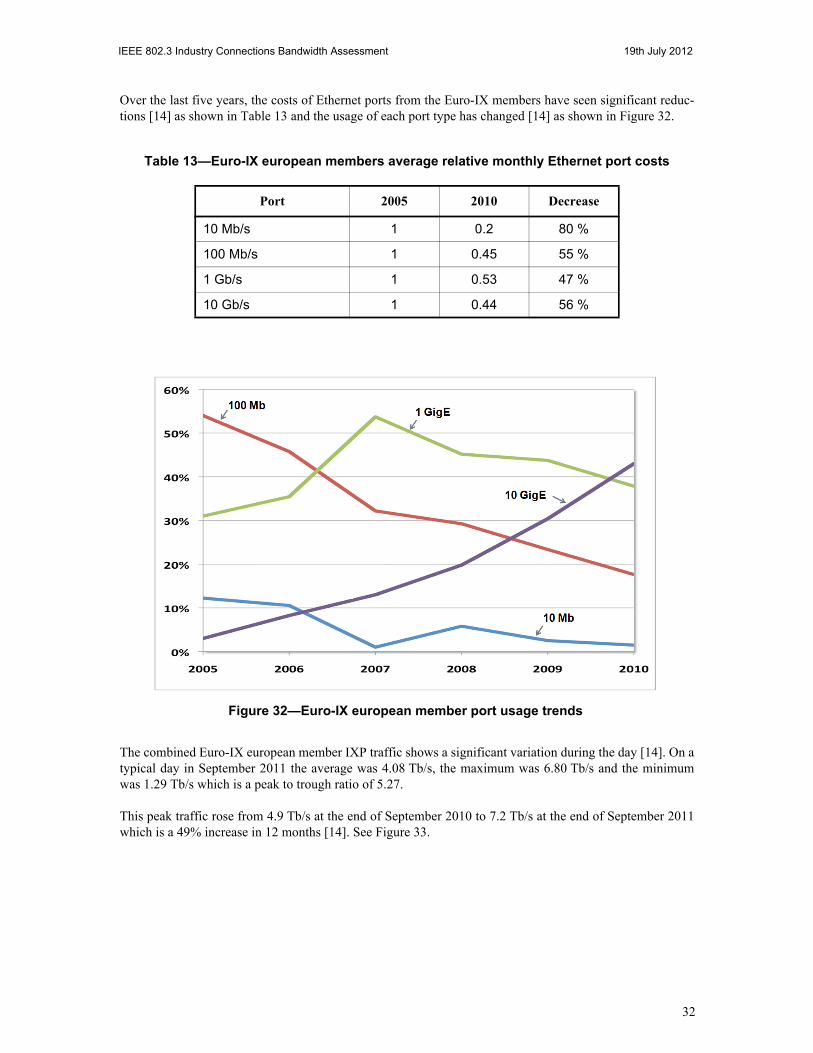
Over the last five years, the costs of Ethernet ports from the Euro-IX members have seen significant reduc-tions [14] as shown in Table 13 and the usage of each port type has changed [14] as shown in Figure 32.
The combined Euro-IX european member IXP traffic shows a significant variation during the day [14]. On atypical day in September 2011 the average was 4.08 Tb/s, the maximum was 6.80 Tb/s and the minimumwas 1.29 Tb/s which is a peak to trough ratio of 5.27.
This peak traffic rose from 4.9 Tb/s at the end of September 2010 to 7.2 Tb/s at the end of September 2011which is a 49% increase in 12 months [14]. See Figure 33.
Table 13—Euro-IX european members average relative monthly Ethernet port costs
Port 2005 2010 Decrease
10 Mb/s 1 0.2 80 %
100 Mb/s 1 0.45 55 %
1 Gb/s 1 0.53 47 %
10 Gb/s 1 0.44 56 %
Figure 32—Euro-IX european member port usage trends
32

IEEE 802.3 Industry Connections Bandwidth Assessment 19th July 2012
In addition to this steady growth in peak traffic, individual IXPs also see occasional spikes due to specialevents (such as sport) [14]. Figure 34 shows the traffic at the LONAP (London) IXP on a normal weekdaywhen the peak traffic was 8.5 Gb/s. Figure 35 shows the traffic through the same IXP on a Wednesday whenthere was a football match between England and Slovenia during the 2010 World Cup when the peak trafficrose to 29.5 Gb/s.
Figure 33—Euro-IX european member peak traffic growth
Figure 34—LONAP (London) traffic on a ‘normal’ weekday
33

IEEE 802.3 Industry Connections Bandwidth Assessment 19th July 2012
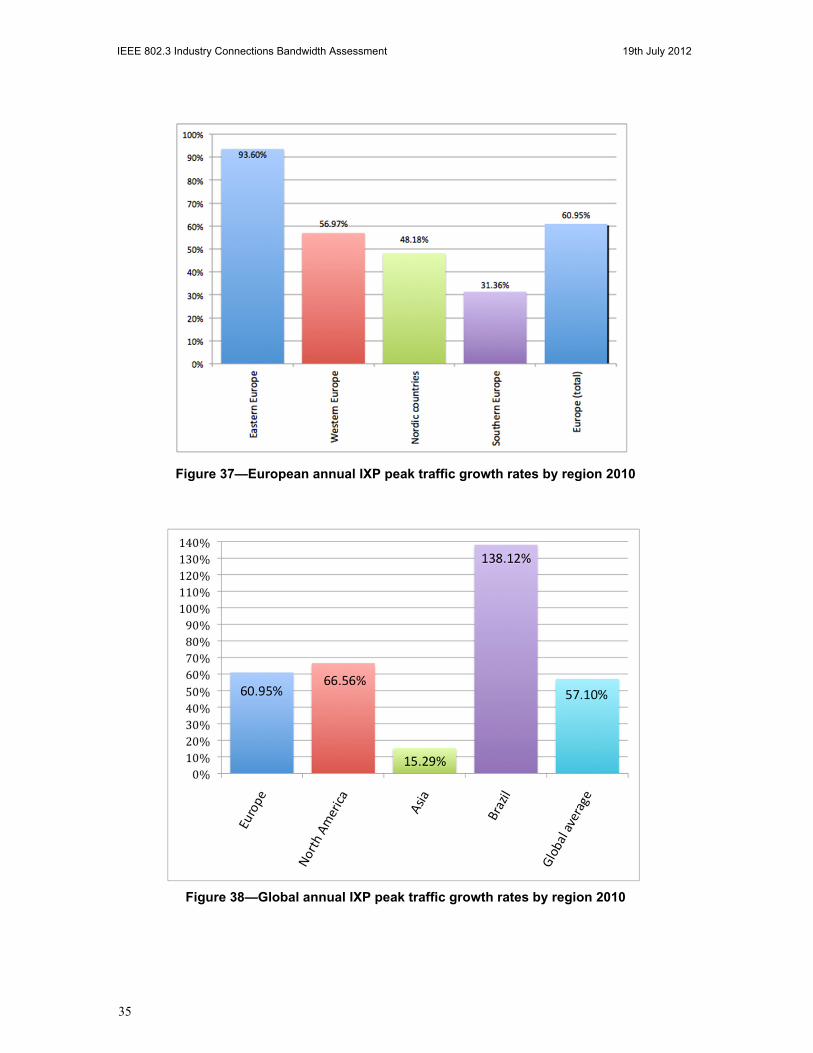
The annual IXP peak traffic growth rates show some variation according to the size of the IXP and alsoaccording to region [14]. The Global annual IXP peak traffic growth rates in 2010 shown by IXP size aregiven in Figure 36, shown by region within Europe are given in Figure 37 and shown by global region aregiven in Figure 38.
Figure 35—LONAP (London) traffic during the World Cup 2010 England vs. Slovenia
Figure 36—Global annual IXP peak traffic growth rates by IXP size 2010
34
IEEE 802.3 Industry Connections Bandwidth Assessment 19th July 2012
Figure 37—European annual IXP peak traffic growth rates by region 2010
Figure 38—Global annual IXP peak traffic growth rates by region 2010
35

IEEE 802.3 Industry Connections Bandwidth Assessment 19th July 2012
Fitting an exponential trendline to the data from the end of August 2005 to the end of August 2010 showsthat the IXP peak traffic increase during this period was 12 times. See Figure 39.
If this trend continues, this would result in IXP peak traffic of 47 Tb/s by 2015. See Figure 39.
4. Assessment
4.1 Peripheral growth trends
The key findings section of this report includes information on the growth trends for a variety of peripheraldevices that create data that is transmitted over Ethernet networks. In particular, these are:
• 3.2 Visual Networking Index
• 3.7 Cable data
• 3.3 Storage growth
• 3.4.1 Server bandwidth scenarios
As discussed in 3.2, the number of Internet users is steadily increasing, the rate that each of those users candownload (and upload) data is steadily increasing and there is a trend towards those users accessing increas-ing amounts of video content via the Internet. These factors combined are predicted to cause a 32 % CAGRfor global IP traffic as shown in Figure 2. Similarly, in 3.7 it is shown that the trend for the maximum per-mitted downstream bandwidth for cable users has shown a CAGR of 50 % for the past 29 years (seeFigure 19), the average downstream bandwidth has a similar slope (see Figure 20) and the cable industry isdeveloping future platforms to enable this trend to continue.
Data storage is also growing with a CAGR of about 50 % (see 3.3 for details). While this does not directlyrelate to the rate of increase of Ethernet traffic, there is a trend towards data being maintained within a cloudor being “touched” by cloud computing service providers, which does relate to Ethernet traffic increase.
Most Ethernet traffic involves a server at one or other end of the link. Section 3.4.1, and in particular Table 6gives a view of how the I/O bandwidth for servers is expected to grow over the next few years. To relate thisinformation to Ethernet bandwidth demand requires knowledge of server deployment rates, the mix of thevarious server types and the average utilisation of the server interfaces, but since for all server types there is
Figure 39—Five year peak European IXP traffic projection
36

IEEE 802.3 Industry Connections Bandwidth Assessment 19th July 2012
at least a factor of 10 increase in I/O bandwidth predicted within the next five years, this appears to be ade-quate to keep up with predicted Ethernet bandwidth demand growth.
4.2 Network growth trends
The growth trends of various segments of the Ethernet ecosystem are reported on in the following sections:
• 3.4.3 Data center bandwidth scenarios
• 3.4.4 Global data centers
• 3.5 Data intensive science
• 3.6 Financial sector
• 3.8 Optical Transport Network
• 3.9 European peering
As discussed in 3.4.3 and 3.4.4, Ethernet interfaces are widely used within data centers and there is a signif-icant trend for interface rates to move from the lower speeds towards higher ones (see Figure 11).
Two sources of network data explored in the key findings section are data intensive science in 3.5 and thefinancial sector in 3.6. For data intensive science, the data accepted by the ESnet network over the pasteleven years is shown in Figure 13. A fit to this curve over the period 2004 to 2011 shows a CAGR of 70 %.Similarly, data for traffic growth from one data center in the financial sector is shown in Figure 15 and a fitto this gives a CAGR of 95 %.
For long haul networks the current highest rate (OTU4) is sized to accommodate 100Gb Ethernet. Section3.8 predicts a need for OTN rates per wavelength (and hence Ethernet rates) of 400 Gb/s starting in 2015 and1 Tb/s starting in 2020 (see Figure 26 and Figure 28).
The traffic growth trend of one segment of the Internet Exchange Point (IXP) community is explored in 3.9.An exponential fit to the data from the end of August 2005 to the end of August 2010 shows a CAGR of64 % (see Figure 39).
4.3 Variation factors
The growth trends discussed in 4.1 and 4.2 above are the average for the sector being discussed. It is recog-nized, however, that within each sector there is often significant variation in the growth rate by region ormarket segment.
In 3.2 global IP traffic is forecast to show a CAGR of 32 %. However, the predicted growth varies from26 % in North America to 52 % in the Middle East and Africa as shown in Table 4 and also varies accordingto access technology from 24 % for fixed/wired to 92 % for mobile data as shown in Figure 2.
The growth in broadband speeds between 2010 and 2015 predicted in Table 3 shows a regional variationfrom a factor of 2.5 (20 % CAGR) in the Middle East and Africa up to a factor of 4.6 (36 % CAGR) in AsiaPacific.
Within the data centers discussed in 3.4.4, Figure 12 shows a different distribution of link speeds dependingon whether the segment is finance and insurance, government or health.
For the Optical Transport Network (OTN), information is given in Figure 25 to Figure 30 on the predictedbandwidth per wavelength needs that shows significantly higher needs in China and Asia than for Africa.
37

IEEE 802.3 Industry Connections Bandwidth Assessment 19th July 2012
In 3.9 a CAGR of 64 % is predicted for the European IXPs. As shown in Figure 36, the growth in IXP peaktraffic in 2010 varied from 45.88 % in small IXPs to 78.18 % in medium IXPs with large IXPs in between at59.45 %. The regional variation in growth within Europe in 2010 is shown in Figure 37 with the lowestbeing 31.36 % in Southern Europe and the highest 93.6 % in Eastern Europe. Figure 38 shows even widervariation globally, with the lowest being 15.29 % in Asia and the highest 138.12 % in Brazil.
4.4 Summary
The growth in global demand for Ethernet bandwidth that will be seen in the coming years is expected to bedue to a combination of the factors considered in the sections above together with (of course) some addi-tional factors that have not been considered here. Perhaps the most important of the latter factors is the abil-ity of the Ethernet community to keep the cost per bit falling with time in such a way that the exponentialrise in traffic does not result in unsupportable costs. This cost ultimately limits the ability to deliver thebandwidth necessary to satisfy the various applications, which influences these applications’ impact onbandwidth growth.
In an attempt to place all of the relevant growth factors on a single chart, the relative traffic increase of thevarious sectors studied normalized to 2010 (the year when IEEE Std 802.3ba™ was approved) are shown inFigure 40 (solid lines) together with the rate of increase of core networking assumed by the 2007 IEEE802.3 Higher Speed Study Group (HSSG) Tutorial (dashed line) [18].
The most aggressive growth rates are shown by the financial sector and data intensive science (CAGR =95 % and 70 % respectively), slower growth rates are seen for maximum bandwidth for cable users(although the number of users is also increasing) and for IP traffic (CAGR = 50 % and 32 % respectively)with the growth seen in Peering in the middle (CAGR = 64 %). The dotted red line showing the rate of
Figure 40—Relative traffic increase normalized to 2010
Figure 15 NYSE historical data
Cable Figure 20
CAGR = 50 %
IP traffic Figure 2
CAGR = 32 %
HSSG tutorial Slide 22 server I/O
CAGR = 36 %
HSSG tutorial Slide 22 core CAGR = 58 %
Figure 39 Euro-IX historical data
Peeringfit to Figure 39 CAGR = 61 %
Financial sector fit to Figure 15 CAGR = 95 %
Sciencefit to Figure 13
ESnet 2004 to 2011 CAGR = 70 %
38

IEEE 802.3 Industry Connections Bandwidth Assessment 19th July 2012
increase of core networking assumed by the 2007 IEEE 802.3 HSSG (CAGR = 58 %) also appears in themiddle of the group, suggesting that this assumption is still justified. It should be noted that end-stationapplications, such as cable users and server I/O, have slower growth rates, which indicates a continuation ofthe trend noted during the 2007 HSSG (CAGR = 36 %) and shown by the dotted blue line.
The various projections show traffic increasing to a factor of ten above the 2010 value from as early as 2013to as late as 2018 with the previous HSSG assumption doing so by 2015. As noted above, whether or notthese projections are realized or not will depend, among other things, on the ability of the Ethernet commu-nity to keep the cost per bit falling with time. In addition to this, the question of whether this increased trafficis serviced by the introduction of new rates above 100 Gb/s or by increasing numbers of the existing inter-faces depends on the ability of the higher rates to provide a sufficiently cost effective solution.
5. References
[1] Muller, S., Bechtolsheim, A., Hendel, A. HSSG Speeds and Feeds - Reality Checkhttp://www.ieee802.org/3/hssg/public/jan07/muller_01_0107.pdf
[2] Lee, D. Saturating 100G and 1T Pipeshttp://www.ieee802.org/3/hssg/public/mar07/lee_01_0307.pdf
[3] Seely, T. Carrier Hurdles To Meeting 10GE Demandhttp://www.ieee802.org/3/hssg/public/mar07/seely_01_0307.pdf
[4] Bresser, A. Requirements from an operator perspectivehttp://www.ieee802.org/3/hssg/public/may07/bresser_01_0507.pdf
[5] IEEE 802.3 Industry Connections Ethernet Bandwidth Assessment Ad Hoc Request for Informationhttp://www.ieee802.org/3/ad_hoc/bwa/public/anslow_01a_0411.pdf
[6] Kipp, S. Data Center Bandwidth Scenarioshttp://www.ieee802.org/3/ad_hoc/bwa/public/may11/kipp_01_0511.pdf
[7] Bach, A. Bandwidth Demand in the Financial Industry - The Growth Continueshttp://www.ieee802.org/3/ad_hoc/bwa/public/jun11/bach_01a_0611.pdf
[8] Brown, K. Server Bandwidth Scenarios - Signposts for 40G/100G Server Connectionshttp://www.ieee802.org/3/ad_hoc/bwa/public/jul11/brown_01a_0711.pdf
[9] Cloonan, T. Bandwidth Trends on the Internet... A Cable Data Vendor's Perspectivehttp://www.ieee802.org/3/ad_hoc/bwa/public/sep11/cloonan_01a_0911.pdf
[10] Kipp, S. Storage Growth and Ethernet http://www.ieee802.org/3/ad_hoc/bwa/public/sep11/kipp_01a_0911.pdf
[11] Nowell, M. Cisco Visual Networking Index (VNI) Global IP Traffic Forecast Update; 2010–2015http://www.ieee802.org/3/ad_hoc/bwa/public/sep11/nowell_01_0911.pdf
[12] Pepeljugoski, P., Coteus, P. Bandwidth needs in HPC taking into account link redundancyhttp://www.ieee802.org/3/ad_hoc/bwa/public/nov11/pepeljugoski_01_1111.pdf
[13] Huang, X. Bandwidth Needs in Core and Aggregation nodes in the Optical Transport Networkhttp://www.ieee802.org/3/ad_hoc/bwa/public/nov11/huang_01_1111.pdf
39

IEEE 802.3 Industry Connections Bandwidth Assessment 19th July 2012
[14] Steenman, H. The European Peering Scenehttp://www.ieee802.org/3/ad_hoc/bwa/public/nov11/steenman_01_1111.pdf
[15] Hansen, L. Global Data Centres Presentation IEEEhttp://www.ieee802.org/3/ad_hoc/bwa/public/dec11/hansen_01_1211.pdf
[16] Dart, E. Data Intensive Science Impact on Networkshttp://www.ieee802.org/3/ad_hoc/bwa/public/dec11/dart_01a_1211.pdf
[17] IEEE 802 LMSC Executive Meeting minutes, 12 November 2010http://www.ieee802.org/minutes/2010-November/20101112-closing-minutes-v0.pdf#Page=127
[18] IEEE 802.3 Higher Speed Study Group Tutorial, An Overview: The Next Generation of Ethernethttp://www.ieee802.org/3/hssg/public/nov07/HSSG_Tutorial_1107.zip
[19] Cisco Visual Networking Index™,http://www.cisco.com/go/vni
[20] IEEE 802.3 Higher Speed Study Group Call-For-Interesthttp://www.ieee802.org/3/cfi/0706_1/CFI_01_0706.pdf
[21] IEEE 802.3 BWA ad hoc meeting notes, 29 June, 2011http://www.ieee802.org/3/ad_hoc/bwa/public/jun11/notes_01_0611.pdf
[22] Cloonan, T. Comment #25 against D1.0 of this reporthttp://www.ieee802.org/3/ad_hoc/bwa/public/apr12/cloonan_01_0312.pdf
The IEEE standards or products referred to in this report are trademarks of the Institute of Electrical and Electronics Engineers, Inc.DOCSYS is a trademark of CableLabs.Wi-Fi is a registered trademark of the Wi-Fi Alliance.Intel is a registered trademark of Intel Corporation in the U.S. and/or other countries.Cisco Visual Networking Index is a trademark of Cisco Systems, Inc. and/or its affiliates in the United States and certain other coun-tries.
40