ieee p802.3bn epoc · rg-6 (+) ≤150 ft. (45.7 m) max rg-6 < 6 ft. (~ 2 m) max not specified x...
TRANSCRIPT
IEEE p802.3bn EPoC Channel Model Ad Hoc committee
Baseline Channel Model recommendations
Agenda
Topology illustrations
Parameter Table
2 Slide
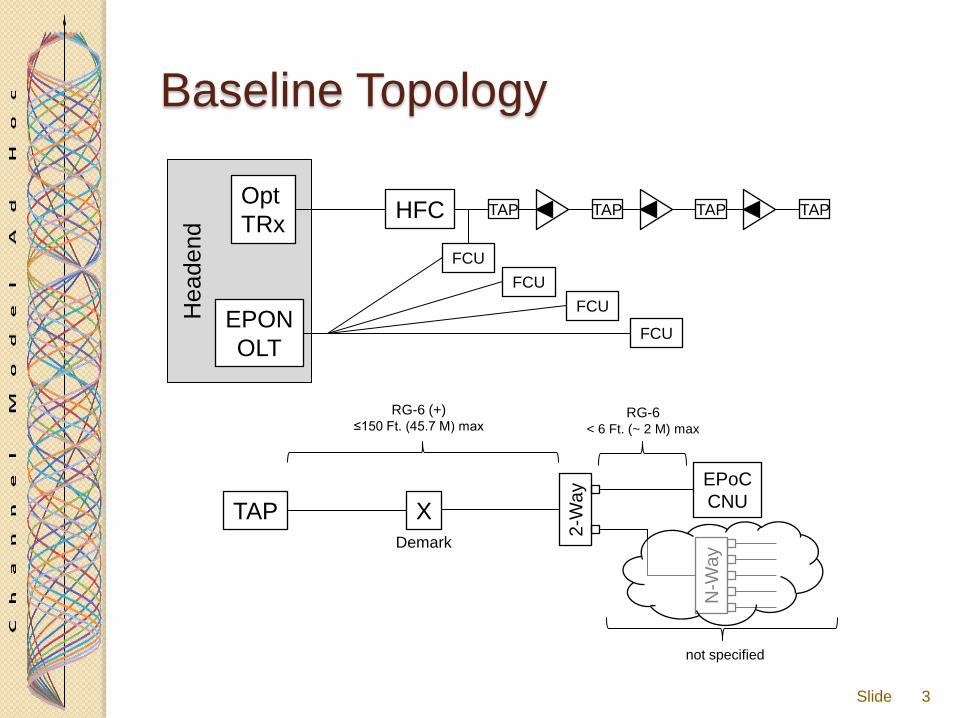
Headend
Baseline Topology
3
EPON
OLT
FCU
FCU
HFC Opt
TRx TAP TAP
FCU
FCU
TAP TAP
TAP
2-W
ay
N-W
ay
EPoC
CNU
RG-6 (+) ≤150 Ft. (45.7 M) max
RG-6 < 6 Ft. (~ 2 M) max
not specified
X
Demark
Slide
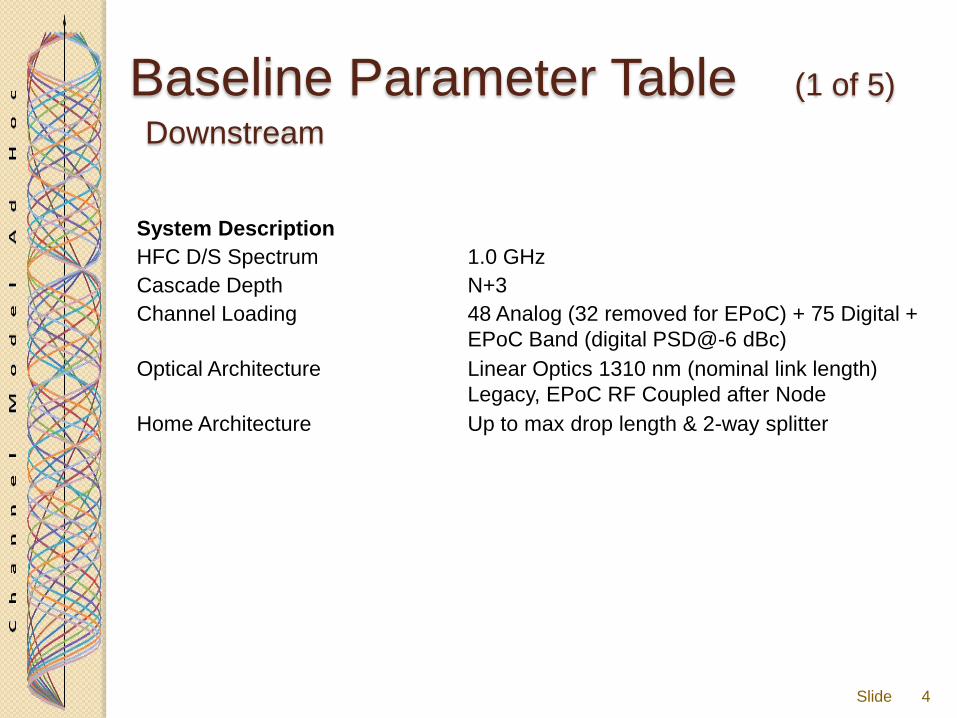
Baseline Parameter Table (1 of 5)
System Description
HFC D/S Spectrum 1.0 GHz
Cascade Depth N+3
Channel Loading 48 Analog (32 removed for EPoC) + 75 Digital +
EPoC Band (digital PSD@-6 dBc)
Optical Architecture Linear Optics 1310 nm (nominal link length)
Legacy, EPoC RF Coupled after Node
Home Architecture Up to max drop length & 2-way splitter
Downstream
4 Slide
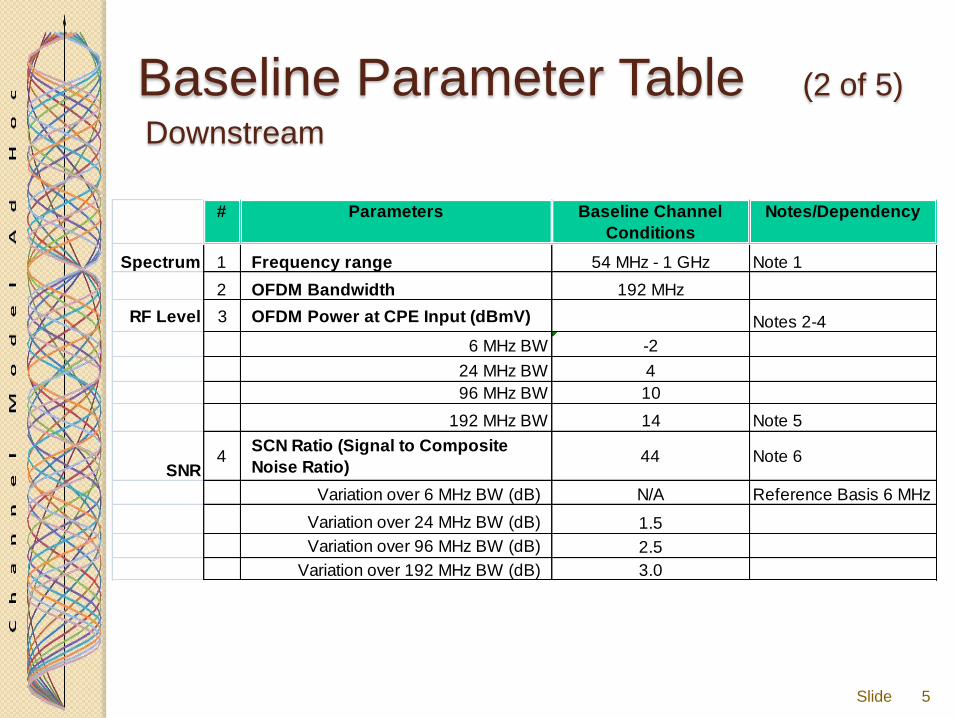
Baseline Parameter Table (2 of 5)
Downstream
5 Slide
# Parameters Baseline Channel
Conditions
Notes/Dependency
Spectrum 1 Frequency range 54 MHz - 1 GHz Note 1
2 OFDM Bandwidth 192 MHz
RF Level 3 OFDM Power at CPE Input (dBmV) Notes 2-4
6 MHz BW -2
24 MHz BW 4
96 MHz BW 10
192 MHz BW 14 Note 5
SNR4
SCN Ratio (Signal to Composite
Noise Ratio)44 Note 6
Variation over 6 MHz BW (dB) N/A Reference Basis 6 MHz
Variation over 24 MHz BW (dB) 1.5
Variation over 96 MHz BW (dB) 2.5
Variation over 192 MHz BW (dB) 3.0
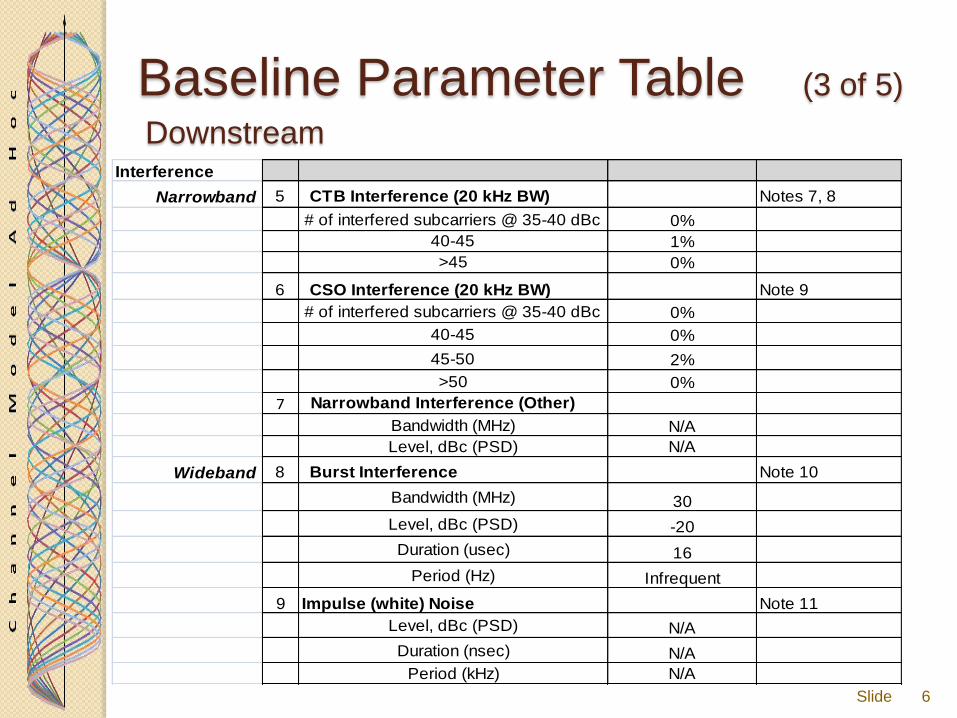
Baseline Parameter Table (3 of 5)
Downstream
6 Slide
Interference
Narrowband 5 CTB Interference (20 kHz BW) Notes 7, 8
# of interfered subcarriers @ 35-40 dBc 0%
40-45 1%
>45 0%
6 CSO Interference (20 kHz BW) Note 9
# of interfered subcarriers @ 35-40 dBc 0%
40-45 0%
45-50 2%
>50 0%
7 Narrowband Interference (Other)
Bandwidth (MHz) N/A
Level, dBc (PSD) N/A
Wideband 8 Burst Interference Note 10
Bandwidth (MHz) 30
Level, dBc (PSD) -20
Duration (usec) 16
Period (Hz) Infrequent
9 Impulse (white) Noise Note 11
Level, dBc (PSD) N/A
Duration (nsec) N/A
Period (kHz) N/A
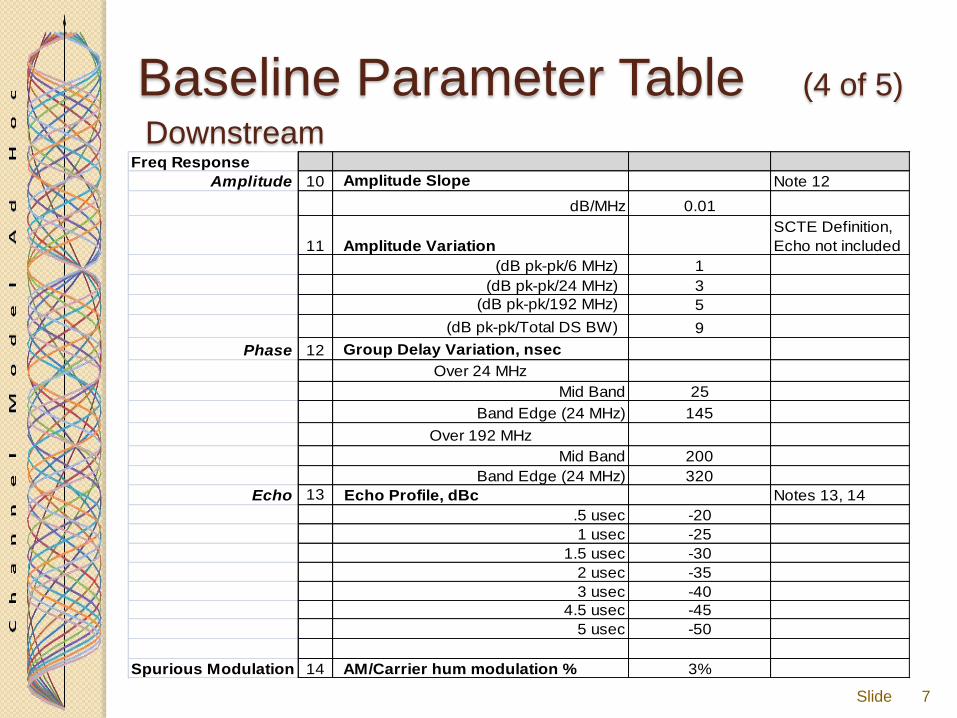
Baseline Parameter Table (4 of 5)
Downstream
7 Slide
Freq Response
Amplitude 10 Amplitude Slope Note 12
dB/MHz 0.01
11 Amplitude Variation
SCTE Definition,
Echo not included
(dB pk-pk/6 MHz) 1
(dB pk-pk/24 MHz) 3
(dB pk-pk/192 MHz) 5
(dB pk-pk/Total DS BW) 9
Phase 12 Group Delay Variation, nsec
Over 24 MHz
Mid Band 25
Band Edge (24 MHz) 145
Over 192 MHz
Mid Band 200
Band Edge (24 MHz) 320
Echo 13 Echo Profile, dBc Notes 13, 14
.5 usec -20
1 usec -25
1.5 usec -30
2 usec -35
3 usec -40
4.5 usec -45
5 usec -50
Spurious Modulation 14 AM/Carrier hum modulation % 3%
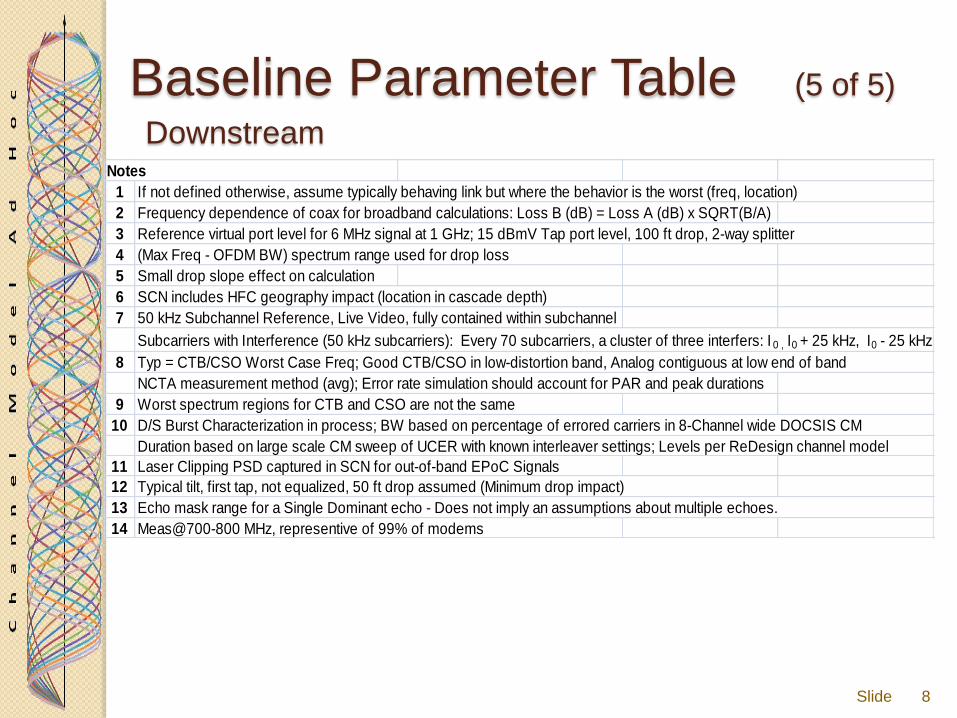
Baseline Parameter Table (5 of 5)
Notes
1 If not defined otherwise, assume typically behaving link but where the behavior is the worst (freq, location)
2 Frequency dependence of coax for broadband calculations: Loss B (dB) = Loss A (dB) x SQRT(B/A)
3 Reference virtual port level for 6 MHz signal at 1 GHz; 15 dBmV Tap port level, 100 ft drop, 2-way splitter
4 (Max Freq - OFDM BW) spectrum range used for drop loss
5 Small drop slope effect on calculation
6 SCN includes HFC geography impact (location in cascade depth)
7 50 kHz Subchannel Reference, Live Video, fully contained within subchannel
Subcarriers with Interference (50 kHz subcarriers): Every 70 subcarriers, a cluster of three interfers: I 0 , I0 + 25 kHz, I0 - 25 kHz
8 Typ = CTB/CSO Worst Case Freq; Good CTB/CSO in low-distortion band, Analog contiguous at low end of band
NCTA measurement method (avg); Error rate simulation should account for PAR and peak durations
9 Worst spectrum regions for CTB and CSO are not the same
10 D/S Burst Characterization in process; BW based on percentage of errored carriers in 8-Channel wide DOCSIS CM
Duration based on large scale CM sweep of UCER with known interleaver settings; Levels per ReDesign channel model
11 Laser Clipping PSD captured in SCN for out-of-band EPoC Signals
12 Typical tilt, first tap, not equalized, 50 ft drop assumed (Minimum drop impact)
13 Echo mask range for a Single Dominant echo - Does not imply an assumptions about multiple echoes.
14 Meas@700-800 MHz, representive of 99% of modems
Downstream
8 Slide
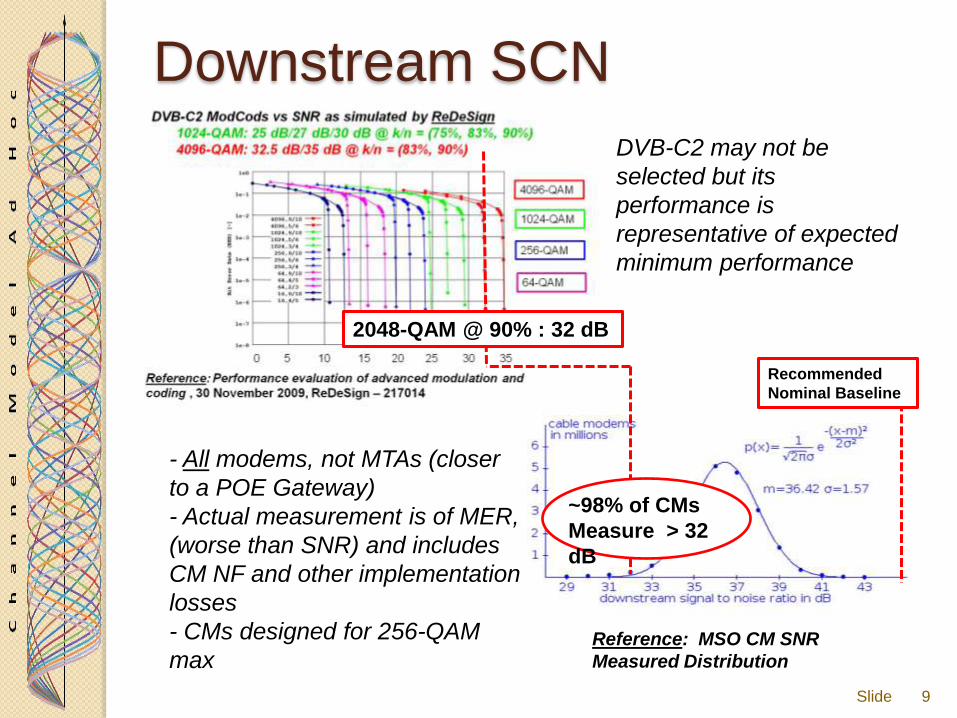
Downstream SCN
DVB-C2 may not be
selected but its
performance is
representative of expected
minimum performance
- All modems, not MTAs (closer
to a POE Gateway)
- Actual measurement is of MER,
(worse than SNR) and includes
CM NF and other implementation
losses
- CMs designed for 256-QAM
max
2048-QAM @ 90% : 32 dB
Recommended
Nominal Baseline
Reference: MSO CM SNR
Measured Distribution
~98% of CMs
Measure > 32
dB
9 Slide
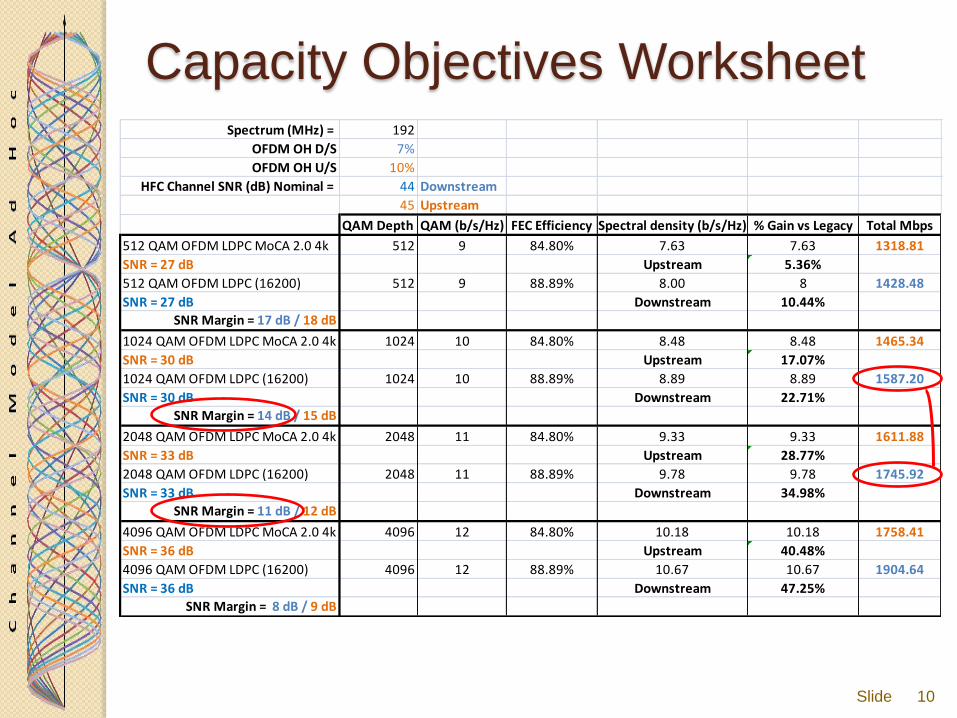
Spectrum (MHz) = 192
OFDM OH D/S 7%
OFDM OH U/S 10%
HFC Channel SNR (dB) Nominal = 44 Downstream
45 Upstream
QAM Depth QAM (b/s/Hz) FEC Efficiency Spectral density (b/s/Hz) % Gain vs Legacy Total Mbps
512 QAM OFDM LDPC MoCA 2.0 4k 512 9 84.80% 7.63 7.63 1318.81
SNR = 27 dB Upstream 5.36%
512 QAM OFDM LDPC (16200) 512 9 88.89% 8.00 8 1428.48
SNR = 27 dB Downstream 10.44%
SNR Margin = 17 dB / 18 dB
1024 QAM OFDM LDPC MoCA 2.0 4k 1024 10 84.80% 8.48 8.48 1465.34
SNR = 30 dB Upstream 17.07%
1024 QAM OFDM LDPC (16200) 1024 10 88.89% 8.89 8.89 1587.20
SNR = 30 dB Downstream 22.71%
SNR Margin = 14 dB / 15 dB
2048 QAM OFDM LDPC MoCA 2.0 4k 2048 11 84.80% 9.33 9.33 1611.88
SNR = 33 dB Upstream 28.77%
2048 QAM OFDM LDPC (16200) 2048 11 88.89% 9.78 9.78 1745.92
SNR = 33 dB Downstream 34.98%
SNR Margin = 11 dB / 12 dB
4096 QAM OFDM LDPC MoCA 2.0 4k 4096 12 84.80% 10.18 10.18 1758.41
SNR = 36 dB Upstream 40.48%
4096 QAM OFDM LDPC (16200) 4096 12 88.89% 10.67 10.67 1904.64
SNR = 36 dB Downstream 47.25%
SNR Margin = 8 dB / 9 dB
Capacity Objectives Worksheet
10 Slide
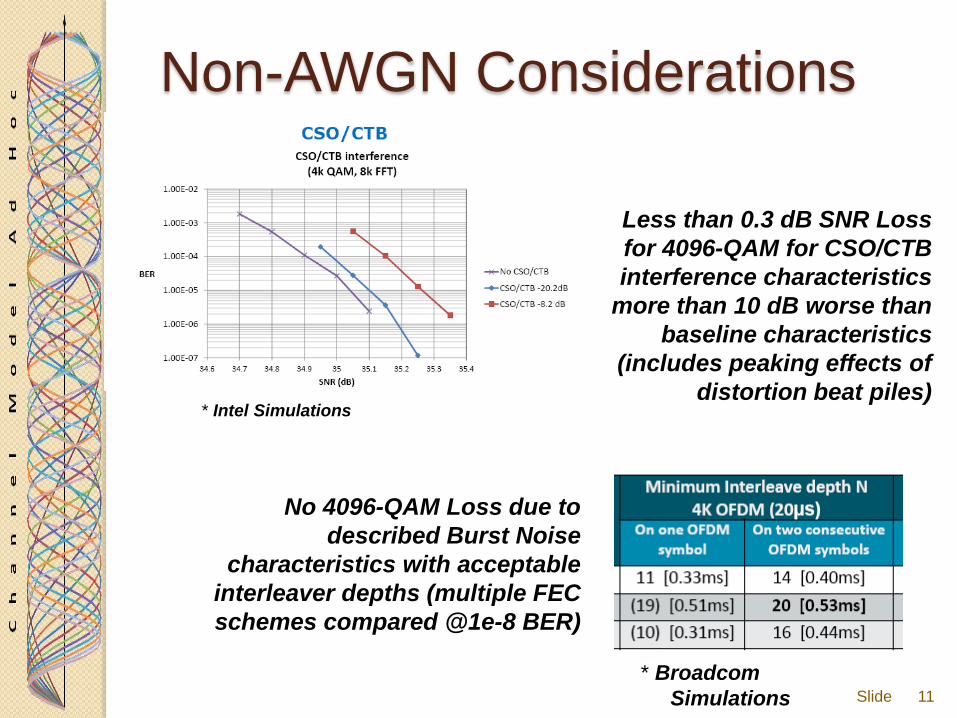
Non-AWGN Considerations
* Intel Simulations
11
* Broadcom
Simulations
No 4096-QAM Loss due to
described Burst Noise
characteristics with acceptable
interleaver depths (multiple FEC
schemes compared @1e-8 BER)
Less than 0.3 dB SNR Loss
for 4096-QAM for CSO/CTB
interference characteristics
more than 10 dB worse than
baseline characteristics
(includes peaking effects of
distortion beat piles)
Slide
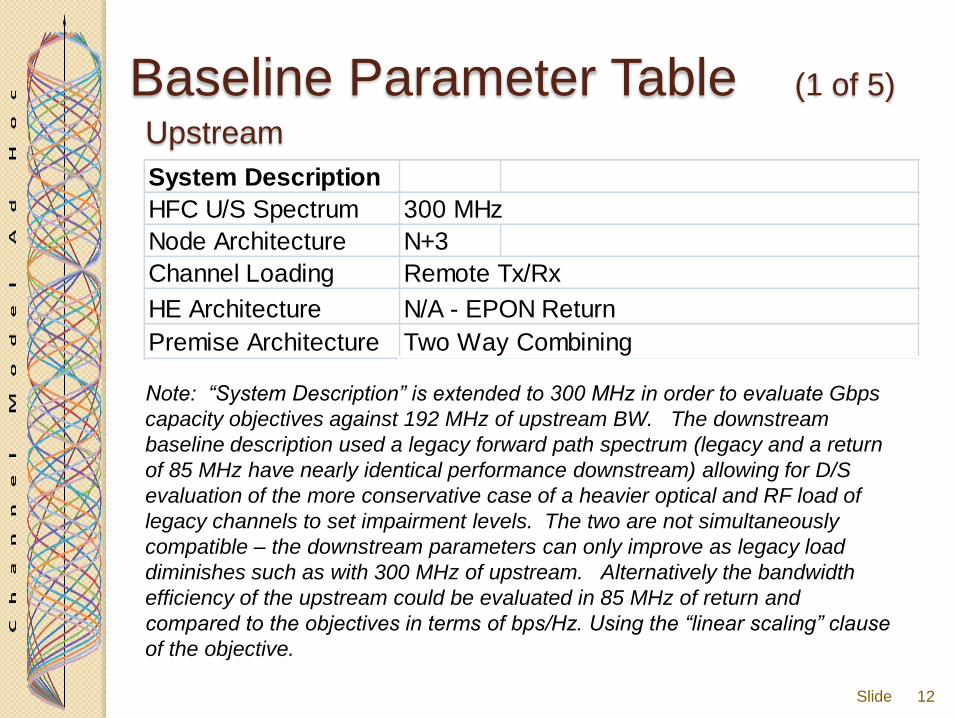
Baseline Parameter Table (1 of 5)
Upstream
System Description
HFC U/S Spectrum 300 MHz
Node Architecture N+3
Channel Loading Remote Tx/Rx
HE Architecture N/A - EPON Return
Premise Architecture Two Way Combining
Note: “System Description” is extended to 300 MHz in order to evaluate Gbps
capacity objectives against 192 MHz of upstream BW. The downstream
baseline description used a legacy forward path spectrum (legacy and a return
of 85 MHz have nearly identical performance downstream) allowing for D/S
evaluation of the more conservative case of a heavier optical and RF load of
legacy channels to set impairment levels. The two are not simultaneously
compatible – the downstream parameters can only improve as legacy load
diminishes such as with 300 MHz of upstream. Alternatively the bandwidth
efficiency of the upstream could be evaluated in 85 MHz of return and
compared to the objectives in terms of bps/Hz. Using the “linear scaling” clause
of the objective.
12 Slide

Baseline Parameter Table (2 of 5)
Upstream
13 Slide
# Parameters Baseline Channel
ConditionsNotes/Dependencies
Spectrum 1 OFDM Bandwidth 192 MHz
2 Frequency range 100-292 MHz
Path Loss 3 Path Loss (dB) 44 Max loss to first active
Variation Freq, 24 MHz BW 1 Note 1
Variation Freq, 96 MHz BW 2.5
Variation Freq, 192 MHz BW 5
Added Noise 4 Input Noise PSD - 115 dBmV/Hz Contibutions of amplifiers
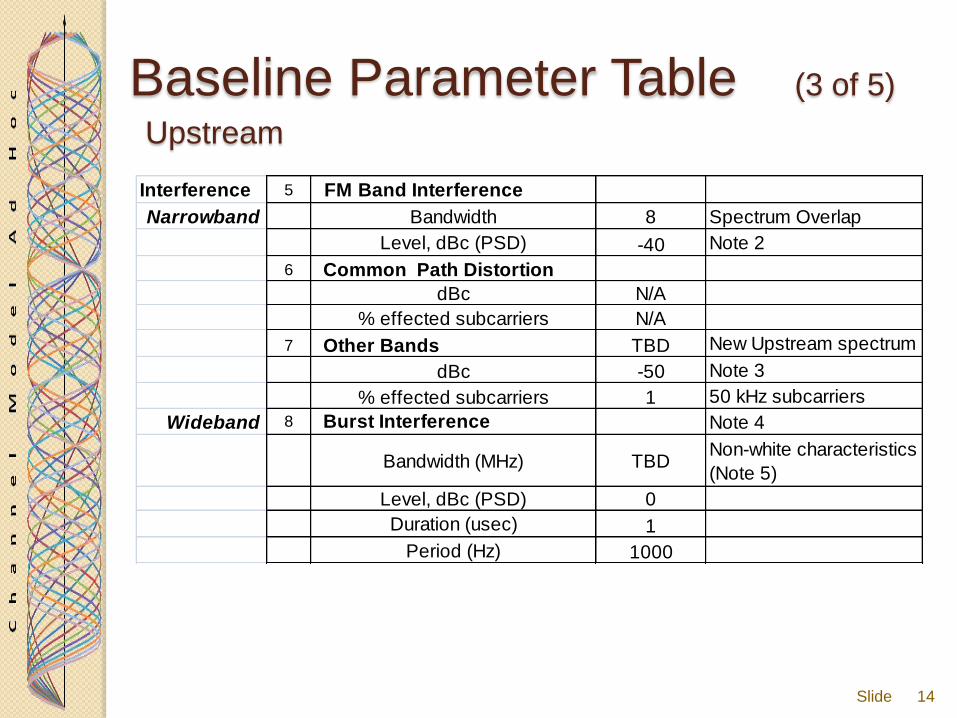
Baseline Parameter Table (3 of 5)
Upstream
14 Slide
Interference 5 FM Band Interference
Narrowband Bandwidth 8 Spectrum Overlap
Level, dBc (PSD) -40 Note 2
6 Common Path Distortion
dBc N/A
% effected subcarriers N/A
7 Other Bands TBD New Upstream spectrum
dBc -50 Note 3
% effected subcarriers 1 50 kHz subcarriers
Wideband 8 Burst Interference Note 4
Bandwidth (MHz) TBDNon-white characteristics
(Note 5)
Level, dBc (PSD) 0
Duration (usec) 1
Period (Hz) 1000

Freq Response
9 Amplitude Slope N/A Captured in Path Loss
Amplitude 10 Amplitude Variation
SCTE Definition, Echo not
included
(dB pk-pk/24 MHz) 1.5
(dB pk-pk/96 MHz) 2.5 (dB pk-pk/192 MHz) 3
Phase 11 Group Delay Variation
Over 24 MHz
Mid Band 25
Band Edge (24 MHz) 280
Over 48 MHz
Mid Band 50
Band Edge (24 MHz) 305
Over 192 MHz 575
Echo 12 Echo Profile, dBc Note 5-6
.5 usec -16
1 usec -22
1.5 usec -29
2 usec -35
3 usec -42
4.5 usec -51
5 usec
13 AM/Carrier hum 5%
Baseline Parameter Table (4 of 5)
Upstream
15 Slide
16
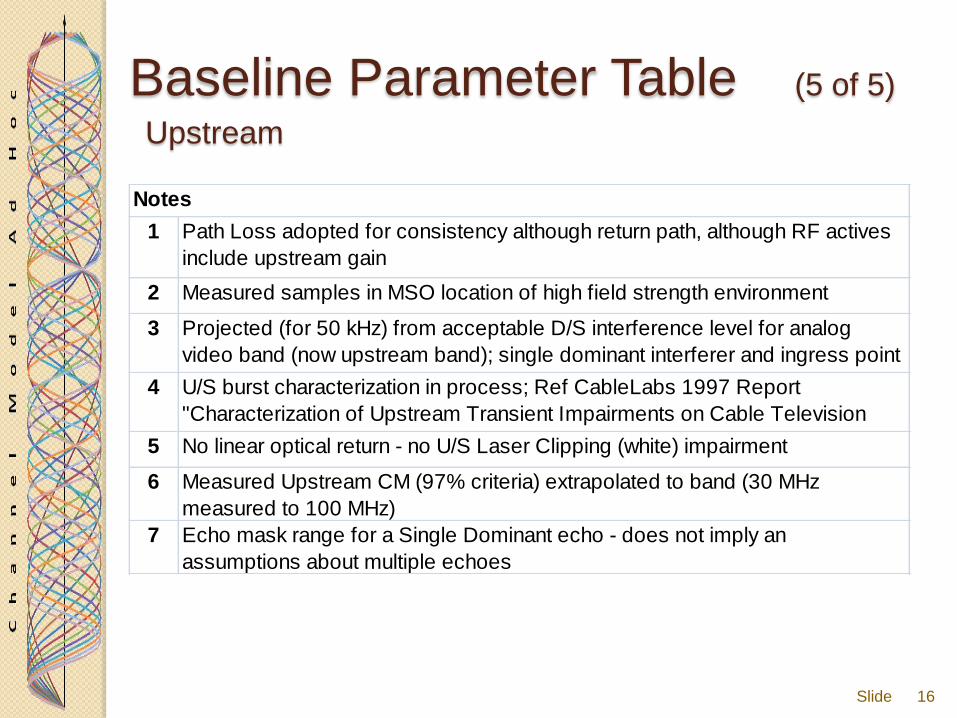
Baseline Parameter Table (5 of 5)
Upstream
Slide
Notes
1 Path Loss adopted for consistency although return path, although RF actives
include upstream gain
2 Measured samples in MSO location of high field strength environment
3 Projected (for 50 kHz) from acceptable D/S interference level for analog
video band (now upstream band); single dominant interferer and ingress point
4 U/S burst characterization in process; Ref CableLabs 1997 Report
"Characterization of Upstream Transient Impairments on Cable Television
Systems"5 No linear optical return - no U/S Laser Clipping (white) impairment
6 Measured Upstream CM (97% criteria) extrapolated to band (30 MHz
measured to 100 MHz)
7 Echo mask range for a Single Dominant echo - does not imply an
assumptions about multiple echoes
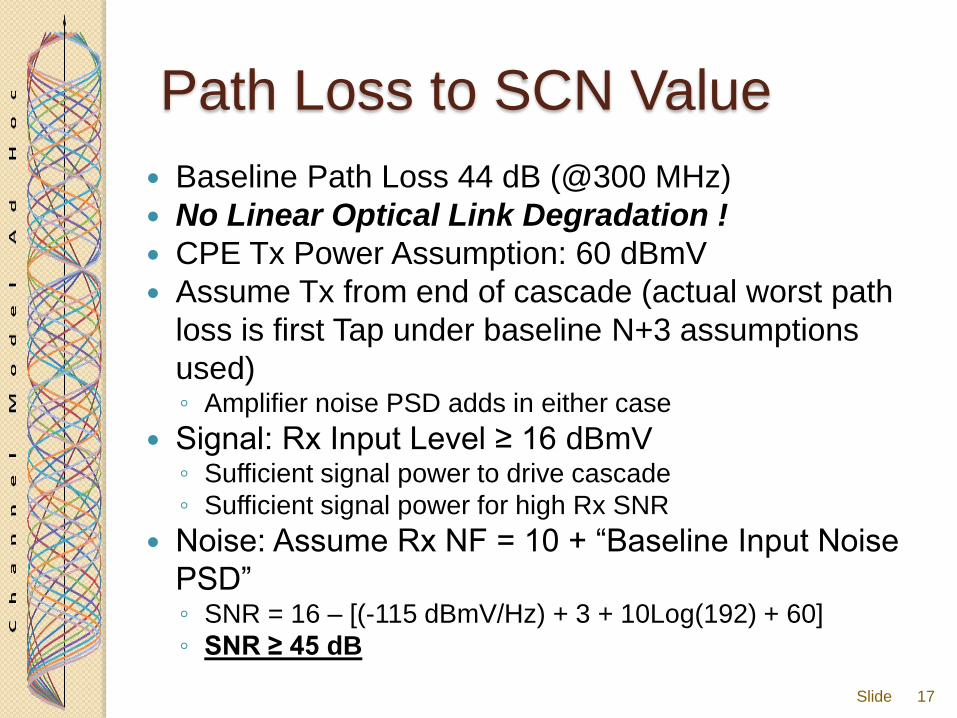
Path Loss to SCN Value
Baseline Path Loss 44 dB (@300 MHz)
No Linear Optical Link Degradation !
CPE Tx Power Assumption: 60 dBmV
Assume Tx from end of cascade (actual worst path
loss is first Tap under baseline N+3 assumptions
used) ◦ Amplifier noise PSD adds in either case
Signal: Rx Input Level ≥ 16 dBmV ◦ Sufficient signal power to drive cascade
◦ Sufficient signal power for high Rx SNR
Noise: Assume Rx NF = 10 + “Baseline Input Noise
PSD” ◦ SNR = 16 – [(-115 dBmV/Hz) + 3 + 10Log(192) + 60]
◦ SNR ≥ 45 dB
17 Slide

Spectrum (MHz) = 192
OFDM OH D/S 7%
OFDM OH U/S 10%
HFC Channel SNR (dB) Nominal = 44 Downstream
45 Upstream
QAM Depth QAM (b/s/Hz) FEC Efficiency Spectral density (b/s/Hz) % Gain vs Legacy Total Mbps
512 QAM OFDM LDPC MoCA 2.0 4k 512 9 84.80% 7.63 7.63 1318.81
SNR = 27 dB Upstream 5.36%
512 QAM OFDM LDPC (16200) 512 9 88.89% 8.00 8 1428.48
SNR = 27 dB Downstream 10.44%
SNR Margin = 17 dB / 18 dB
1024 QAM OFDM LDPC MoCA 2.0 4k 1024 10 84.80% 8.48 8.48 1465.34
SNR = 30 dB Upstream 17.07%
1024 QAM OFDM LDPC (16200) 1024 10 88.89% 8.89 8.89 1587.20
SNR = 30 dB Downstream 22.71%
SNR Margin = 14 dB / 15 dB
2048 QAM OFDM LDPC MoCA 2.0 4k 2048 11 84.80% 9.33 9.33 1611.88
SNR = 33 dB Upstream 28.77%
2048 QAM OFDM LDPC (16200) 2048 11 88.89% 9.78 9.78 1745.92
SNR = 33 dB Downstream 34.98%
SNR Margin = 11 dB / 12 dB
4096 QAM OFDM LDPC MoCA 2.0 4k 4096 12 84.80% 10.18 10.18 1758.41
SNR = 36 dB Upstream 40.48%
4096 QAM OFDM LDPC (16200) 4096 12 88.89% 10.67 10.67 1904.64
SNR = 36 dB Downstream 47.25%
SNR Margin = 8 dB / 9 dB
Capacity Objectives Worksheet
18 Slide
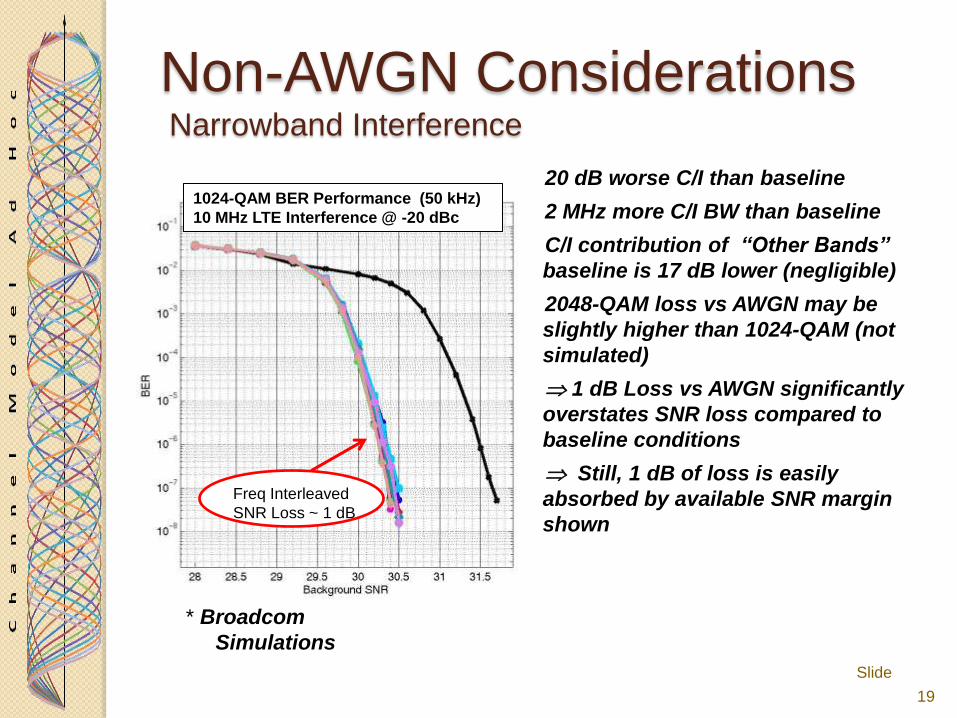
Non-AWGN Considerations
19
* Broadcom
Simulations
20 dB worse C/I than baseline
2 MHz more C/I BW than baseline
C/I contribution of “Other Bands”
baseline is 17 dB lower (negligible)
2048-QAM loss vs AWGN may be
slightly higher than 1024-QAM (not
simulated)
1 dB Loss vs AWGN significantly
overstates SNR loss compared to
baseline conditions
Still, 1 dB of loss is easily
absorbed by available SNR margin
shown
Slide
1024-QAM BER Performance (50 kHz)
10 MHz LTE Interference @ -20 dBc
Freq Interleaved
SNR Loss ~ 1 dB
Narrowband Interference

Non-AWGN Considerations
20
* Intel Simulations
Slide
Erasure SNR Loss ~ 2.5
dB
Wideband Interference
20% shorter erasure period
Weaker code against burst than
anticipated upstream codes and
rates (by approx 1 dB)
4096-QAM loss vs AWGN slightly
worse than 1024-QAM or 2048-QAM
2.5 dB Loss vs AWGN overstates
SNR loss compared to baseline
conditions
Still, 2.5 dB of loss is easily
absorbed by available SNR margin
shown
In addition, under simultaneous
burst and interference conditions
resulting in 3.5 dB loss to SNR,
margin is sufficient.
SNR penalty may result in fidelity
constraints and decreased allowable
implementation losses
THANK YOU
21 Slide

Straw Poll #
Straw Poll text.
Yes ____
No ____
Other ____
22 Slide
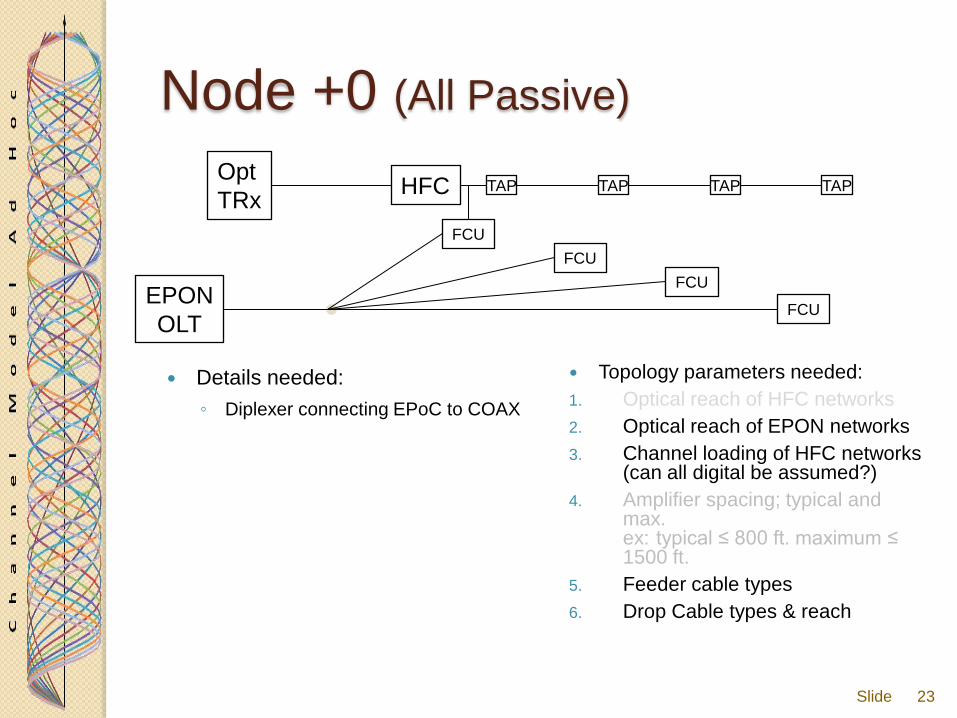
Node +0 (All Passive)
Topology parameters needed:
1. Optical reach of HFC networks
2. Optical reach of EPON networks
3. Channel loading of HFC networks (can all digital be assumed?)
4. Amplifier spacing; typical and max. ex: typical ≤ 800 ft. maximum ≤ 1500 ft.
5. Feeder cable types
6. Drop Cable types & reach
23
EPON
OLT
FCU
Details needed:
◦ Diplexer connecting EPoC to COAX
FCU
TAP HFC Opt
TRx TAP TAP
FCU
FCU
TAP
Slide
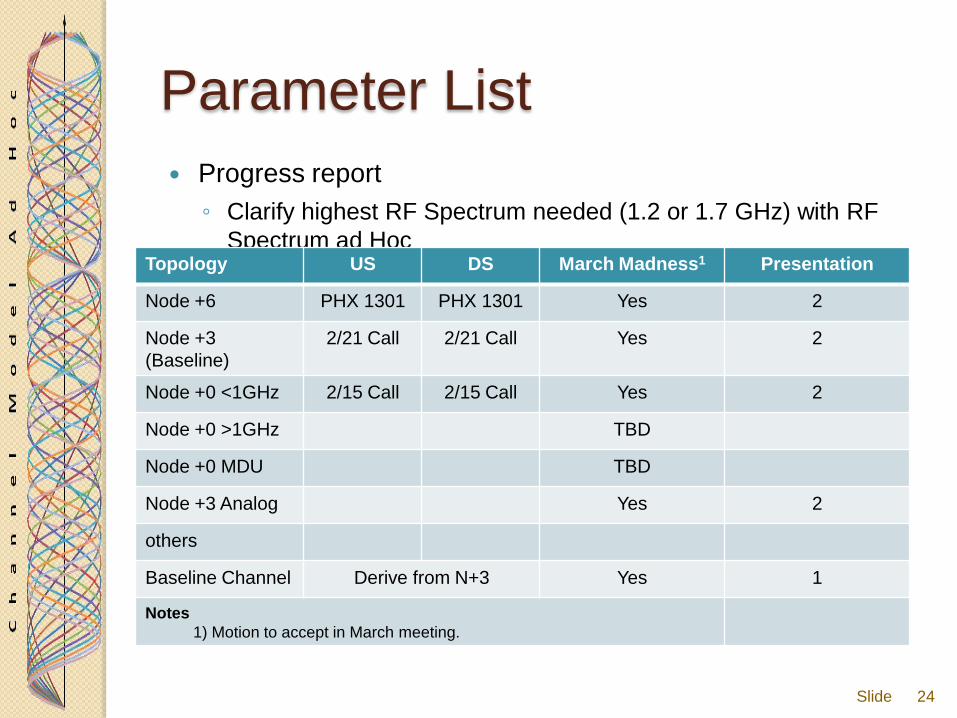
Parameter List
Progress report
◦ Clarify highest RF Spectrum needed (1.2 or 1.7 GHz) with RF
Spectrum ad Hoc
24
Topology US DS March Madness1 Presentation
Node +6 PHX 1301 PHX 1301 Yes 2
Node +3
(Baseline)
2/21 Call 2/21 Call Yes 2
Node +0 <1GHz 2/15 Call 2/15 Call Yes 2
Node +0 >1GHz TBD
Node +0 MDU TBD
Node +3 Analog Yes 2
others
Baseline Channel Derive from N+3 Yes 1
Notes
1) Motion to accept in March meeting.
Slide
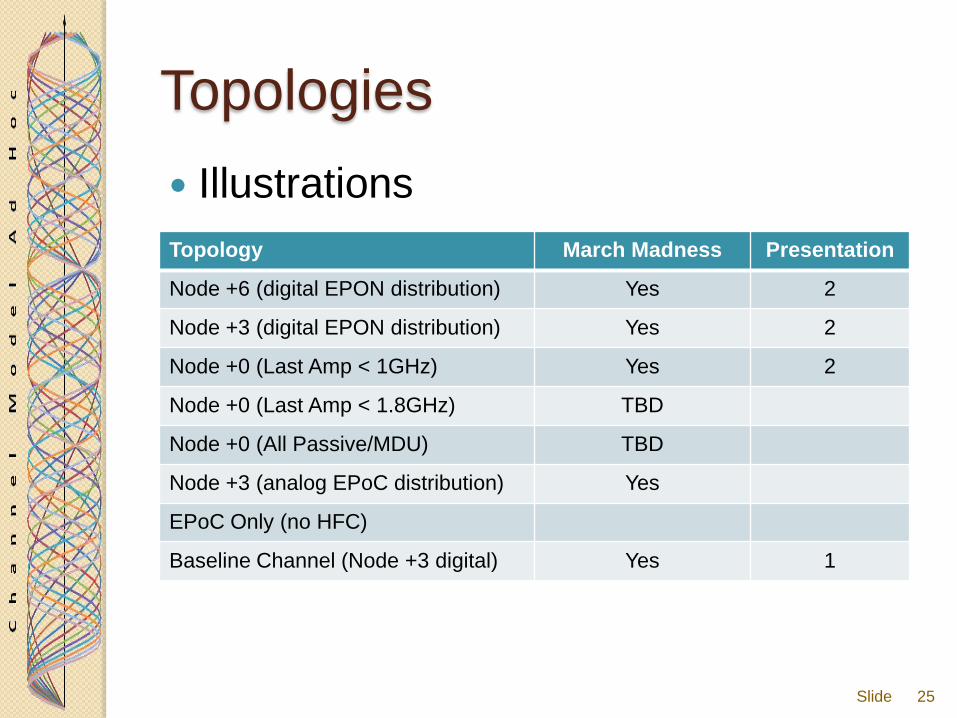
Topologies
Illustrations
25
Topology March Madness Presentation
Node +6 (digital EPON distribution) Yes 2
Node +3 (digital EPON distribution) Yes 2
Node +0 (Last Amp < 1GHz) Yes 2
Node +0 (Last Amp < 1.8GHz) TBD
Node +0 (All Passive/MDU) TBD
Node +3 (analog EPoC distribution) Yes
EPoC Only (no HFC)
Baseline Channel (Node +3 digital) Yes 1
Slide
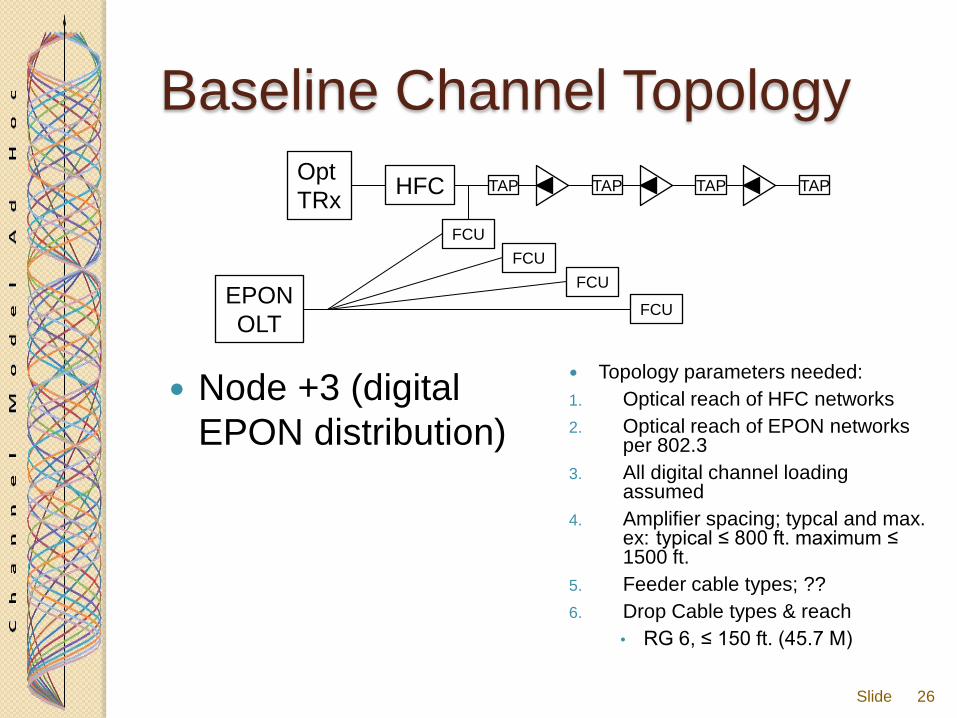
Baseline Channel Topology
Node +3 (digital
EPON distribution)
26
Topology parameters needed:
1. Optical reach of HFC networks
2. Optical reach of EPON networks per 802.3
3. All digital channel loading assumed
4. Amplifier spacing; typcal and max. ex: typical ≤ 800 ft. maximum ≤ 1500 ft.
5. Feeder cable types; ??
6. Drop Cable types & reach
• RG 6, ≤ 150 ft. (45.7 M)
EPON
OLT
FCU
FCU
HFC Opt
TRx TAP TAP
FCU
FCU
TAP TAP
Slide
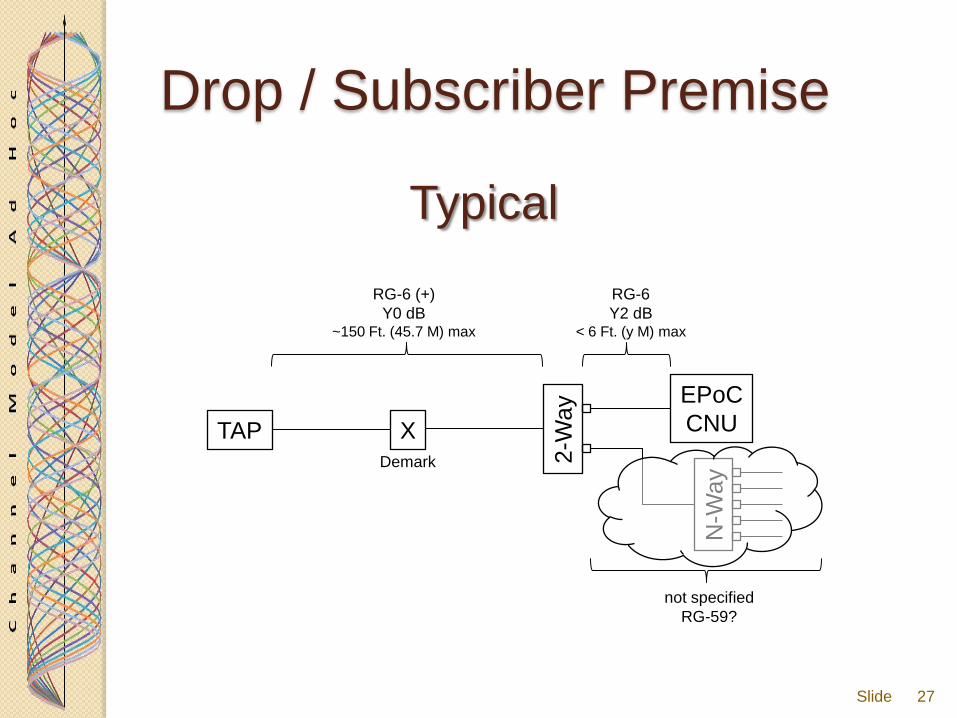
Drop / Subscriber Premise
27
TAP
2-W
ay
N-W
ay
EPoC
CNU
RG-6 (+)
Y0 dB ~150 Ft. (45.7 M) max
RG-6
Y2 dB < 6 Ft. (y M) max
not specified
RG-59?
X
Demark
Typical
Slide