ieee transactions on circuits and systems—i: … · 2018-01-04 · nals circumvents...
TRANSCRIPT
IEEE TRANSACTIONS ON CIRCUITS AND SYSTEMS—I: REGULAR PAPERS, VOL. 61, NO. 4, APRIL 2014 1105
A 0.6–107 µW Energy-Scalable Processor forDirectly Analyzing Compressively-Sensed EEG
Mohammed Shoaib, Member, IEEE, Kyong Ho Lee, Student Member, IEEE, Niraj K. Jha, Fellow, IEEE, andNaveen Verma, Member, IEEE
Abstract—Compressive sensing has been used to overcome com-munication constraints (energy and bandwidth) in low-power sen-sors. In this work, we present a seizure-detection processor thatdirectly uses compressively-sensed electroencephalograms (EEGs)for embedded signal analysis. In addition to addressing communi-cation, this has two advantages for local computation. First, withcompressive sensing, reconstruction costs are typically severe, pre-cluding embedded analysis; directly analyzing the compressed sig-nals circumvents reconstruction costs, enabling embedded anal-ysis within applications. Second, compared toNyquist-sampled sig-nals, the use of compressed representations reduces the compu-tational energy of signal analysis due to the reduced number ofsignal samples. We describe an algorithmic formulation as wellas a hardware architecture that enables two strong power-man-agement knobs, wherein application-level performance can scalewith computational energy. The two knobs are parameterized asfollows: 1) ξ, which quantifies the amount of data compression,and 2) ν, which determines the approximation error within theproposed compressed-domain processing algorithm. For ξ and νin the range 2-24×, the energy to extract signal features (over 18channels) is 70.8-1.3 nJ, and the detector’s performance for sensi-tivity, latency, and specificity is 96-91%, 4.7-5.3 sec., and 0.17-0.30false-alarms/hr., respectively (compared to a baseline performanceof 96%, 4.6 sec., and 0.15 false-alarms/hr.).
Index Terms—Circuits, compressive sensing, energy efficiency,machine learning, seizure detection, signal processing.
I. INTRODUCTION
C OMPRESSIVE sensing is a potentially compelling tech-nique to reduce data in sensing systems. It is based on
the principles of sparsity. It states that if an -sample signalis sparse in a secondary basis , we can use anprojection matrix , which is required to be incoherent withto create an -sample signal [1], [2], where repre-sents the achieved compression factor. For most signals that aresparse in some basis , a whose elements are set to 1 ran-domly with a uniform probability satisfies the incoherence prop-erty with high probability [2]. Such a choice for has the ben-
Manuscript received April 25, 2013; revised July 01, 2013 and August 20,2013; accepted September 07, 2013. Date of publication January 02, 2014; dateof current version March 25, 2014. This work was supported in part by the Na-tional Science Foundation Grant No. CCF-1253670, Harold W. Dodds Hon-orific Fellowship from Princeton University, and Systems on Nanoscale Infor-mation fabriCs (SONIC), one of the six SRC STARnet Centers, sponsored byMARCO and DARPA. IC fabrication was provided by MOSIS. This paper wasrecommended by Associate Editor C.-T. Chiu.The authors are with the Department of Electrical Engineering, Princeton
University, Princeton, NJ 08544 USA (e-mail: [email protected]).Color versions of one or more of the figures in this paper are available online
at http://ieeexplore.ieee.org.Digital Object Identifier 10.1109/TCSI.2013.2285912
efit of enabling low-energy compression, applicable to a broadrange of signals; this has recently been exploited in biomedicalsensors [3], [4].The typical way in which compressive sensing has been used
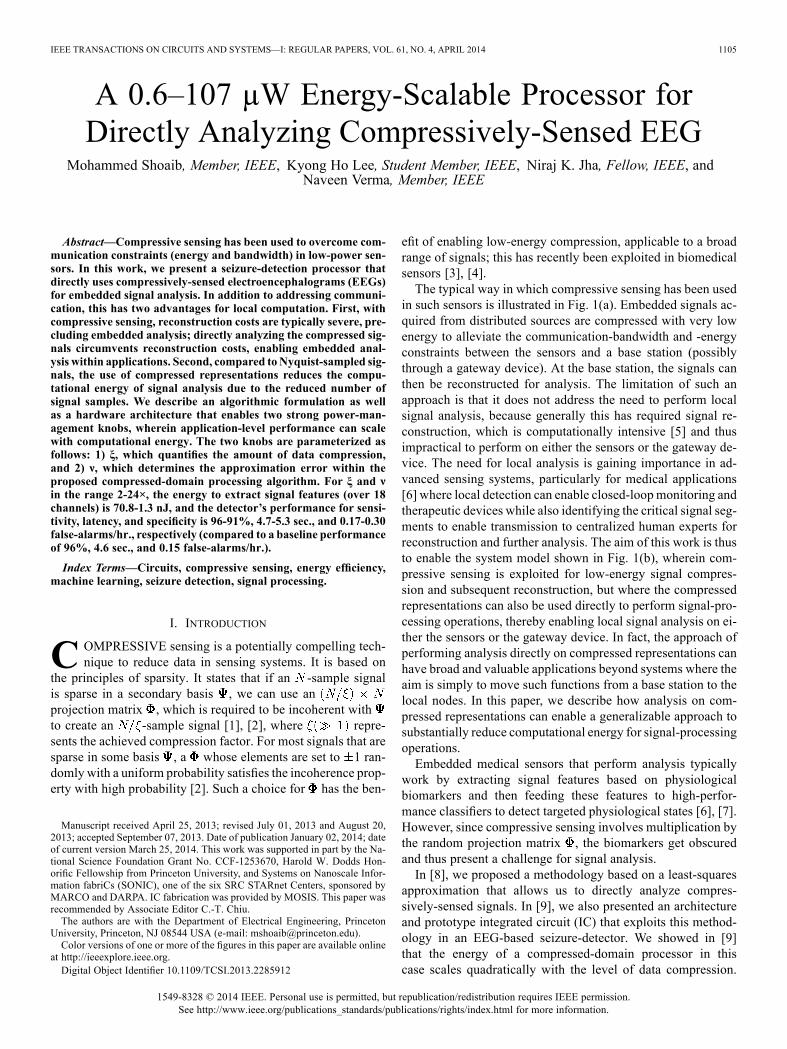
in such sensors is illustrated in Fig. 1(a). Embedded signals ac-quired from distributed sources are compressed with very lowenergy to alleviate the communication-bandwidth and -energyconstraints between the sensors and a base station (possiblythrough a gateway device). At the base station, the signals canthen be reconstructed for analysis. The limitation of such anapproach is that it does not address the need to perform localsignal analysis, because generally this has required signal re-construction, which is computationally intensive [5] and thusimpractical to perform on either the sensors or the gateway de-vice. The need for local analysis is gaining importance in ad-vanced sensing systems, particularly for medical applications[6] where local detection can enable closed-loopmonitoring andtherapeutic devices while also identifying the critical signal seg-ments to enable transmission to centralized human experts forreconstruction and further analysis. The aim of this work is thusto enable the system model shown in Fig. 1(b), wherein com-pressive sensing is exploited for low-energy signal compres-sion and subsequent reconstruction, but where the compressedrepresentations can also be used directly to perform signal-pro-cessing operations, thereby enabling local signal analysis on ei-ther the sensors or the gateway device. In fact, the approach ofperforming analysis directly on compressed representations canhave broad and valuable applications beyond systems where theaim is simply to move such functions from a base station to thelocal nodes. In this paper, we describe how analysis on com-pressed representations can enable a generalizable approach tosubstantially reduce computational energy for signal-processingoperations.Embedded medical sensors that perform analysis typically
work by extracting signal features based on physiologicalbiomarkers and then feeding these features to high-perfor-mance classifiers to detect targeted physiological states [6], [7].However, since compressive sensing involves multiplication bythe random projection matrix , the biomarkers get obscuredand thus present a challenge for signal analysis.In [8], we proposed a methodology based on a least-squares
approximation that allows us to directly analyze compres-sively-sensed signals. In [9], we also presented an architectureand prototype integrated circuit (IC) that exploits this method-ology in an EEG-based seizure-detector. We showed in [9]that the energy of a compressed-domain processor in thiscase scales quadratically with the level of data compression.
1549-8328 © 2014 IEEE. Personal use is permitted, but republication/redistribution requires IEEE permission.See http://www.ieee.org/publications_standards/publications/rights/index.html for more information.
1106 IEEE TRANSACTIONS ON CIRCUITS AND SYSTEMS—I: REGULAR PAPERS, VOL. 61, NO. 4, APRIL 2014
Fig. 1. Proposal to directly analyze compressively-sensed data: (a) previous approaches, (b) proposed approach.
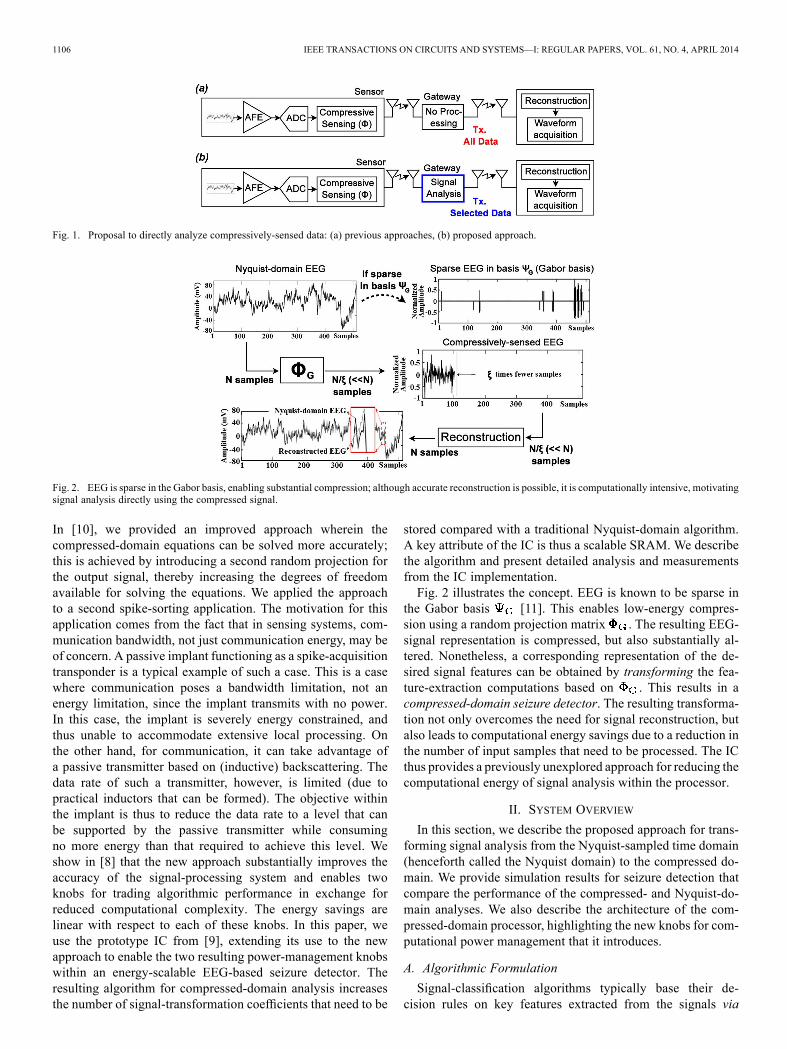
Fig. 2. EEG is sparse in the Gabor basis, enabling substantial compression; although accurate reconstruction is possible, it is computationally intensive, motivatingsignal analysis directly using the compressed signal.
In [10], we provided an improved approach wherein thecompressed-domain equations can be solved more accurately;this is achieved by introducing a second random projection forthe output signal, thereby increasing the degrees of freedomavailable for solving the equations. We applied the approachto a second spike-sorting application. The motivation for thisapplication comes from the fact that in sensing systems, com-munication bandwidth, not just communication energy, may beof concern. A passive implant functioning as a spike-acquisitiontransponder is a typical example of such a case. This is a casewhere communication poses a bandwidth limitation, not anenergy limitation, since the implant transmits with no power.In this case, the implant is severely energy constrained, andthus unable to accommodate extensive local processing. Onthe other hand, for communication, it can take advantage ofa passive transmitter based on (inductive) backscattering. Thedata rate of such a transmitter, however, is limited (due topractical inductors that can be formed). The objective withinthe implant is thus to reduce the data rate to a level that canbe supported by the passive transmitter while consumingno more energy than that required to achieve this level. Weshow in [8] that the new approach substantially improves theaccuracy of the signal-processing system and enables twoknobs for trading algorithmic performance in exchange forreduced computational complexity. The energy savings arelinear with respect to each of these knobs. In this paper, weuse the prototype IC from [9], extending its use to the newapproach to enable the two resulting power-management knobswithin an energy-scalable EEG-based seizure detector. Theresulting algorithm for compressed-domain analysis increasesthe number of signal-transformation coefficients that need to be
stored compared with a traditional Nyquist-domain algorithm.A key attribute of the IC is thus a scalable SRAM. We describethe algorithm and present detailed analysis and measurementsfrom the IC implementation.Fig. 2 illustrates the concept. EEG is known to be sparse in
the Gabor basis [11]. This enables low-energy compres-sion using a random projection matrix . The resulting EEG-signal representation is compressed, but also substantially al-tered. Nonetheless, a corresponding representation of the de-sired signal features can be obtained by transforming the fea-ture-extraction computations based on . This results in acompressed-domain seizure detector. The resulting transforma-tion not only overcomes the need for signal reconstruction, butalso leads to computational energy savings due to a reduction inthe number of input samples that need to be processed. The ICthus provides a previously unexplored approach for reducing thecomputational energy of signal analysis within the processor.
II. SYSTEM OVERVIEW
In this section, we describe the proposed approach for trans-forming signal analysis from the Nyquist-sampled time domain(henceforth called the Nyquist domain) to the compressed do-main. We provide simulation results for seizure detection thatcompare the performance of the compressed- and Nyquist-do-main analyses. We also describe the architecture of the com-pressed-domain processor, highlighting the new knobs for com-putational power management that it introduces.
A. Algorithmic Formulation
Signal-classification algorithms typically base their de-cision rules on key features extracted from the signals via

SHOAIB et al.: A 0.6–107 W ENERGY-SCALABLE PROCESSOR FOR DIRECTLY ANALYZING COMPRESSIVELY-SENSED EEG 1107
Fig. 3. Transforming any linear signal-processing function, which can be represented as a matrix , into an equivalent operator in the compressed domain.This needs a solution for a projection of , which preserves the inner product of vectors.
signal-processing functions; this is particularly true for medicaldetectors, where the features often correspond to physiologicalbiomarkers. These algorithms then use a classifier to performmodeling and inference over the extracted features. Powerfulclassification frameworks exist in the domain of machinelearning that can construct high-order and flexible modelsthrough data-driven training. In many such frameworks, theclassification step utilizes a distance metric (e.g., 2-norm orinner product) between feature vectors (FVs) [12]. In certaincases, the distance metric may also be invoked within thefeature extraction step, for instance, to extract spectral energies,which form generic biomarkers for neural field potentials(e.g., brain-machine interfaces [6], sleep disorders [13], etc.).In this paper, we demonstrate our results for the latter caseusing a seizure-detection application, where clinical studieshave shown that EEG spectral energy [derived using the innerproduct between FVs after linear finite impulse response (FIR)filtering] can serve as a biomarker that indicates the onset of aseizure [14].Connecting the above concepts with the multi-channel
system shown in Fig. 3, in the Nyquist domain [Fig. 3(a)], an-dimensional signal from each data channel is multiplied
with an matrix operator to achieve arbitrary linearsignal-processing functions in order to derive an FV (e.g.,could be a Toeplitz matrix to implement convolution). The
inner product between FVs can then be used to derive thespectral-energy features from each data channel [as shown inFig. 3(a), spectral-energy features can be denoted by the innerproduct ]. Extending this to an analysis in the compresseddomain [Fig. 3(b)], we now aim to process compressed rep-resentations of the input signal, namely , whererepresents the random-projection matrix used forcompressive sensing. We thus seek to find a matrix transfor-mation that leads to a representation of a signal which hasbeen suitably processed as intended, but which is derived bydirectly using . In this case, we also show that any othercombination cannot perform better than the combinationobtained from the presented solution (for all choices of ).In the proposed approach, we aim to derive compressed-
domain FVs that are projections of the originally intendedNyquist-domain FVs . With this approach, the chosen pro-jection needs to preserve the inner product between the FVs,since the inner product is what is used by the classifier (eitherimplicitly or for spectral-energy feature extraction). In [8] and[9], we showed that such a projection can be the
Fig. 4. IPE is lower when we use an exact solution for . The low IPE valueremains consistent for different choices of and .
compressive sensing matrix itself (i.e., can be equal to). However, since is a non-square matrix of dimension-
ality (determined by the compression factor), thisapproach allowed us to derive, at best, only a least-squaressolution for . Next, we showed how an auxiliarymatrix can be applied to , where represents the projectionfactor, can be used instead of to introduce additional degreesof freedom that allow us to solve for exactly [10]. Addition-ally, by scaling to larger values, this approach also permittedus to obtain approximate solutions to of smaller size. Theresulting solution reduced the number of operations required inthe processor and thus enabled an additional knob to scale theenergy of compressed-domain analysis based on the requiredaccuracy. Below, we summarize our approach of derivingusing .Since , the inner product between any two FVs
and in the compressed domain is given by:
(1)
The right hand side will be equal to the inner productin the Nyquist domain if is equal to the identitymatrix . Thus, to simultaneously solve for and , we haveto solve the following constrained optimization problem:
(2)
1) Exact Solution for (for Highest Accuracy): Assumingis a square matrix, we can obtain the singular value decom-
position (SVD) of as , where and are or-thogonal matrices (i.e., ) and is an

1108 IEEE TRANSACTIONS ON CIRCUITS AND SYSTEMS—I: REGULAR PAPERS, VOL. 61, NO. 4, APRIL 2014
Fig. 5. The seizure detection algorithm involves feature extraction and classification using an SVM. In the compressed domain, the Nyquist-domain BPFs aretransformed to the compressed-domain BPFs (CD-BPFs) .
diagonal matrix formed by the singular valuesof . We thus have the following relationship for :
(3)The distance from the above matrix to the identity will be atleast the rank deficiency of [15]. The lower bound in (2) willthus be achieved if we set ,
(4)
Note that, in this case, the dimensionality of the compressed-domain processing matrix is and is control-lable only through one knob: the amount of data compression(i.e., ).2) Approximate Solution for (for Energy Savings): In
order to solve (2) approximately, we invoke the Johnson-Lin-denstrauss (JL) Lemma [16], which states that wheneach row of is drawn from the normal distribution .Also, the error in the above approximation increases when wehave fewer rows in . Since and are constants in (2),to derive rows of from , we can draw each row offrom [10]. This provides an approximate
solution for in (2). The approximate solution is applicablein the following two cases: (1) when has fewer rows thancolumns (i.e., when ) or (2) when has more rowsthan columns (i.e., when ). As compared to the exactsolution , the former case results in a smaller-sizedand thus potentially lower energy for signal processing. Thelatter case, however, results in a , which is bigger in sizethan the obtained from the exact solution. Thus, the designspace of results in a higher computational complexityand reduced accuracy, compared to the exact solution. It is thusnot a very useful design space for low-energy operation. Weblock out this regime in all subsequent figures that show theperformance/energy of the approximate solution.Note that when we use the approximate solution, the dimen-
sionality of is and is controllable through twoindependent knobs: (1) the amount of data compression (i.e.,) and (2) the required accuracy (i.e., ) for solving the com-pressed-domain system of equations [(2)]. As an aside, we alsonote that given and , we can constrain the sparsity of
within the optimization setup [(2)] to derive an approximate so-lution for . This is an interesting direction for future work.In deriving and , our aim is to preserve the inner product
between the processed FVs in the compressed domain. To illus-trate the benefit of the proposed transformations, we evaluatethe inner-product error (IPE) in the compressed domain, whichis defined as . We use a set of 100 EEGvectors, each comprising samples and representedby vector . To illustrate the benefit of our approach, we con-sider three different Nyquist-domain matrices, , representingvarious signal processing functions: (1) a 64-order band-passfilter (BPF), (2) a discrete wavelet transform (DWT), and (3) arandom transfer function obtained by using coefficients fordrawn from . Further, we fix and computeafter processing the compressed representation with a ma-trix , derived using (1) the exact solution presented aboveand (2) an matrix whose entries are derived from
. Fig. 4 shows the results generated fromMATLAB. Weobserve that the IPE is substantially lowerwhenwe use an ob-tained from the proposed transformation. In fact, using the exactsolution, the IPE remains below 6% even for different choicesof . The key question, however, is howmuch IPE is acceptablefor retaining the classifier performance. To provide a quantita-tive answer, we next study an application for epileptic seizuredetection and provide an analysis based both on the end-to-endperformance and the mutual information of the derived FVswith respect to the true class labels.
B. Compressed-domain Seizure Detection
We apply the above methodology to a seizure detectionalgorithm. Fig. 5(a) shows a block diagram of the baselineNyquist-domain detector [14]. A two-second epoch of eachEEG channel is processed using eight BPFs with passbands of0-3 Hz, 3-6 Hz, , 21-24 Hz. The energy from each filter isthen represented by the inner product of the output samples toform an FV, which is then used for classification by a supportvector machine (SVM) classifier. The baseline detector is vali-dated on 558 hours of EEG data in the CHB-MIT database [17].The Nyquist-domain detector has been demonstrated to achievean average latency, sensitivity, and specificity of 4.49 sec.,96.03%, and 0.1471 false alarms per hour, respectively [14].

SHOAIB et al.: A 0.6–107 W ENERGY-SCALABLE PROCESSOR FOR DIRECTLY ANALYZING COMPRESSIVELY-SENSED EEG 1109
Fig. 6. IPE in (a) the exact solution is below 15% (out to compression factors of 24 ) and (b) begins to degrade in the approximate solution with increasing valuesof . The exact solution is also shown in (b) with dark boxes. The cases of , which are not favorable for low-energy operation, are blocked out. showsthe separation between adjacent contours.
Fig. 7. Performance of the compressed-domain seizure detection algorithm using the exact solution (shown over 558 hrs. of EEG data from 21 patients) is main-tained up to large .
Fig. 8. Detector performance for the approximate solution measured by (a) sensitivity, (b) false alarms/hr., and (c) latency. The performance begins to degradegradually due to the JL-approximation at higher values of .
To enable a transformation for the compressed domain, theth BPF for the th EEG channel can be formulated as matrixmultiplication, namely of an input signal by a matrix tocompute the filtered signal . This formulation can lead tothe compressed-domain system shown in Fig. 5(b), which isbased on compressed-domain band-pass filters (CD-BPFs). Inthis system, we derive the corresponding matrix using (1)an exact solution and (2) an approximate solution, as describedin the previous section.Fig. 6 shows the IPE in the FVs using the two approaches.
For the results of the approximate solution, is the distancebetween adjacent contours with units shown above the figure.Using the exact solution, the IPE is below 15% even at24 . Further, Figs. 7 and 8 show the simulated performance ofthe two approaches, respectively. Fig. 7 shows that despite anon-zero IPE value, performance very close to the Nyquist-do-
main seizure detector is retained up to large values of the com-pression factor . For a given amount of data compression (i.e,at fixed ), Fig. 8 shows that using an approximate solution,the performance begins to degrade gradually with increasingvalues of . Although a low IPE helps retain performance, theinformation content [8], based on the mutual information ofthe FVs, provides a more direct relationship to the performancetrend. Fig. 9 shows the mutual information values for the exactand approximate solutions. The information trends indeed cor-relate well with the detector performance. Thus, the proposedtransformations allow us to have a small IPE up to substantialamounts of data compression, thereby preserving the informa-tion content of the FVs for classification. However, as the IPEincreases at higher compression factors, the information degra-dation becomes substantial, affecting the end-to-end detectorperformance.

1110 IEEE TRANSACTIONS ON CIRCUITS AND SYSTEMS—I: REGULAR PAPERS, VOL. 61, NO. 4, APRIL 2014
Fig. 9. Mutual information in (a) the exact solution and (b) the approximate solution follows the performance trends shown in Figs. 7 and 8, respectively.
Fig. 10. CD-BPF matrices , derived using and , disrupt the regularity and zeros in . The complexity of the CD-BPFs scales (a) quadratically withfor the exact solution and (b) linearly with and for the approximate solution.
Note that, through the results presented in this section, weaim to show general trends; showing precise correspondencebetween performance, IPE, and information metrics is not ourintention. Based on the analysis presented in this section, weconclude that and provide us with two knobs to controlthe end-to-end performance of the compressed-domain detector.Next, we study the impact of these two knobs on the size ofthe compressed-domain processing matrices and thus on theprocessor implementation and energy.
C. Processor Architecture With Power Management
We exploit the scalability of and as knobs for systempower management. An important consequence of the algo-rithmic construction proposed is that the CD-BPF matrices(which are of dimensionality for the exactsolution and for the approximate solution)do not retain the regularity of . Even though are ofdimensionality , as shown in Fig. 10, the rows of aresimply selected to implement convolution, and thus are shiftedversions of the impulse response of the same FIR filter. As aresult, very few unique filter coefficients are required, and manyof the coefficients are zero, as determined by the FIR-filterorder . However, in deriving , the shifted impulse responsesand zero entries are disrupted. As shown in Fig. 10, the numberof multiplications required thus no longer depends on the filterorder, but rather (1) quadratically on the compression factorfor the exact solution and (2) linearly on both and for the
approximate solution. This scaling can potentially reduce thenumber of multiplications required.To exploit this attribute, we propose the energy-scalable
processor architecture whose block diagram is shown inFig. 11. The processor consists of two computational stages:compressed-domain feature extraction followed by SVM clas-sification. The compressed-domain feature extractor (CD-FE)includes a CD-BPF and energy-accumulator block. The co-efficients for the CD-BPF are pulled from a scalable SRAMbank. Due to the disruption in regularity, the matrices needa larger number of distinct coefficients to be stored, potentiallyincreasing the memory requirements. Scalability in the SRAMbank is thus an important aspect of power management. Weachieve this through the use of multiple subarrays, whichenable fine-grained power-gating as well as reduced bit-lineand word-line access energy. The total bank size in our imple-mentation is 32 kB, which is partitioned into four subarrays.An SVM classifier (which comprises an inner-product corefollowed by a kernel transform) is also integrated to performreal-time seizure detection using the derived FVs. Compres-sively-sensed EEG signals are input directly to the processorfor seizure detection. However, for the case of Nyquist inputs,a compressive-projection front-end (CPF) is also included toexplicitly multiply inputs by a random projection matrix ;thus the energy savings derived from a reduced number ofsamples can be exploited even if the original input signal is notcompressively sensed.

SHOAIB et al.: A 0.6–107 W ENERGY-SCALABLE PROCESSOR FOR DIRECTLY ANALYZING COMPRESSIVELY-SENSED EEG 1111
Fig. 11. Architecture block diagram of energy-scalable, compressed-domain seizure detector.
Fig. 12. Circuits used in the compressed-domain processor for seizure detection. Figure adapted from [9].
Fig. 13. (a) SRAM access energy (from NanoSim [18] at 0.7 V) is lower for smaller-sized arrays and (b) summary of energy components contributing to totalSRAM energy (the , case is shown for illustration).
III. LOW-ENERGY COMPRESSED-DOMAIN PROCESSOR
In this section, we describe the circuits used in the com-pressed-domain processor. We also present an analysis ofSRAM energy, which will help us understand the impact ofenergy scalability in the processor with respect to and .
A. Circuits
Fig. 12 shows the circuits used in the compressed-domainprocessor. The CPF is selectable for front-end signal com-pression. It uses a 16 b linear feedback shift register (LFSR)to implement multiplication with a random projection matrix, as shown. Since the processor operates on an EEG epochof 2 seconds, FVs are derived at the rate of 0.5 Hz. At thislow rate, the CD-FE can compute each feature dimensionsequentially and store the intermediate results in a data buffer.The CD-FE can be configured to compute up to eight spectralfeatures for each EEG channel over asmany as 18 channels, yielding a maximum FV dimension-ality of 144. Within the CD-FE, the control pulse initiatesCD-BPF computations. A multiply-accumulate (MAC) unit(M0) is used to perform the matrix multiplications required for
compressed-domain band-pass filtering using . Each filteredEEG epoch is then registered by the control pulse . Energyaccumulation over the output vector is then performed by asecond MAC unit (M1). After the feature-extraction process[which requires MAC operations], each FVdimension is stored in an intermediate FV buffer basedon the control pulse .
B. SRAM Energy Analysis
In our implementation, we represent filter coefficients using8 bits of precision. Thus, to support CD-FE computations, theprocessor requires a maximum of 32 kB accesses per secondfrom the memory bank. Fig. 13(a) shows that the SRAM en-ergy per access is reduced by choosing smaller-sizedsubarrays [19]. Since the and knobs scale the memory re-quired, designing a single 32 kB array would be sub-optimalfor many of the parameter points. Instead, we design four subar-rays (each of size 8 kB) to balance savings in energy per accesswith the overhead of further partitioning. With sub-array par-titioning, leakage-energy saving can be achieved by indepen-dently power-gating each sub-array (from off-chip).

1112 IEEE TRANSACTIONS ON CIRCUITS AND SYSTEMS—I: REGULAR PAPERS, VOL. 61, NO. 4, APRIL 2014
After the CD-FE computations, each FV is processed by theSVM block within the epoch duration of two seconds. The SVMcan apply linear, polynomial, or radial-basis function (RBF)kernel transformations (via an embedded CORDIC engine). Thesupport vectors are derived from offline training of the classifierand are provided through a dedicated interface. The classifica-tion result is encoded in the most significant bit (MSB) of theSVM output (MSB for seizure detected, MSB for noseizure detected).The CD-FE energy comprises the logic and SRAM energy
subcomponents. The SRAM consumes a substantial portion ofthe total CD-FE energy. Its optimization to exploit scalabilitywith respect to and is thus a key factor. The detector pro-cesses an EEG epoch every 2 sec. However, theoptimal operating frequency (and supply voltage ) for theCD-FE logic is determined by minimizing the overall CD-FEenergy, while ensuring a minimum throughput that allows theactive CD-FE computations to be completed in ( 2)seconds for each value of and . For the remainder of the epoch(i.e., ), the logic and SRAMs can be placedin low-energy idle modes.Fig. 13(b) summarizes the SRAM operating modes and en-
ergies [19]. The total SRAM energy is the sum of the active-mode and idle-mode energies for eachsubarray (numbering ) that is enabled; under the assump-tion that the SRAMs cannot by fully power-gated in order to en-sure data retention, is not zero. During the active mode,the SRAM operates at the minimum operational supply voltage
of 0.7 V for reads and writes; at this voltage, it op-erates at 920 kHz; this is sufficient performance for all designpoints of the CD-FE, thus allowing the SRAM voltage toremain at 0.7 V. During the idle mode, the SRAM operates atits minimum data-retention voltage of 0.42 V.In the active mode, while set to a supply voltage of
, comprises active-switchingand leakage energies for a period of . In theidle mode, while set to a supply voltage of ,comprises only the leakage energy for the duration
. Thus, we can represent the SRAMenergy components as follows:
(5)
(6)
The duration of the active mode in (5) depends on, and the optimum logic voltage . For smaller (larger)
values of and , there are more (fewer) coefficients inand (the active CD-FE time) is higher (lower). Forinstance, is 0.26 sec. for and , asshown in Fig. 13(b). It increases to 0.52 sec. atand reduces to 0.13 sec. at and . Further, thenumber of active subarrays is also a function of and; Fig. 14 shows this dependence. Eqs. (5) and (6) also showthat although remains invariant to changing values of
Fig. 14. scales substantially with and , affecting the SRAM leakageenergy.
Fig. 15. Die photo of IC.
, it is impacted by and (since #accesses changes withand ). Note that in (6), denotes the active-switching
energy per access, which remains invariant to changing valuesof , , and . Similar to , the SRAM leakage energy
also scales substantially with and . Consequently,the optimal logic voltage , which minimizes the SRAMand logic CD-FE energy, changes with respect to and . Westudy the variation of in the next section.
IV. MEASUREMENT RESULTS
The IC was prototyped in a 0.13 m CMOS process fromIBM. The die photograph and performance summary are shownin Fig. 15 and Table I, respectively. 18 channels of Nyquist EEGsignals are sampled at a rate of 256 Hz, and eight CD-BPFsare derived corresponding to eight Nyquist-domain BPFs, eachof order 64 (based on the filter specifications required forseizure detection [7]). This leads to a total FV dimensionality of144. Table I shows that the CPF permits EEG compression by afactor of 2-24 , consuming 85-7.3 pJ of energy. In the CPF,a 16-bit LFSR generates a sequence of 1 values. Based onthese values, each compressively-sensed signal sample is com-puted serially as . This process is re-peated times to provide the compressively-sensed signal .The total processor energy is in the range 0.3-2.2 J (for
linear SVMs), 12.6-38.5 J [for nonlinear SVMs using afourth-order polynomial kernel (poly4)], and 18.1-53.3 J(for SVMs with an RBF kernel). Since classification resultsare produced every two seconds (i.e., FVs are processed ata rate of 0.5 Hz), the total processor power lies in the range0.6-107 W for all SVM kernels. Fig. 16 shows a scatter plotof the first two principal components of the measured FVs fromthe IC. The FVs are derived using all data records for patient#1 in the CHB-MIT dataset. We observe from the figure thatthere is a good separation between the seizure and non-seizure

SHOAIB et al.: A 0.6–107 W ENERGY-SCALABLE PROCESSOR FOR DIRECTLY ANALYZING COMPRESSIVELY-SENSED EEG 1113
TABLE IPERFORMANCE SUMMARY: ENERGY-SCALABLE, COMPRESSED-DOMAIN PROCESSOR IC
Fig. 16. Distribution of FVs derived from the IC using data from Patient # 01 in the CHB-MIT database. Although full feature data dimensionality is used forclassification, projection to two dimensions via PCA is shown to aid visualization. Results are shown for (a) Nyquist-domain processing, (b) exact solution at
, and (c) exact solution at .
FVs in the compressed domain even at 21 . The resultspresented next consider the impact of and scaling on thefeature-extractor, classifier, and overall processor energies.
A. Determining the Optimal Voltage for the CD-FE Logic
As described in the previous section, the SRAM leakageenergy changes with both and . Thus, the optimal voltage
for the CD-FE logic changes with both and .In order to determine , we minimize the total CD-FEenergy comprising the logic and SRAM energies.Fig. 17 shows the measured subcomponents of the CD-FE
energy with respect to when ranges from 1 to 4(corresponding to four different values of and ). For allvalues of , the active energy of the CD-FE logicincreases and the leakage energy decreases with in-creasing values of , leading to the minimum-energy point of0.46 V [20]. However, this is not since we need to alsoconsider the SRAM energy. The SRAM operates at 0.7 V in theactive mode. We see from Fig. 17 that the SRAM active-modeswitching energy does not change with [consistentwith (6)]. Further, the leakage energies in the activeand idle modes increase as increases. Thisis also expected since from (5), depends on .However, since both and also depend on
, the increase in the leakage energies is not proportionalto the increase in [(5)]. The total CD-FE energy is thus anonlinear function of and , which necessitates to bedetermined numerically.
Fig. 18 shows the measured CD-FE energy at differentvoltage values for the cases considered in Fig. 17. For thesefour instances, we see from the figure that for the CD-FElogic is either 0.48 V or 0.5 V. The corresponding frequenciesare determined to be 380 or 400 kHz, respectively, from thefrequency vs. plot in Fig. 19. With more measurements,we determine , frequency, and active timefor the CD-FE logic when and vary in the 2-24 range.The results are shown in Figs. 20(a), (b), and (c), respectively.For all values of and , varies in the 0.9-0.02 sec.range and is below the epoch time of 2 sec., which allowssufficient time for the SVM classifier tofinish computing.
B. Feature-extractor Energy
As mentioned previously, the CD-FE energy comprises thelogic and SRAM energies. In this section, we provide measure-ment results for these energy subcomponents using both theexact and approximate solutions for .CD-FE Logic Energy: Recall from Section II-C that for the
exact solution (i.e., when ), the CD-FE complexity scalesquadratically with ; for the approximate solution, it scales lin-early with both and . Figs. 21(a) and (b) show the CD-FE en-ergy for the exact and approximate solutions, respectively. Foreach value of and , the energy is reported for , whichminimizes CD-FE’s active-switching plus leakage energies aswell as the SRAM energy; the values are also annotatedin Fig. 21(a).

1114 IEEE TRANSACTIONS ON CIRCUITS AND SYSTEMS—I: REGULAR PAPERS, VOL. 61, NO. 4, APRIL 2014
Fig. 17. The CD-FE energy subcomponents have nonlinear dependence on and . Primarily, the SRAM leakage energy in the active and idle modeis substantially impacted by and . The active-mode SRAM switching energy changes with and , but not with .
Fig. 18. For the four cases considered in Fig. 17, the optimal voltage for theCD-FE logic is either 0.48 V or 0.5 V.
Fig. 19. The operating frequency vs. for the CD-FE logic.
SRAM Energy: Figs. 22(a) and (b) show the SRAM leakageenergies in the idle and active modes and Fig. 22(c) shows theSRAM switching energy in the active mode, versus and . Wecan see from the figures that for smaller values of and , sincethe size of is larger, is higher and the SRAM activeenergy dominates the idle-mode energy. This is also consistentwith a higher value of at these values of and , whichenables the CD-FE computations to finish sooner. In contrast, atlarger values of and , however, there are fewer coefficients
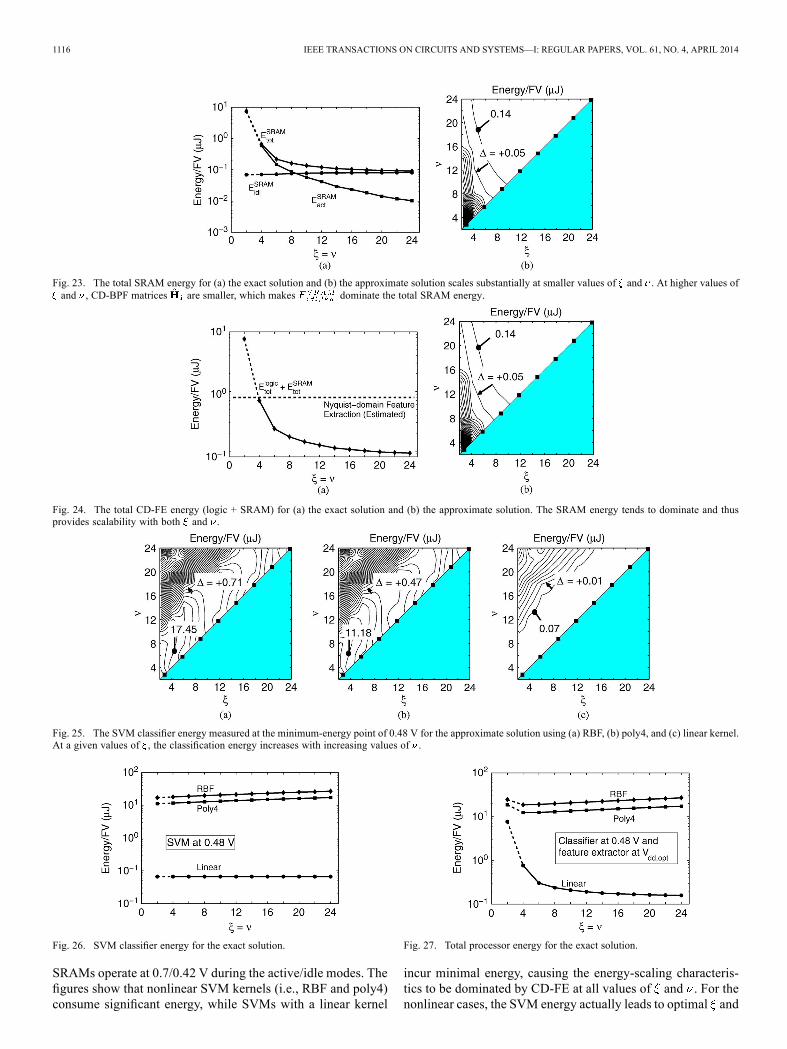
in and the SRAM spends most of the time in the idle mode.This behavior is clear from Figs. 23(a) and (b), which show thetotal SRAMenergy for the exact and approximate solutions. Thefigures show that the total SRAM energy is nearly equal to theSRAM idle-mode energy at higher values of and . Further,the figures also show substantial scaling in the total SRAM en-ergy and in its constituents with respect to and . This scalingoccurs due to the variation in and due to and[see (5) and (6) and Figs. 14 and 20(c)]. The SRAM energy thuseventually begins to saturate due to the granularity limit of thefour subarrays; a finer granularity would enhance scaling at thecost of additional hardware overhead.Total Feature-extraction Energy: From the above results,
we see that the SRAM energy can significantly dominatethe CD-FE logic energy at all values of and . This be-havior validates the focus on optimizing the SRAM energy inSection III-B; for instance, at and , the totalSRAM energy is 2.1 J and the CD-FE logic energy is 70.8 nJ.The contribution of the energy subcomponents is also apparentin the total CD-FE energy plots shown for the exact and ap-proximate solutions shown in Figs. 24(a) and (b), respectively(results are for 18 EEG channels with eight CD-BPFs). Theseplots show that the CD-FE energy profile is similar to theSRAM energy profile presented in the previous section.Comparison With Nyquist-domain Processing: Since are
Toeplitz matrices implementing convolution, the filter order de-termines the number of non-zero coefficients in (see Fig. 10),which in turn determine the feature-extraction energy in theNyquist domain. However, in the compressed domain, due tothe loss of regularity in , the feature-extraction energy doesnot depend on the filter order in the same way. Thus, in thecompressed domain, the energy can initially increase due to lossof regularity in , but then can eventually decrease owing toscaling in the size of due to both and . Further, at agiven value of and , we can scale the total CD-FE energyby the ratio of the number of non-zero coefficients in to the

SHOAIB et al.: A 0.6–107 W ENERGY-SCALABLE PROCESSOR FOR DIRECTLY ANALYZING COMPRESSIVELY-SENSED EEG 1115
Fig. 20. As and scale in the 2-24 range, (a) the optimal voltage for the CD-FE logic varies in the 0.5-0.44 V range, (b) the corresponding operatingfrequency varies in the 400-300 kHz range, and (c) the CD-FE active time varies in the 0.9-0.02 sec. range.
Fig. 21. The CD-FE logic energy for (a) the exact solution and (b) the approximate solution measured at . The energy scales substantially with and .
Fig. 22. Each of the SRAM energy subcomponents, i.e., (a) idle-mode leakage , (b) active-mode leakage , and (c) active-mode switchingscales with both and . tends to dominate at smaller values of and .
number in to derive an estimate for the Nyquist-domain fea-ture-extraction energy. Fig. 24 shows that for the exact solution,at , the total energy of compressed-domain processingis less than that projected for Nyquist-domain processing (for a64-order FIR filter).
C. Classifier Energy
One downside of directly processing compressively-sensedEEG is that the SVM model for classification can becomesomewhat more complex at higher values of and . Intu-itively, this happens due to the additional error introducedin the FVs when we solve the compressed-domain equations[(2)], which necessitates complex decision boundaries in theclassifier. Figs. 25(a), (b), and (c) show the classifier energy forthe approximate solution using three kernels: RBF, 4th-orderpolynomial (poly4), and linear, respectively. Fig. 26 shows the
SVM energy for the exact solution using the same three kernels.In each of these cases, the SVM operates at its minimum-energypoint of 0.48 V. From Fig. 25, we can see that the increasein classifier energy opposes the reduction in CD-FE energy.We can also see that the SVM energy increase becomes worsewhen is significantly higher than , which reflects the extraerror introduced at the algorithmic level due to a degradationin the JL-approximation.
D. Total Processor Energy
Fig. 27 shows the effect of scaling on the total processorenergy for the exact solution. Figs. 28(a), (b), and (c) showthe effect of and scaling on the total processor energy forthe approximate solution using the RBF, poly4, and linear clas-sification kernels, respectively. The SVM operates at 0.48 V,the CD-FE operates at [specified in Fig. 20(a)], and the
1116 IEEE TRANSACTIONS ON CIRCUITS AND SYSTEMS—I: REGULAR PAPERS, VOL. 61, NO. 4, APRIL 2014
Fig. 23. The total SRAM energy for (a) the exact solution and (b) the approximate solution scales substantially at smaller values of and . At higher values ofand , CD-BPF matrices are smaller, which makes dominate the total SRAM energy.
Fig. 24. The total CD-FE energy (logic + SRAM) for (a) the exact solution and (b) the approximate solution. The SRAM energy tends to dominate and thusprovides scalability with both and .
Fig. 25. The SVM classifier energy measured at the minimum-energy point of 0.48 V for the approximate solution using (a) RBF, (b) poly4, and (c) linear kernel.At a given values of , the classification energy increases with increasing values of .
Fig. 26. SVM classifier energy for the exact solution.
SRAMs operate at 0.7/0.42 V during the active/idle modes. Thefigures show that nonlinear SVM kernels (i.e., RBF and poly4)consume significant energy, while SVMs with a linear kernel
Fig. 27. Total processor energy for the exact solution.
incur minimal energy, causing the energy-scaling characteris-tics to be dominated by CD-FE at all values of and . For thenonlinear cases, the SVM energy actually leads to optimal and

SHOAIB et al.: A 0.6–107 W ENERGY-SCALABLE PROCESSOR FOR DIRECTLY ANALYZING COMPRESSIVELY-SENSED EEG 1117
Fig. 28. Total processor energy for the approximate solution using (a) RBF, (b) poly4, and (c) linear kernel. For nonlinear SVMs, classifier energy dominates dueto the extra modeling complexity in the compressed domain, while for linear kernels, CD-FE energy is higher and permits substantial scalability with and .
values (e.g., for the exact solution, from Fig. 27, an optimalof approximately 5 minimizes the total processor energy).
E. Summary of Measurement Results
The following is a summary of measurement results from theIC.
In Section IV-A, we presented the energy measurementsfrom the CD-FE block (logic and SRAM) at different values ofthe logic supply voltage. Since the total CD-FE energy exhibitsa nonlinear relationship with respect to and , we empiricallydetermined the optimal CD-FE logic voltage, , such thatit minimizes the total CD-FE energy at a given value of and .
In Section IV-B, we presented energy measurements fromthe CD-FE block vs. and . The CD-FE SRAM energycomprises the active- and idle-mode energies. We observedthat at smaller values of and , active-mode SRAM leakage,
, tends to be the dominant component while at highervalues of and , the idle-mode SRAM leakage, ,is dominant. Further, the CD-FE logic and SRAM energymeasurements showed that for values of , the totalfeature-extraction energy in the compressed domain is lowerthan that in the Nyquist domain.
In Section IV-C, we presented measurement resultsfor the SVM classifier. We observed that the classificationenergy can dominate the feature-extraction energy when weuse compressed-domain processing with nonlinear SVMkernels. However, for linear kernels, feature-extraction energydominates and compressed-domain processing can provide sub-stantial energy scalability with respect to and . Further, inSection IV-D, we also provided energy measurements from theprocessor (feature extraction + classification), which showed asimilar trend as the classifier for the linear and nonlinear SVMkernels.
V. CONCLUSIONS
Sparsity of signals provides an opportunity to efficientlyrepresent sensor data. Compressive sensing is one techniquethat exploits signal sparsity in a secondary basis to achievevery low-energy compression on the sensing node. The randomprojections in compressive sensing, however, affect the sensedsignals, preventing the use of Nyquist-domain algorithms forsignal analysis. Moreover, signal reconstruction is energy-in-tensive and is not desirable on low-power sensor nodes. Wepresented an approach to overcome these limitations in systems
that use compressive sensing. We transform computations fromthe Nyquist domain to the compressed domain, enabling usto perform computations directly on compressively-senseddata. In particular, we presented the design of a processor thatenables on-node signal analysis to detect epileptic seizuresdirectly using compressively-sensed EEG. By using an exactsolution for the compressed-domain filtering matrices, weshowed that the performance of the compressed-domain de-tector is retained up to high compression factors. Additionally,by using an approximate solution, we derived smaller-sizedcompressed-domain filtering matrices, saving us more energyin the compressed domain. We showed that these methodsprovide us with two strong knobs to control the energy ofthe compressed-domain seizure-detection processor. Thus, inaddition to communication energy savings, through end-to-enddata reduction in a system, our methodology enables a mode ofpower management where the computational energy scales dueto both a reduction in the number of input samples that needto be processed and due to approximations introduced at thealgorithmic level.
ACKNOWLEDGMENT
The authors thank Ali H. Shoeb for providing the code forthe baseline Nyquist-domain seizure-detection algorithm. Theyalso thank Xiuyuan Cheng and Amit Singer from the Appliedand Computational Mathematics Department at PrincetonUniversity for valuable discussions on low-dimensional errorbounds for the compressed-domain equations.
REFERENCES[1] D. Donoho, “Compressed sensing,” IEEE Trans. Inf. Theory, vol. 52,
pp. 1289–1306, Apr. 2006.[2] E. J. Candès and T. Tao, “Near optimal signal recovery from random
projections: Universal encoding strategies,” IEEE Trans. Inf. Theory,vol. 52, pp. 5406–5425, Dec. 2006.
[3] F. Chen, A. P. Chandrakasan, and V. M. Stojanovic, “Design and anal-ysis of a hardware-efficient compressed sensing architecture for datacompression in wireless sensors,” IEEE J. Solid-State Circuits, vol. 47,no. 3, pp. 744–756, Mar. 2012.
[4] H. Mamaghanian, N. Khaled, D. Atienza, and P. Vandergheynst,“Compressed sensing for real-time energy-efficient ECG compressionon wireless body sensor nodes,” IEEE Trans. Biomed. Eng., vol. 58,no. 9, pp. 2456–2466, Sep. 2011.
[5] M. A. T. Figueiredo, R. D. Nowak, and S. J. Wright, “Gradient projec-tion for sparse reconstruction: Application to compressed sensing andother inverse problems,” IEEE J. Sel. Topics Signal Process., vol. 1,no. 4, pp. 586–597, 2007.

1118 IEEE TRANSACTIONS ON CIRCUITS AND SYSTEMS—I: REGULAR PAPERS, VOL. 61, NO. 4, APRIL 2014
[6] A. Csavoy, G. Molnar, and T. Denison, “Creating support circuits forthe nervous system: Considerations for brain-machine interfacing,” inProc. Int. Symp. VLSI Circuits, Jun. 2009, pp. 4–7.
[7] N. Verma, A. Shoeb, J. Guttag, and A. Chandrakasan, “A micro-powerEEG acquisition SoC with integrated seizure detection processor forcontinuous patient monitoring,” in Proc. Symp. VLSI Circuits, Jun.2009, pp. 62–63.
[8] M. Shoaib, N. K. Jha, and N. Verma, “Enabling advanced inference onsensor nodes through the direct use of compressively-sensed signals,”in Proc. IEEE Design, Automation, and Test in Europe Conf., Mar.2012, pp. 437–443.
[9] M. Shoaib, N. K. Jha, and N. Verma, “A compressed-domain processorfor seizure detection to simultaneously reduce computation and com-munication energy,” in Proc. IEEE Custom Integrated Circuits Conf.,Sep. 2012, pp. 1–4.
[10] M. Shoaib, N. K. Jha, and N. Verma, “Signal processing with directcomputations on compressively-sensed data,” IEEE Trans. VLSI Syst.,under review.
[11] S. Aviyente, “Compressed sensing framework for EEG compression,”in Proc. IEEE Int. Wkshp. Statistical Signal Process., Aug. 2007, pp.181–184.
[12] T. Hofmann, B. Schölkopf, and A. J. Smola, “Kernel methods in ma-chine learning,” Annals of Statistics, vol. 36, no. 3, pp. 1171–1220, Jun.2008.
[13] W. B. Mendelson, D. A. Sack, S. P. James, J. V. Martin, R. Wagner,D. Garnett, J. Milton, and T. A. Wehr, “Frequency analysis of the sleepEEG in depression,” Psychiatry Research, vol. 21, no. 2, pp. 89–94,2007.
[14] A. Shoeb and J. Guttag, “Application of machine learning to seizuredetection,” in Proc. Int. Conf. Machine Learning, Jun. 2010.
[15] M. Rudelson and R. Vershynin, Non-Asymptotic Theory of RandomMatrices: Extreme Singular Values, arXiv preprint arXiv:1003.2990,Apr. 2010.
[16] S. Dasgupta and A. Gupta, “An elementary proof of the Johnson-Lin-denstrauss lemma,” Random Structures and Algorithms, vol. 22, no. 1,pp. 60–65, 2002.
[17] Physionet, CHB-MIT Physionet Database [Online]. Available: http://www.physionet.org/physiobank/database
[18] Synopsys Inc., NanoSim: A Next-Generation Solution for SoC Inte-gration Verification, Apr. 2013 [Online]. Available: http://www.syn-opsys.com/Tools/Verification/Pages/socintegration.aspx
[19] N. Verma, “Analysis towards minimization of total SRAM energy overactive and idle operating modes,” IEEE Trans. VLSI Syst., vol. 19, pp.1695–1703, Sep. 2011.
[20] A. Wang and A. P. Chandrakasan, “A 180-mV subthreshold FFT pro-cessor using a minimum energy design methodology,” IEEE J. Solid-State Circuits, vol. 40, no. 1, pp. 310–319, Jan. 2005.
Mohammed Shoaib (S’08) received the B.Tech.and M.Tech. degrees in electrical engineering with aspecialization in microelectronics and VLSI designfrom the Indian Institute of Technology (IIT),Madras, India, in 2007 and 2008, respectively. Hereceived the M.A. and Ph.D. degrees in electricalengineering from Princeton University, Princeton,NJ, USA, in 2010 and 2013, respectively.His research focuses on data-driven platforms for
intelligent biomedical systems, emphasizing low-en-ergy circuits and signal processing. He has authored
or coauthored more than 20 technical papers and holds 4 U.S. patents.Dr. Shoaib was a recipient of the IIT Madras MCM scholarship from 2004
to 2007. He also received a Ph.D. fellowship and an excellence in electricalengineering award from Princeton University in 2008 and 2011, respectively.He was a corecipient of the Qualcomm Innovation Ph.D. Fellowship 2011, anominee for the best paper award at Healthcomm 2011, and a recipient of theRoberto-Padovani scholarship 2011, Harold W. Dodds (Princeton UniversityHonorific) Fellowship 2012, and Princeton University GordonWu Prize for Ex-cellence 2012. He is a fellow of the McGraw Center for Teaching and Learningand has had industrial experience through internships with research groups atIBM Zurich Research Laboratory, Ricoh California Research Center, and Qual-comm Corporate Research and Development, CA.
Kyong Ho Lee received the B.S. degree in electricalengineering from Korea Advanced Institute of Sci-ence and Technology (KAIST), Korea, in 2004 andthe M.S. degree in electrical engineering from Stan-ford University, Stanford, CA, USA, in 2009. He iscurrently working towards the Ph.D. degree in elec-trical engineering at Princeton University, Princeton,NJ, USA.His research interest includes energy-efficient
signal processing for biomedical applications, andultralow energy biomedical circuit design employing
machine learning techniques.Mr. Lee was a co-recipient of the 2011 Qualcomm Innovation Fellowship.
Niraj K. Jha (S’85–M’85–SM’93–F’98) receivedthe B.Tech. degree in electronics and electricalcommunication engineering from the Indian Instituteof Technology, Kharagpur, India, in 1981, the M.S.degree in electrical engineering from S.U.N.Y.Stony Brook, NY, USA, in 1982, and the Ph.D.degree in electrical engineering from the Universityof Illinois, Urbana, IL, USA, in 1985.He is a Professor of electrical engineering at
Princeton University, Princeton, NJ, USA. He hasco-authored or co-edited five books, 12 book chap-
ters, and more than 390 technical papers. He has co-authored 14 papers, whichhave won various awards, and another six papers that have been nominatedfor best paper awards. He has received 14 U.S. patents. His research interestsinclude FinFETs, low power hardware/software design, computer-aided designof integrated circuits and systems, quantum computing, and secure computing.He has given several keynote speeches in the area of nanoelectronic design andtest.Prof. Jha is a Fellow of IEEE and ACM. He has served as the Editor-in-Chief
of IEEE TRANSACTIONS ON VLSI SYSTEMS and an Associate Editor of IEEETRANSACTIONS ON CIRCUITS AND SYSTEMS I AND II, IEEE TRANSACTIONSON COMPUTER-AIDED DESIGN, IEEE TRANSACTIONS ON VLSI SYSTEMS, andJournal of Electronic Testing: Theory and Applications. He is currently servingas an Associate Editor of IEEE TRANSACTIONS ON COMPUTERS, Journal of LowPower Electronics and Journal of Nanotechnology. He has also served as theProgram Chairman of the 1992 Workshop on Fault-Tolerant Parallel and Dis-tributed Systems, the 2004 International Conference on Embedded and Ubiq-uitous Computing, and the 2010 International Conference on VLSI Design. Hehas served as the Director of the Center for Embedded System-on-a-chip De-sign funded by New Jersey Commission on Science and Technology. He is therecipient of the AT&T Foundation Award and NEC Preceptorship Award forresearch excellence, NCR Award for teaching excellence, and Princeton Uni-versity Graduate Mentoring Award.
Naveen Verma (M’09) received the B.A.Sc. degreein electrical and computer engineering from theUniversity of British Columbia, Vancouver, BC,Canada, in 2003, and the M.S. and Ph.D. degreesin electrical engineering from the MassachusettsInstitute of Technology, Cambridge, MA, USA, in2005 and 2009, respectively.Since July 2009, he has been an Assistant
Professor of electrical engineering at Princeton Uni-versity, Princeton, NJ, USA. His research focuseson ultra-low-power integrated circuits and systems
with an emphasis on sensing applications. Of particular importance is the useof emerging devices for the creation of functionally-diverse systems and theuse of advanced signal-analysis frameworks for low-power inference overembedded signals. At the circuit level, his focus spans low-voltage digitallogic and SRAMs, low-noise analog instrumentation and data-conversion, andintegrated power management.Dr. Verma was a co-recipient of 2008 ISSCC Jack Kilby Award for Out-
standing Student Paper, and 2006 DAC/ISSCC Student Design Contest Award.He was a recipient of the Alfred Rheinstein Junior Faculty award at Princeton,the 2013 NSF CAREER award, and the 2013 Intel Early Career Award.