ieee transactions on journal name, manuscript id 1 cloud...
TRANSCRIPT
2168-7161 (c) 2015 IEEE. Personal use is permitted, but republication/redistribution requires IEEE permission. Seehttp://www.ieee.org/publications_standards/publications/rights/index.html for more information.
This article has been accepted for publication in a future issue of this journal, but has not been fully edited. Content may change prior to final publication. Citation information: DOI10.1109/TCC.2015.2481414, IEEE Transactions on Cloud Computing
IEEE TRANSACTIONS ON JOURNAL NAME, MANUSCRIPT ID 1
Cloud Colonography: Distributed Medical Testbed over Cloud
Yuichi Motai, Senior Member, IEEE, Eric Henderson, Nahian Alam Siddique, Student Member, IEEE, Hiroyuki Yoshida, Member, IEEE.
Abstract—Cloud Colonography is proposed in this paper, using different types of cloud computing environments. The sizes of the databases from the Computed Tomographic Colonography (CTC) screening tests among several hospitals are explored. These networked databases are going to be available in the near future via cloud computing technologies. Associated Multiple Databases (AMD) was developed in this study to handle multiple CTC databases. When AMD is used for assembling databases, it can achieve very high classification accuracy. The proposed AMD has the potential to play as a core classifier tool in the cloud computing framework. AMD for multiple institutions databases yields high detection performance of polyps using Kernel principal component analysis (KPCA). Two cases in the proposed cloud platform are private and public. We adapted a University cluster as a private platform, and Amazon Elastic Compute Cloud (EC2) as a public. The computation time, memory usage, and running costs were compared using three respresentative databases between private and public cloud environments. The proposed parallel processing modules improved the computation time, especially for the public cloud enviroments. The successful development of a cloud computing environment that handles large amounts of data will make Cloud Colonography feasible for a new health care service.
Index Terms— Cloud Service, Health Care, Computed Tomographic Colonography, Distributed Databases, Kernel Feature Analysis, Group Learning, Cloud Computing.
—————————— ——————————
1 INTRODUCTION
HE most prominent limiting factor pertaining to widespread usage of the latest screening technology
as a replacement for traditional screening colonoscopy is the limited supply of internal CTC images available at a single medical institution. Such a limited supply of CTC training images significantly constrains the accuracy of an automated detection algorithm. Since many medical insti-tutions employ a limited number of CTC specialists, whose CTC image analysis skills vary widely [1],[2]. To overcome these difficulties while providing a high-detection performance of polyps, computer-aided detec-tion (CAD) schemes are investigated that semi-automatically detect suspicious lesions in CTC images [4].
CAD schemes have been developed for medical insti-tutions (i.e. hospitals), where the number of training in-stances used during automated diagnosis is determined by resources and training requirements [5],[6],[8]-[10]. In most clinical settings, if more training data are collected after an initial tumor model is computed, retraining of the model becomes imperative in order to incorporate the newly-added data from the local institution, and to pre-serve the classification accuracy [5],[6],[12],[13]. This clas-sification accuracy may be proportionately related to the amount of training data available, i.e, more training data may yield a higher degree of classification. With this in mind, we propose a new framework, called “Cloud Co-
lonography”, where the colonography database at each institution may be shared and/or uploaded to a single composite database on a cloud server. The CAD system at each institution can then be enhanced by incorporating new data from other institutions through the use of the distributed learning model proposed in this study.
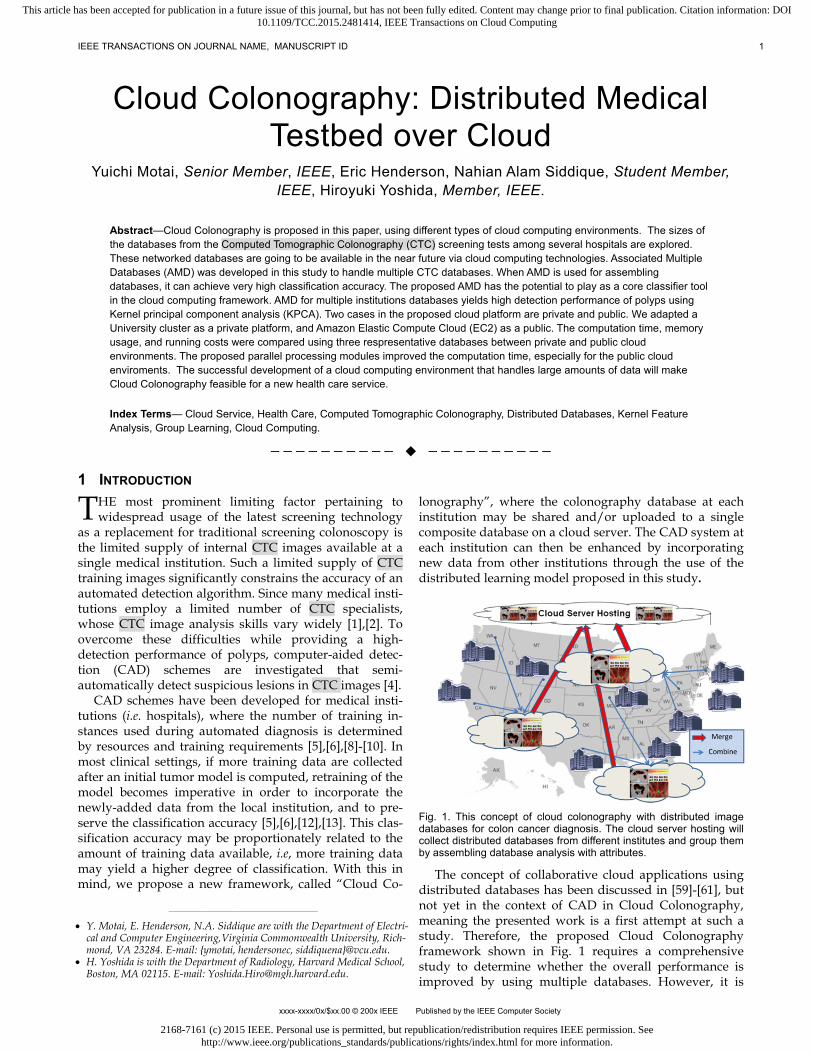
Fig. 1. This concept of cloud colonography with distributed image databases for colon cancer diagnosis. The cloud server hosting will collect distributed databases from different institutes and group them by assembling database analysis with attributes.
The concept of collaborative cloud applications using distributed databases has been discussed in [59]-[61], but not yet in the context of CAD in Cloud Colonography, meaning the presented work is a first attempt at such a study. Therefore, the proposed Cloud Colonography framework shown in Fig. 1 requires a comprehensive study to determine whether the overall performance is improved by using multiple databases. However, it is
xxxx-xxxx/0x/$xx.00 © 200x IEEE Published by the IEEE Computer Society
T
———————————————— Y. Motai, E. Henderson, N.A. Siddique are with the Department of Electri-
cal and Computer Engineering,Virginia Commonwealth University, Rich-mond, VA 23284. E-mail: {ymotai, hendersonec, siddiquena}@vcu.edu.
H. Yoshida is with the Department of Radiology, Harvard Medical School, Boston, MA 02115. E-mail: [email protected].

2168-7161 (c) 2015 IEEE. Personal use is permitted, but republication/redistribution requires IEEE permission. Seehttp://www.ieee.org/publications_standards/publications/rights/index.html for more information.
This article has been accepted for publication in a future issue of this journal, but has not been fully edited. Content may change prior to final publication. Citation information: DOI10.1109/TCC.2015.2481414, IEEE Transactions on Cloud Computing
2 IEEE TRANSACTIONS ON JOURNAL NAME, MANUSCRIPT ID
worth noting that, these existing studies showed that the overall classification performance for larger multiple da-tabases was improved in practical settings [54].
The primary contribution of this study is to develop Cloud Colonography using Associated Multiple Data-bases (AMD) to represent the statistical data characteris-tics in both private and public clouds. The proposed Cloud Colonography would be capable of learning mul-tiple databases provided from multiple institutions. We propose composite kernel feature analysis with multiple-databases for this specific problem. Kernel feature analy-sis is widely used for data compression, cluster-ing/classification [58]. The improvement in performance could be obtained by employing such efficient cloud-computing approaches in terms of resources, infrastruc-ture and operational costs. Comapred to other work [69]-[72], the proposed AMD improved a computation time. The database acquired over a long period of time can sometimes be highly diverse. The prallelization in the cloud enriments for multiple databases efficiently utilizes the computational capabailty of public servers.
The rest of this paper is organized as follows. Section 2 provides an introduction to cloud environment and a brief review of the existing feature extraction methods. Section 3 describes the proposed AMD for Cloud Colon-ography among multiple databases, Section 4 evaluates the experimental results for classification performance, Section 5 specifically accesses cloud computing perfor-mance, while conclusions are drawn in Section 6.
2 CLOUD ENVIRONMENTS Cloud Colonography proposes new services using a plat-form as a service (PaaS) model [60],[61]. Cloud Colon-ography is a cloud computing platform for programming, databases, and web servers. The clinical users access Cloud Colonography via the proposed software on a cloud platform without the cost and complexity of buying and managing the underlying hardware and software layers. Using existing PaaS platforms like Microsoft Az-ure and Google App Engine, the underlying computer and storage resources scale automatically to match appli-cation demand so that the cloud user does not have to allocate resources manually.
Section 2.1 evaluates the existing cloud environment and effectiveness with respect to the proposed method. Section 2.2 introduces the relevant cloud framework, showing how the mathematical background on Kernel principal component analysis (KPCA) are used for AMD. 2.1 Server Specifications of Cloud Platforms The cloud vendor specification is shown in Table 1. In addition to the private cloud environment using the in-tranet, the public cloud vendors using the internet are considered to implement the proposed Cloud Colonogra-phy.
The leading commercial cloud hosting service, Ama-zon, is chosen because of its superiority in performance as listed in Table 1. Microsoft and IBM do not support
Vendors Monthly
Uptime (%)
Credit level
max (%)
RAM per CPU
(GB) APIs Supports
Amazon [62] 99.95 30 0.615 REST, Java, IDE,
Command line Microsoft
[63] 99.95 25 1.75 REST, Java, IDE,
Command line IBM [64] 99.00 10 2.00 REST Private
Cloud [67] NA NA 64 --
Desktop PC NA NA 16 --
Matlab programming, yet. Therefore, we decided to adopt Amazon as a public cloud platform for the imple-mentation of Cloud Colonography. Private Cloud [67] is a department cluster used for a private cloud platform, and as a comparison, we added a desktop PC as well. The effectiveness of Cloud Colonography mainly comes from how many datasets are manageable and the computa-tional capacity of those large datasets in the program-ming. The proposed KPCA with AMD is a solution for these main problems. In the next subsection, we will de-scribe the mathematical background of KPCA in the cloud environment.
2.2 Cloud Framework of KPCA for AMD For efficient feature analysis, extraction of the salient fea-tures of polyps is essential because of the huge data size from many institutions and the 3D nature of the polyp databases [4]. The desired method should allow for the compression of such big data. Moreover, the distribution of the image features of polyps is nonlinear [34]. To ad-dress these problems, we adopt the kernel approaches [58] in a cloud platform.
The key idea of kernel feature analysis is how to select a nonlinear, positive-definite kernel K:Rd×RdR of an integral operator in the d-dimensional space. The kernel K, which is a Hermitian and positive semi-definite matrix, calculates the inner product between two finite sequences of inputs {xi:i∈n} and {xj:j∈n}, defined as K:=(K(xi,xj))=(Φ(xi).Φ(xj) : i,j∈n), where x is a grey-level CTC image, n is the number of image database, and : Rd H denotes a nonlinear embedding (induced by K) into a possibly infinite dimensional Hilbert space H as shown in Fig. 2. A more thorough discussion of kernels can be found in [28]. Our AMD module for CTC images is a dy-namic extension of KPCA as follows:
Fig. 2. An illustration of KPCA mathematical background. KPCA calculates the eigenvectors and eigenvalues by analyzing the kernel feature space of multiple institutions so that a cloud server can han-dle larger datasets.
TABLE 1 REPRESENTATIVE CLOUD VENDORS

2168-7161 (c) 2015 IEEE. Personal use is permitted, but republication/redistribution requires IEEE permission. Seehttp://www.ieee.org/publications_standards/publications/rights/index.html for more information.
This article has been accepted for publication in a future issue of this journal, but has not been fully edited. Content may change prior to final publication. Citation information: DOI10.1109/TCC.2015.2481414, IEEE Transactions on Cloud Computing
AUTHOR ET AL.: TITLE 3
KPCA uses a Mercer kernel [37] to perform a linear principal component analysis of the transformed image. Without loss of generality, we assume that the image of the data has been centered so that its scatter matrix in S is given by S=∑ni=1Ф(xi)(xi)Φ(xi)T. The eigenvalues λj and eigenvectors ej are obtained by solving the following equation, λjej=Sej=∑ni=1Ф(xi)Φ(xi)Tej=∑ni=1<ej,Φ(xi)>Ф(xi).If K is an n×n Gram matrix, with the elements kij=<Φ(xi), Φ(xj)> and aj=[aj1, aj2, …ajn] as the eigenvectors associated with eigenvalues λj, then the dual eigenvalue problem equivalent to the problem can be expressed as follows: λjaj=Kaj.
A traditional KPCA can be extended into the cloud framework as follows:
1. Compute the Gram matrix that contains the inner products between pairs of image vectors.
2. Configure AMD by grouping datasets from mul-tiple institutions.
3. Solve: λjaj=Kaj to obtain the coefficient vectors aj
for j=1,2,…,n. 4. The projection of a test point x∈Rd along the j-th
eigenvector is <ej,Φ(x)> =∑ni=1aji<Ф(xi),Φ(x)>=∑ni=1ajik(x,xi) The above implicitly contains an eigenvalue problem
of rank n, so the computational complexity of KPCA is O(n3). Each resulting eigenvector can be expressed as a linear combination of n terms. The total computational complexity is given by O(ln2) where l stands for the num-ber of features to be extracted and n stands for the rank of the Gram matrix K [28],[33]. Once we have our Gram matrix ready, we can apply these algorithms to our data-base to obtain a higher dimensional feature space. This cloud-based kernel framework will be discussed further in the following sections.
3 AMD FOR CLOUD COLONOGRAPHY
This section proposes the AMD method. Section 3.1 shows the overall concept of AMD for cloud environ-ment, Section 3.2 explains more details on the design of AMD, Section 3.3 shows the two implementation cases for the selected public cloud environments, and Section 3.4 shows the proposed parallelization.
3.1 AMD Concept As in Fig. 2, KPCA mentioned is executed for Cloud Co-lonography by analyzing the images of polyps with non-linear big feature space. We apply KPCA to both an indi-vidual dataset and groups of datasets. KPCA can be used in conjunction with AMD to synthesize individual data-bases into larger composite databases as shown in Fig. 3.
The concept of AMD is to format distinct distributed databases into a uniform larger database for the proposed Cloud Colonography platform. AMD are expected to solve the issues of nonlinearity and excessive data size so that CAD classification can achieve optimal performance. Specifically kernels handle nonlinear to linear projection, and PCA handles data size reduction. The next subsec-tion will describe how our proposed kernel framework will be organized for AMD.
Fig. 3. A concept of AMD. The proposed kernel framework combines the Cloud Colonography datasets by analyzing the images of polyps with nonlinear big feature space.
3.2 Data Configulation of AMD We adapt Community Cloud [62] for Cloud Colonogra-phy to share infrastructure between several hospitals with common CTC domains (data compliance and security, HIPPA agreement, etc.). The costs are spread over fewer users than a public cloud (but more than a private cloud), so only some cost savings are expected.
Fig. 4. Four representative steps of AMD. The proposed AMD con-sists of the four main criteria to manage databases by 1) Split, 2) Combine, 3) Sort, and 4) Merge.
Fig. 4 illustrates the AMD construction by analyzing the data from other individual institutional databases through the four representative steps. Step 1 splits each database, Step 2 combines several databases, Step 3 sorts the combined databases, and Step 4 merges the sorted databases. We will explain individual steps as follows:
Step 1: Split We split each database by maximizing the Fisher scalar
for kernel optimization [57]. The Fisher scalar is used to measure the class separability J of the training data in the mapped feature space. It is formulated as J=trace(∑lSbl)/trace(∑lSwl), where Sbl represents “between-class scatter matrices”, and Swl represents “within-class scatter matrices.” According to [35], the class separability by Fisher scalar can be expressed using the basic kernel

2168-7161 (c) 2015 IEEE. Personal use is permitted, but republication/redistribution requires IEEE permission. Seehttp://www.ieee.org/publications_standards/publications/rights/index.html for more information.
This article has been accepted for publication in a future issue of this journal, but has not been fully edited. Content may change prior to final publication. Citation information: DOI10.1109/TCC.2015.2481414, IEEE Transactions on Cloud Computing
4 IEEE TRANSACTIONS ON JOURNAL NAME, MANUSCRIPT ID
matrix Pl (submatrices of P11l, P12l, P21l, and P22l) as Jl(al)=alTMlal/alTNlal,, where Ml=KlTBlKl, Nl=KlTWlKl, and
To maximize Jl(al), the standard gradient approach is
followed. If the matrix N0i is nonsingular, the optimal al
which maximizes the Jl(al) is the eigenvector that corre-sponds to the maximum eigenvalue of Mlal=λlNlal. The criterion to select the best kernel function is to find the kernel which produces the largest eigenvalue.
Choosing the eigenvector which corresponds to the max-imum eigenvalue can maximize the Jl(al) to achieve the optimum solution. Once we determine the eigenvalues, the eigenvectors associated with the selected eigenvalues represent each split dataset.
Step 2: Combine Alignment is used to measure the adaptability of a kernel to the target data. Alignment provides a practical objec-tive for kernel optimization whether datasets are similar or not. The alignment measure is defined as a normalized Frobenius inner product between the kernel matrix and the target label matrix introduced by Cristianini et al. [45]. The empirical alignment between the two kernels with respect to the training set S is given as: where Ki is the kernel matrix for the training set S.
is the Frobenius inner product between Ki and
Kj. It has been shown that if datasets chosen are well aligned with the other datasets, these datasets are com-bined.
Step 3: Sort We use class separability as a measure to identify wheth-er the combined data is configured correctly in the right order. The separability within the combined datasets is required to check how well the data is sorted. It can be expressed as the ratio of separabilities:
)(/)( ** rr JJ where )(* rJ denotes the class sep-arability yielded by the most dominant kernel for the composite data (i.e. new incoming data and the previous offline data). )(* rJ is the class separability yielded by the most dominant kernel for another dataset. Thus, rela-tive separability can be rewritten as: ** / where * corresponds to the most dominant eigenvalue of com-posite data to be tested, and * is the most dominant ei-genvalue of the combined/entire data. Based on the com-parison of relative separabilities, the relationships among the combined datasets are finalized in the correct configu-ration. In this sorting step, we reduce the data size by ignoring the data with non-dominant eigenvalues.
Step 4: Merge
Finally, we consider merging the combined databases from Step 3. Among the kernels ki, i=1,2,..p, we will tune ρ to maximize
for the empirical alignment as follows:
where
Let us introduce the generalized Raleigh coefficient, which is given as: We obtain by solving the generalized eigenvalue
UV where δ denotes the eigenvalues. Once, we find this optimum composite coefficient , which will be the eigenvector corresponding to maximum eigenvalue δ, we can compute the composite data-dependent kernel matrix. Since we have associated all cloud data, which makes use of the data-dependent composite kernel start-ing from Steps 1-3, we can proceed to recombine all the institutions’ data into small sets of merged databases, shown in Fig. 4. AMD algorithm
Step 1: Split each database by maximizing the Fisher scalar.
Step 2: Combine other datasets if the alignment measure of datasets is high.
Step 3: Sort those combined datasets by class separability as a measure to identify whether the combined data is con-figured correctly in the right order.
Step 4: Merge the sorted cloud datasets from the institutions by computing the maximum eigenvalue δ for the composite data-dependent kernel matrix, which represents the associat-ed datasets for KPCA.
The big advantage of the proposed AMD algorithm is to compress multiple datasets into the merged databases with the bounded data size. These compressed databases can be handled easier than the original databases, mean-ing a reduction in computational time, memory, and run-ning cost. 3.3 Implementation of AMD for Two Cloud Cases AMD’s four steps are implemented into the two platform cases, private and public clouds, which are commercially available. We will demonstrate how the proposed Cloud Colonography is specifically adapted for this widespread implementation.
Case 1: Private Cloud The first specification of Cloud Colonography is listed in Fig. 5. This figure shows the representative layered im-plementation of the private cloud framework and its ar-chitectural components. A single institution/hospital handles the patient CTC datasets by a clinical IT staff or a
222
1112211
/0
0/),(
nP
nPPPdiagW
l
lll
lnP
nP
nPB ll
l
l //0
0/
222
111
)(maxarg 1
* lll MNl
FFFKKKKKKFrob 212121 /,),(
Fji KK ,
1
( )p
i ii
k k
,ˆ arg max( ( , , )) arg max arg max
,
Ti i jiji
i j Tij
i i j ji j
K KV
Frob k kU
K K
UVJ TT /)(
),..,,(,,,,,, 21 pjiijjiijjiijT
ii vvVuuUKKvyyKu

2168-7161 (c) 2015 IEEE. Personal use is permitted, but republication/redistribution requires IEEE permission. Seehttp://www.ieee.org/publications_standards/publications/rights/index.html for more information.
This article has been accepted for publication in a future issue of this journal, but has not been fully edited. Content may change prior to final publication. Citation information: DOI10.1109/TCC.2015.2481414, IEEE Transactions on Cloud Computing
AUTHOR ET AL.: TITLE 5
third-party organization, and hosts them either internally or externally. Self-run data centers/servers are generally capital intensive, requiring allocations of space, hard-ware, and environmental controls.
Fig. 5. Cloud Colonography architecture in private cloud environ-ment. The proposed Cloud Colonography consists of the four repre-sentative layers from CTC based on CAD analysis to the service desk reporting for clinical users.
Case1 has a "layered architecture", with each layer adding further value and complimentary functionality to the data input from the layer below, and providing the relevant output to the layer above. The solution architecture has the following four representative layers: (Layer1) AMD Monitoring/Management Layer: This layer consists of various modules for CTC AMD, which monitor the characteristics of CTC databases as described in Section 3.2. These modules, as described in the AMD algorithm, generate a salient feature space, compare exist-ing datasets to new ones, and prepare shared datasets for the next layer. (Layer2) CAD Processing/Decision-making Layer: All the CAD decision making from data collection of Layer1 is processed in this layer. This CAD processing includes the detection of cancer, such as patient and cancer identi-fication for the diagnosis. (Layer3) Radiology Service Desk: This layer further ena-bles us to summarize the outcomes to increase radiologi-cal efficiency, such as visualization and annotation. These outcomes of the Service Desk provide views, reporting, administration, and operational support for practical and clinical uses. (Layer4) Secure Connecting Layer: Qualified client-server applications are adapted for clinical users to assess Cloud Colonography. This layer is designed to prevent eaves-dropping and tampering. Upon the ID request, this layer of the server switches the connection to Transport Layer Security (TLS) using a protocol-specific mechanism. The private cloud specification is shown in Table 2 for the comparison of three representative platforms.
The computational performance is shown in Section 5, to analyze the speed, memory, and running cost. The private cloud server [67] has relatively large memory per CPU, however the other specs of the personal desktop are superior to the private cloud. The personal desktop has the latest specification manufactured in 2014, and the pri-vate cloud server is 2 years older. The key specification is CPU clock speed; 3.6 GHz for the personal desktop, and
2.6 GHz for the private cloud. Other key specifications of these servers for Cloud Colonography are the hard disk size of data storage and the RAM memory size.
TABLE 2 DESKTOP AND PRIVATE CLOUD SERVER HARDWARE SPECIFICATION
Platform Desktop Computer Private Cloud Server
Name Dell Optiplex 9020 Dogwood
Processor Intel i7 4790 AMD Opteron 6282
SE
Clock Speed 3.6GHz 2.6GHz
# processors 1 4
# cores 4 16
L1 Cache 4x32KB Data
4x32KB Instruction 8x64KB Data
16x16KB Instruction
L2 Cache 4x256KB 8x2MB
L3 Cache 8MB 2x8MB
Processor Bus Speed 5GT/s DMI 3200 MHz
6.4GT/s HTL
RAM 16GB DDR3 64GB per CPU
Memory Bus Speed 1600MHz 1333 MHz
Storage Technology 7.2k RPM
SATA 3Gbps 10k RPM
SAS 6Gbps
Case 2: Public Cloud The Cloud computing is also extended into a distributed set of servers that are running at different locations, while still connected to a single network or hub service as shown Fig. 6. Examples of this include distributed com-puting platforms such as BOINC [65], which is a volun-tarily shared resource that implements cloud computing in the provisions model. A public cloud scenario is used for cloud computing when the services are rendered over a network that is open for multiple institutions/hospitals. Rather than a single database being used, the proposed AMD-based KPCA approach uses more than a single da-tabase to improve the cancer classification performance as shown in the experimental results.
Technically, there is little or no difference between the public and private cloud architecture, however, security consideration may be substantially different for services (applications, storage, and other resources) that are made available by a service provider for multiple institu-tions/hospitals. Generally, public cloud services provide a firewall, like an extended Layer4 of private cloud sce-nario, to enhance a security barrier design, and to prevent unauthorized or unwanted communications between computer networks or hosts. We adopt known cloud in-frastructure service companies, such as Amazon AWS [62], Microsoft [63] and IBM [64] to operate the infrastruc-ture at their data center for Cloud Colonography. The hardware specification of Amazon is shown in Table 3.
The computational performance is shown in Section 5, to analyze the speed, memory, and running cost for the Amazon R3 instance servers. Amazon has relatively large RAM and reasonable pricing shown in Table 3. We have chosen Amazon because of MATLAB compatibility.

2168-7161 (c) 2015 IEEE. Personal use is permitted, but republication/redistribution requires IEEE permission. Seehttp://www.ieee.org/publications_standards/publications/rights/index.html for more information.
This article has been accepted for publication in a future issue of this journal, but has not been fully edited. Content may change prior to final publication. Citation information: DOI10.1109/TCC.2015.2481414, IEEE Transactions on Cloud Computing
6 IEEE TRANSACTIONS ON JOURNAL NAME, MANUSCRIPT ID
TABLE 3 AMAZON REPRESENTATIVE SERVERS SPECIFICATION
Platform c3.xlarge c3.8xlarge r3.xlarge r3.8xlarge
Processor name Intel Xeon E5-2670 v2
Intel Xeon E5-2670 v2
Intel Xeon E5-2670 v2
Intel Xeon E5-2670 v2
Clock Speed 2.5GHz 2.5GHz 2.5GHz 2.5GHz
# vCPU 4 4 4 32
# ECU 14 108 13 104
RAM 7.5GB 60GB 30.5GB 244GB
Hard Disk Storage
80GB SSD 640GB SSD 80GB SSD 640GB SSD
Linux Instance Price
$0.21/hr $1.68/hr $0.35/hr $2.80/hr
Processor Bus Speed
8GT/s DMI 8GT/s DMI 8GT/s DMI
8GT/s DMI
Memory Bus Speed
1866MHz 1866MHz 1866MHz 1866MHz
Fig. 6. An extension of AMD framework in public cloud scenario.
3.4 Parallelization of AMD The parallelization programs for a public could server are proposed to optimize KPCA using the MATLAB parallel toolbox. The parallel modules consist of 1) data parallel-ization of AMD, and 2) process parallelization of KPCA. MATLAB distributed computing servers use MATLAB job schedulers to distribute data and computational load to the cloud nodes. Fig. 7 shows in [Module1], large-scaled CTC images are transformed into high-dimensional image-based feature space with the form of distributed array. In [Module2], those arrays are assigned and independently processed by multiple cores of each node. These two modules are fused by the head node in Fig. 7, which optimistically arranges the number of cores to the size of data array. To optimize the overall perfor-mance, we need two criteria; 1) minimizing inter-node data transmission for computational speed, and 2) mini-mizing data storage for memory access requirement. The proposed criteria are designed to optimize the computa-tional independency between nodes. The proposed meth-od allows us to maximize the computational resources of elastic computing, which will reduce the computational
time and required memory for the processing of pattern recognition algorithms.
Fig. 7. A proposed parallelization organization for cloud computing.
The proposed modules 1 and 2 are listed in the following pseudo codes. These steps are designed to reduce the computational time for the processing of pattern recogni-tion algorithms.
MODULE 1 PSEUDO ALGORITHM
Data Parallelization Input: new data, Xn Parameter: Worker Node Structure, {DX,S} Output: Update Distributed Dataset, DX Begin
1. Vectorize multi-dimensional input: VXn 2. Sort vector dataset according to dimension index 3. Slice V as S: VsReshape(V,S) 4. Append Vs{i} at the end of DX{i}
End
MODULE 2 PSEUDOALGORITHM
Training Process Parallelization Input: Distributed Dataset Parameter: Kernel parameter, Kernel Identifier Output: Composite kernel Gram Matrix, Kernel Projector Model, Kc, Classifier Model Begin
1. Locate and Load Node Data, DX{i}. Keep data private to the node.
2. Assign Node worker and Corresponding Data by data index.
3. Initiate cloud controller 4. Compute intermediate gram matrix according to kernel
parameter 5. Terminate Cloud Controller 6. Return intermediate gram matrix to Head Node 7. Allow Head Node to use kernel parameter to combine
intermediate gram matrix from individual workers and construct final gram matrix
8. Associate Gram Matrix with Class label, y 9. Find Eigen Components of the Gram Matrix and use
Fisher Analysis to represent Eigen Vectors 10. Identify and Construct Kernel Projector Model, Kc 11. Initiate cloud Controller 12. Compute Kernel Projection using PCA 13. Terminate Cloud Controller 14. Compute Classifier Model
End
2168-7161 (c) 2015 IEEE. Personal use is permitted, but republication/redistribution requires IEEE permission. Seehttp://www.ieee.org/publications_standards/publications/rights/index.html for more information.
This article has been accepted for publication in a future issue of this journal, but has not been fully edited. Content may change prior to final publication. Citation information: DOI10.1109/TCC.2015.2481414, IEEE Transactions on Cloud Computing
AUTHOR ET AL.: TITLE 7
The proposed head node is designed to integrate the two parallelization algorithms. The following pseudo code shows testing the data samples using the modules 1 and 2.
HEAD NODE TESTING ALGORITHM
Testing Process Parallelization Input: Test Sample(s) Parameter: Kernel Model, Kernel Projector Model Output: Test decision Class Begin
1. Use Data Parallelization Algorithm to distribute test samples to the workers
2. Compute Kernel Projection of the test samples 3. Employ Classifier model to test class of the test sample
End
4 CLASSIFICATION EVALUATION OF CLOUD
COLONOGRAPHY We evaluated the proposed cloud colonography in Sec-tion 4.1 Databases with Classification Criteria, and in Sec-tion 4.2 Classification Results.
4.1 Databases with Classification Criteria We used several cloud settings, with a database consist-ing of 464 CTC cases that were obtained from 19 institu-tions/hospitals in the United States and Europe. Our pre-viously developed CAD scheme [4],[55]-[57] was applied to these CTC volumes, which yielded a total of 3,774 de-tections (polyp candidates), consisting of 136 true positive (TP) detections and 3,638 false positive (FP) detections. Note that the supine and prone CTC volumes of a patient were treated as independent in the detection process. A volume of interest (VOI) of 963 pixels was placed at each CTC candidate rather than the entire region of the CTC candidate. The collection of the VOIs for all of the candi-dates consisted of the databases used for the performance evaluation a shown in Table 4.
TABLE 4 DATABASES
Data-bases
# Patients Total # Pa-
tients
# Database Total # Data-base
# TP patients
# FP patients
# TP # FP
1 5 30 35 12 155 167 2 3 29 32 5 217 222 3 3 10 13 7 213 220 4 3 27 30 5 206 211 5 7 35 42 12 196 208 6 3 25 28 6 198 204 7 3 24 27 6 208 214 8 1 28 29 4 200 204 9 3 17 20 8 190 198 10 3 22 25 7 198 205 11 4 23 27 8 181 189 12 3 29 32 4 191 195 13 2 11 13 8 208 216 14 3 27 30 5 188 193 15 3 15 18 7 147 154 16 3 5 8 8 221 229 17 3 12 15 7 169 176 18 2 25 27 12 169 181 19 2 11 13 5 183 188
Average 3.1 21.3 24.4 7.15 190.1 197.3
We applied up to 40%-fold cross-variation for testing the training data. Note that the training and testing data were separated from the distinguished form. All the simula-tions were executed in a MATLAB environment opti-mized with the Parallel Computing Toolbox version [66]. The windows-operated desktop computing system fea-tured an i7 processor with 3.6GHz clock speed, and 16GB of DDR3 memory.
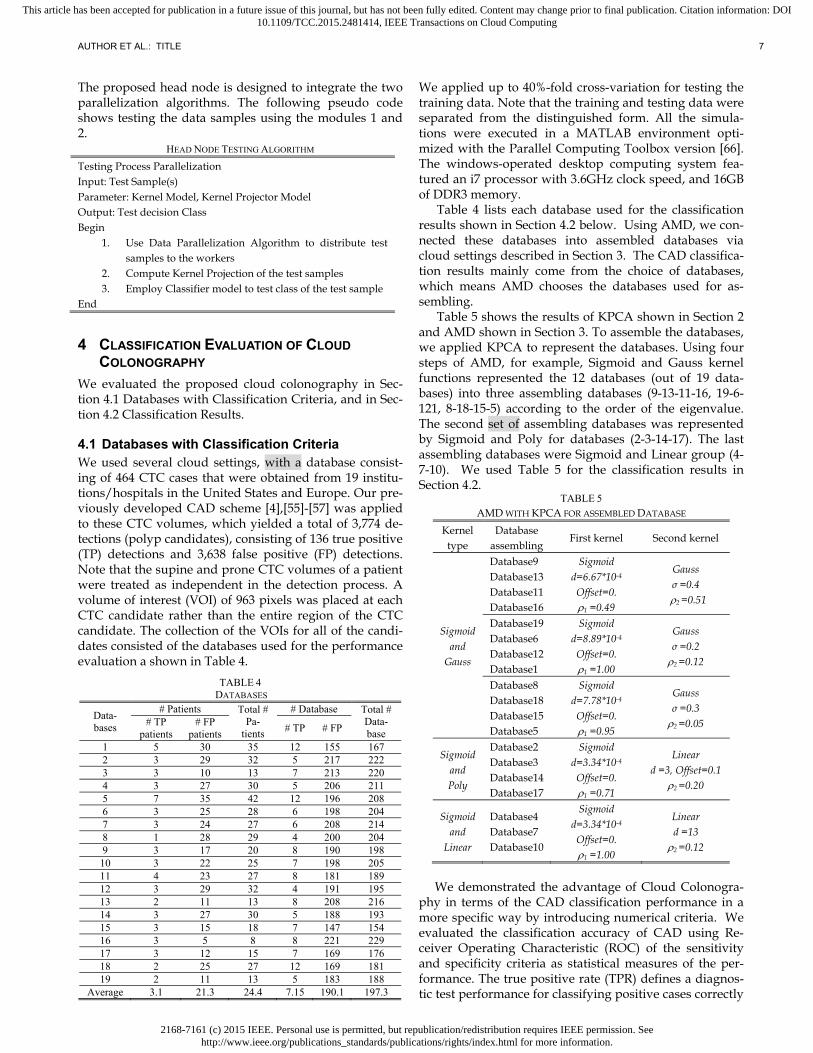
Table 4 lists each database used for the classification results shown in Section 4.2 below. Using AMD, we con-nected these databases into assembled databases via cloud settings described in Section 3. The CAD classifica-tion results mainly come from the choice of databases, which means AMD chooses the databases used for as-sembling.
Table 5 shows the results of KPCA shown in Section 2 and AMD shown in Section 3. To assemble the databases, we applied KPCA to represent the databases. Using four steps of AMD, for example, Sigmoid and Gauss kernel functions represented the 12 databases (out of 19 data-bases) into three assembling databases (9-13-11-16, 19-6-121, 8-18-15-5) according to the order of the eigenvalue. The second set of assembling databases was represented by Sigmoid and Poly for databases (2-3-14-17). The last assembling databases were Sigmoid and Linear group (4-7-10). We used Table 5 for the classification results in Section 4.2.
TABLE 5
AMD WITH KPCA FOR ASSEMBLED DATABASE Kernel type
Database assembling
First kernel Second kernel
Sigmoid and
Gauss
Database9 Database13 Database11 Database16
Sigmoid d=6.67*10-4 Offset=0. 1 =0.49
Gauss σ =0.4
2 =0.51
Database19 Database6 Database12 Database1
Sigmoid d=8.89*10-4 Offset=0. 1 =1.00
Gauss σ =0.2 2 =0.12
Database8 Database18 Database15 Database5
Sigmoid d=7.78*10-4 Offset=0. 1 =0.95
Gauss σ =0.3 2 =0.05
Sigmoid and Poly
Database2 Database3 Database14 Database17
Sigmoid d=3.34*10-4 Offset=0. 1 =0.71
Linear d =3, Offset=0.1
2 =0.20
Sigmoid and
Linear
Database4 Database7 Database10
Sigmoid d=3.34*10-4 Offset=0. 1 =1.00
Linear d =13 2 =0.12
We demonstrated the advantage of Cloud Colonogra-
phy in terms of the CAD classification performance in a more specific way by introducing numerical criteria. We evaluated the classification accuracy of CAD using Re-ceiver Operating Characteristic (ROC) of the sensitivity and specificity criteria as statistical measures of the per-formance. The true positive rate (TPR) defines a diagnos-tic test performance for classifying positive cases correctly

2168-7161 (c) 2015 IEEE. Personal use is permitted, but republication/redistribution requires IEEE permission. Seehttp://www.ieee.org/publications_standards/publications/rights/index.html for more information.
This article has been accepted for publication in a future issue of this journal, but has not been fully edited. Content may change prior to final publication. Citation information: DOI10.1109/TCC.2015.2481414, IEEE Transactions on Cloud Computing
8 IEEE TRANSACTIONS ON JOURNAL NAME, MANUSCRIPT ID
i
Z
i ii TPRFPRFPRAUC 2 1
among all positive instances available during the test. The false positive rate (FPR) determines how many incorrect positive results occur among all negative samples availa-ble during the test as follows:
TPR = True Positives (TP)
True Positives (TP) + False Negatives (FN)
FPR = False Positives (FP)
False Positives (FP)+ True Negatives (TN)
We also evaluated alternative numerical values, Area Under the Curves (AUC) by where Z is the number of discrete FPRi.
The proposed statistical analysis by use of AMD was applied to the multiple databases in Table 1, which showed that the CTC data were highly biased toward FPs (the average ratio between TP and FP is 1: 26.6) due to the limited number of TPs caused by asymptomatic patient cohort. 4.2 Classification Results We used the K-NN method for Table 4 for classification with the parameter k, accordingly to show the perfor-mance of TPR and specificity with respect to the variable k in ROC. We compared assembling databases perfor-mance, with a single database in Table 6. AMD for as-sembling database outperformed the KPCA for a single database by achieving a higher TPR and a lower FPR.
TABLE 6
CLASSIFICATION ACCURACY FOR ASSEMBLED DATABASE Kernel type
Database assembling
Dataset size (MB)
AUC Assembled
AUC
Sigmoid and
Gauss
Database9 Database13 Database11 Database16
916 988 868
1064
0.94 0.95 0.97 0.97
0.99
Database19 Database6 Database12 Database1
780 940 900 780
0.38 0.82 0.93 0.97
0.99
Database8 Database18 Database15 Database5
932 756 696 960
0.50 0.99 0.79 0.85
0.98
Sigmoid and Poly
Database2 Database3 Database14 Database17
1028 1036 876 820
0.32 0.12 0.87 0.99
0.85
Sigmoid and
Linear
Database4 Database7 Database10
976 251 956
0.40 0.17 0.57
0.97
These ROC results show the calculated AUC (vertical
axis) for the proposed method as the total network data size (horizontal axis) increases (mostly FT data). These figures show that Cloud Colonography with AMD exhib-
ited AUC performance for classification in handling the AMD in all five different cloud environments shown in Section 5. The ability to track changes using growing da-tabase size was also verified by the results shown in the following Section.
5 CLOUD COMPUTING PERFORMANCE We evaluated private and public cloud scenarios in
four aspects of the proposed design in Cloud Colonogra-phy. These are examined in Section 5.1 how databases are formed into AMD, Section 5.2 computational time, Section 5.3 memory usage, Section 5.4 running cost, and Section 5.5 parallelization. 5.1 Cloud Computing Setting with Cancer
Databases Table 7 shows how databases are formed into AMD. Three databases were generated from Table 4 for the analysis of both private and public cloud environments. These three datasets are a synthesis of the existing 19 databases by merging them into the cloud server, thus, the classification performance was equivalent to Section 4. These three gen-erated databases are mainly used for the evaluation of cloud computing.
TABLE 7 DATABASES FOR CLOUD COMPUTING ANALYSIS
Data-bases
Training Datasets Testing Datasets
#TP #FP #Total Size (MB) #TP #FP #Total
Size (MB)
1 122 1289 1411 9524 14 157 171 1154
2 120 853 973 6568 16 110 126 851
3 121 1071 1192 8046 15 133 148 999
Total 363 3213 3576 24138 45 400 445 3004
Fig. 8. Data compression ratio for data size. The horizontal axis denotes the size of the data, and vertical axis denotes the com-pressed data ratio.
Fig. 8 shows the compressed data ratio (vertical axis) of the Cloud Colonography network as the total network data size (horizontal axis) increases. The three databases for cloud environments are used to analyze how the pro-posed method handles the enlarged data sizes. The data compression ratio was defined as the size of the AMD feature space versus the size of the raw data. As the data size increased, the compressed data ratio was reduced.
0 1000 2000 3000 4000 5000 6000 7000 8000 9000 100000
2
4
6
8
10
12
14
16
18
20
Original Dataset Size (MB)
Com
pres
sed
Dat
aset
Siz
e (M
B/s
ampl
e)
Raw Data
Database 1Database 2
Database 3

2168-7161 (c) 2015 IEEE. Personal use is permitted, but republication/redistribution requires IEEE permission. Seehttp://www.ieee.org/publications_standards/publications/rights/index.html for more information.
This article has been accepted for publication in a future issue of this journal, but has not been fully edited. Content may change prior to final publication. Citation information: DOI10.1109/TCC.2015.2481414, IEEE Transactions on Cloud Computing
AUTHOR ET AL.: TITLE 9
Compared to the raw data, the three generated databases worked well to maintain the size for the analysis over the entire data size using AMD. The compression ratio re-flects the corresponding decrease in heterogeneous to homogenous data. In other words, a constant ratio with increasing data size indicates an equal growth in both heterogeneous and homogenous data, such as in the case of raw data. The evaluation criteria for the experimental datasets start from computational speed with varying database sizes. These results have been fully-outlined in the remaining sections below.
5.2 Computation Time
In this subsection, we analyzed the time required for processing of Cloud Colonography with AMD. All the experiments were implemented in MATLAB R2010a us-ing the Statistical Pattern Recognition Toolbox for the Gram matrix calculation and kernel projection. For pro-cessing the large volume of data, private cloud environ-ments were used. Run time was determined using the cputime command, representing how significant compu-tational savings were for each environment.
Fig. 9. Total training time required for Cloud Colonography with AMD.
Fig. 9 shows the total computational time required for growing network database sizes in the Private Cloud and Desktop environment. The total training time was measured for three uncompressed databases listed in Table 7. The total training time was increased as the number of samples in-creased. The difference between the Private Cloud and Desktop was relatively small.
Fig. 10 shows the mean execution time for compressed datasets. Compared to Fig. 9, the computation time was much improved when the datasets were compressed. The Private Cloud required more computation time than the Desktop for all three data cases. The time difference increased as the number of datasets increased. The dif-ference was calculated by averaging three databases shown in Table 8.
Table 8 shows the average of the total training time and mean execution time shown in Figs. 9 and 10. These values were calculated by averaging three databases for each cloud environment.
Fig. 10. Mean execution time for Cloud Colonography with AMD.
TABLE 8 AVERAGED TRAINING COMPUTATION TIME FOR THREE DATABASES
Cloud Uncompressed
data (sec) Compressed data
(sec)
Desktop 1.4 *105 12.3 Private Cloud 1.4 *105 14.6 Public Cloud 1.4*105 13.9
Table 8 demonstrates that the computation time for the private cloud was 18% larger than the desktop, means that the desktop was 18%, on average, faster than the pri-vate cloud. Based on the hardware specification in Table 2, the CPU speed of the desktop was 38% faster than the private cloud. The difference of the computational time between uncompressed and compressed datasets was over 104. The big reduction of computational time was achieved by the AMD due to the data compression. The increased ratio of the computation time in Fig. 9 and Fig. 10 shows that the proposed method was computationally efficient as the overall network database size increased. Therefore, Cloud Colonography was better-suited to handle long-term sequences in a practical manner. Our computational speed for larger CTC databases is promis-ing even if much larger datasets are used for the screen-ings.
Fig. 11. Computational time for Gram matrix in Cloud Colonography with AMD.
200 400 600 800 1000 1200 1400
0.5
1
1.5
2
2.5
3
3.5
4
4.5
5
x 105 Training Gram Matrix Computation Time: Uncompressed Data
Number of Samples in Dataset
Tim
e(se
c)
Database 1:Amazon EC2Database 1:Private Cloud
Database 1:Desktop
Database 2:Amazon EC2
Database 2:Private CloudDatabase 2:Desktop
Database 3:Amazon EC2
Database 3:Private CloudDatabase 3:Desktop
200 400 600 800 1000 1200 1400
10
20
30
40
50
60
Training Gram Matrix Computation Time: Compressed Data
Number of Samples in Dataset
Tim
e(se
c)
Database 1:Amazon EC2Database 1:Private Cloud
Database 1:Desktop
Database 2:Amazon EC2
Database 2:Private CloudDatabase 2:Desktop
Database 3:Amazon EC2
Database 3:Private CloudDatabase 3:Desktop
0 200 400 600 800 1000 1200 14000
1
2
3
4
5
6
7
8
9Training Time from Gram Matrix
Number of Data
Tot
al C
ompu
tatio
n T
ime
(sec
ond)
Private Cloud Times Scaled by 0.1
Amazon EC2 Times Scaled by .3
Database 1:Amazon EC2Database 1:Private Cloud
Database 1:Desktop
Database 2:Amazon EC2
Database 2:Private CloudDatabase 2:Desktop
Database 3:Amazon EC2
Database 3:Private CloudDatabase 3:Desktop
2168-7161 (c) 2015 IEEE. Personal use is permitted, but republication/redistribution requires IEEE permission. Seehttp://www.ieee.org/publications_standards/publications/rights/index.html for more information.
This article has been accepted for publication in a future issue of this journal, but has not been fully edited. Content may change prior to final publication. Citation information: DOI10.1109/TCC.2015.2481414, IEEE Transactions on Cloud Computing
10 IEEE TRANSACTIONS ON JOURNAL NAME, MANUSCRIPT ID
Fig. 11 selected the main module for the training time to specifically calculate Gram Matrix in Cloud Colon-ography with AMD. The calculation of Gram Matrix is the key module to computer KPCA with comparison be-tween the Desktop and private cloud. Fig. 11 also shows that Desktop was faster than private cloud for all three databases for the module of Gram matrix. The Private Cloud required more computation time than the Desktop for testing phase as well as shown in Table 9.
TABLE 9 AVERAGE TOTAL TESTING TIME PER SAMPLE
Database Desktop
Environment (ms)
Private Cloud (ms)
Public Cloud (ms)
1 361 2851.4 983.1 2 263 2037.1 695.2 3 289.7 2232.9 775.3
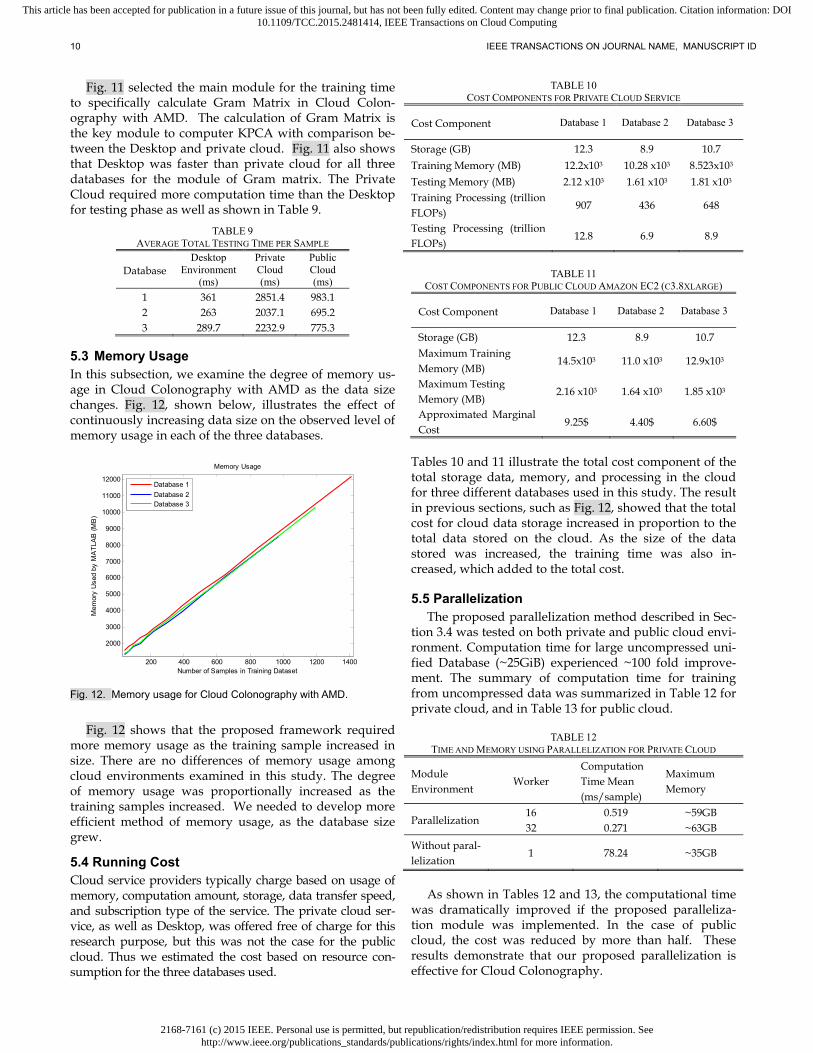
5.3 Memory Usage In this subsection, we examine the degree of memory us-age in Cloud Colonography with AMD as the data size changes. Fig. 12, shown below, illustrates the effect of continuously increasing data size on the observed level of memory usage in each of the three databases.
Fig. 12. Memory usage for Cloud Colonography with AMD.
Fig. 12 shows that the proposed framework required more memory usage as the training sample increased in size. There are no differences of memory usage among cloud environments examined in this study. The degree of memory usage was proportionally increased as the training samples increased. We needed to develop more efficient method of memory usage, as the database size grew.
5.4 Running Cost Cloud service providers typically charge based on usage of memory, computation amount, storage, data transfer speed, and subscription type of the service. The private cloud ser-vice, as well as Desktop, was offered free of charge for this research purpose, but this was not the case for the public cloud. Thus we estimated the cost based on resource con-sumption for the three databases used.
TABLE 10 COST COMPONENTS FOR PRIVATE CLOUD SERVICE
Cost Component Database 1 Database 2 Database 3
Storage (GB) 12.3 8.9 10.7
Training Memory (MB) 12.2x10³ 10.28 x10³ 8.523x10³
Testing Memory (MB) 2.12 x10³ 1.61 x10³ 1.81 x10³ Training Processing (trillion FLOPs)
907 436 648
Testing Processing (trillion FLOPs)
12.8 6.9 8.9
TABLE 11
COST COMPONENTS FOR PUBLIC CLOUD AMAZON EC2 (C3.8XLARGE)
Cost Component Database 1 Database 2 Database 3
Storage (GB) 12.3 8.9 10.7 Maximum Training Memory (MB)
14.5x10³ 11.0 x10³ 12.9x10³
Maximum Testing Memory (MB)
2.16 x10³ 1.64 x10³ 1.85 x10³
Approximated Marginal Cost
9.25$ 4.40$ 6.60$
Tables 10 and 11 illustrate the total cost component of the total storage data, memory, and processing in the cloud for three different databases used in this study. The result in previous sections, such as Fig. 12, showed that the total cost for cloud data storage increased in proportion to the total data stored on the cloud. As the size of the data stored was increased, the training time was also in-creased, which added to the total cost.
5.5 Parallelization
The proposed parallelization method described in Sec-tion 3.4 was tested on both private and public cloud envi-ronment. Computation time for large uncompressed uni-fied Database (~25GiB) experienced ~100 fold improve-ment. The summary of computation time for training from uncompressed data was summarized in Table 12 for private cloud, and in Table 13 for public cloud.
TABLE 12
TIME AND MEMORY USING PARALLELIZATION FOR PRIVATE CLOUD
Module Environment
Worker Computation Time Mean (ms/sample)
Maximum Memory
Parallelization 16 0.519 ~59GB 32 0.271 ~63GB
Without paral-lelization
1 78.24 ~35GB
As shown in Tables 12 and 13, the computational time
was dramatically improved if the proposed paralleliza-tion module was implemented. In the case of public cloud, the cost was reduced by more than half. These results demonstrate that our proposed parallelization is effective for Cloud Colonography.
200 400 600 800 1000 1200 1400
2000
3000
4000
5000
6000
7000
8000
9000
10000
11000
12000
Memory Usage
Number of Samples in Training Dataset
Mem
ory
Use
d by
MA
TLA
B (
MB
)
Database 1
Database 2Database 3

2168-7161 (c) 2015 IEEE. Personal use is permitted, but republication/redistribution requires IEEE permission. Seehttp://www.ieee.org/publications_standards/publications/rights/index.html for more information.
This article has been accepted for publication in a future issue of this journal, but has not been fully edited. Content may change prior to final publication. Citation information: DOI10.1109/TCC.2015.2481414, IEEE Transactions on Cloud Computing
AUTHOR ET AL.: TITLE 11
TABLE 13 TIME AND COST USING PARALLELIZATION FOR PUBLIC CLOUD AMAZON
EC2 (C3.8XLARGE)
Module Environment
Node Worker Computation Time Mean (ms/sample)
Approximate Cost
With parallel-ization
1 16 0.504 $2.75 2 32 0.268 $2.05 4 64 0.145 $1.91
Without paral-lelization
1 1 76.82 $6.60
5.6 Comparison to Other Studies
The results were compared with existing most related work [69]-[72]. The criteria were same as Tables 12 and 13 in Section 5.5. The node was defined as physically seper-ated hardwares, while the worker was virtually separated program running in the same physical environment. The computation time reduction was calculated as a measure of improvement because of the parallelization. The higher time reduction indicated better performance.
TABLE 14
COMPARISIONS OF OTHER METHODS
Method Node (Worker)
Computation Time Reduction (%)
AMD (Public Cloud) 2(64) 99.81
AMD (Private Server) 1(32) 99.65
AMD (Private Server) 1(16) 99.34
MapReduce SVM [69] 1(4) 76.14
Distributed SVM Ensemble [70] 1(4) 91.67
Method 3 [71] 1(2) 81
Parallel Dynamic ANN [72] 1(2) 48.72
As seen in Table 14, the computation time was much
reduced for the proposed AMD, compared to other stud-ies [69]-[72]. This comparision result validated the effi-cient computational performance of AMD.
6 CONCLUSION We proposed a new framework of Cloud Colonography, using different types of cloud computing environments. The databases from the CTC screening tests among sever-al hospitals are going to be networked in the near future via cloud computing technologies. The proposed method called AMD was developed in this study for handling multiple CTC databases. When AMD is used for assem-bling databases, it can achieve almost 100% classification accuracy. The proposed AMD has the potential to play as a core classifier tool in the cloud computing framework for a model-based CAD scheme, which will yield high detection performance of polyps using KPCA for multiple institutions databases. Two cases in the proposed cloud platform are private and public. The public cloud per-formed better than the private cloud in computation time, but the memory usage was equivalent. The parallelization was successful developed to reduce the speed and cost. CTC based on CAD in the cloud computing environment may advance the clinical implementation of cancer
screening and promote the early diagnosis of colon can-cer.
ACKNOWLEDGMENT
This study was supported partly by CTSA UL1TR000058 from the National Center for Advancing Translational Sciences, Center for Clinical and Translational Research Endowment Fund of Virginia Commonwealth University (VCU), Dean's Undergraduate Research Initiative (DURI) at VCU, Institutional Research Grant IRG-73-001-31 from the American Cancer Society through the Massey Cancer Center, Presidential Research Incentive Program at VCU, National Science Foundation (NSF) CAREER Award 1054333, and USPHS Grant CA095279 and CA166816.
REFERENCES
[1] S. Winawer, R. Fletcher, D. Rex, J. Bond, R. Burt, J. Ferrucci, T. Ganiats, T. Levin, S. Woolf, D. Johnson, L. Kirk, S. Litin, and C. Simmang, "Colo-rectal cancer screening and surveillance: clinical guidelines and ra-tionale-Update based on new evidence," Gastroenterology, vol. 124, pp. 544-60, Feb 2003. Systems, vol. 36, no. 1, pp. 266 - 278, Jan. 2000.
[2] J. G. Fletcher, F. Booya, C. D. Johnson, and D. Ahlquist, "CT colonogra-phy: unraveling the twists and turns," Curr Opin Gastroenterol, vol. 21, pp. 90-98, Jan. 2005.
[3] Z. B. Xu, M. W. Dai, and D. Y. Meng, "Fast and efficient strategies for model selection of gaussian support vector machine", IEEE Trans. Sys-tems, Man, and Cybernetics, part B, vol. 39, pp. 1292-1207, Oct. 2009.
[4] H. Yoshida and A. H. Dachman, "CAD techniques, challenges and controversies in computed tomographic colonography", Abdom Imag-ing, vol. 30, pp. 26-41, 2005.
[5] G. Kiss, J. Van Cleynenbreugel, M. Thomeer, P. Suetens, and G. Marchal, "Computer-aided diagnosis in virtual colonography via com-bination of surface normal and sphere fitting methods," Eur Radiol, vol. 12, pp. 77-81, Jan. 2002.
[6] D. S. Paik, C. F. Beaulieu, G. D. Rubin, B. Acar, R. B. Jeffrey, Jr., J. Yee, J. Dey, and S. Napel, "Surface normal overlap: a computer-aided detec-tion algorithm with application to colonic polyps and lung nodules in helical CT," IEEE Trans. Med Imaging, vol. 23, pp. 661-675, Jun. 2004.
[7] A. K. Jerebko, R. M. Summers, J. D. Malley, M. Franaszek, and C. D. Johnson", Computer-assisted detection of colonic polyps with CT co-lonography using neural networks and binary classification trees," Med Phys, vol. 30, pp. 52-60, Jan. 2003.
[8] J. Näppi, H. Frimmel, A. H. Dachman, and H. Yoshida, "A new high-performance CAD scheme for the detection of polyps in CT colonogra-phy," Med Imaging 2004: Image Processing, pp. 839-848, 2004.
[9] A. K. Jerebko, J. D. Malley, M. Franaszek, and R. M. Summers, "Multi-ple neural network classification scheme for detection of colonic polyps in CT colonography Databases," Acad Radiol, vol. 10, pp. 154-160, Feb. 2003.
[10] A. K. Jerebko, J. D. Malley, M. Franaszek, and R. M. Summers, "Support vector machines committee classification method for computer-aided polyp detection in CT colonography," Acad Radiol, vol.12, pp. 479-486, 2005.
[11] M. Doumpos, C. Zopounidis, and V. Golfinopoulou, "Additive support vector machines for pattern classification," IEEE Trans. Systems, Man, and Cybernetics, part B, vol. 37, pp. 540-550, June. 2007.
[12] R. M. Summers, C. F. Beaulieu, L. M. Pusanik, J. D. Malley, R. B. Jeffrey, Jr., D. I. Glazer, and S. Napel, "Automated polyp detector for CT colon-ography: feasibility study," Radiology, vol. 216, pp. 284-290, 2000.

2168-7161 (c) 2015 IEEE. Personal use is permitted, but republication/redistribution requires IEEE permission. Seehttp://www.ieee.org/publications_standards/publications/rights/index.html for more information.
This article has been accepted for publication in a future issue of this journal, but has not been fully edited. Content may change prior to final publication. Citation information: DOI10.1109/TCC.2015.2481414, IEEE Transactions on Cloud Computing
12 IEEE TRANSACTIONS ON JOURNAL NAME, MANUSCRIPT ID
[13] R. M. Summers, M. Franaszek, M. T. Miller, P. J. Pickhardt, J. R. Choi, and W. R. Schindler, "Computer-aided detection of polyps on oral con-trast-enhanced CT colonography," AJR Am J Roentgenol, vol. 184, pp. 105-108, 2005.
[14] C. F. Juang, S. H. Chiu, and S. J. Shiu, "Fuzzy system learned through fuzzy clustering and support vector machine for human skin color segmentation", IEEE Trans. Systems, Man, and Cybernetics, part A, vol.37, pp.1077-1087, Jan.2007.
[15] Y. Shao, and C. H. Chang, "Two dimensional principal component analysis based independent component analysis for face recognition", IEEE Trans. Systems, Man, and Cybernetics, part A, vol. 41, pp.284-293, Jan.2011.
[16] M. Xu, P. M. Thompson, and A. W. Toga, "Adaptive reproducing ker-nel particle method for extraction of the cortical surface", IEEE Trans. Med Imaging, vol. 25, no. 6, pp.755-762, 2006.
[17] I. E. A. Rueda, F. A. Arciniegas, and M. J. Embrechts, "Bayesian separa-tion with sparsity promotion in perceptual wavelet domain for speech enhancement and hybrid speech recognition", IEEE Trans. Systems, Man, and Cybernetics, part A, vol.34, pp.387-398, June.2004.
[18] W. Zheng, C. Zou, and L. Zhao, "An improved algorithm for kernel principal component analysis", Neural Process Lett., pp. 49–56, 2005.
[19] J. Kivinen, A. J. Smola, and R. C. Williamson, "Online learning with kernels", IEEE Trans. Signal Processing, vol. 52, no. 8, pp. 2165-2176, 2004.
[20] S. Ozawa, S. Pang, and N. Kasabov, "Incremental learning of chunk data for online pattern classification systems", IEEE Trans. Neural Net-works, vol. 19, no.6, pp. 1061-1074, 2008.
[21] H. T. Zhao, P. C. Yuen, and J. T. Kwok, "A novel incremental principal component analysis and its application for face recognition", IEEE Trans. Systems, Man, and Cybernetics, part B, vol. 36, no. 4, pp. 873-886, 2006.
[22] Y. M. Li, "On incremental and robust subspace learning", Pattern Recognition, vol. 37, no. 7, pp. 1509-1518, 2004.
[23] Y. Kim, "Incremental principal component analysis for image pro-cessing", Optics Letters, volume 32, Issue 1, pp. 32-34, 2007.
[24] B. J. Kim, and I. K. Kim, "Incremental nonlinear PCA for classification", Proc. Knowledge Discovery in Databases, vol. 3202, pp. 291-300, 2004.
[25] B. J. Kim, J. Y. Shim, C. H. Hwang, I. K. Kim, and J. H. Song. "Incremen-tal feature extraction based on empirical kernel map", Foundations of Intelligent Systems, vol. 2871, pp. 440-444, 2003.
[26] L. Hoegaerts, L. De Lathauwer, I. Goethals, J. A. K. Suykens, J. Vande-walle, and B. De Moor. "Efficiently updating and tracking the dominant kernel principal components", Neural Networks, vol. 20, no. 2, pp. 220-229, 2007.
[27] T. J. Chin, and D. Suter. "Incremental kernel principal component anal-ysis", IEEE Trans. Image Processing, vol. 16, no. 6, pp. 1662-1674, 2007.
[28] X. Jiang, R. Snapp, Y. Motai, and X. Zhu, "Accelerated kernel feature analysis", Proc. IEEE Computer Society Conference on Computer Vi-sion and Pattern Recognition, pp. 109-116, 2006.
[29] V. N. Vapnik, The nature of statistical learning theory, 2nd ed New York: Springer, 2000.
[30] T. Damoulas and M. A. Girolami, "Probabilistic multi-class multi – kernel learning: on protein fold recognition and remote homology de-tection", Bioinformatics, vol. 24, no. 10, pp. 1264–1270, 2008.
[31] S. Amari and S. Wu, "Improving support vector machine classifiers by modifying kernel functions", Neural Networks, vol.6, pp.783-789, 1999.
[32] B. Souza and A. de Carvalho, "Gene selection based on multi-class support vector machines and genetic algorithms", Molecular Research, vol. 4, no.3, pp. 599-607, 2005.
[33] L. Jayawardhana, Y. Motai, and A. Docef, "Computer-aided detection
of polyps in CT colonography: On-line versus off-line accelerated kernel feature analysis", Special Issue on Processing and Analysis of High-Dimensional Masses of Image and Signal Data, Signal Processing, pp.1-12, 2009.
[34] M. Awad, Y. Motai, J. Näppi, and H. Yoshida, "A clinical decision sup-port framework for incremental polyps classification in virtual colonos-copy", Algorithms, vol. 3, pp.1-20, 2010.
[35] H. Xiong, M. N. S. Swamy, and M. O. Ahmad, "Optimizing the data- dependent kernel in the empirical feature space," IEEE Trans. Neural Networks, vol. 16, pp. 460-474, 2005.
[36] H. Xiong, Y. Zhang, and X. W. Chen, "Data-dependent kernel machines for microarray data classification", IEEE/ACM Trans. Computational Biology and Bioinformatics, vol. 4, no. 4, 2007.
[37] B. Schökopf, and A. J. Smola. "Learning with kernels: support vector machines, regularization, optimization, and beyond", Adaptive Com-putation and Machine Learning, MIT press, 2002.
[38] H. Fröhlich, O. Chapelle, and B. Scholkopf, "Feature selection for sup-port vector machines by means of genetic algorithm", Proc. 15th IEEE Int. Conf. Tools with Artificial Intelligence, pp. 142-148, 2003.
[39] X. W. Chen, "Gene selection for cancer classification using bootstrapped genetic algorithms and support vector machines", Proc. IEEE Int. Conf. Computational Systems, Bioinformatics Conference, pp. 504-505, 2003.
[40] C. Park and S. B. Cho, "Genetic search for optimal ensemble of feature-classifier pairs in DNA gene expression profiles", Proc. Int. Joint Conf. Neural Networks, vol.3, pp. 1702-1707, 2003.
[41] F. A. Sadjadi, "Polarimetric radar target classification using support vector machines", Optical engineering, vol. 47, no. 4, 2008.
[42] C. Hu, Y. Chang, R. Feris, and M. Turk, "Manifold based analysis of facial expression" Computer Vision and Pattern Recognition Work-shop, vol.27, pp.81-85, 2004.
[43] T. T. Chang, J. Feng, H. W. Liu, and H. Ip, "Clustered microcalcification detection based on a multiple kernel support vector machine with grouped features", Proc 19th Int. Conf. Pattern Recognition, vol.8, pp.1-4, 2008.
[44] T. Briggs, and T. Oates, "Discovering domain specific composite ker-nels", Proc 20th national conf. artificial Intelligence, pp.732-738, 2005.
[45] N. Cristianini, J. Kandola, A. Elisseeff, and J. Shawe-Taylor, "On kernel target alignment," Proc. Neural Information Processing Systems, pp.367-373, 2001.
[46] G. R. G. Lanckriet, N. Cristianini, P. Bartlett, L. Ghaoui, and M. I. Jordan, "Learning the kernel matrix with semidefinite programming", J Ma-chine Learning Research, vol. 5, pp. 27-72, 2004.
[47] Y. Tan, and J. Wang, "A support vector machine with a hybrid kernel and minimal Vapnik-Chervonenkis dimension", IEEE Trans. Knowledge and Data Engineering, vol. 16, no. 4, pp.385-395, 2004.
[48] A. K. Jerebko, R. M. Summers, J. D. Malley, M. Franaszek, and C. D. Johnson, "Computer-assisted detection of colonic polyps with CT co-lonography using neural networks and binary classification trees," Med Phys, vol. 30, pp. 52-60, 2003.
[49] J. Näppi, H. Frimmel, A. H. Dachman, and H. Yoshida, "A new high-performance CAD scheme for the detection of polyps in CT colonogra-phy," Med Imaging 2004: Image Processing, pp. 839-848, 2004.
[50] A. K. Jerebko, J. D. Malley, M. Franaszek, and R. M. Summers, "Multi-ple neural network classification scheme for detection of colonic polyps in CT colonography Databases," Acad Radiol, vol. 10, pp. 154-160, 2003.
[51] A. K. Jerebko, J. D. Malley, M. Franaszek, and R. M. Summers, "Support vector machines committee classification method for computer-aided polyp detection in CT colonography," Acad Radiol, vol. 12, pp. 479-86, 2005.
[52] D. P. Zhu, R. W. Conners, D. L. Schmoldt, and P. A. Araman, "A proto-

2168-7161 (c) 2015 IEEE. Personal use is permitted, but republication/redistribution requires IEEE permission. Seehttp://www.ieee.org/publications_standards/publications/rights/index.html for more information.
This article has been accepted for publication in a future issue of this journal, but has not been fully edited. Content may change prior to final publication. Citation information: DOI10.1109/TCC.2015.2481414, IEEE Transactions on Cloud Computing
AUTHOR ET AL.: TITLE 13
type vision system for analyzing CT imagery of hardwood logs", IEEE Trans. Systems, Man, and Cybernetics, part B, vol. 26, pp. 522-532, June. 1996.
[53] Y. Shao, C. H. Chang, "Bayesian Separation With Sparsity Promotion in Perceptual Wavelet Domain for Speech Enhancement and Hybrid Speech Recognition ", IEEE Trans. Systems, Man, and Cybernetics, part A, vol.41, pp.284-293, Feb.2007.
[54] J. H. Yao, M. Miller, M. Franaszek, and R.M. Summers, "Colonic polyp segmentation in CT colonography-based on fuzzy clustering and de-formable models," IEEE Trans. Med Imaging, vol. 23, pp. 1344-1356, 2004.
[55] H. Yoshida and J. Nappi, "Three-dimensional computer-aided diagno-sis scheme for detection of colonic polyps," IEEE Trans. Med. Imaging, vol. 20, pp. 1261-1274, Dec, 2001.
[56] J. Näppi and H. Yoshida, "Fully automated three-dimensional detection of polyps in fecal-tagging CT colonography," Acad Radiol, vol. 14, pp. 287-300, Mar, 2007.
[57] H. Yoshida, J. Näppi, and W. Cai, "Computer-aided detection of polyps in CT colonography: performance evaluation in comparison with hu-man readers based on large multicenter clinical trial cases", Proc 6th IEEE Int. Symp. Biomedical Imaging, pp.919-922, 2009.
[58] Y. Motai and H. Yoshida, " Principal Composite Kernel Feature Analy-sis: Data-Dependent Kernel Approach," IEEE Trans. Knowledge and Data Engineering, vol.25, no.8, pp. 1863 – 1875. 2013.
[59] S. Di, C. Wang, F. Cappello, F, "Adaptive Algorithm for Minimizing Cloud Task Length with Prediction Errors", IEEE Trans. Cloud Compu-ting, In press. 2014.
[60] C. Tsai, W. Huang, M. Chiang, M. Chiang, C. Yang, "A Hyper-Heuristic Scheduling Algorithm for Cloud," IEEE Trans. Cloud Computing, In Press. 2014.
[61] F. Larumbe, B. Sanso, "A Tabu Search Algorithm for the Location of Data Centers and Software Components in Green Cloud Computing Networks," IEEE Trans. Cloud Computing, vol.1, no.1, pp.22,35, Jan.-June 2013.
[62] Amazon Elastic Compute Cloud (online) http://aws.amazon.com/ec2/
[63] Microsoft Azure (online) https://azure.microsoft.com [64] IBM cloud services (online) http://www.ibm.com/cloud-
computing/us/en/ [65] Berkeley Open Infrastructure for Network Computing (online)
http://boinc.berkeley.edu/ [66] MathWorks (online) http://www.mathworks.com/products/parallel-
computing/ [67] Department cluster Dogwood (online)
http://computerscience.egr.vcu.edu/undergraduate/resourcescurrent/computing-facilities/
[68] M. Kesavan, I. Ahmad, O. Krieger, R. Soundararajan, A. Gavrilovska, K. Schwan, "Practical Compute Capacity Management for Virtualized Datacenters," IEEE Trans. Cloud Computing, vol.1, no.1, pp.1, 2013.
[69] G. Caruana, L. Maozhen, M. Qi, "A MapReduce based parallel SVM for large scale spam filtering," in Proc. 8th Intl. Conf. Fuzzy Systems and Knowledge Discovery, vol.4, pp.2659-2662, 2011.
[70] N. K. Alham, L. Maozhen, L. Yang, M. Ponraj, M. Qi, "A distributed SVM ensemble for image classification and annotation," in Proc. 9th Intl. Conf. Fuzzy Systems and Knowledge Discovery, pp.1581-1584, 2012.
[71] C. Silva, U. Lotric, B. Ribeiro, A. Dobnikar, "Distrib-uted Text Classifica-tion With an Ensemble Kernel-Based Learning Approach," IEEE Trans. Systems, Man, and Cybernetics, Part C: Applications and Reviews, vol.40, no.3, pp.287-297, 2010.
[72] L. Prechelt, "Exploiting domain-specific properties: compiling parallel
dynamic neural network algorithms into efficient code," IEEE Trans. Parallel and Distributed Systems, vol.10, no.11, pp.1105-1117, 1999.
Yuichi Motai (M’01) received the B.Eng. degree in instrumentation engineering from Keio University, Tokyo, Japan, in 1991, the M.Eng. degree in applied systems science from Kyoto University, Kyoto, Japan, in 1993, and the Ph.D. degree in electrical and comput-er engineering from Purdue University, West Lafayette, IN, U.S.A., in 2002. He is currently an Associate Pro-fessor of Electrical and Computer Engineering at VCU, Richmond, VA, USA. His research interests include the
broad area of sensory intelligence; particularly in medical imaging, pattern recognition, computer vision, and robotics.
Eric Henderson received his B.S. degree in Computer Engineering from VCU located in Richmond, Virginia in May 2015. Eric joined the sensory intelligence lab as an undergraduate reseach assistant for NSF REU pro-gram. He also worked as an undergraduate research fellow of DURI.
Nahian Alam Siddique (SM’12) received his B.S. degree in Electrical and Electronic Engineering from Bangladesh University of Engineering and Technology, Dhaka, Bangladesh, in 2011. Presently he is pursuing graduate studies at the department of Electrical and Computer Engineering in VCU, Richmond, VA, USA. He was graduate reseach mentor of DURI. His research interests include specific areas of sensory intelligence—
particularly in medical imaging, pattern recognition and computer vision. Hiroyuki Yoshida (M’96) received his B.S. and M.S. degrees in physics and a Ph.D. degree in infor-mation science from the University of Tokyo, Japan. He previously held an Assistant Professorship in the Department of Radiology at the University of Chica-go. He was a tenured Associate Professor when he left the university and joined the Massachusetts Gen-eral Hospital (MGH) and Harvard Medical School (HMS) in 2005, where he is currently the Director of
3D Imaging Research in the Department of Radiology, MGH and an Asso-ciate Professor of Radiology at HMS. His research interest is in computer-aided diagnosis, in particular the detection of polyps in CTC, for which he received several awards at the Annual Meetings of Radiological Society of North America and the International Society for Optical Engineering.