ifn-a mediates the development of autoimmunity … · ifn-a mediates the development of...
TRANSCRIPT

of August 4, 2018.This information is current as
Mechanismsand through Immune Cell Recruitment
ToxicityAutoimmunity both by Direct Tissue Mediates the Development ofαIFN-
Huber, Weijia Zhang, Mehdi Keddache and Yaron TomerNagako Akeno, Eric P. Smith, Mihaela Stefan, Amanda K.
http://www.jimmunol.org/content/186/8/4693doi: 10.4049/jimmunol.1002631March 2011;
2011; 186:4693-4706; Prepublished online 14J Immunol
MaterialSupplementary
1.DC1http://www.jimmunol.org/content/suppl/2011/03/14/jimmunol.100263
Referenceshttp://www.jimmunol.org/content/186/8/4693.full#ref-list-1
, 15 of which you can access for free at: cites 72 articlesThis article
average*
4 weeks from acceptance to publicationFast Publication! •
Every submission reviewed by practicing scientistsNo Triage! •
from submission to initial decisionRapid Reviews! 30 days* •
Submit online. ?The JIWhy
Subscriptionhttp://jimmunol.org/subscription
is online at: The Journal of ImmunologyInformation about subscribing to
Permissionshttp://www.aai.org/About/Publications/JI/copyright.htmlSubmit copyright permission requests at:
Email Alertshttp://jimmunol.org/alertsReceive free email-alerts when new articles cite this article. Sign up at:
Print ISSN: 0022-1767 Online ISSN: 1550-6606. All rights reserved.1451 Rockville Pike, Suite 650, Rockville, MD 20852The American Association of Immunologists, Inc.,
is published twice each month byThe Journal of Immunology
by guest on August 4, 2018
http://ww
w.jim
munol.org/
Dow
nloaded from
by guest on August 4, 2018
http://ww
w.jim
munol.org/
Dow
nloaded from

The Journal of Immunology
IFN-a Mediates the Development of Autoimmunity both byDirect Tissue Toxicity and through Immune Cell RecruitmentMechanisms
Nagako Akeno,* Eric P. Smith,* Mihaela Stefan,† Amanda K. Huber,† Weijia Zhang,‡
Mehdi Keddache,x and Yaron Tomer†,{
IFN-a is known to play a key role in autoimmunity, but the mechanisms are uncertain. Although the induction of autoimmunity
by IFN-a is consistent with primarily immunomodulatory effects, the high frequency of nonautoimmune inflammation suggests
other mechanisms. We used thyroiditis as a model to dissect these possibilities. IFN-a treatment of cultured thyrocytes increased
expression of thyroid differentiation markers, thyroglobulin, thyroid-stimulating hormone receptor, thyroid peroxidase, and
sodium iodide transporter. RNAseq analysis demonstrated that pathways of Ag presentation, pattern recognition receptors,
and cytokines/chemokines were also stimulated. These changes were associated with markedly increased nonapoptotic thyroid
cell death, suggesting direct toxicity. To corroborate these in vitro findings, we created transgenic mice with thyroid-specific
overexpression of IFN-a under control of the thyroglobulin promoter. Transgenic mice developed marked inflammatory thyroid
destruction associated with immune cell infiltration of thyroid and surrounding tissues leading to profound hypothyroidism,
findings consistent with our in vitro results. In addition, transgenic mice thyroids showed upregulation of pathways similar to
those observed in cultured thyrocytes. In particular, expression of granzyme B, CXCL10, a subset of the tripartite motif-
containing family, and other genes involved in recruitment of bystander cytotoxic immune responses were increased. Pathways
associated with apoptosis and autophagy were not induced. Taken together, our data demonstrate that the induction of tissue
inflammation and autoimmunity by IFN-a involves direct tissue toxic effects as well as provocation of destructive bystander
immune responses. The Journal of Immunology, 2011, 186: 4693–4706.
Interferon-a, a critical cytokine in the host immune responseto viral infections and tumors, has been extensively used asa therapeutic agent for a growing array of diseases, ranging
from malignancies, such as hairy cell leukemia (1), to viralinfections, notably chronic hepatitis C virus (HCV) infection (2).IFN-a binds to the type I IFN receptor, a transmembrane glyco-protein dimer with cytoplasmic domains. Binding induces a sig-naling cascade mediated primarily through the JAK-STAT, Crk,insulin receptor substrate, and MAPK pathways (3). Yet, the fullscope of the actions of IFN-a, either produced naturally or bytherapeutic delivery, remains poorly understood. Emblematic ofthis understanding gap is the disparate array of notable side effects
associated with IFN-a therapy. These include influenza-likesymptoms, hematological perturbations, neuropsychiatric signs,and thyroid disease. Individually and/or cumulatively, these sideeffects can lead to dose reductions in up to 40% of patients anddrug discontinuation in up to 14% of patients (4–7).IFN-a also plays a major role in the development of autoim-
munity. Activation of IFN-a pathways has been implicated ina number of autoimmune diseases, most notably systemic lupuserythematosus (SLE) (8). The association of IFN-a therapy withthe development of autoimmune thyroiditis has, in particular,supported a role for IFN-a in provoking autoimmune responses (9,10). However, the mechanisms by which IFN-a induces autoim-munity are still unknown. Conceptually, the induction of auto-immunity is consistent with various immunomodulatory effects ofIFN-a, such as activation of cytokines and adhesion molecules,and, of cardinal importance, stimulation of MHC class I Ag ex-pression (11, 12). Moreover, IFN-a shifts the immune response toa Th1 pattern (13–15), resulting in the production of IFN-g andIL-12, two potent proinflammatory cytokines (15). IFN-a caninduce the release of other cytokines, such as IL-6, a cytokine thathas been associated with autoimmune thyroiditis (16).Although the immune effects of IFN-a provide an attractive
basis for the induction of autoimmunity by IFN-a, the high fre-
quency of nonautoimmune tissue inflammatory conditions, most
notably destructive thyroiditis in many cases of thyroiditis asso-
ciated with IFN-a therapy (10), suggests that IFN-a can induce
pathologic processes also by atypical immune and/or nonimmune
mechanisms. We, therefore, hypothesized that IFN-a triggers
autoimmunity in genetically susceptible individuals by a combi-
nation of direct tissue toxicity and immune modulation. To test
this hypothesis, we used IFN-induced thyroiditis (IIT) as a model.
*Division of Endocrinology, University of Cincinnati College of Medicine, Cincin-nati, OH 45267; †Division of Endocrinology, Department of Medicine, Mount SinaiSchool of Medicine, Genome Center, New York, NY 10029; ‡Department of Med-icine Bioinformatics Core, Mount Sinai School of Medicine, Genome Center, NewYork, NY 10029; xCincinnati Children’s Hospital Medical Center, Cincinnati, OH45229; and {James J. Peters Veterans Administration Medical Center, New York, NY10468
Received for publication August 2, 2010. Accepted for publication February 4, 2011.
This work was supported in part by Grants DK61659 and DK073681 from theNational Institute of Diabetes and Digestive and Kidney Diseases and by a VeteransAdministration Merit Award (to Y.T.).
Address correspondence and reprint requests to Dr. Yaron Tomer, Department ofMedicine, Box 1118, Mount Sinai Medical Center, One Gustave L. Levy Place,New York, NY 10029. E-mail address: [email protected]
The online version of this article contains supplemental material.
Abbreviations used in this article: AITD, autoimmune thyroid disease; bTg, bovinethyroglobulin; Ct, cycle threshold; FCM, flow cytometric analysis; HCV, hepatitis Cvirus; IIT, IFN-induced thyroiditis; IPA, Ingenuity Pathway Analysis; mIFN, mouseIFN; NIS, sodium iodide symporter; QPCR, quantitative PCR; SLE, systemic lupuserythematosus; Tg, thyroglobulin; TG, transgenic; TPO, thyroid peroxidase; TRIM,tripartite motif containing; TSH, thyroid-stimulating hormone; WT, wild-type.
www.jimmunol.org/cgi/doi/10.4049/jimmunol.1002631
by guest on August 4, 2018
http://ww
w.jim
munol.org/
Dow
nloaded from

IIT is a well-recognized syndrome associated with IFN-atherapy that was first described in 1983 in patients treated withIFN-a for carcinoid tumors (17, 18) and breast cancer (19).Subsequently, numerous studies reported a high incidence of IITin patients treated with IFN-a, mostly for hepatitis C infection(10, 20). Intriguingly, IIT can manifest either as autoimmune ornonautoimmune thyroiditis, an observation suggesting that IFN-ainduces tissue inflammation by immune as well as nonimmunemechanisms (9–11). Our data, combining in vitro and in vivostudies, support the hypothesis that IFN-a has direct tissue toxiceffects, most notably the induction of thyroid cell necrosis.Moreover, we show that IFN-a provokes a clear stimulation of animmune-regulated and destructive inflammatory bystander re-sponse that most likely triggers tissue-specific autoimmunity ina genetically susceptible host.
Materials and MethodsMaterials and reagents
DMEM and penicillin-streptomycin were purchased from Fisher Scientific(Pittsburgh, PA). MTT, a tetrazole, Coon’s modification of Ham’s F12media, thyroid-stimulating hormone (TSH), insulin, apotransferrin, andhydrocortisone were purchased from Sigma-Aldrich (St. Louis, MO).TRIzol solution and FBS were purchased from Invitrogen (Carlsbad, CA).StrataScript quantitative PCR (QPCR) cDNA synthesis kit and BrilliantSYBR Green QPCR reagents were purchased from Stratagene (La Jolla,CA). Mouse anti-human TSH receptor (TSHR) Ab and FITC-conjugatedrabbit anti-mouse IgG were purchased from Serotec (Raleigh, NC). FITC-conjugated mouse anti-rat MHC class I mAb and mouse anti-humanb-actin mAb were purchased from Abcam (Cambridge, MA). FITC-con-jugated nonspecific mouse IgG1 control was purchased from BD Biosci-ences (San Jose, CA). PE-conjugated goat anti-mouse IgG Ab, normalmouse IgG1, and flow cytometric analysis (FCM) wash buffer were pur-chased from Santa Cruz Biotechnology (Santa Cruz, CA). Purified hamsteranti-mouse CD3e, biotin rat anti-mouse CD45R/B220, and purified ratanti-mouse F4/80-like receptor mAbs were purchased from BD Biosci-ences.
Generation of IFN-a transgenic mice
Creation of the transgenic (TG) mice and all mouse studies were reviewedand approved by the University of Cincinnati and Mount Sinai InstitutionalAnimal Care and Use Committees. The mouse IFN-a (mIFN-a) cDNA,provided by T. Michiels (University of Louvain, Brussels, Belgium), wasdigested by BamHI and XhoI into a 0.6-kb mIFN-a fragment and ligatedinto a pSG5 vector containing the rabbit b-globin second intron and SV40poly(A) tail. The pSG5–mIFN construct was digested with StuI and SalIand ligated into a pBluescriptSK+ vector containing the bovine Tg (bTg)promoter (pBSK-bTg; provided by Dr. J. Fagin, Memorial Sloan KetteringCancer Center) at the EcoRV and SalI sites. The final product (designatedbTg-mIFN-a; Fig. 3A) was verified by direct sequencing.
The plasmid containing the bTg–mIFNa construct was digested withSacI/KpmI, generating a 3.4-kb fragment (Fig. 3A). Purified transgeneDNA (3.4 kb) was resuspended in 5 mM Tris-HCl (pH 7.4)/0.15 mMEDTA and given to the University of Cincinnati Transgenic Core facilityfor microinjection. C57BL/6J3 CBA/J F1 hybrid mice were superovulatedand mated with fertile C57BL/6 males. Single-cell embryos were har-vested and pronuclei microinjected with 1–2 pl DNA solution. Embryossurviving microinjection were reimplanted into pseudopregnant C57BL/6Jfemales. Founders were identified initially by PCR screening of genomicDNA with TG-specific primers, as follows: forward primer (59-GTTT-GGGGACCCTTGATTGTTCTT-39) and reverse primer (59-AGGGGCC-CGGTTTGGACTC-39). Reference control was TSHR gene; forward pri-mer (59-GTAACTCACTCATGCAAAGT-39) and reverse primer (59-TCC-TCAAAGATGCTCATTAG-39). In order to verify the integrity of the trans-gene, Southern blotting of XbaI/SalI–digested genomic DNA (size 3.4 kb)from tail biopsies was performed using standard techniques (Fig. 3C).
Cell culture
Human thyroid primary cells were prepared from fresh, noncancerousthyroid tissue adjacent to thyroid tumors that were removed at surgery.Tissues were obtained from the University of Cincinnati tissue bank. Theuse of deidentified anonymous human thyroid was approved by the Uni-versity of Cincinnati institutional review board. Tissue was minced and
incubated in 200 U/ml collagenase solution for 1 h at 37˚C. Cells wereharvested and cultured in DMEM supplemented with 10% FBS, penicillin(100 U/ml), and streptomycin (100 mg/ml) (P0). Cells were passaged at 1:2dilution and cultured until confluent (P1). P1 or P2 cells were used forexperiments. Cells were confirmed to be thyroid cells by Western blotanalysis for thyroglobulin (Tg) (data not shown).
Thewell-differentiated, nontransformed rat thyroid cell line, PCCL3, wasprovided by J. Fagin (Memorial Sloan-Kettering Cancer Center) and prop-agated in H4 complete medium, which consisted of Coon’s modificationof Ham’s F12 media containing 5% FBS, glutamine (286 mg/ml), apo-transferrin (5 mg/ml), hydrocortisone (10 nmol/l), insulin (10 mg/ml), TSH(10mIU/ml), penicillin, and streptomycin. Cells were cultured at 37˚C in 5%CO2; mediumwas replaced every 48 h. Cells were counted with a Z1 CoulterCounter Cell and Particle Counter (Beckman Coulter, Fullerton, CA).
Real-time QPCR
Total cellular RNA was extracted from rat tissues and cells using TRIzolreagent (21). For cell culture and RNAseq confirmation QPCR experi-ments, 5 mg RNA was used to synthesize cDNA by StrataScript QPCRcDNA synthesis kit. mRNA levels were measured by real-time QPCRusing a SmartCycler System (Cepheid, Sunnyvale, CA) using the primersshown in Supplemental Table 3 and SYBR Green for detection ofamplicon. For QPCR determination of mRNA expression levels of dif-ferent genes, cDNAwas obtained from 1 mg RNA using the Superscript IIIfirst-strand cDNA synthesis kit (Invitrogen), and RT-PCR was performedusing an ABI 7300 machine and TaqMan probe system (Applied Bio-systems, Foster City, CA). The IFN-a gene does not contain introns (22)and, therefore, intron-spanning primers could not be provided by AppliedBiosystems. Accordingly, after RNA extraction and before cDNA syn-thesis, the RNA preparation was treated with DNase using the reagent kit,Turbo DNA-free (Ambion, Austin, TX), according to instructions, andthen reverse transcribed. The primers used to measure mIFN-a levels wereobtained from the inventoried set available from ABI (mIFN-a2, assayID: Mm00833961_s1). The reference gene was mouse b-actin (mouseACTB, VIC-MGB, ID: 4362341E-0708008). Other RNAs assayed usinginventoried Applied Biosystems primer/probe mixes included the follow-ing: mouse OAS1a (ID: 00836412.m1); mouse granzyme B (Mn00442874.m1); mouse tripartite motif containing (TRIM)21 (Mn00447364.m1);mouse CXCL10 (Mn9999072.m1); rat CXCL10 (Rn00594648.m1); ratgranzyme B (Rn00821752.gi); human OAS1 (Hs00973635.A1); humanTRIM21 (Hs001726.m1); and human granzyme B (Hs00188051.m1).Reactions were performed in triplicate. For time– and dose–courseexperiments, normalized expression was determined by applying the cyclethreshold (Ct) values for target and reference genes to the Q-Gene program(23) (Figs. 8, 9). For the QPCR experiments performed to confirm theRNAseq results (Supplemental Table 2), we calculated the 2DDCt, asfollows: Ct values of tested genes were first normalized to the Ct values ofb-actin to obtain a DCt (i.e., Ct of tested gene 2 Ct of b-actin). The DCtvalue of the wild-type (WT) mice was then subtracted from the DCt valueof the TG mice for the same gene. The obtained value of DDCt is equal tothe negative of the logarithm base 2 of the ratio of mRNA levels in the TGmice to mRNA levels in the WT mice, and therefore, the 2DDCt value isshown in Supplemental Table 2 for consistency with the RNAseq results.
Transient transfection of cell lines
Transient transfection of cell lines was performed using the Lipofectamin2000 kit, according to the manufacturer’s instructions.
Flow cytometry
PCCL3 rat thyroid cells were seeded into 6-cm dishes. Cells were harvestedin PBS, washed with PBS, and resuspended in FCM wash buffer supple-mented with 0.02% sodium azide. For detection of MHC class I, cells (53105) were incubated for 30 min at 4˚C with 10 ml FITC-conjugated mouseanti-rat MHC class I mAb or FITC-conjugated nonspecific IgG1 controland washed twice. For TSHR, 5 3 105 cells were incubated with 1 mgmouse anti-human TSHR Ab (or control IgG1) for 30 min at 4˚C andwashed twice with FCM wash buffer, followed by incubation with PE-conjugated goat anti-mouse IgG (1:200). Ab binding was quantified byflow cytometry (mean fluorescence intensity), using a COULTER EPICSXL-MCL flow cytometer (Beckman Coulter).
MTT assay
PCCL3 thyroid cells or human thyroid primary cells were plated into 90 six-well plates at 3 3 103 or 1 3 104 cells/well and treated with variousconcentrations of IFN-a for 48 h. Cell viability was measured by MTTassay, as previously described (24).
4694 AUTOIMMUNITY-INDUCED THYROIDITIS
by guest on August 4, 2018
http://ww
w.jim
munol.org/
Dow
nloaded from

Apoptosis assay
PCCL3 rat thyroid cells or human thyroid primary cells were cultured in 6-cm dishes and treated with IFN-a for 48 h. Cells were harvested andwashed in cold PBS. Necrotic and apoptosis cells were measured by aVybrant apoptosis assay kit 3 (Invitrogen).
Thyroid transcriptome analysis in IFN-a TG thyroids and inprimary human thyroid cells exposed to IFN-a
High throughput next generation sequencing for mRNA quantitation. Hu-man thyroid primary cells were grown, as described above, and exposed to5000 U/ml IFN-a for 12 and 24 h. Total RNAwas purified from cells usingTRIzol, DNase treated, and electrophoresed to confirm integrity. For theanalysis of mouse thyroid tissues, we used a cohort of TG animals, high-expressing IFN-a line 91 in a ∼75% C57BL/6/25%CBA/J background,which were given T4 supplementation until 6 mo of age, and were thentaken off T4 replacement for ∼2 mo. The animals were sacrificed at 8 moof age. The atrophied, but dissectible thyroids were removed and pooledfor RNA extraction (total of 10 animals). Control thyroids from littermatecontrols of normal size were also pooled for analysis (n = 8). Because ofconstraints related to the small size of the TG thyroids and the cost of theRNAseq, we performed RNAseq of pooled samples. Therefore, to increasethe power of our analyses, the cutoff for significance was adjusted to berobust and the threshold number of sequences required for significance wasincreased (see below). The RNA from the thyroids was extracted using theRNeasy mini kit (Qiagen, Valencia, CA), DNase treated (RNase-freeDNase) (Qiagen), and analyzed for integrity by agarose gel electropho-resis.
RNAseq is a method of transcriptome analysis that consists of se-quencing a cDNA library by high throughput next-generation sequencing.The number of reads aligning to a specific gene sequence is proportional tothe abundance of that gene in the sample from which the cDNA library wasprepared. We used the mRNA-Seq sample preparation kit from Illumina(San Diego, CA), according to the manufacturer’s recommendation. Briefly,mRNAwas extracted from 2 mg total RNA using oligo(dT) magnetic beadsand fragmented at high temperature using divalent cations. A cDNA li-brary compatible with the Illumina next-generation sequencing technologywas then prepared from the fragmented mRNA by reverse transcription,second-strand synthesis, and ligation of specific adapters. The amount ofdsDNA in each library was accurately quantified by spectrofluorometricanalysis using the Qbit system from Invitrogen and diluted to a 10 nMconcentration. Next-generation sequencing was performed on an IlluminaGenome Analyzer IIx, according to the manufacturer’s recommendations,using the Single-Read Cluster Generation Kit v2 and the SBS SequencingKit v3. Image analysis and base calling were conducted in real time by theSDS 2.5/RTA1.5 software. The reads with good quality were aligned toreference sequence databases of human (ucsc hg18) or mouse (mm9) ge-nome, RefSeq exons, splicing junctions, and contamination databases,including ribosome and mitochondria sequences using Burrows-WheelerAligner, and the alignment files in SAM format were generated. Afterfiltering reads mapped to contamination databases, the reads that wereuniquely aligned to each exon and splicing-junction sites were extractedand then counted. The read count for each RefSeq transcript was calculatedby combining the counts for exons and splicing junctions of correspondingtranscript and also normalized to relative abundance in fragments per ki-lobase of exon model per million to compare transcription level amongsamples.
To compare the expression levels of transcripts across samples, the readcounts of transcripts in each sample were normalized by leveling the totalread counts in each sample to the maximum of the read counts in allsamples. The read count data were then formatted into microarray-like datathat could be analyzed using a variety of microarray statistical analysistools. The differentially expressed transcripts were identified using M-A–based random sampling method implemented in DEGseq package inBioConductor (http://bioconductor.org/ packages/2.5/bioc/html/ DEGseq.html). The transcripts were further filtered at .2-fold change and a mini-mum read count of 50 in either condition.
Ingenuity pathway analysis. The differentially expressed transcripts weresubjected to pathway analysis by Ingenuity Pathway Analysis (IPA) system,version 8.6 (http://www.ingenuity.com/). The IPA program identifies bi-ological networks and/or pathways representing interactions between thedifferentially expressed genes in the tested samples and/or with other genesin the database. The fold changes of these genes were converted to log2-Ratio and then imported into the IPA tool along with gene symbols.Fisher’s exact test was used to calculate a p value for the probability thata pathway was significantly enriched in input genes compared with thegenome, and the pathways/networks were ranked by the p values. The
significance level and the percentages of upregulated or downregulatedgenes of each pathway were summarized in scale bar charts (Fig. 6). Thegraphical presentation of gene–gene interactions and deregulated genes forenriched pathways were visualized in Canonical Pathway Explorer (Fig. 7).
Thyroid function tests
TSH assay was performed by S. Refetoff and R. Weiss (Division of En-docrinology, University of Chicago), as previously described (25). Whereasnormal range for adult mice is strain and gender specific for most strains,TSH ,10 mU/ml is normal. The intra-assay and interassay coefficients ofvariations at the higher range of the assay are 10 and 24%, respectively.Total T4 levels were measured from blood spotted on filter paper using theneonatal T4 kit (Diagnostic Products, Los Angeles, CA), according to themanufacturer’s instructions. Normal range for total T4 was 2–8 mg/dl.
Maintaining the lines on T4 supplementation
Following documentation of profound hypothyroidism in the high-ex-pressing IFN-a TG line, the animals’ chow was changed to Modified Pico-Lab Rodent 20/250 ppm thyroid powder (TestDiet, Greenfield, IN).
ELISA for measurement of serum IFN-a levels
The serum levels of mIFN-a were determined by using a mIFN-a ELISAkit from PBL Biomedical Laboratories (Piscataway, NJ), according to themanufacturer’s instructions.
Thyroid histology and immunocytochemistry
After sacrifice, the thyroids were dissected in two of the following ways: 1)most thyroid specimens were dissected with the overlying strap musclesremoved; 2) nonthyroid hormone-treated thyroid specimens from the twohigh-expressing IFN-a lines were dissected with inner layer of overlyingmuscles unperturbed due to inflammatory changes in the surrounding tissue.Gross thyroid images were using a Leica E24 stereoscopic microscope atvariable magnification; digital images were captured using a Nikon Coolpix950 camera. For routine H&E staining, the trachea were cut above andbelow the area of the thyroid and the tissue was placed as a block into 10%formalin for at least 48 h for tissue fixation, followed by storage in 70%ethanol. After embedding in paraffin, standard 5-mm sections were obtainedfor staining. For immunocytochemistry, dissected tissues were embedded inOCT, sectioned, and placed onto slides. Prior to staining, slides were refixedin cold PBS containing 0.2% glutaraldehyde for 10 min. After staining,slides were washed in PBS, dehydrated through an ethanol series, and thencoverslipped. Immunochemistry was performed by the Comparative Pa-thology Core at University of Cincinnati College of Medicine, Departmentof Pathology. Positive control for each of the three primary immune cellclasses, CD3e (T cells), CD45R/B220 (B cells), and F4/80-like receptor(macrophages), were spleen sections processed identically and from thesame group of animals used for immunocytochemistry. Serial dilutions ofthe primary Ab were performed with the spleen sections to optimize specificsignal versus background, followed by simultaneous of spleen and thyroidtissue section on the same slides under identical conditions. Final concen-trations of primary Ab were as follows: CD3e, 1:200; CD45R/B220, 1:5000;F4/80-like receptor, 1:200. Sections were visualized using an OlympusBX51 microscope; digital image captured using a Diagnostic Instrumentsdigital camera, Model 74 Slider; and image saved digitally using SpotAdvanced Diagnostic Instruments software Windows version 4.6.
ResultsIFN-aR expression in different tissues and effects of IFN-a onthyroid-specific gene expression
To ascertain whether IFN-a can exert biological effects on thyroidcells, we first confirmed that IFN-aR was expressed in the thyroid.Eleven human tissues were analyzed by QPCR for IFN-aR geneexpression. Liver tissues showed the highest expression levels ofIFN-aR (26). Interestingly, thyroid tissues showed the secondhighest levels of expression of IFN-aR among the tissues exam-ined (Fig. 1A). We next examined the effects of IFN-a on theexpression of the following thyroid-specific genes: TSHR, Tg,thyroid peroxidase (TPO), and sodium iodide symporter (NIS).We used the MHC class I gene, known to be upregulated by IFN-a, as positive control. PCCL3 cells (a differentiated rat thyroidcell line) were incubated with rat IFN-a. Both dose-dependentresponses and time-dependent responses were assessed. Time–
The Journal of Immunology 4695
by guest on August 4, 2018
http://ww
w.jim
munol.org/
Dow
nloaded from

course experiments performed with a constant IFN-a concentra-tion of 5000 U/ml showed a peak expression of TSHR mRNA at24 h that persisted through 48 h (Fig. 1B). The increase in TSHRwas also apparent at the protein level, as determined by FACSanalysis (Fig. 1C). Similarly, the expression levels of Tg, TPO,and NIS mRNAwere significantly increased at 24 h by IFN-a; Tgexpression persisted even at the 48-h time point, but the expres-sion levels of TPO and NIS decreased to baseline by 48 h (Fig.1D–F). To analyze the mechanism of increased expression ofthyroid-specific genes, promoter activities were determined bya luciferase assay for Tg, TPO, and NIS. PCCL3 cells weretransfected with luciferase reporter plasmids, pTg-Luc, pTPO-Luc, and pNIS-Luc, to determine promoter activities of Tg,TPO, and NIS, respectively. pGL4.10 was used as a negativecontrol. Only the Tg promoter showed a significant increase inactivity induced by IFN-a (p , 0.05), suggesting that TPO andNIS are upregulated by IFN-a through other mechanisms. Finally,as expected, there was a dose-dependent and time-dependent in-crease in the expression of MHC class I mRNAwhen PCCL3 cellswere incubated with rat IFN-a (Fig. 1G, 1H), as well as at theprotein level (Fig. 1I).
Effects of IFN-a on thyroid cell survival
To test our hypothesis that IFN-a is directly toxic to thyroid cells,we investigated the effect of IFN-a on thyrocyte viability in cul-
tured thyroid cells. A significant IFN-a dose-dependent decrease
in cell viability was seen in both PCCL3 rat and human thyroid
cells in primary cultures, with maximum cell death occurring at
concentrations of 5000 U/ml IFN-a (Fig. 2A, 2B). To determine
whether IFN-a–induced thyroid cell death was caused by apo-
ptosis or necrosis, thyrocytes were treated with 5000 U/ml IFN-a
for up to 48 h and analyzed by the Vybrant apoptosis assay kit.
Both PCCL3 and human thyroid cells (in primary culture) showed
significant increase in necrotic cell numbers at 24 and 48 h of IFN-
a treatment, but apoptotic cell numbers were unchanged (Fig. 2C,
2D). mRNA levels of caspase-3 (the major mediator of apoptosis)
were also measured by QPCR. Whereas a trend toward increased
caspase-3 levels was seen during IFN-a treatment of PCCL 3
cells, this change was not statistically significant (Fig. 2E). A third
mechanism of cell death, autophagy (27, 28), involving inhibition
of the mammalian target of rapamycin signaling pathway (29),
was tested by measuring S6K phosphorylation. There was no
FIGURE 1. Levels of IFN-aR in thyroid cells and effects of IFN-a on thyroid–Ag expression. A, RNA from 11 human tissues was reverse transcribed
and cDNA quantified by IFN-a QPCR analysis. B, Time course of TSHR mRNA. Cells were treated with 5,000 U/ml rat IFN-a, and the TSHR mRNA
expression was analyzed by QPCR at 0, 6, 24, and 48 h. C, FACS analysis of TSHR on PCCL3 cells treated with IFN-a, 5,000 U/ml, for 24 h. D–F, Time-
course experiments of Tg (D), TPO (E), and NIS (F) mRNA levels (determined by QPCR) in PCCL3 cells treated with 5,000 U/ml IFN-a for 48 h. G,
Dose–response curve of MHC class I. PCCL3 cells were incubated with the following increasing concentrations of rat IFN-a: 500, 1,000, 5,000, and 10,000
U/ml. H, Time course of MHC class I mRNA levels in PCCL3 cells incubated with 5,000 U/ml rat IFN-a for 0–48 h. I, FACS analysis showing increase in
levels of MHC class I in thyroid cells incubated with IFN-a, 5,000 U/ml. Results are from one independent experiment, and each data point represents
triplicates, except for A, in which there was only one sample per tissue (*p , 0.05, **p , 0.01, ***p , 0.005).
4696 AUTOIMMUNITY-INDUCED THYROIDITIS
by guest on August 4, 2018
http://ww
w.jim
munol.org/
Dow
nloaded from
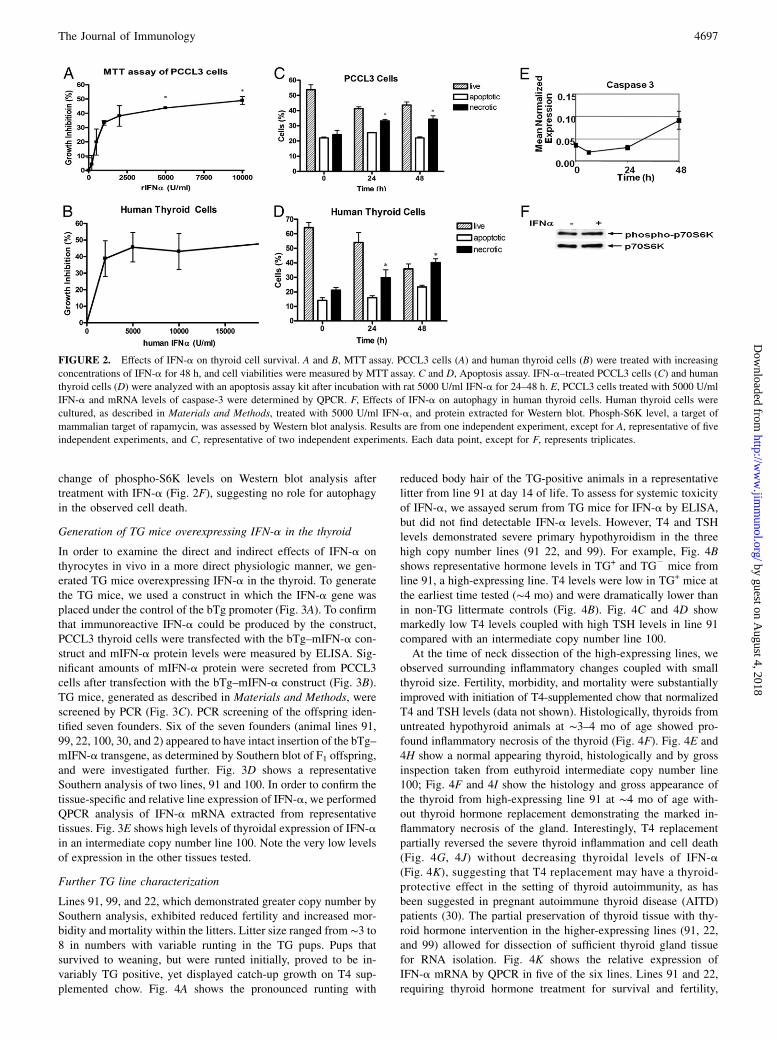
change of phospho-S6K levels on Western blot analysis aftertreatment with IFN-a (Fig. 2F), suggesting no role for autophagyin the observed cell death.
Generation of TG mice overexpressing IFN-a in the thyroid
In order to examine the direct and indirect effects of IFN-a onthyrocytes in vivo in a more direct physiologic manner, we gen-erated TG mice overexpressing IFN-a in the thyroid. To generatethe TG mice, we used a construct in which the IFN-a gene wasplaced under the control of the bTg promoter (Fig. 3A). To confirmthat immunoreactive IFN-a could be produced by the construct,PCCL3 thyroid cells were transfected with the bTg–mIFN-a con-struct and mIFN-a protein levels were measured by ELISA. Sig-nificant amounts of mIFN-a protein were secreted from PCCL3cells after transfection with the bTg–mIFN-a construct (Fig. 3B).TG mice, generated as described in Materials and Methods, werescreened by PCR (Fig. 3C). PCR screening of the offspring iden-tified seven founders. Six of the seven founders (animal lines 91,99, 22, 100, 30, and 2) appeared to have intact insertion of the bTg–mIFN-a transgene, as determined by Southern blot of F1 offspring,and were investigated further. Fig. 3D shows a representativeSouthern analysis of two lines, 91 and 100. In order to confirm thetissue-specific and relative line expression of IFN-a, we performedQPCR analysis of IFN-a mRNA extracted from representativetissues. Fig. 3E shows high levels of thyroidal expression of IFN-ain an intermediate copy number line 100. Note the very low levelsof expression in the other tissues tested.
Further TG line characterization
Lines 91, 99, and 22, which demonstrated greater copy number bySouthern analysis, exhibited reduced fertility and increased mor-bidity and mortality within the litters. Litter size ranged from ∼3 to8 in numbers with variable runting in the TG pups. Pups thatsurvived to weaning, but were runted initially, proved to be in-variably TG positive, yet displayed catch-up growth on T4 sup-plemented chow. Fig. 4A shows the pronounced runting with
reduced body hair of the TG-positive animals in a representativelitter from line 91 at day 14 of life. To assess for systemic toxicityof IFN-a, we assayed serum from TG mice for IFN-a by ELISA,but did not find detectable IFN-a levels. However, T4 and TSHlevels demonstrated severe primary hypothyroidism in the threehigh copy number lines (91 22, and 99). For example, Fig. 4Bshows representative hormone levels in TG+ and TG2 mice fromline 91, a high-expressing line. T4 levels were low in TG+ mice atthe earliest time tested (∼4 mo) and were dramatically lower thanin non-TG littermate controls (Fig. 4B). Fig. 4C and 4D showmarkedly low T4 levels coupled with high TSH levels in line 91compared with an intermediate copy number line 100.At the time of neck dissection of the high-expressing lines, we
observed surrounding inflammatory changes coupled with smallthyroid size. Fertility, morbidity, and mortality were substantiallyimproved with initiation of T4-supplemented chow that normalizedT4 and TSH levels (data not shown). Histologically, thyroids fromuntreated hypothyroid animals at ∼3–4 mo of age showed pro-found inflammatory necrosis of the thyroid (Fig. 4F). Fig. 4E and4H show a normal appearing thyroid, histologically and by grossinspection taken from euthyroid intermediate copy number line100; Fig. 4F and 4I show the histology and gross appearance ofthe thyroid from high-expressing line 91 at ∼4 mo of age with-out thyroid hormone replacement demonstrating the marked in-flammatory necrosis of the gland. Interestingly, T4 replacementpartially reversed the severe thyroid inflammation and cell death(Fig. 4G, 4J) without decreasing thyroidal levels of IFN-a(Fig. 4K), suggesting that T4 replacement may have a thyroid-protective effect in the setting of thyroid autoimmunity, as hasbeen suggested in pregnant autoimmune thyroid disease (AITD)patients (30). The partial preservation of thyroid tissue with thy-roid hormone intervention in the higher-expressing lines (91, 22,and 99) allowed for dissection of sufficient thyroid gland tissuefor RNA isolation. Fig. 4K shows the relative expression ofIFN-a mRNA by QPCR in five of the six lines. Lines 91 and 22,requiring thyroid hormone treatment for survival and fertility,
FIGURE 2. Effects of IFN-a on thyroid cell survival. A and B, MTT assay. PCCL3 cells (A) and human thyroid cells (B) were treated with increasing
concentrations of IFN-a for 48 h, and cell viabilities were measured by MTT assay. C and D, Apoptosis assay. IFN-a–treated PCCL3 cells (C) and human
thyroid cells (D) were analyzed with an apoptosis assay kit after incubation with rat 5000 U/ml IFN-a for 24–48 h. E, PCCL3 cells treated with 5000 U/ml
IFN-a and mRNA levels of caspase-3 were determined by QPCR. F, Effects of IFN-a on autophagy in human thyroid cells. Human thyroid cells were
cultured, as described in Materials and Methods, treated with 5000 U/ml IFN-a, and protein extracted for Western blot. Phosph-S6K level, a target of
mammalian target of rapamycin, was assessed by Western blot analysis. Results are from one independent experiment, except for A, representative of five
independent experiments, and C, representative of two independent experiments. Each data point, except for F, represents triplicates.
The Journal of Immunology 4697
by guest on August 4, 2018
http://ww
w.jim
munol.org/
Dow
nloaded from

demonstrated markedly high IFN-a expression in a range similarto the two intermediate-expressing lines 100 and 30 that were noton T4 replacement therapy at the time of sacrifice at ∼4 mo of age.Interestingly, attempts to backcross high-expressing lines, ini-
tially in a predominantly C57BL/6 background, to a CBA/J back-ground, a strain known to be susceptible to autoimmune thyroiditis(31), were unsuccessful. Even on thyroid hormone replacement,litters were infrequent and small in numbers, and most of thepups were runted and did not survive. However, intermediate-expressing lines (lines 100 and 30) and a low-expressing line(line 2) were successfully backcrossed up to six generations toCBA/J without obvious fertility or viability challenges. Takentogether, these data support the hypothesis that local IFN-a pro-duction in a susceptible individual can induce thyroiditis andthyroid dysfunction.
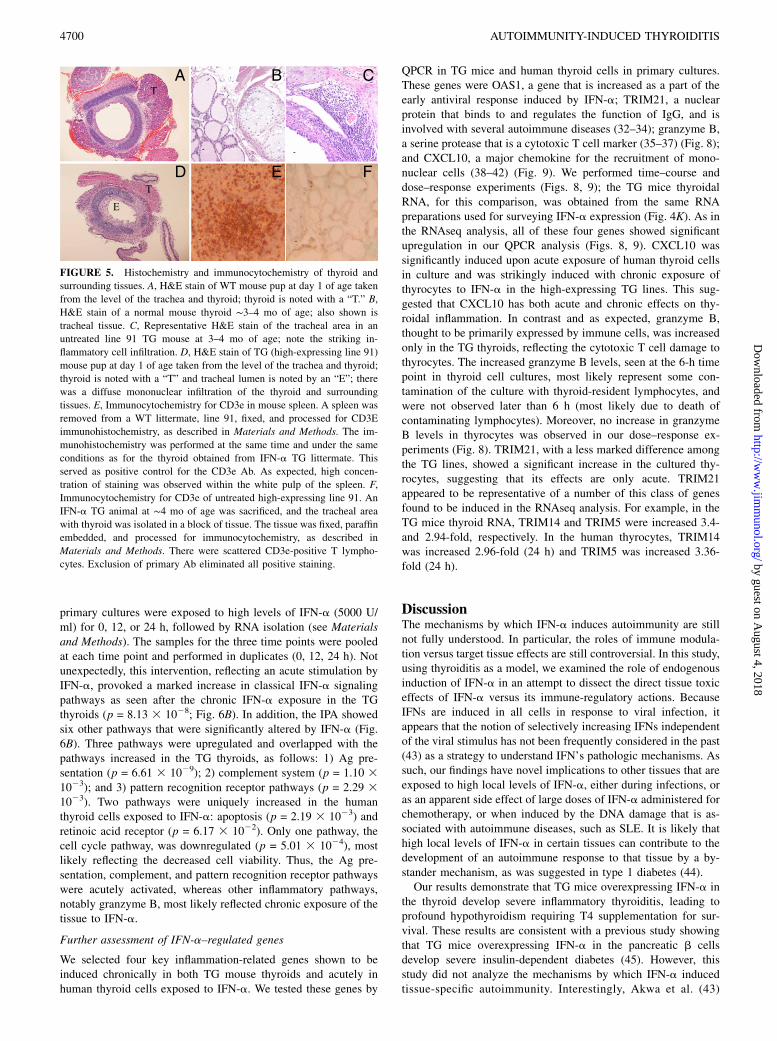
Immunohistochemical analyses of TG thyroids
To study the contribution of immune cell infiltration to the thyroidaldestructive processes, representative thyroids from normal-, in-
termediate-, and high-expressing IFN-a lines, ages 3–4 mo old,were processed for H&E histochemistry as well as immunocyto-
chemistry for specific immune cell markers. Fig. 5B depicts
normal-appearing histology from a WT thyroid for comparison.
There were inflammatory infiltrates in tissues surrounding the
thyroid glands of high-expressing lines (Fig. 5C), suggesting a
strong thyroidal chemokine response. Examination of thyroids of
high expressors showed no detectable intrathyroidal staining
for macrophages (F4/80-like receptor) or B cells (CD45R/B220).
There was, however, consistent, but infrequent and scattered pre-
sence of cells staining positively for the T cell marker, CD3e (Fig.
5F). Hypothesizing that at the time of sacrifice most infil-
trating mononuclear cells have disappeared as the thyroid was
almost completely necrotic, we analyzed thyroids of 1-day-old
pups from high-expressing lines 22 and 91 and their WT litter-
mates. Fig. 5D reveals marked inflammatory infiltration of the
thyroid and surrounding tissues from a TG line 91 animal; cor-
responding tissue section from a WT pup is shown in Fig. 5A.
FIGURE 3. Construct and generation of TG mice. A, Transgene construct. Transgene construct comprised of the bTg promoter, rabbit b-globin intron 1,
T7 promoter, mIFN-a cDNA, and SV40 polyadenylation signal. B, mIFN-a protein levels in PCCL3 rat thyroid cells transfected with bTg–mIFN-a
construct, determined by ELISA. White scale bar, mIFN-a levels in the medium of cells transfected with empty plasmid (negative control); black scale bar,
mIFN-a levels in the medium of cells transfected with bTg–mIFN-a; gray scale bar, mIFN-a levels in the medium of cells transfected with CMV–mIFN-a
(positive control). C, PCR screening of tail genomic DNA from a representative line, 91. The presence of the transgene generated an amplicon of ∼0.4 kb;
the internal reference TSHR control gene size is ∼0.2 kb. D, Southern blot analysis of genomic DNA. A total of 10 mg of tail DNAwas doubled digested
with BamHI and SalI, electrophoresed, and hybridized with the 3.6-kb construct labeled with 32P. A representative high-expressing line (line 91) is
compared with a representative intermediate copy number line (line 100). E, Relative tissue-specific expression of IFN-a determined by QPCR. Shown are
the IFN-a levels in line 100; the tissues were from an animal ∼4 mo of age. Results from B are from one independent experiment, and each data point
represents triplicates. Results from E represent the profile of the tissue from one line 100 animal, but are representative of three independent experiments.
As detailed in Materials and Methods, the expression of the target gene, IFN-a, was normalized to b-actin.
4698 AUTOIMMUNITY-INDUCED THYROIDITIS
by guest on August 4, 2018
http://ww
w.jim
munol.org/
Dow
nloaded from

Effects of IFN-a on thyroid transcriptome
To elucidate potential mechanisms by which IFN-a leads to de-structive thyroiditis in the TG mice, we performed a transcriptomeanalysis comparing the entire thyroid transcriptome in the TGmice and the WT mice. A cohort of TG mice and a selection ofnon-TG WT littermates from the high-expressing IFN-a line 91without thyroid hormone replacement for ∼2 mo were sacrificed at∼8 mo of age, and the thyroids were dissected. The small size ofthe TG thyroids necessitated their pooling (see Materials andMethods) prior to RNA extraction. RNA was isolated, and thetranscriptome was analyzed by RNAseq (see Materials andMethods), a method that allows for greater sensitivity, specificity,and dynamic range than hybridization-based expression micro-arrays, while providing the potential for characterizing the ex-pression of all transcripts in a given RNA sample. Bioinformaticpathway analysis of the RNAseq data was performed by the IPAprogram (Ingenuity Systems, Redwood City, CA), and the data areavailable using Gene Expression Omnibus accession GSE25115 athttp://www.ncbi.nlm.nih.gov/geo/query/acc.cgi?acc=GSE25115.As expected and corroborating the marked induction of IFN-aprotein in the TG thyroids, the classical IFN-a signaling pathwayswere upregulated in the IFN-a TG mice (p = 7.08 3 1028; Fig.
6A). In addition to the IFN-a pathway, four other pathways werealso significantly upregulated, as follows: Ag presentation (p =
5.13 3 1026), complement system (p = 5.25 3 1023), granzyme
B (p = 3.89 3 1022), and pattern recognition receptor (p = 2.0431023). In addition, the IL-6 pathway was upregulated, but to a
smaller degree, with significant upregulation of the IL-6R (2.6-fold
increase), albeit the expression of the IL-6 gene itself was not
increased. Two pathways, arachidonic acid metabolism (p = 1.9531024) and fatty acid metabolism (p = 1.00 3 1022), were down-
regulated. Supplemental Table I lists individual genes upregulated
or downregulated with the pathways identified by Ingenuity;
Supplemental Table 2 shows the results of a subset of genes
selected to confirm the validity of the RNseq results by standard
QPCR. In all the genes selected for confirmation, QPCR mRNA
levels matched the RNseq data (Supplemental Table 2). Fig. 7
depicts a representative detailed outline of one of the most signi-
ficantly upregulated canonical pathways, Ag presentation.To determine whether the transcriptome results in the TG mice
reflected acute or chronic changes induced by IFN-a, we de-termined whether pathways that were affected in the TG micemight also be regulated in human thyroid follicular cells exposedto IFN-a for 12 and 24 h. Human thyroid follicular cells in
FIGURE 4. Phenotype of TG animals. A, Typical appearance of a litter from an IFN-a high-expressing line 91; the figure depicts a day 14 litter. The two
runted pups with reduced body fur are IFN-a TG; B, thyroid functions as a function of age in TG and non-TG littermates from line 91 (high expressing).
Animals were sacrificed and serum was obtained for T4, as described in Materials and Methods. C and D, Blood, obtained from a set of animals from
a high-expressing line 91 and intermediate-expressing line 100, was tested simultaneously for T4 and TSH levels at ∼3–4 mo of age. E–J, Histology
matched with gross appearance. E, Histology of a normal thyroid. H&E stain of thyroid follicles (scale bar, 44 mm). H, Macroscopic anatomy of a normal
thyroid; F, high-expressing line 91 thyroid without T4 replacement (scale bar, 20 mm); I, macroscopic anatomy of a right lobe of line 91 thyroid without
thyroid hormone treatment; G, line 91 thyroid with T4 treatment (scale bar, 20 mm). J, Macroscopic anatomy of a line 91 thyroid on T4 replacement
therapy. K, IFN-a mRNA levels in thyroids from TG mice on T4 replacement. Thyroids were isolated from IFN-a TG line animals at ∼3–4 mo of age. The
high-expressing line 91 and 22 animals were treated with T4-supplemented chow from the time of weaning and were confirmed to be euthyroid at time of
sacrifice. Because of the smaller, but dissectible size of the high-expressing line thyroids, these lobes were pooled (designated by “P”). Otherwise, the
numbers above the scale bars represent the specific number of animal thyroids. Target gene, IFN-a, was normalized to b-actin. Scale bars, 20 mm.
The Journal of Immunology 4699
by guest on August 4, 2018
http://ww
w.jim
munol.org/
Dow
nloaded from
primary cultures were exposed to high levels of IFN-a (5000 U/ml) for 0, 12, or 24 h, followed by RNA isolation (see Materialsand Methods). The samples for the three time points were pooledat each time point and performed in duplicates (0, 12, 24 h). Notunexpectedly, this intervention, reflecting an acute stimulation byIFN-a, provoked a marked increase in classical IFN-a signalingpathways as seen after the chronic IFN-a exposure in the TGthyroids (p = 8.13 3 1028; Fig. 6B). In addition, the IPA showedsix other pathways that were significantly altered by IFN-a (Fig.6B). Three pathways were upregulated and overlapped with thepathways increased in the TG thyroids, as follows: 1) Ag pre-sentation (p = 6.61 3 1029); 2) complement system (p = 1.10 31023); and 3) pattern recognition receptor pathways (p = 2.29 31023). Two pathways were uniquely increased in the humanthyroid cells exposed to IFN-a: apoptosis (p = 2.19 3 1023) andretinoic acid receptor (p = 6.17 3 1022). Only one pathway, thecell cycle pathway, was downregulated (p = 5.01 3 1024), mostlikely reflecting the decreased cell viability. Thus, the Ag pre-sentation, complement, and pattern recognition receptor pathwayswere acutely activated, whereas other inflammatory pathways,notably granzyme B, most likely reflected chronic exposure of thetissue to IFN-a.
Further assessment of IFN-a–regulated genes
We selected four key inflammation-related genes shown to beinduced chronically in both TG mouse thyroids and acutely inhuman thyroid cells exposed to IFN-a. We tested these genes by
QPCR in TG mice and human thyroid cells in primary cultures.These genes were OAS1, a gene that is increased as a part of theearly antiviral response induced by IFN-a; TRIM21, a nuclearprotein that binds to and regulates the function of IgG, and isinvolved with several autoimmune diseases (32–34); granzyme B,a serine protease that is a cytotoxic T cell marker (35–37) (Fig. 8);and CXCL10, a major chemokine for the recruitment of mono-nuclear cells (38–42) (Fig. 9). We performed time–course anddose–response experiments (Figs. 8, 9); the TG mice thyroidalRNA, for this comparison, was obtained from the same RNApreparations used for surveying IFN-a expression (Fig. 4K). As inthe RNAseq analysis, all of these four genes showed significantupregulation in our QPCR analysis (Figs. 8, 9). CXCL10 wassignificantly induced upon acute exposure of human thyroid cellsin culture and was strikingly induced with chronic exposure ofthyrocytes to IFN-a in the high-expressing TG lines. This sug-gested that CXCL10 has both acute and chronic effects on thy-roidal inflammation. In contrast and as expected, granzyme B,thought to be primarily expressed by immune cells, was increasedonly in the TG thyroids, reflecting the cytotoxic T cell damage tothyrocytes. The increased granzyme B levels, seen at the 6-h timepoint in thyroid cell cultures, most likely represent some con-tamination of the culture with thyroid-resident lymphocytes, andwere not observed later than 6 h (most likely due to death ofcontaminating lymphocytes). Moreover, no increase in granzymeB levels in thyrocytes was observed in our dose–response ex-periments (Fig. 8). TRIM21, with a less marked difference amongthe TG lines, showed a significant increase in the cultured thy-rocytes, suggesting that its effects are only acute. TRIM21appeared to be representative of a number of this class of genesfound to be induced in the RNAseq analysis. For example, in theTG mice thyroid RNA, TRIM14 and TRIM5 were increased 3.4-and 2.94-fold, respectively. In the human thyrocytes, TRIM14was increased 2.96-fold (24 h) and TRIM5 was increased 3.36-fold (24 h).
DiscussionThe mechanisms by which IFN-a induces autoimmunity are stillnot fully understood. In particular, the roles of immune modula-tion versus target tissue effects are still controversial. In this study,using thyroiditis as a model, we examined the role of endogenousinduction of IFN-a in an attempt to dissect the direct tissue toxiceffects of IFN-a versus its immune-regulatory actions. BecauseIFNs are induced in all cells in response to viral infection, itappears that the notion of selectively increasing IFNs independentof the viral stimulus has not been frequently considered in the past(43) as a strategy to understand IFN’s pathologic mechanisms. Assuch, our findings have novel implications to other tissues that areexposed to high local levels of IFN-a, either during infections, oras an apparent side effect of large doses of IFN-a administered forchemotherapy, or when induced by the DNA damage that is as-sociated with autoimmune diseases, such as SLE. It is likely thathigh local levels of IFN-a in certain tissues can contribute to thedevelopment of an autoimmune response to that tissue by a by-stander mechanism, as was suggested in type 1 diabetes (44).Our results demonstrate that TG mice overexpressing IFN-a in
the thyroid develop severe inflammatory thyroiditis, leading toprofound hypothyroidism requiring T4 supplementation for sur-vival. These results are consistent with a previous study showingthat TG mice overexpressing IFN-a in the pancreatic b cellsdevelop severe insulin-dependent diabetes (45). However, thisstudy did not analyze the mechanisms by which IFN-a inducedtissue-specific autoimmunity. Interestingly, Akwa et al. (43)
FIGURE 5. Histochemistry and immunocytochemistry of thyroid and
surrounding tissues. A, H&E stain of WT mouse pup at day 1 of age taken
from the level of the trachea and thyroid; thyroid is noted with a “T.” B,
H&E stain of a normal mouse thyroid ∼3–4 mo of age; also shown is
tracheal tissue. C, Representative H&E stain of the tracheal area in an
untreated line 91 TG mouse at 3–4 mo of age; note the striking in-
flammatory cell infiltration. D, H&E stain of TG (high-expressing line 91)
mouse pup at day 1 of age taken from the level of the trachea and thyroid;
thyroid is noted with a “T” and tracheal lumen is noted by an “E”; there
was a diffuse mononuclear infiltration of the thyroid and surrounding
tissues. E, Immunocytochemistry for CD3e in mouse spleen. A spleen was
removed from a WT littermate, line 91, fixed, and processed for CD3E
immunohistochemistry, as described in Materials and Methods. The im-
munohistochemistry was performed at the same time and under the same
conditions as for the thyroid obtained from IFN-a TG littermate. This
served as positive control for the CD3e Ab. As expected, high concen-
tration of staining was observed within the white pulp of the spleen. F,
Immunocytochemistry for CD3e of untreated high-expressing line 91. An
IFN-a TG animal at ∼4 mo of age was sacrificed, and the tracheal area
with thyroid was isolated in a block of tissue. The tissue was fixed, paraffin
embedded, and processed for immunocytochemistry, as described in
Materials and Methods. There were scattered CD3e-positive T lympho-
cytes. Exclusion of primary Ab eliminated all positive staining.
4700 AUTOIMMUNITY-INDUCED THYROIDITIS
by guest on August 4, 2018
http://ww
w.jim
munol.org/
Dow
nloaded from

demonstrated that TG mice overexpressing IFN-a in the CNSdeveloped a progressive inflammatory encephalopathy associatedwith a predominantly lymphocytic infiltration and induction ofIFN-a –responsive genes such as MHC class I and OAS1. Wefound a similar inflammatory response in the thyroid accompaniedby inflammatory changes in tissues adjacent to the thyroid, and,more globally, demonstrated that IFN-a activated the Ag pre-sentation, complement, and pattern recognition receptor pathways.These effects would be predicted to induce inflammatory de-struction of the thyroid coupled with direct toxicity potentiallythrough granzyme B–mediated actions.The primary actions of IFN-a in cultured thyroctyes appeared to
be an early increase in the expression of thyroid-specific proteins,a significantly increased activity of several pathways involved ininnate and adaptive immune responses, and, ultimately, markedlyincreased nonapoptotic thyroid cell death. Consistent with thesein vitro findings, TG mice overexpressing IFN-a in the thyroiddisplayed striking destructive changes in the thyroid that weredistinctly exacerbated in an autoimmune-susceptible background.Moreover, the same innate and adaptive immune response path-ways were upregulated in the TG mice. The high local levels ofIFN-a in the thyroid, importantly without evidence for systemicelevation of IFN-a, appear to lead also to nonimmune tissue de-struction, the severity of which is modulated by backgroundautoimmune susceptibility. Our data are consistent with recentstudies demonstrating that cytokines such as IFN-g can directlyinhibit thyrocyte function, and suggest a new mechanism for in-duction of hypothyroidism in the setting intrathyroidal cytokinesecretion (46, 47). Indeed, lymphocytic infiltration of the thyroid
alone may not be sufficient to cause hypothyroidism (48). Eventhough the local levels of IFN-a in the TG mice are significantlyhigher than the serum levels in HCV patients treated with IFN-a,it is likely that the thyroidal levels of IFN-a in patients arehigher than serum levels due to local effect of the HCV virusitself (48).Our in vitro studies demonstrated a consistent IFN-a dose-
dependent increase in thyroid-specific proteins, TPO, NIS, TSHR,and Tg. This induction of thyroid–Ag expression by IFN-a pro-vides an attractive potential mechanism accounting for the devel-opment of autoimmune thyroiditis (49) in the setting of thyroi-dal inflammation [e.g., caused by the HCV virus itself (50)].Specifically, peptides resulting from the degradation of these up-regulated self proteins could be presented to T cells. In support ofthis possibility, a significant increase in Ag presentation pathwaysleading to presentation of thyroid-specific peptides and activationof cytotoxic T cells has been observed in other model systems(51). Thus, the IFN-a–induced upregulation of thyroid-specificAgs and of Ag presentation pathways, coupled with IFN-a–in-duced thyroid cell necrosis observed in our tissue culture andin vivo experiments, could result in the generation and pre-sentation of pathogenic peptides derived from thyroid-specific Ags(see Fig. 10). Of note, a previous study by Caraccio et al. (52)showed decreased thyroid–Ag expression by IFN-a. However, intheir investigation, the experimental conditions were different andthyroid–Ag gene expression was tested at a later time point than inour study, suggesting that the decreased expression observed mostlikely reflected the late thyrocyte necrotic cell death associatedwith IFN-a exposure.
FIGURE 6. IPA of RNAseq expression
data. A, IPA of mRNA expression data
from TG mouse thyroids. Pathway analy-
sis was performed using the Ingenuity
software, as described in Materials and
Methods. Genes that are upregulated are
shown in dark gray, and genes that are
downregulated are shown in light gray.
Significant upregulation of IFN signaling
pathway in TG mice is shown. In addition,
the Ag presentation, pattern recognition
receptor, complement, and granzyme B
pathways are upregulated in TG mice. In
contrast, the fatty acid metabolism and
arachidonic acid metabolism pathways are
significantly downregulated. B, IPA of
mRNA expression data from human thy-
rocytes exposed to IFN-a for 24 h. As
expected, the IFN signaling pathway is
upregulated in cells exposed to IFN-a. In
addition, Ag presentation, complement, and
pattern recognition receptor pathways are
upregulated similar to the TG thyroids. Addi-
tional upregulated pathways include retinoic
acid receptor signaling and retinoic acid–
mediated apoptosis pathways, whereas the
cell cycle pathway is downregulated.
The Journal of Immunology 4701
by guest on August 4, 2018
http://ww
w.jim
munol.org/
Dow
nloaded from

A number of cytokines were increased in the TG mice thyroidsand the cultured human thyrocytes. CXCL10 levels were in par-ticular markedly increased consistent with data showing that bloodlevels of this cytokine are not only in high circulating concentrationsin autoimmune thyroiditis (42), but also correlate with a greaterprobability of thyroid dysfunction in IFN-a–treated HCV patients(39). More recently, Antonelli et al. (53), similar to our studies,have shown that IFN-a markedly induces CXCL10 in culturedhuman thyrocytes. CXCL10 is associated with a number of con-ditions characterized by the recruitment of cytotoxic lymphocytessuch as cutaneous lupus erythematosis (54) and regression ofmelanoma (55). Another relevant cytokine pathway that was in-creased in the TG mice was the IL-6 pathway, a pathway that hasbeen shown to play a role in autoimmune thyroiditis (16, 56).Of particular interest was the finding of a marked induction by
IFN-a of the granzyme B pathway in the TG thyroids. GranzymeB is a cytotoxic T cell marker, and is a part of a well-establishedpathway used by killer lymphocytes to destroy target cells (57).Typically, granzyme B is thought to be injected into target cellsfrom recruited cytotoxic T cells via perforin channels formed on
the cell membrane. Apoptosis rapidly ensues (58). Moreover, re-cent data suggest that granzyme B can degrade target cell proteins;as a result, pathogenic peptides released during the degradationcan augment the autoimmune response (59). This mechanism ofautoimmune tissue destruction has been confirmed to operate inseveral well-characterized autoimmune diseases in which patho-genic peptides are generated, including b cell destruction in type 1diabetes (60), flares of SLE (61), and multiple sclerosis (60). Ourresults suggest that in vivo exposure of the thyroid to increasedIFN-a, as a result of infection or IFN therapy, may induce locallyhigh levels of granzyme B derived from cytotoxic T cells. Thehigh levels of granzyme B may generate pathogenic thyroidalpeptides that can trigger and/or augment a destructive autoimmuneresponse.In the TG mice and cultured human thyrocytes exposed to
IFN-a, we observed cell death without evidence for apoptosis orautophagy and, therefore, by exclusion, it is likely to be by ne-crosis. Cell death can occur by at least three primary mechanisms,as follows: apoptosis, autophagy, and necrosis (62). Apoptosis isa programmed cell death triggered by specific receptors and
FIGURE 7. IPA of the Ag presentation pathway
using RNAseq expression data of mRNA obtained
from TG mouse thyroids. IPA was performed using
the Ingenuity software, as described in Materials and
Methods. Genes that are upregulated are shown in
shades of red (darker red signifies higher expression
levels).
4702 AUTOIMMUNITY-INDUCED THYROIDITIS
by guest on August 4, 2018
http://ww
w.jim
munol.org/
Dow
nloaded from

signaling pathways (63), whereas autophagy is a process of se-questration of cytoplasmic constituents including oganelles thatleads to their eventual degradation in lysosomes and cell death(27). Death by necrosis does not have a uniform definition and isoften identified as the cause of cell death by excluding apoptosisand autophagy. Although the dogma has been that necrosis isa nonprogrammed uncontrolled relatively end-stage form of celldeath, there is growing evidence for the regulation of cell necrosisby discrete signaling pathways (64). In the TG mice, the thyrocytenecrosis might have been induced by cytotoxic T cells; however,our findings in thyrocytes in culture suggested that IFN-a alsoinduced thyroid cell death by direct toxicity.The downregulation of the arachidonic acid and fatty acid
metabolism pathways is not as clearly linked to thyroid in-flammation. This was observed dramatically, but only in the TGthyroid tissue.Whether these changes are epiphenomena or directlyinvolved in the thyroid pathology is not clear, but could representdecreased synthesis of membranes in the cells affected by theinflammatory damage.Interestingly, thyroid tissue destruction increased when the high-
expressing TG lines were backcrossed from a predominantly
C57BL/6 background to an autoimmunity-susceptible CBA/Jbackground. This thyroid destruction, possibly coupled withother harmful inflammatory changes in surrounding tissues, pre-vented the establishment of high-expressing lines on the CBA/J-susceptible background and suggested a strong genetic suscepti-bility to the thyroid toxic effects of IFN-a. This notion is supportedby the observations that the presence of thyroid Abs, considereda preclinical marker of genetic susceptibility to AITD (65), priorto the initiation of IFN-a therapy, is a significant risk factor for thedevelopment of AITD during IFN-a treatment (20). Moreover, wehave shown that injecting IFN-a to NOD H2h4 mice, a straingenetically susceptible to spontaneous autoimmune thyroiditis,caused a higher frequency of autoimmune thyroiditis, supportingthe notion that IFN-a triggers thyroiditis in genetically susceptibleindividuals (66). Finally, one study by our group showed an as-sociation between several immune-regulatory genes and IIT (12).Our results (Supplemental Table 1) demonstrated a broad in-
duction of the TRIM family of proteins. There are .64 membersof the TRIM family in mice (67), and, although primarily de-scribed in the context of the antiviral responses of IFNs (68), theirfunctions have been increasingly linked to an extensive range of
FIGURE 8. QPCR of TG and WT thyroid tissues and in vitro human thyrocyte gene expression of IFN-a–induced genes. Scale bar graphs: QPCR for
OAS-1, granzyme B, and TRIM21. QPCR was performed on representative TG or WT animals 3–4 mo of age from different lines, as indicated in figure,
and used the same cDNAs depicted in Fig. 4K (“P” designates pooled RNA samples; otherwise, the numbers above the scale bars represent the specific
number of animal thyroids). Line graphs, IFN-a dose response and time course for OAS1, granzyme B, and TRIM21 mRNA levels in cultured human
thyrocytes. Human primary cultures of thyroid cells were established, as described in Materials and Methods. Specifically, primary cultures were passed at
a 1:2 dilution into 35-mm dishes. At confluence, media was changed to media without serum in 1% BSA. After 24 h in serum-free conditions, IFN-a was
added from 1003 stocks to achieve a final concentration of 5000 U/ml for time–course experiments (middle panel, x-axis shows hours of incubation with
IFN-a), and at increasing concentrations (500, 1000, 2500, and 5000 U/ml; right panel) for the dose–response experiments. For the dose–response
experiments, cells were incubated with IFN-a for 24 h. RNAwas isolated from the cells, as described in Materials and Methods, and QPCR was performed
(*p , 0.05, **p , 0.01). Results in middle and left panels are from one independent experiment, and each data point represents triplicate wells.
The Journal of Immunology 4703
by guest on August 4, 2018
http://ww
w.jim
munol.org/
Dow
nloaded from

biological actions, including innate immunity. A subset consistingof five members of the TRIM family was found to be increased byRNAseq in the TG thyroids. Of particular interest was TRIM21[also known as Ro52 (69)], a nuclear protein that binds to andregulates the function of IgG, and is a target autoantigen in severalautoimmune diseases, most notably Sjogren’s syndrome and SLE.Moreover, genetic polymorphisms of TRIM21/Ro52 have beenassociated with the onset of Sjogren’s (70) and SLE (71). Morerecently, TRIM/Ro522/2 mice were shown to develop evidence
for SLE that could be reversed by disrupting the IL-23/IL-17pathway, thought to mediate some of the inflammatory changesin SLE (72). Our studies showed a dose- and sustained time-dependent increase of TRM21 in response to IFN-a in culturedhuman thyroctyes and a greater expression in the higher IFN-a–expressing TG lines (Fig. 8).Taken together, our data suggest that IFN-a induces tissue-
specific autoimmunity by direct tissue toxic effects as well as byimmune recruitment bystander mechanisms. The most notable
FIGURE 10. A proposed model for the induction of thyroiditis by IFN-a through direct actions on thyroid cells. The effects of IFN-a involve at least two
primary processes, as follows. 1) The first pathway involves the induction and release of cytokines/chemokines that mediate the recruitment of immune
cells that induce autoimmune cell death. This bystander mechanism can lead to the activation of resident T cells within the thyroid, initiating an auto-
immune response. The induction of granzyme B in the thyroids from TG mice strongly suggested the activation of this well-described pathway of immune-
mediated cell death, which can trigger thyroiditis. This process could be augmented in genetically susceptible individuals. Indeed, backcrossing the TG
animals to the CBA/J thyroiditis-susceptible strain worsened the phenotype, suggesting genetic augmentation of this mechanism. 2) The second pathway
involves a direct toxic action of IFN-a on thyroid cells. The observation of thyroid cell death in vitro and in vivo in the high-expressing lines strongly
suggested direct thyroid toxicity independent of the recruitment of the peripheral immune system. The thyroid-specific effects we observed, upregulation of
thyroid Ags, Ag presentation pathways, and innate immune response pathways, coupled with induction of thyroid cell death by IFN-a, could lead to a T cell
response to the thyroid and development of thyroid autoimmunity.
FIGURE 9. Effect of IFN-a on CXCL10 gene expression levels in TG and WT thyroids and in cultured human thyrocytes. Scale bar graph, QPCR for
CXCL10. QPCR was performed on representative TG or WT animal thyroids from the different lines and used the same cDNAs depicted in Figs. 4K and 8.
“P” designates pooled RNA samples; otherwise, the numbers above the scale bars represent the specific number of animal thyroids. Line graphs, IFN-a
dose response and time course for CXCL10 mRNA levels in cultured human thyrocytes. Human primary cultures of thyroid cells were established, as
described in Materials and Methods. Specifically, primary cultures were passed at a 1:2 dilution into 35-mm dishes. At confluence, media was changed to
media without serum in 1% BSA. After 24 h in serum-free conditions, IFN-a was added from 1003 stocks to achieve a final concentration of 5000 U/ml for
time-course experiments (middle panel), and at increasing concentrations (500, 1000, 2500, and 5000 U/ml; right panel) for the dose–response experiments.
For the dose–response experiments, cells were incubated with IFN-a for 24 h. RNAwas isolated from the cells, as described inMaterials and Methods, and
QPCR was performed. Results for the time–course and dose–response experiments are from one independent experiment. Each data point represents
triplicate wells (*p , 0.05).
4704 AUTOIMMUNITY-INDUCED THYROIDITIS
by guest on August 4, 2018
http://ww
w.jim
munol.org/
Dow
nloaded from

direct thyroid tissue effect in our IIT model was the induction ofthyroid cell necrosis as early as day 1 of age, coupled with in-creased expression of thyroid-specific proteins. The immuneeffects of IFN-a triggered the recruitment of inflammatory cellspresumably by induction of various cytokines and chemokines,such as CXCL10, and activation of cytotoxic T cells, causingthyroid cell necrosis at least in part through the activation of thegranzyme B pathway (Fig. 10). In addition, IFN-a treatment, mostlikely in combination with HCV infection (50), causes early up-regulation of Ag presentation pathways, cytokines/chemokines,and cytotoxic T cells, as well as thyroid-specific Ags (e.g.,TSHR, Tg), followed by late thyroid cell death by necrosis. Ge-netic susceptibility determines whether the ultimate response isautoimmune thyroiditis, destructive necrosis, or resistance. Ingenetically susceptible individuals, these IFN-a–mediated effectstrigger autoimmune thyroiditis (73). The association of IFN-a–induced genes with both an appropriate antiviral response andpathologic autoimmune phenomena demonstrates, as suggested byAkwa et al. (43), that IFN-a is a “two-edged sword” that providesprotection from viral illness and yet can induce tissue injury.Further study of our model of overexpression of IFN-a in thethyroid may help distinguish the beneficial versus destructivecomponents of IFN actions.
AcknowledgmentsWe thank Dr. Robert Franco and Mary Palascak (University of Cincinnati)
for assisting with the FACS analyses, Rita Angel (University of Cincin-
nati) for performing the H&E and immunohistochemistry staining, and
Drs. Roy Weiss and Samuel Refetoff (University of Chicago) for perform-
ing the TSH assays.
DisclosuresThe authors have no financial conflicts of interest.
References1. Golomb, H. M. 2008. Hairy cell leukemia: treatment successes in the past 25
years. J. Clin. Oncol. 26: 2607–2609.2. Palumbo, E. 2009. PEG-interferon in acute and chronic hepatitis C: a review.
Am. J. Ther. 16: 573–578.3. Edwards, M. R., L. Slater, and S. L. Johnston. 2007. Signalling pathways me-
diating type I interferon gene expression. Microbes Infect. 9: 1245–1251.4. Russo, M. W., and M. W. Fried. 2003. Side effects of therapy for chronic hep-
atitis C. Gastroenterology 124: 1711–1719.5. Roti, E., R. Minelli, T. Giuberti, S. Marchelli, C. Schianchi, E. Gardini, M. Salvi,
F. Fiaccadori, G. Ugolotti, T. M. Neri, and L. E. Braverman. 1996. Multiplechanges in thyroid function in patients with chronic active HCV hepatitis treatedwith recombinant interferon-alpha. Am. J. Med. 101: 482–487.
6. Mazziotti, G., F. Sorvillo, A. Carbone, M. Cioffi, F. Morisco, and C. Carella.2002. Is the IFN-alpha-related thyroid autoimmunity an immunologically het-erogeneous disease? J. Intern. Med. 252: 377–378, author reply 379.
7. Villanueva, R. B., and N. Brau. 2002. Graves’ ophthalmopathy associated withinterferon-alpha treatment for hepatitis C. Thyroid 12: 737–738.
8. Crow, M. K., K. A. Kirou, and J. Wohlgemuth. 2003. Microarray analysis ofinterferon-regulated genes in SLE. Autoimmunity 36: 481–490.
9. Tomer, Y., J. T. Blackard, and N. Akeno. 2007. Interferon alpha treatment andthyroid dysfunction. Endocrinol. Metab. Clin. North Am. 36: 1051–1066, x–xi.
10. Mandac, J. C., S. Chaudhry, K. E. Sherman, and Y. Tomer. 2006. The clinical andphysiological spectrum of interferon-alpha induced thyroiditis: toward a newclassification. Hepatology 43: 661–672.
11. Akeno, N., and Y. Tomer. 2007. Dissecting the mechanisms of interferon inducedthyroiditis (IIT): direct effects of interferon alpha on thyroid epithelial cells. InThe 89th Meeting of the Endocrine Society, June 2–7. The Endocrine Society,Chevy Chase, MD.
12. Jacobson, E. M., S. Chaudhry, J. C. Mandac, E. Concepcion, and Y. Tomer. 2006.Immune-regulatory gene involvement in the etiology of interferon inducedthyroiditis (IIT). Thyroid 16: 926 (Abstr.).
13. Farrar, J. D., and K. M. Murphy. 2000. Type I interferons and T helper de-velopment. Immunol. Today 21: 484–489.
14. Mazziotti, G., F. Sorvillo, M. Piscopo, F. Morisco, M. Cioffi, G. Stornaiuolo,G. B. Gaeta, A. M. Molinari, J. H. Lazarus, G. Amato, and C. Carella. 2005.Innate and acquired immune system in patients developing interferon-alpha-related autoimmune thyroiditis: a prospective study. J. Clin. Endocrinol.Metab. 90: 4138–4144.
15. Tilg, H. 1997. New insights into the mechanisms of interferon alfa: an immu-noregulatory and anti-inflammatory cytokine. Gastroenterology 112: 1017–1021.
16. Ajjan, R. A., P. F. Watson, R. S. McIntosh, and A. P. Weetman. 1996. Intra-thyroidal cytokine gene expression in Hashimoto’s thyroiditis. Clin. Exp.Immunol. 105: 523–528.
17. Oberg, K., K. Funa, and G. Alm. 1983. Effects of leukocyte interferon on clinicalsymptoms and hormone levels in patients with mid-gut carcinoid tumors andcarcinoid syndrome. N. Engl. J. Med. 309: 129–133.
18. Burman, P., T. H. Totterman, K. Oberg, and F. A. Karlsson. 1986. Thyroid au-toimmunity in patients on long term therapy with leukocyte-derived interferon. J.Clin. Endocrinol. Metab. 63: 1086–1090.
19. Fentiman, I. S., B. S. Thomas, F. R. Balkwill, R. D. Rubens, and J. L. Hayward.1985. Primary hypothyroidism associated with interferon therapy of breastcancer. Lancet 325: 1166.
20. Koh, L. K., F. S. Greenspan, and P. P. Yeo. 1997. Interferon-alpha inducedthyroid dysfunction: three clinical presentations and a review of the literature.Thyroid 7: 891–896.
21. Chomczynski, P., and N. Sacchi. 1987. Single-step method of RNA isolation byacid guanidinium thiocyanate-phenol-chloroform extraction. Anal. Biochem.162: 156–159.
22. Roberts, R. M., L. Liu, Q. Guo, D. Leaman, and J. Bixby. 1998. The evolution ofthe type I interferons. J. Interferon Cytokine Res. 18: 805–816.
23. Muller, P. Y., H. Janovjak, A. R. Miserez, and Z. Dobbie. 2002. Processing ofgene expression data generated by quantitative real-time RT-PCR. Biotechniques32: 1372–1374, 1376, 1378–1379.
24. Knauf, J. A., R. Elisei, D. Mochly-Rosen, T. Liron, X. N. Chen, R. Gonsky,J. R. Korenberg, and J. A. Fagin. 1999. Involvement of protein kinase Cepsilon(PKCepsilon) in thyroid cell death: a truncated chimeric PKCepsilon clonedfrom a thyroid cancer cell line protects thyroid cells from apoptosis. J. Biol.Chem. 274: 23414–23425.
25. Pohlenz, J., A. Maqueem, K. Cua, R. E. Weiss, J. Van Sande, and S. Refetoff.1999. Improved radioimmunoassay for measurement of mouse thyrotropin inserum: strain differences in thyrotropin concentration and thyrotroph sensitivityto thyroid hormone. Thyroid 9: 1265–1271.
26. de Weerd, N. A., S. A. Samarajiwa, and P. J. Hertzog. 2007. Type I interferonreceptors: biochemistry and biological functions. J. Biol. Chem. 282: 20053–20057.
27. Tsujimoto, Y., and S. Shimizu. 2005. Another way to die: autophagic pro-grammed cell death. Cell Death Differ. 12(Suppl. 2): 1528–1534.
28. Shimizu, S., T. Kanaseki, N. Mizushima, T. Mizuta, S. Arakawa-Kobayashi,C. B. Thompson, and Y. Tsujimoto. 2004. Role of Bcl-2 family proteins in a non-apoptotic programmed cell death dependent on autophagy genes. Nat. Cell Biol.6: 1221–1228.
29. Rubinsztein, D. C., J. E. Gestwicki, L. O. Murphy, and D. J. Klionsky. 2007.Potential therapeutic applications of autophagy. Nat. Rev. Drug Discov. 6: 304–312.
30. Negro, R., G. Formoso, T. Mangieri, A. Pezzarossa, D. Dazzi, and H. Hassan.2006. Levothyroxine treatment in euthyroid pregnant women with autoimmunethyroid disease: effects on obstetrical complications. J. Clin. Endocrinol. Metab.91: 2587–2591.
31. Vladutiu, A. O., and N. R. Rose. 1971. Autoimmune murine thyroiditis relationto histocompatibility (H-2) type. Science 174: 1137–1139.
32. Keeble, A. H., Z. Khan, A. Forster, and L. C. James. 2008. TRIM21 is an IgGreceptor that is structurally, thermodynamically, and kinetically conserved. Proc.Natl. Acad. Sci. USA 105: 6045–6050.
33. Espinosa, A., W. Zhou, M. Ek, M. Hedlund, S. Brauner, K. Popovic, L. Horvath,T. Wallerskog, M. Oukka, F. Nyberg, et al. 2006. The Sjogren’s syndrome-associated autoantigen Ro52 is an E3 ligase that regulates proliferation andcell death. J. Immunol. 176: 6277–6285.
34. Strandberg, L., A. Ambrosi, A. Espinosa, L. Ottosson, M. L. Eloranta, W. Zhou,A. Elfving, E. Greenfield, V. K. Kuchroo, and M. Wahren-Herlenius. 2008.Interferon-alpha induces up-regulation and nuclear translocation of the Ro52autoantigen as detected by a panel of novel Ro52-specific monoclonal anti-bodies. J. Clin. Immunol. 28: 220–231.
35. Devadas, S., J. Das, C. Liu, L. Zhang, A. I. Roberts, Z. Pan, P. A. Moore, G. Das,and Y. Shi. 2006. Granzyme B is critical for T cell receptor-induced cell death oftype 2 helper T cells. Immunity 25: 237–247.
36. Zocco, M. A., E. Carloni, M. Pescatori, N. Saulnier, A. Lupascu, E. C. Nista,M. Novi, M. Candelli, V. Cimica, S. Mihm, et al. 2006. Characterization of geneexpression profile in rat Kupffer cells stimulated with IFN-alpha or IFN-gamma.Dig. Liver Dis. 38: 563–577.
37. Yang, K., H. X. Shi, X. Y. Liu, Y. F. Shan, B. Wei, S. Chen, and C. Wang. 2009.TRIM21 is essential to sustain IFN regulatory factor 3 activation during antiviralresponse. J. Immunol. 182: 3782–3792.
38. Corona, G., C. Biagini, M. Rotondi, A. Bonamano, N. Cremonini, L. Petrone,B. Conforti, G. Forti, and M. Serio. 2008. Correlation between, clinical, bio-chemical, color Doppler ultrasound thyroid parameters, and CXCL-10 in auto-immune thyroid diseases. Endocr. J. 55: 345–350.
39. Rotondi, M., R. Minelli, F. Magri, P. Leporati, P. Romagnani, M. C. Baroni,R. Delsignore, M. Serio, and L. Chiovato. 2007. Serum CXCL10 levels andoccurrence of thyroid dysfunction in patients treated with interferon-alphatherapy for hepatitis C virus-related hepatitis. Eur. J. Endocrinol. 156: 409–414.
40. Rotondi, M., L. Chiovato, S. Romagnani, M. Serio, and P. Romagnani. 2007. Roleof chemokines in endocrine autoimmune diseases. Endocr. Rev. 28: 492–520.
41. Antonelli, A., C. Ferri, P. Fallahi, S. M. Ferrari, A. Ghinoi, M. Rotondi, andE. Ferrannini. 2006. Thyroid disorders in chronic hepatitis C virus infection.Thyroid 16: 563–572.
The Journal of Immunology 4705
by guest on August 4, 2018
http://ww
w.jim
munol.org/
Dow
nloaded from

42. Antonelli, A., M. Rotondi, P. Fallahi, P. Romagnani, S. M. Ferrari,A. Buonamano, E. Ferrannini, and M. Serio. 2004. High levels of circulatingCXC chemokine ligand 10 are associated with chronic autoimmune thyroiditisand hypothyroidism. J. Clin. Endocrinol. Metab. 89: 5496–5499.
43. Akwa, Y., D. E. Hassett, M. L. Eloranta, K. Sandberg, E. Masliah, H. Powell,J. L. Whitton, F. E. Bloom, and I. L. Campbell. 1998. Transgenic expression ofIFN-alpha in the central nervous system of mice protects against lethal neuro-tropic viral infection but induces inflammation and neurodegeneration. J.Immunol. 161: 5016–5026.
44. Li, Q., B. Xu, S. A. Michie, K. H. Rubins, R. D. Schreriber, and H. O. McDevitt.2008. Interferon-alpha initiates type 1 diabetes in nonobese diabetic mice. Proc.Natl. Acad. Sci. USA 105: 12439–12444.
45. Stewart, T. A., B. Hultgren, X. Huang, S. Pitts-Meek, J. Hully, andN. J. MacLachlan. 1993. Induction of type I diabetes by interferon-alpha intransgenic mice. Science 260: 1942–1946.
46. Caturegli, P., M. Hejazi, K. Suzuki, O. Dohan, N. Carrasco, L. D. Kohn, andN. R. Rose. 2000. Hypothyroidism in transgenic mice expressing IFN-gamma inthe thyroid. Proc. Natl. Acad. Sci. USA 97: 1719–1724.
47. Caturegli, P., and H. Kimura. 2010. A nonclassical model of autoimmune hy-pothyroidism. Thyroid 20: 3–5.
48. Marinkovic, T., A. Garin, Y. Yokota, Y. X. Fu, N. H. Ruddle, G. C. Furtado, andS. A. Lira. 2006. Interaction of mature CD3+CD4+ T cells with dendritic cellstriggers the development of tertiary lymphoid structures in the thyroid. J. Clin.Invest. 116: 2622–2632.
49. Kuang, M., S. Wang, M. Wu, G. Ning, Z. Yao, and L. Li. 2010. Expression ofIFNalpha-inducible genes and modulation of HLA-DR and thyroid stimulatinghormone receptors in Graves’ disease. Mol. Cell. Endocrinol. 319: 23–29.
50. Akeno, N., J. T. Blackard, and Y. Tomer. 2008. HCV E2 protein binds directly tothyroid cells and induces IL-8 production: a new mechanism for HCV inducedthyroid autoimmunity. J. Autoimmun. 31: 339–344.
51. Tsan, M. F., and B. Gao. 2009. Heat shock proteins and immune system. J.Leukoc. Biol. 85: 905–910.
52. Caraccio, N., R. Giannini, S. Cuccato, P. Faviana, P. Berti, D. Galleri,A. Dardano, F. Basolo, E. Ferrannini, and F. Monzani. 2005. Type I interferonsmodulate the expression of thyroid peroxidase, sodium/iodide symporter, andthyroglobulin genes in primary human thyrocyte cultures. J. Clin. Endocrinol.Metab. 90: 1156–1162.
53. Antonelli, A., S. M. Ferrari, P. Fallahi, E. Ghiri, C. Crescioli, P. Romagnani,P. Vitti, M. Serio, and E. Ferrannini. 2010. Interferon-alpha, -beta and -gammainduce CXCL9 and CXCL10 secretion by human thyrocytes: modulation byperoxisome proliferator-activated receptor-gamma agonists. Cytokine 50: 260–267.
54. Wenzel, J., S. Zahn, T. Bieber, and T. Tuting. 2009. Type I interferon-associatedcytotoxic inflammation in cutaneous lupus erythematosus. Arch. Dermatol. Res.301: 83–86.
55. Wenzel, J., B. Bekisch, M. Uerlich, O. Haller, T. Bieber, and T. Tuting. 2005.Type I interferon-associated recruitment of cytotoxic lymphocytes: a commonmechanism in regressive melanocytic lesions. Am. J. Clin. Pathol. 124: 37–48.
56. Figueroa-Vega, N., M. Alfonso-Perez, I. Benedicto, F. Sanchez-Madrid,R. Gonzalez-Amaro, and M. Marazuela. 2010. Increased circulating pro-
inflammatory cytokines and Th17 lymphocytes in Hashimoto’s thyroiditis. J.Clin. Endocrinol. Metab. 95: 953–962.
57. Chowdhury, D., and J. Lieberman. 2008. Death by a thousand cuts: granzymepathways of programmed cell death. Annu. Rev. Immunol. 26: 389–420.
58. Voskoboinik, I., M. J. Smyth, and J. A. Trapani. 2006. Perforin-mediated target-cell death and immune homeostasis. Nat. Rev. Immunol. 6: 940–952.
59. Niland, B., G. Miklossy, K. Banki, W. E. Biddison, L. Casciola-Rosen, A. Rosen,D. Martinvalet, J. Lieberman, and A. Perl. 2010. Cleavage of transaldolase bygranzyme B causes the loss of enzymatic activity with retention of antigenicityfor multiple sclerosis patients. J. Immunol. 184: 4025–4032.
60. Thomas, H. E., J. A. Trapani, and T. W. Kay. 2010. The role of perforin andgranzymes in diabetes. Cell Death Differ. 17: 577–585.
61. Blanco, P., V. Pitard, J. F. Viallard, J. L. Taupin, J. L. Pellegrin, and J. F. Moreau.2005. Increase in activated CD8+ T lymphocytes expressing perforin andgranzyme B correlates with disease activity in patients with systemic lupuserythematosus. Arthritis Rheum. 52: 201–211.
62. Kroemer, G., L. Galluzzi, P. Vandenabeele, J. Abrams, E. S. Alnemri,E. H. Baehrecke, M. V. Blagosklonny, W. S. El-Deiry, P. Golstein, D. R. Green,et al; Nomenclature Committee on Cell Death. 2009. 2009. Classification of celldeath: recommendations of the Nomenclature Committee on Cell Death 2009.Cell Death Differ. 16: 3–11.
63. Lin, J. D. 2001. The role of apoptosis in autoimmune thyroid disorders andthyroid cancer. BMJ 322: 1525–1527.
64. Golstein, P., and G. Kroemer. 2007. Cell death by necrosis: towards a moleculardefinition. Trends Biochem. Sci. 32: 37–43.
65. Vieland, V. J., Y. Huang, C. Bartlett, T. F. Davies, and Y. Tomer. 2008. Amultilocus model of the genetic architecture of autoimmune thyroid disorder,with clinical implications. Am. J. Hum. Genet. 82: 1349–1356.
66. Oppenheim, Y., G. Kim, Y. Ban, P. Unger, E. Concepcion, T. Ando, andY. Tomer. 2003. The effects of alpha interferon on the development of autoim-mune thyroiditis in the NOD H2h4 mouse. Clin. Dev. Immunol. 10: 161–165.
67. Ozato, K., D. M. Shin, T. H. Chang, and H. C. Morse, III. 2008. TRIM familyproteins and their emerging roles in innate immunity.Nat. Rev. Immunol. 8: 849–860.
68. Carthagena, L., A. Bergamaschi, J. M. Luna, A. David, P. D. Uchil, F. Margottin-Goguet, W. Mothes, U. Hazan, C. Transy, G. Pancino, and S. Nisole. 2009.Human TRIM gene expression in response to interferons. PLoS One 4: e4894.
69. Ben-Chetrit, E., E. K. Chan, K. F. Sullivan, and E. M. Tan. 1988. A 52-kDprotein is a novel component of the SS-A/Ro antigenic particle. J. Exp. Med.167: 1560–1571.
70. Nakken, B., R. Jonsson, and A. I. Bolstad. 2001. Polymorphisms of the Ro52gene associated with anti-Ro 52-kd autoantibodies in patients with primarySjogren’s syndrome. Arthritis Rheum. 44: 638–646.
71. Frank, M. B., K. Itoh, A. Fujisaku, P. Pontarotti, M. G. Mattei, and B. R. Neas.1993. The mapping of the human 52-kD Ro/SSA autoantigen gene to humanchromosome 11, and its polymorphisms. Am. J. Hum. Genet. 52: 183–191.
72. Manoharan, A., and M. P. Madaio. 2010. Biomarkers in lupus nephritis. Rheum.Dis. Clin. North Am. 36: 131–143, ix.
73. Tomer, Y., and T. F. Davies. 1993. Infection, thyroid disease, and autoimmunity.Endocr. Rev. 14: 107–120.
4706 AUTOIMMUNITY-INDUCED THYROIDITIS
by guest on August 4, 2018
http://ww
w.jim
munol.org/
Dow
nloaded from