igf-usa 2021 survey results final report
TRANSCRIPT

IGF-USA 2021 Survey Results – Final Report The 2021 IGF-USA Subject Matter Survey ran from March 2-16, receiving a total of 108 responses. This document provides a summary of the results. Each calculation is described below and has accompanying charts and tables. This document is the final report that has been reviewed by the Steering Committee. At the end of the survey, respondents were asked a series of questions about themselves, including stakeholder group, number of IGF-USAs attended, and number of global IGFs attended. Before reviewing the results, here is make up of the survey respondents.
Stakeholder Breakdown
• Private Sector: 45 Responses (45.45%)
• Civil Society / Academia: 30 Responses (30.30%)
• Technical Community: 9 Responses (9.09%)
• None / Other: 11 Responses (11.11%)
• Government / Intergovernmental Organization: 4 Responses (4.04%)
Number of IGF-USAs Attended
• None: 16 (15.53%)
• 1 IGF-USA: 27 (26.21%)
• 2 IGF-USAs: 13 (12.62%)
• 3 IGF-USAs: 12 (11.65%)
• 4+ IGF-USAs: 35 (33.98%) Number of global IGFs Attended
• None: 34 (33.66%)
• 1 IGF: 17 (16.48%)
• 2 IGFs: 16 (15.84%)
• 3 IGFs: 4 (3.96%)
• 4+ IGFs: 30 (33.66%)
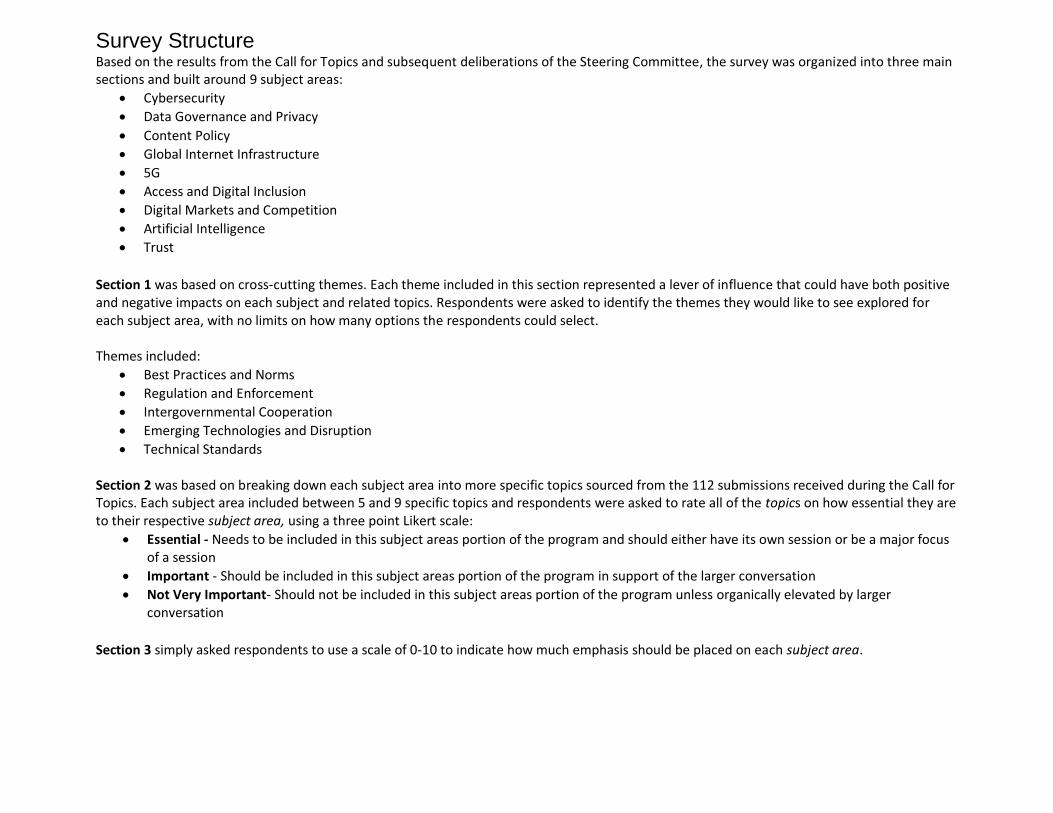
Survey Structure Based on the results from the Call for Topics and subsequent deliberations of the Steering Committee, the survey was organized into three main sections and built around 9 subject areas:
• Cybersecurity
• Data Governance and Privacy
• Content Policy
• Global Internet Infrastructure
• 5G
• Access and Digital Inclusion
• Digital Markets and Competition
• Artificial Intelligence
• Trust
Section 1 was based on cross-cutting themes. Each theme included in this section represented a lever of influence that could have both positive and negative impacts on each subject and related topics. Respondents were asked to identify the themes they would like to see explored for each subject area, with no limits on how many options the respondents could select. Themes included:
• Best Practices and Norms
• Regulation and Enforcement
• Intergovernmental Cooperation
• Emerging Technologies and Disruption
• Technical Standards Section 2 was based on breaking down each subject area into more specific topics sourced from the 112 submissions received during the Call for Topics. Each subject area included between 5 and 9 specific topics and respondents were asked to rate all of the topics on how essential they are to their respective subject area, using a three point Likert scale:
• Essential - Needs to be included in this subject areas portion of the program and should either have its own session or be a major focus of a session
• Important - Should be included in this subject areas portion of the program in support of the larger conversation
• Not Very Important- Should not be included in this subject areas portion of the program unless organically elevated by larger conversation
Section 3 simply asked respondents to use a scale of 0-10 to indicate how much emphasis should be placed on each subject area.

Understanding the Results This report presents the data in a variety of ways and breaks down the results using various metrics, including how respondents answered specific questions. In particular, the responses from Section 3 will be used to filter the results from Sections 1 and 2. In addition to providing the full data for each subject area in Sections 1 and 2, results will be provided based on the following conditions:
• All Responses
• Results from responses that rated the corresponding subject area 5 or higher – This metric is used to limit the results to respondents that at a minimum recognize the importance of the subject area, but also includes those with a significant interest and/or expertise.
• Results from responses that rated the corresponding subject area 8 or higher – This metric is used to limit the results to respondents that at a minimum have a significant interest and/or expertise in the subject area.
Cross-Cutting Themes Results from Section 1 will be displayed as the percentage of respondents that selected each option and the relevant results will be included in each Subject Area Breakdown. These results will be provided in four graphs/tables – one from each of the Section 3 metrics and another that combines the results into a single graph/table for comparison across metrics.
Rating Topics Results from Section 2 use two measurements – mean scores and response counts for each option. The point system used to calculate the mean score assigns the following numerical values to each point of the Likert Scale:
• Not Very Important = 1
• Important = 2
• Essential = 3 Results for both the mean scores and response counts will be provided in graphs/tables for each of the metrics from Section 3. An additional graph/table for comparison across metrics will only be provided for the mean scores. It was determined that it was easier to compare the response counts using the separate graphs than interpreting the comparison on a single complicated chart.
Rating Subject Areas Respondents were asked to use a scale of 0-10 to indicate how much emphasis should be placed on the 9 different subject areas in the survey. This section provides the results based on two different metrics:
• Mean score of all responses
• Response counts for specific ranges of rating (1-4; 5-7; 8-10) The mean scores provide a general understanding of how each subject area performed in this section of the survey, but the break down by specific ranges allows for a more detailed look at how respondents rated each subject. For example, ”Trust” and “Digital Markets and Competition” had the same mean score, but the specific response counts that seem to indicate that a greater number of respondents at a minimum recognize the importance of “Digital Markets and Competition,” while a greater number of respondents at a minimum have a significant interest and/or expertise in the subject area.

Subject Area Rating The chart and table below show the mean scores for each subject area sorted from highest to lowest.
The chart and table below show the response counts within each specified range for each subject area: 1-4, 5-7, and 8-10.
7.11
6.85
6.57
6.56
6.56
6.35
6.24
6.08
5.64
0 1 2 3 4 5 6 7 8
Cybersecurity
Data Governance and Privacy
Content Policy
Trust
Digital Markets and Competition
Access & Digital Inclusion
Global Internet Infrastructure
Artificial Intelligence
5G
Subject Area Rating - Mean Scores
62
51
43
38
36
34
33
29
26
19
30
31
32
38
48
53
41
37
21
20
27
25
24
12
11
20
26
0 20 40 60 80 100 120
Cybersecurity
Data Governance and Privacy
Trust
Access & Digital Inclusion
Global Internet Infrastructure
Content Policy
Digital Markets and Competition
Artificial Intelligence
5G
CybersecurityData
Governance andPrivacy
TrustAccess & Digital
InclusionGlobal InternetInfrastructure
Content PolicyDigital Markets
and CompetitionArtificial
Intelligence5G
Count - 8+ 625143383634332926
Count - 5-7 193031323848534137
Count - 1-4 212027252412112026
Subject Area Rating - Break Down by Response Count
Count - 8+ Count - 5-7 Count - 1-4
Subject Area Mean
Cybersecurity 7.11
Data Governance and Privacy 6.85
Content Policy 6.57
Trust 6.56
Digital Markets and Competition 6.56
Access & Digital Inclusion 6.35
Global Internet Infrastructure 6.24
Artificial Intelligence 6.08
5G 5.64

Subject Area Breakdown – Cybersecurity Cross-Cutting Themes The charts below show the percentage of respondents that selected each theme for the Cybersecurity Subject Area, based on the rating they gave to Cybersecurity in Section 3.
65.2%
58.7%
58.7%
55.4%
42.4%
0% 10% 20% 30% 40% 50% 60% 70%
Best Practices and Norms
Regulation and Enforcement
Intergovernmental Cooperation
Emerging Technolgies and Disruption
Technical Standards
Best Practices and NormsRegulation and EnforcementIntergovernmental
CooperationEmerging Technolgies and
DisruptionTechnical Standards
% 65.2%58.7%58.7%55.4%42.4%
Cross-Cutting Themes in Cybersecurity - All ResponsesPercentage of respondents
73.7%
64.5%
60.5%
57.9%
46.1%
0% 10% 20% 30% 40% 50% 60% 70% 80%
Best Practices and Norms
Intergovernmental Cooperation
Regulation and Enforcement
Emerging Technolgies and…
Technical Standards
Best Practicesand Norms
Intergovernmental
Cooperation
Regulationand
Enforcement
EmergingTechnolgies
andDisruption
TechnicalStandards
% 73.7%64.5%60.5%57.9%46.1%
5 or HigherPercentage of respondents
76.3%
74.6%
62.7%
59.3%
45.8%
0% 10% 20% 30% 40% 50% 60% 70% 80%
Best Practices and Norms
Intergovernmental Cooperation
Emerging Technolgies and…
Regulation and Enforcement
Technical Standards
Best Practicesand Norms
Intergovernmental
Cooperation
EmergingTechnolgies
andDisruption
Regulationand
Enforcement
TechnicalStandards
% 76.3%74.6%62.7%59.3%45.8%
8 or HigherPercentage of respondents

This chart combines the data from the other graphs in this section for easier comparison of results across metrics.
76.3%
74.6%
62.7%
59.3%
45.8%
73.7%
64.5%
60.5%
57.9%
46.1%
65.2%
58.7%
58.7%
55.4%
42.4%
30% 35% 40% 45% 50% 55% 60% 65% 70% 75% 80%
Best Practices and Norms
Regulation and Enforcement
Intergovernmental Cooperation
Emerging Technolgies and Disruption
Technical Standards
Best Practices and NormsRegulation and EnforcementIntergovernmental
CooperationEmerging Technolgies and
DisruptionTechnical Standards
Scored - 8 + 76.3%74.6%62.7%59.3%45.8%
Scored - 5 + 73.7%64.5%60.5%57.9%46.1%
All 65.2%58.7%58.7%55.4%42.4%
Cross-Cutting Themes in Cybersecurity - Comparison Across Metrics
Scored - 8 + Scored - 5 + All

Cybersecurity Topics The charts below show the mean scores and response counts for each option, based on the rating they gave to Cybersecurity in Section 3. The point system used to calculate the mean score assigns the following numerical values to each point of the Likert Scale:
• Not Very Important = 1
• Important = 2
• Essential = 3
2.29
2.28
2.23
2.21
2.18
2.13
1.95
1.8 1.9 2 2.1 2.2 2.3 2.4
Critical Infrastructure
Supply Chain Security
Policy and Standards for IoT
Roadmap for Cooperation on Digital…
Identity and Authentication
Emerging technologies and Encryption
Types of Attacks, e.g. Ransomware
Mean Score - All Responses Not Very Important = 1; Important = 2; Essential = 3
38
38
37
33
33
27
16
49
40
46
56
52
58
61
10
20
11
12
11
14
21
0 20 40 60 80 100
Critical Infrastructure
Identity and Authentication
Supply Chain Security
Roadmap for Cooperation on Digital…
Policy and Standards for IoT
Emerging technologies and Encryption
Types of Attacks, e.g. Ransomware
Response Count - All ResponsesBreakdown by Response
Essential Important Not Very Important
2.36
2.34
2.33
2.24
2.23
2.22
2.03
1.8 1.9 2 2.1 2.2 2.3 2.4
Policy and Standards for IoT
Supply Chain Security
Critical Infrastructure
Roadmap for Cooperation on Digital…
Identity and Authentication
Emerging technologies and Encryption
Types of Attacks, e.g. Ransomware
Mean Score - Rated 5 or HigherNot Very Important = 1; Important = 2; Essential = 3
33
33
32
31
28
25
15
38
30
38
43
42
45
51
7
15
6
3
9
8
13
0 10 20 30 40 50 60 70 80
Critical Infrastructure
Identity and Authentication
Supply Chain Security
Policy and Standards for IoT
Roadmap for Cooperation on Digital…
Emerging technologies and Encryption
Types of Attacks, e.g. Ransomware
Response Count - 5 or Higher Breakdown by Response
Essential Important Not Very Important

2.4
2.39
2.31
2.26
2.25
2.13
2.13
1.8 1.9 2 2.1 2.2 2.3 2.4
Supply Chain Security
Policy and Standards for IoT
Roadmap for Cooperation on Digital…
Critical Infrastructure
Identity and Authentication
Emerging technologies and Encryption
Types of Attacks, e.g. Ransomware
Mean Score - Rated 8 or HigherNot Very Important = 1; Important = 2; Essential = 3
29
27
25
25
23
16
15
17
27
32
30
31
36
39
14
4
2
6
7
8
7
0 10 20 30 40 50 60
Identity and Authentication
Supply Chain Security
Policy and Standards for IoT
Roadmap for Cooperation on Digital…
Critical Infrastructure
Emerging technologies and Encryption
Types of Attacks, e.g. Ransomware
Response Count - 8 or Higher Breakdown by Response
Essential Important Not Very Important
1.7 1.8 1.9 2 2.1 2.2 2.3 2.4 2.5
Supply Chain Security
Policy and Standards for IoT
Roadmap for Cooperation on Digital Security
Critical Infrastructure
Identity and Authentication
Emerging technologies and Encryption
Types of Attacks, e.g. Ransomware
Supply Chain SecurityPolicy and Standards
for IoT
Roadmap forCooperation onDigital Security
Critical InfrastructureIdentity and
Authentication
Emergingtechnologies and
Encryption
Types of Attacks, e.g.Ransomware
Scored - 8 + 2.42.392.312.262.252.132.13
Scored - 5 + 2.362.342.242.332.232.222.03
All 2.282.232.212.292.182.131.95
Mean Scores - Comparison Across Metrics
Scored - 8 + Scored - 5 + All

Subject Area Breakdown – Data Governance and Privacy Cross-Cutting Themes The charts below show the percentage of respondents that selected each theme for the Data Governance and Privacy Subject Area, based on the rating they gave to Data Governance and Privacy in Section 3.
70.8%
69.7%
61.8%
39.3%
34.8%
0% 10% 20% 30% 40% 50% 60% 70% 80%
Regulation and Enforcement
Intergovernmental Cooperation
Best Practices and Norms
Emerging Technolgies and Disruption
Technical Standards
Regulation and EnforcementIntergovernmental
CooperationBest Practices and Norms
Emerging Technolgies andDisruption
Technical Standards
% 70.8%69.7%61.8%39.3%34.8%
Cross-Cutting Themes in Data Governance and Privacy - AllPercentage of respondents
74.0%
69.9%
65.8%
42.5%
34.3%
0% 10% 20% 30% 40% 50% 60% 70% 80%
Regulation and Enforcement
Intergovernmental Cooperation
Best Practices and Norms
Emerging Technolgies and…
Technical Standards
Regulationand
Enforcement
Intergovernmental
Cooperation
Best Practicesand Norms
EmergingTechnolgies
andDisruption
TechnicalStandards
% 74.0%69.9%65.8%42.5%34.3%
5 or HigherPercentage of respondents
81.3%
77.1%
68.8%
45.8%
35.4%
0% 20% 40% 60% 80%
Regulation and Enforcement
Intergovernmental Cooperation
Best Practices and Norms
Emerging Technolgies and…
Technical Standards
Regulationand
Enforcement
Intergovernmental
Cooperation
Best Practicesand Norms
EmergingTechnolgies
andDisruption
TechnicalStandards
% 81.3%77.1%68.8%45.8%35.4%
8 or HigherPercentage of respondents
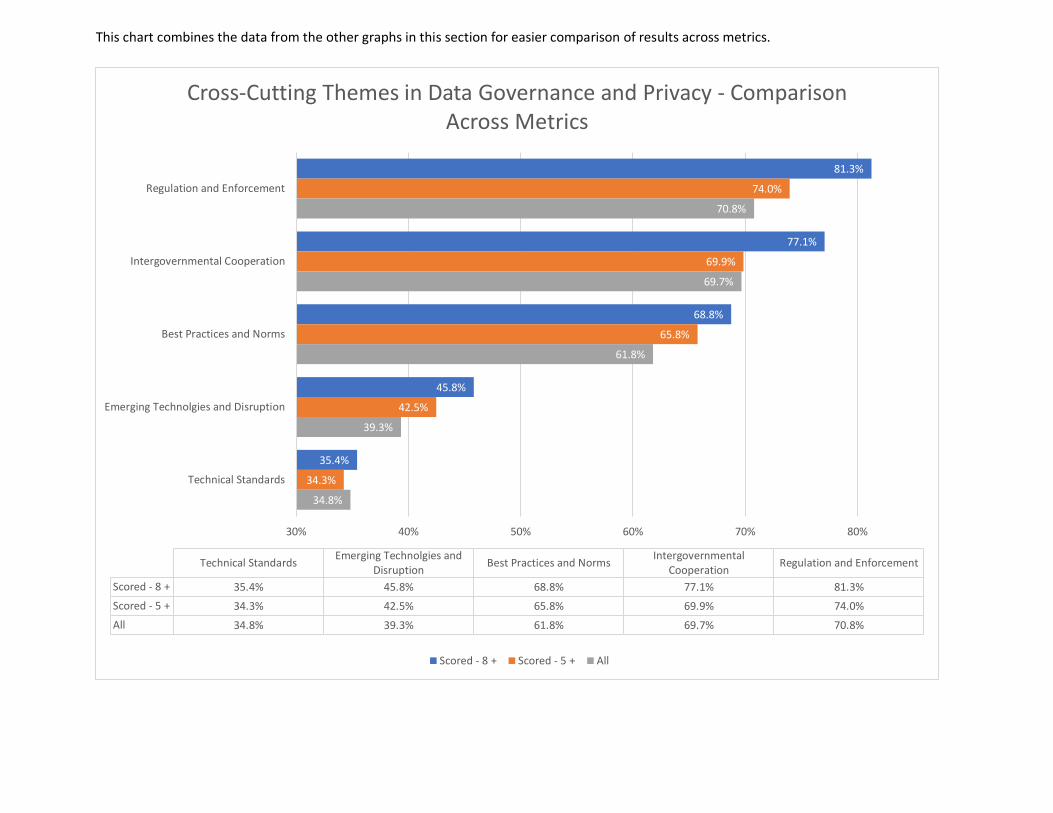
This chart combines the data from the other graphs in this section for easier comparison of results across metrics.
81.3%
77.1%
68.8%
45.8%
35.4%
74.0%
69.9%
65.8%
42.5%
34.3%
70.8%
69.7%
61.8%
39.3%
34.8%
30% 40% 50% 60% 70% 80%
Regulation and Enforcement
Intergovernmental Cooperation
Best Practices and Norms
Emerging Technolgies and Disruption
Technical Standards
Regulation and EnforcementIntergovernmental
CooperationBest Practices and Norms
Emerging Technolgies andDisruption
Technical Standards
Scored - 8 + 81.3%77.1%68.8%45.8%35.4%
Scored - 5 + 74.0%69.9%65.8%42.5%34.3%
All 70.8%69.7%61.8%39.3%34.8%
Cross-Cutting Themes in Data Governance and Privacy - Comparison Across Metrics
Scored - 8 + Scored - 5 + All
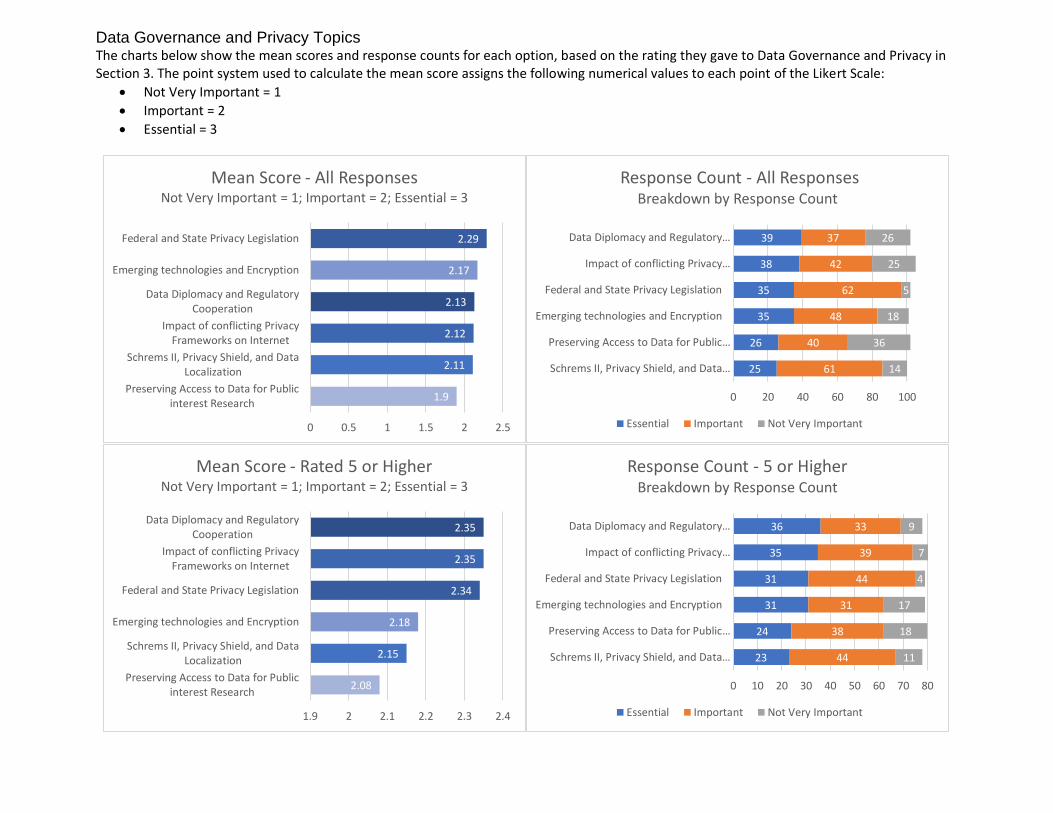
Data Governance and Privacy Topics The charts below show the mean scores and response counts for each option, based on the rating they gave to Data Governance and Privacy in Section 3. The point system used to calculate the mean score assigns the following numerical values to each point of the Likert Scale:
• Not Very Important = 1
• Important = 2
• Essential = 3
2.29
2.17
2.13
2.12
2.11
1.9
0 0.5 1 1.5 2 2.5
Federal and State Privacy Legislation
Emerging technologies and Encryption
Data Diplomacy and RegulatoryCooperation
Impact of conflicting PrivacyFrameworks on Internet
Schrems II, Privacy Shield, and DataLocalization
Preserving Access to Data for Publicinterest Research
Mean Score - All Responses Not Very Important = 1; Important = 2; Essential = 3
39
38
35
35
26
25
37
42
62
48
40
61
26
25
5
18
36
14
0 20 40 60 80 100
Data Diplomacy and Regulatory…
Impact of conflicting Privacy…
Federal and State Privacy Legislation
Emerging technologies and Encryption
Preserving Access to Data for Public…
Schrems II, Privacy Shield, and Data…
Response Count - All ResponsesBreakdown by Response Count
Essential Important Not Very Important
2.35
2.35
2.34
2.18
2.15
2.08
1.9 2 2.1 2.2 2.3 2.4
Data Diplomacy and RegulatoryCooperation
Impact of conflicting PrivacyFrameworks on Internet
Federal and State Privacy Legislation
Emerging technologies and Encryption
Schrems II, Privacy Shield, and DataLocalization
Preserving Access to Data for Publicinterest Research
Mean Score - Rated 5 or HigherNot Very Important = 1; Important = 2; Essential = 3
36
35
31
31
24
23
33
39
44
31
38
44
9
7
4
17
18
11
0 10 20 30 40 50 60 70 80
Data Diplomacy and Regulatory…
Impact of conflicting Privacy…
Federal and State Privacy Legislation
Emerging technologies and Encryption
Preserving Access to Data for Public…
Schrems II, Privacy Shield, and Data…
Response Count - 5 or Higher Breakdown by Response Count
Essential Important Not Very Important

2.43
2.31
2.2
2.2
2.14
2.06
1.8 1.9 2 2.1 2.2 2.3 2.4 2.5
Data Diplomacy and RegulatoryCooperation
Federal and State Privacy Legislation
Impact of conflicting PrivacyFrameworks on Internet
Schrems II, Privacy Shield, and DataLocalization
Preserving Access to Data for Publicinterest Research
Emerging technologies and Encryption
Mean Score - 8 or HigherNot Very Important = 1; Important = 2; Essential = 3
26
21
18
17
17
16
18
15
28
26
19
29
5
14
3
7
14
6
0 10 20 30 40 50 60
Data Diplomacy and Regulatory…
Preserving Access to Data for Public…
Federal and State Privacy Legislation
Schrems II, Privacy Shield, and Data…
Emerging technologies and Encryption
Impact of conflicting Privacy…
Response Count - 8 or HigherBreakdown by Response
Essential Important Not Very Important
1.7 1.8 1.9 2 2.1 2.2 2.3 2.4 2.5
Data Diplomacy and Regulatory Cooperation
Federal and State Privacy Legislation
Impact of conflicting Privacy Frameworks on Internet
Schrems II, Privacy Shield, and Data Localization
Emerging technologies and Encryption
Preserving Access to Data for Public interest Research
Data Diplomacy andRegulatory
Cooperation
Federal and StatePrivacy Legislation
Impact of conflictingPrivacy Frameworks
on Internet
Schrems II, PrivacyShield, and Data
Localization
Emergingtechnologies and
Encryption
Preserving Access toData for Public
interest Research
Scored - 8 + 2.432.312.22.22.062.14
Scored - 5 + 2.352.342.352.152.182.08
All 2.132.292.122.112.171.9
Mean Scores - Comparison Across Metrics
Scored - 8 + Scored - 5 + All

Subject Area Breakdown – Content Policy Cross-Cutting Themes The charts below show the percentage of respondents that selected each theme for the Content Policy Subject Area, based on the rating they gave to Content Policy in Section 3.
73.3%
70.9%
52.3%
46.5%
20.9%
0% 10% 20% 30% 40% 50% 60% 70% 80%
Best Practices and Norms
Regulation and Enforcement
Intergovernmental Cooperation
Emerging Technolgies and Disruption
Technical Standards
Best Practices and NormsRegulation and EnforcementIntergovernmental
CooperationEmerging Technolgies and
DisruptionTechnical Standards
% 73.3%70.9%52.3%46.5%20.9%
Cross-Cutting Themes in Content Policy - All ResponsesPercentage of respondents
80.6%
76.4%
56.9%
48.6%
19.4%
0% 20% 40% 60% 80% 100%
Best Practices and Norms
Regulation and Enforcement
Intergovernmental Cooperation
Emerging Technolgies and…
Technical Standards
Best Practicesand Norms
Regulationand
Enforcement
Intergovernmental
Cooperation
EmergingTechnolgies
andDisruption
TechnicalStandards
% 80.6%76.4%56.9%48.6%19.4%
5 or HigherPercentage of respondents
81.3%
75.0%
71.9%
46.9%
18.8%
0% 20% 40% 60% 80% 100%
Regulation and Enforcement
Intergovernmental Cooperation
Best Practices and Norms
Emerging Technolgies and…
Technical Standards
Regulationand
Enforcement
Intergovernmental
Cooperation
Best Practicesand Norms
EmergingTechnolgies
andDisruption
TechnicalStandards
% 81.3%75.0%71.9%46.9%18.8%
8 or HigherPercentage of respondents
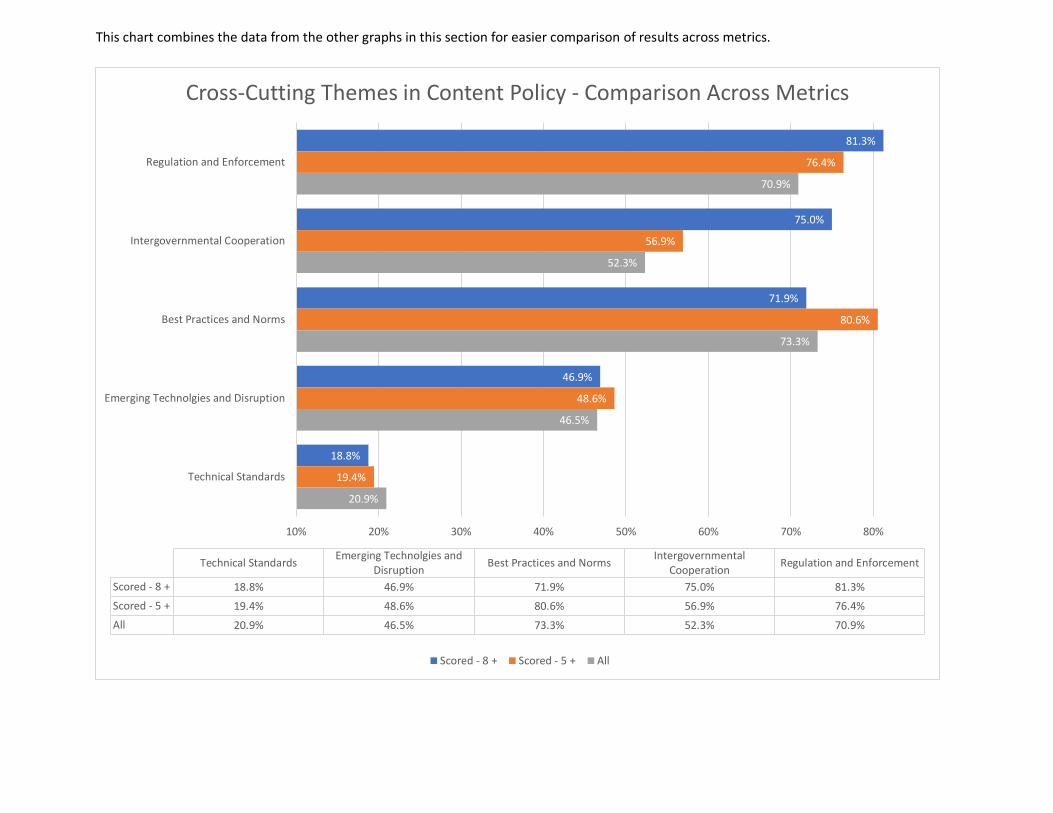
This chart combines the data from the other graphs in this section for easier comparison of results across metrics.
81.3%
75.0%
71.9%
46.9%
18.8%
76.4%
56.9%
80.6%
48.6%
19.4%
70.9%
52.3%
73.3%
46.5%
20.9%
10% 20% 30% 40% 50% 60% 70% 80%
Regulation and Enforcement
Intergovernmental Cooperation
Best Practices and Norms
Emerging Technolgies and Disruption
Technical Standards
Regulation and EnforcementIntergovernmental
CooperationBest Practices and Norms
Emerging Technolgies andDisruption
Technical Standards
Scored - 8 + 81.3%75.0%71.9%46.9%18.8%
Scored - 5 + 76.4%56.9%80.6%48.6%19.4%
All 70.9%52.3%73.3%46.5%20.9%
Cross-Cutting Themes in Content Policy - Comparison Across Metrics
Scored - 8 + Scored - 5 + All
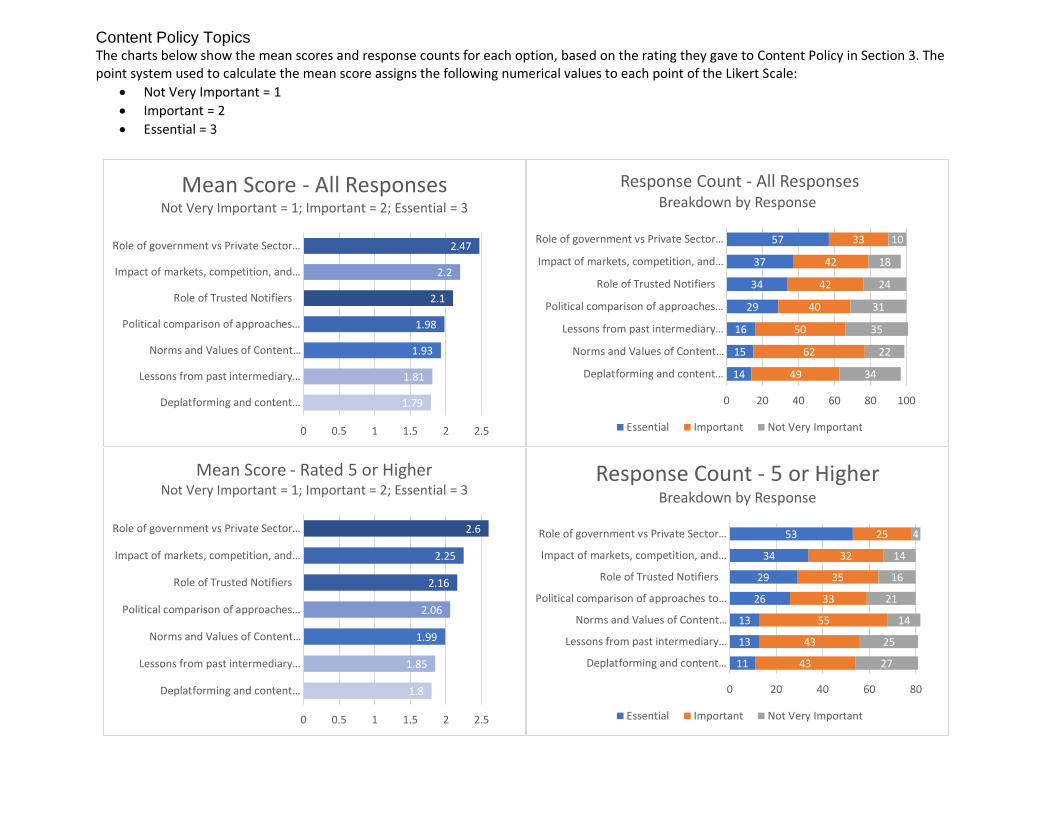
Content Policy Topics The charts below show the mean scores and response counts for each option, based on the rating they gave to Content Policy in Section 3. The point system used to calculate the mean score assigns the following numerical values to each point of the Likert Scale:
• Not Very Important = 1
• Important = 2
• Essential = 3
2.47
2.2
2.1
1.98
1.93
1.81
1.79
0 0.5 1 1.5 2 2.5
Role of government vs Private Sector…
Impact of markets, competition, and…
Role of Trusted Notifiers
Political comparison of approaches…
Norms and Values of Content…
Lessons from past intermediary…
Deplatforming and content…
Mean Score - All Responses Not Very Important = 1; Important = 2; Essential = 3
57
37
34
29
16
15
14
33
42
42
40
50
62
49
10
18
24
31
35
22
34
0 20 40 60 80 100
Role of government vs Private Sector…
Impact of markets, competition, and…
Role of Trusted Notifiers
Political comparison of approaches…
Lessons from past intermediary…
Norms and Values of Content…
Deplatforming and content…
Response Count - All ResponsesBreakdown by Response
Essential Important Not Very Important
2.6
2.25
2.16
2.06
1.99
1.85
1.8
0 0.5 1 1.5 2 2.5
Role of government vs Private Sector…
Impact of markets, competition, and…
Role of Trusted Notifiers
Political comparison of approaches…
Norms and Values of Content…
Lessons from past intermediary…
Deplatforming and content…
Mean Score - Rated 5 or HigherNot Very Important = 1; Important = 2; Essential = 3
53
34
29
26
13
13
11
25
32
35
33
55
43
43
4
14
16
21
14
25
27
0 20 40 60 80
Role of government vs Private Sector…
Impact of markets, competition, and…
Role of Trusted Notifiers
Political comparison of approaches to…
Norms and Values of Content…
Lessons from past intermediary…
Deplatforming and content…
Response Count - 5 or Higher Breakdown by Response
Essential Important Not Very Important

2.65
2.3
2.25
2.12
1.85
1.85
1.79
0 0.5 1 1.5 2 2.5
Role of government vs Private Sector…
Role of Trusted Notifiers
Impact of markets, competition, and…
Political comparison of approaches…
Norms and Values of Content…
Lessons from past intermediary…
Deplatforming and content…
Mean Score - 8 or HigherNot Very Important = 1; Important = 2; Essential = 3
23
15
13
12
6
6
2
10
13
11
16
17
14
25
1
5
9
4
11
13
7
0 5 10 15 20 25 30 35
Role of government vs Private Sector…
Role of Trusted Notifiers
Political comparison of approaches to…
Impact of markets, competition, and…
Lessons from past intermediary…
Deplatforming and content…
Norms and Values of Content…
Response Count - 8 or HigherBreakdown by Response
Essential Important Not Very Important
1.7 1.8 1.9 2 2.1 2.2 2.3 2.4 2.5 2.6 2.7
Role of government vs Private Sector in content moderation decisions
Role of Trusted Notifiers
Impact of markets, competition, and consumers
Political comparison of approaches to Section 230 and Platform Liability
Norms and Values of Content moderation
Lessons from past intermediary liability reforms and content moderation…
Deplatforming and content moderation throughout the stack
Role of governmentvs Private Sector in
content moderationdecisions
Role of TrustedNotifiers
Impact of markets,competition, and
consumers
Political comparisonof approaches toSection 230 andPlatform Liability
Norms and Values ofContent moderation
Lessons from pastintermediary liabilityreforms and contentmoderation decision
Deplatforming andcontent moderationthroughout the stack
Scored - 8 + 2.652.32.252.121.851.851.79
Scored - 5 + 2.62.162.252.061.991.851.8
All 2.472.12.21.981.931.811.79
Mean Scores - Comparison Across Metrics
Scored - 8 + Scored - 5 + All
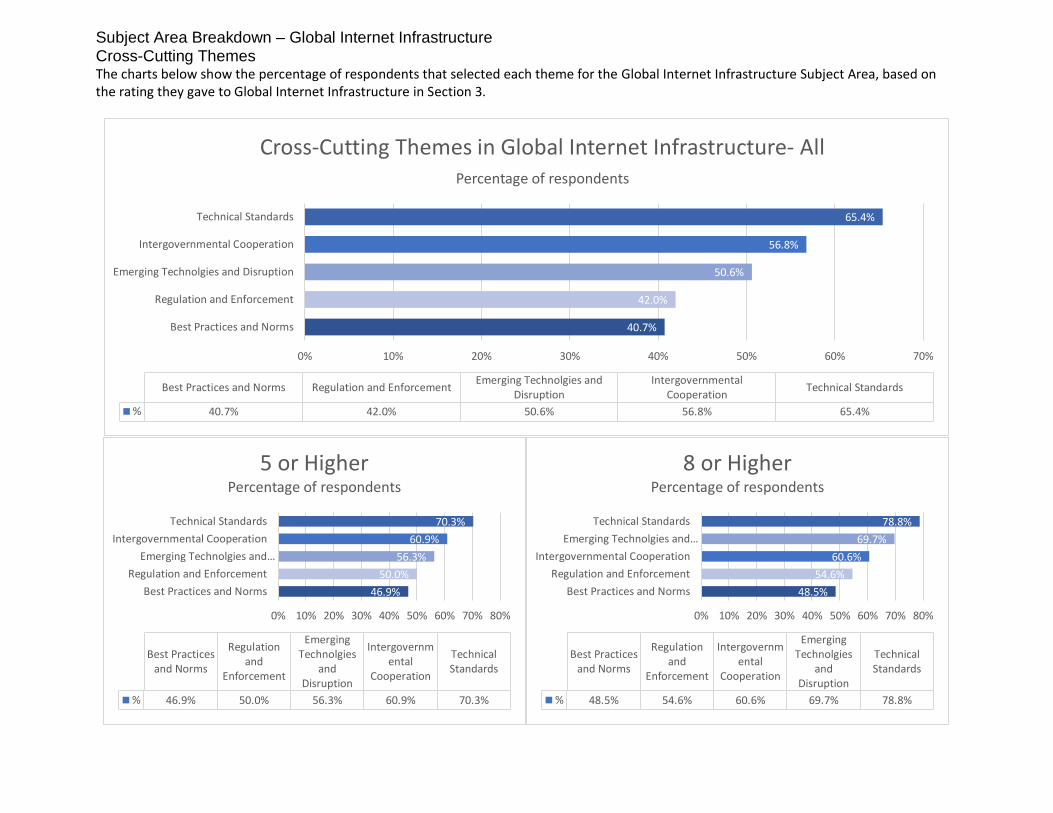
Subject Area Breakdown – Global Internet Infrastructure Cross-Cutting Themes The charts below show the percentage of respondents that selected each theme for the Global Internet Infrastructure Subject Area, based on the rating they gave to Global Internet Infrastructure in Section 3.
65.4%
56.8%
50.6%
42.0%
40.7%
0% 10% 20% 30% 40% 50% 60% 70%
Technical Standards
Intergovernmental Cooperation
Emerging Technolgies and Disruption
Regulation and Enforcement
Best Practices and Norms
Technical StandardsIntergovernmental
CooperationEmerging Technolgies and
DisruptionRegulation and EnforcementBest Practices and Norms
% 65.4%56.8%50.6%42.0%40.7%
Cross-Cutting Themes in Global Internet Infrastructure- All Percentage of respondents
70.3%
60.9%
56.3%
50.0%
46.9%
0% 10% 20% 30% 40% 50% 60% 70% 80%
Technical Standards
Intergovernmental Cooperation
Emerging Technolgies and…
Regulation and Enforcement
Best Practices and Norms
TechnicalStandards
Intergovernmental
Cooperation
EmergingTechnolgies
andDisruption
Regulationand
Enforcement
Best Practicesand Norms
% 70.3%60.9%56.3%50.0%46.9%
5 or HigherPercentage of respondents
78.8%
69.7%
60.6%
54.6%
48.5%
0% 10% 20% 30% 40% 50% 60% 70% 80%
Technical Standards
Emerging Technolgies and…
Intergovernmental Cooperation
Regulation and Enforcement
Best Practices and Norms
TechnicalStandards
EmergingTechnolgies
andDisruption
Intergovernmental
Cooperation
Regulationand
Enforcement
Best Practicesand Norms
% 78.8%69.7%60.6%54.6%48.5%
8 or HigherPercentage of respondents
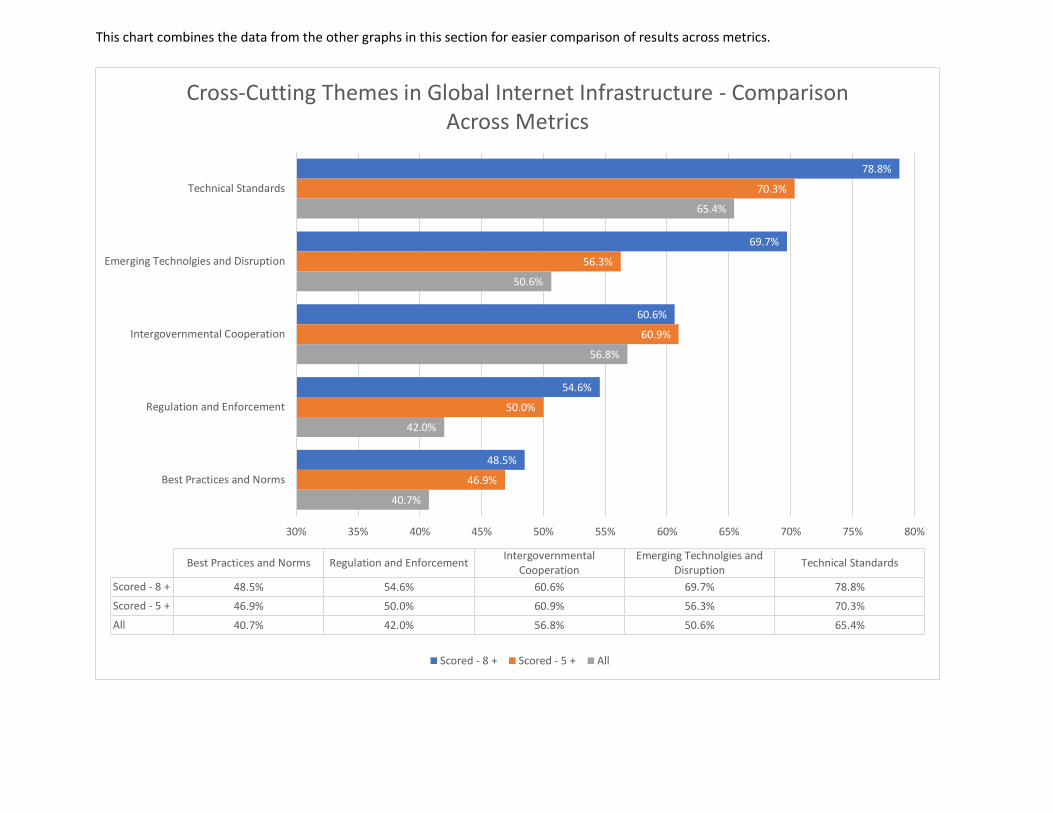
This chart combines the data from the other graphs in this section for easier comparison of results across metrics.
78.8%
69.7%
60.6%
54.6%
48.5%
70.3%
56.3%
60.9%
50.0%
46.9%
65.4%
50.6%
56.8%
42.0%
40.7%
30% 35% 40% 45% 50% 55% 60% 65% 70% 75% 80%
Technical Standards
Emerging Technolgies and Disruption
Intergovernmental Cooperation
Regulation and Enforcement
Best Practices and Norms
Technical StandardsEmerging Technolgies and
DisruptionIntergovernmental
CooperationRegulation and EnforcementBest Practices and Norms
Scored - 8 + 78.8%69.7%60.6%54.6%48.5%
Scored - 5 + 70.3%56.3%60.9%50.0%46.9%
All 65.4%50.6%56.8%42.0%40.7%
Cross-Cutting Themes in Global Internet Infrastructure - Comparison Across Metrics
Scored - 8 + Scored - 5 + All

Global Internet Infrastructure Topics The charts below show the mean scores and response counts for each option, based on the rating they gave to Global Internet Infrastructure in Section 3. The point system used to calculate the mean score assigns the following numerical values to each point of the Likert Scale:
• Not Very Important = 1
• Important = 2
• Essential = 3
2.19
2.18
2.17
2.08
2.05
1.98
1.71
0 0.5 1 1.5 2 2.5
Regulatory Pressures Fragmenting…
DNS Abuse
Best practices in Internet Standards
DNS over HTTPS / DNS over TLS
What is and isn‚Äôt Working in the …
New Opportunities for American…
Whois
Mean Score - All Responses Not Very Important = 1; Important = 2; Essential = 3
41
37
33
32
31
24
16
42
44
37
37
45
68
38
21
19
28
34
23
7
44
0 20 40 60 80 100
Regulatory Pressures Fragmenting…
DNS Abuse
What is and isn't Working in the…
New Opportunities for American…
DNS over HTTPS / DNS over TLS
Best practices in Internet Standards
Whois
Response Count - All ResponsesBreakdown by Response
Essential Important Not Very Important
2.41
2.31
2.2
2.11
2.04
1.96
1.84
0 0.5 1 1.5 2 2.5
Regulatory Pressures Fragmenting…
What is and isn‚Äôt Working in the …
Best practices in Internet Standards
New Opportunities for American…
DNS Abuse
DNS over HTTPS / DNS over TLS
Whois
Mean Score - Rated 5 or HigherNot Very Important = 1; Important = 2; Essential = 3
35
30
25
20
19
14
12
33
32
30
45
39
40
35
5
8
17
6
16
17
23
0 10 20 30 40 50 60 70 80
Regulatory Pressures Fragmenting…
What is and isn't Working in the…
New Opportunities for American…
Best practices in Internet Standards
DNS Abuse
DNS over HTTPS / DNS over TLS
Whois
Response Count - 5 or Higher Breakdown by Response
Essential Important Not Very Important

2.49
2.37
2.24
2.22
2.17
2.09
1.85
0 0.5 1 1.5 2 2.5
Regulatory Pressures Fragmenting…
Best practices in Internet Standards
What is and isn‚Äôt Working in the …
DNS Abuse
New Opportunities for American…
DNS over HTTPS / DNS over TLS
Whois
Mean Score - 8 or HigherNot Very Important = 1; Important = 2; Essential = 3
20
14
14
14
13
9
4
12
20
14
13
18
20
20
3
1
6
8
5
6
9
0 5 10 15 20 25 30 35 40
Regulatory Pressures Fragmenting…
Best practices in Internet Standards
What is and isn't Working in the…
New Opportunities for American…
DNS Abuse
DNS over HTTPS / DNS over TLS
Whois
Response Count - 8 or HigherBreakdown by Response
Essential Important Not Very Important
1.7 1.8 1.9 2 2.1 2.2 2.3 2.4 2.5 2.6
Regulatory Pressures Fragmenting the Internet
Best practices in Internet Standards
What is and isn’t Working in the Multistakeholder Model
DNS Abuse
New Opportunities for American Leadership in Standards and IP Policy
DNS over HTTPS / DNS over TLS
Whois
Regulatory PressuresFragmenting the
Internet
Best practices inInternet Standards
What is and isn’t Working in the
Multistakeholder Model
DNS Abuse
New Opportunitiesfor AmericanLeadership in
Standards and IPPolicy
DNS over HTTPS /DNS over TLS
Whois
Scored - 8 + 2.492.372.242.222.172.091.85
Scored - 5 + 2.412.22.312.042.111.961.84
All 2.192.172.052.181.982.081.71
Mean Scores - Comparison Across Metrics
Scored - 8 + Scored - 5 + All
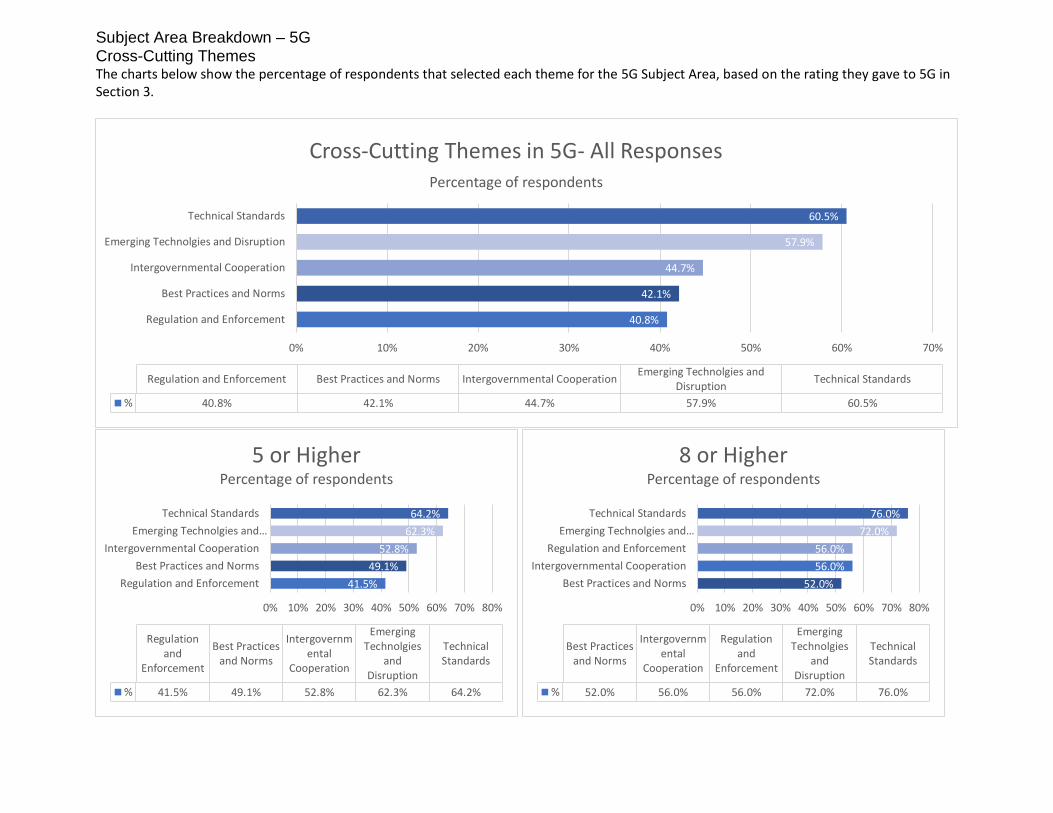
Subject Area Breakdown – 5G Cross-Cutting Themes The charts below show the percentage of respondents that selected each theme for the 5G Subject Area, based on the rating they gave to 5G in Section 3.
60.5%
57.9%
44.7%
42.1%
40.8%
0% 10% 20% 30% 40% 50% 60% 70%
Technical Standards
Emerging Technolgies and Disruption
Intergovernmental Cooperation
Best Practices and Norms
Regulation and Enforcement
Technical StandardsEmerging Technolgies and
DisruptionIntergovernmental CooperationBest Practices and NormsRegulation and Enforcement
% 60.5%57.9%44.7%42.1%40.8%
Cross-Cutting Themes in 5G- All ResponsesPercentage of respondents
64.2%
62.3%
52.8%
49.1%
41.5%
0% 10% 20% 30% 40% 50% 60% 70% 80%
Technical Standards
Emerging Technolgies and…
Intergovernmental Cooperation
Best Practices and Norms
Regulation and Enforcement
TechnicalStandards
EmergingTechnolgies
andDisruption
Intergovernmental
Cooperation
Best Practicesand Norms
Regulationand
Enforcement
% 64.2%62.3%52.8%49.1%41.5%
5 or HigherPercentage of respondents
76.0%
72.0%
56.0%
56.0%
52.0%
0% 10% 20% 30% 40% 50% 60% 70% 80%
Technical Standards
Emerging Technolgies and…
Regulation and Enforcement
Intergovernmental Cooperation
Best Practices and Norms
TechnicalStandards
EmergingTechnolgies
andDisruption
Regulationand
Enforcement
Intergovernmental
Cooperation
Best Practicesand Norms
% 76.0%72.0%56.0%56.0%52.0%
8 or HigherPercentage of respondents
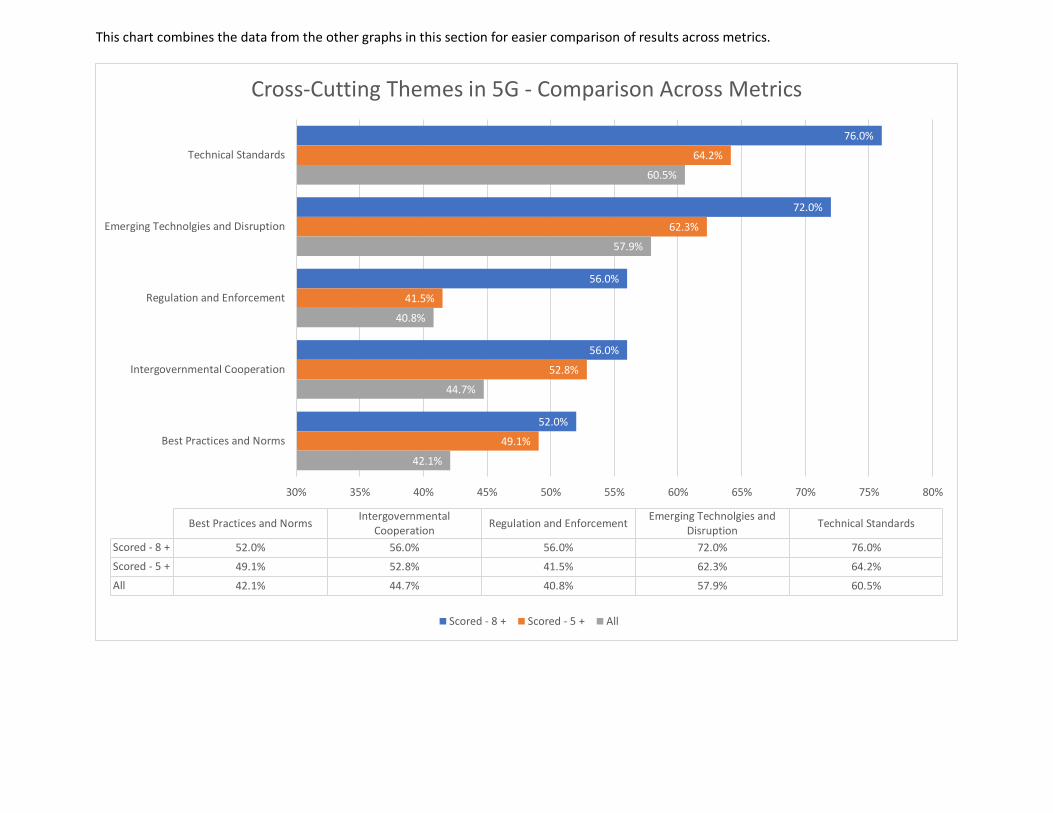
This chart combines the data from the other graphs in this section for easier comparison of results across metrics.
76.0%
72.0%
56.0%
56.0%
52.0%
64.2%
62.3%
41.5%
52.8%
49.1%
60.5%
57.9%
40.8%
44.7%
42.1%
30% 35% 40% 45% 50% 55% 60% 65% 70% 75% 80%
Technical Standards
Emerging Technolgies and Disruption
Regulation and Enforcement
Intergovernmental Cooperation
Best Practices and Norms
Technical StandardsEmerging Technolgies and
DisruptionRegulation and Enforcement
IntergovernmentalCooperation
Best Practices and Norms
Scored - 8 + 76.0%72.0%56.0%56.0%52.0%
Scored - 5 + 64.2%62.3%41.5%52.8%49.1%
All 60.5%57.9%40.8%44.7%42.1%
Cross-Cutting Themes in 5G - Comparison Across Metrics
Scored - 8 + Scored - 5 + All
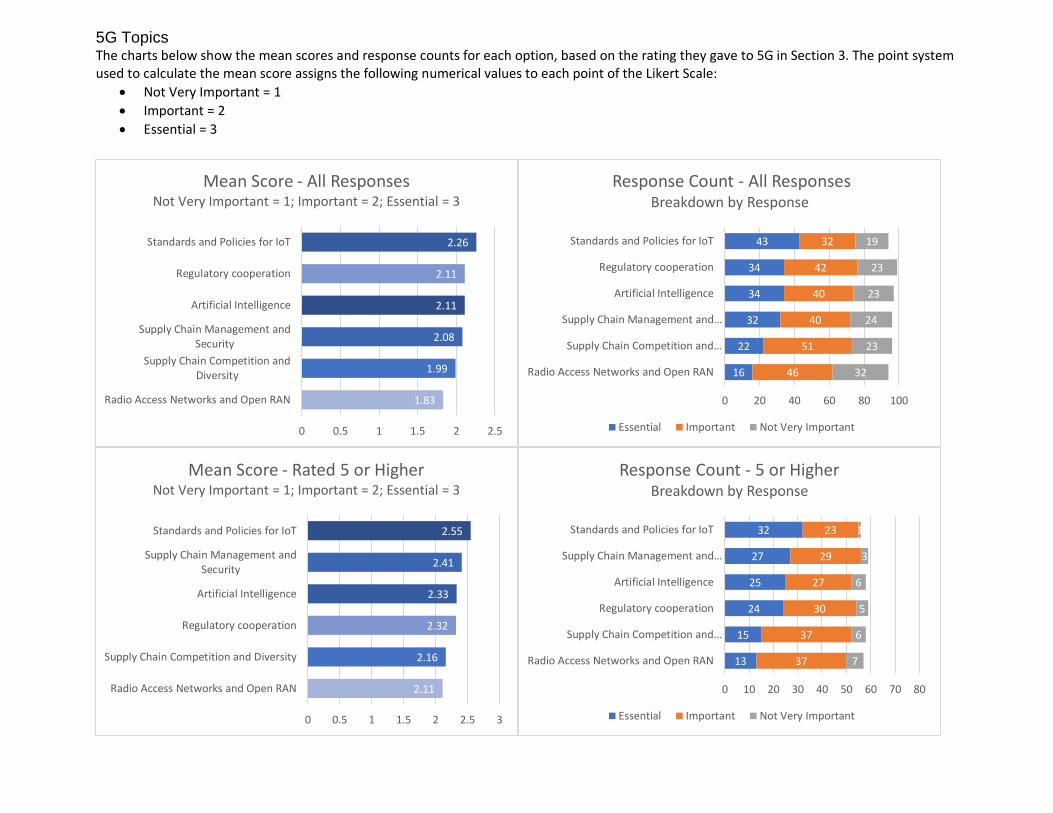
5G Topics The charts below show the mean scores and response counts for each option, based on the rating they gave to 5G in Section 3. The point system used to calculate the mean score assigns the following numerical values to each point of the Likert Scale:
• Not Very Important = 1
• Important = 2
• Essential = 3
2.26
2.11
2.11
2.08
1.99
1.83
0 0.5 1 1.5 2 2.5
Standards and Policies for IoT
Regulatory cooperation
Artificial Intelligence
Supply Chain Management andSecurity
Supply Chain Competition andDiversity
Radio Access Networks and Open RAN
Mean Score - All Responses Not Very Important = 1; Important = 2; Essential = 3
43
34
34
32
22
16
32
42
40
40
51
46
19
23
23
24
23
32
0 20 40 60 80 100
Standards and Policies for IoT
Regulatory cooperation
Artificial Intelligence
Supply Chain Management and…
Supply Chain Competition and…
Radio Access Networks and Open RAN
Response Count - All ResponsesBreakdown by Response
Essential Important Not Very Important
2.55
2.41
2.33
2.32
2.16
2.11
0 0.5 1 1.5 2 2.5 3
Standards and Policies for IoT
Supply Chain Management andSecurity
Artificial Intelligence
Regulatory cooperation
Supply Chain Competition and Diversity
Radio Access Networks and Open RAN
Mean Score - Rated 5 or HigherNot Very Important = 1; Important = 2; Essential = 3
32
27
25
24
15
13
23
29
27
30
37
37
1
3
6
5
6
7
0 10 20 30 40 50 60 70 80
Standards and Policies for IoT
Supply Chain Management and…
Artificial Intelligence
Regulatory cooperation
Supply Chain Competition and…
Radio Access Networks and Open RAN
Response Count - 5 or Higher Breakdown by Response
Essential Important Not Very Important
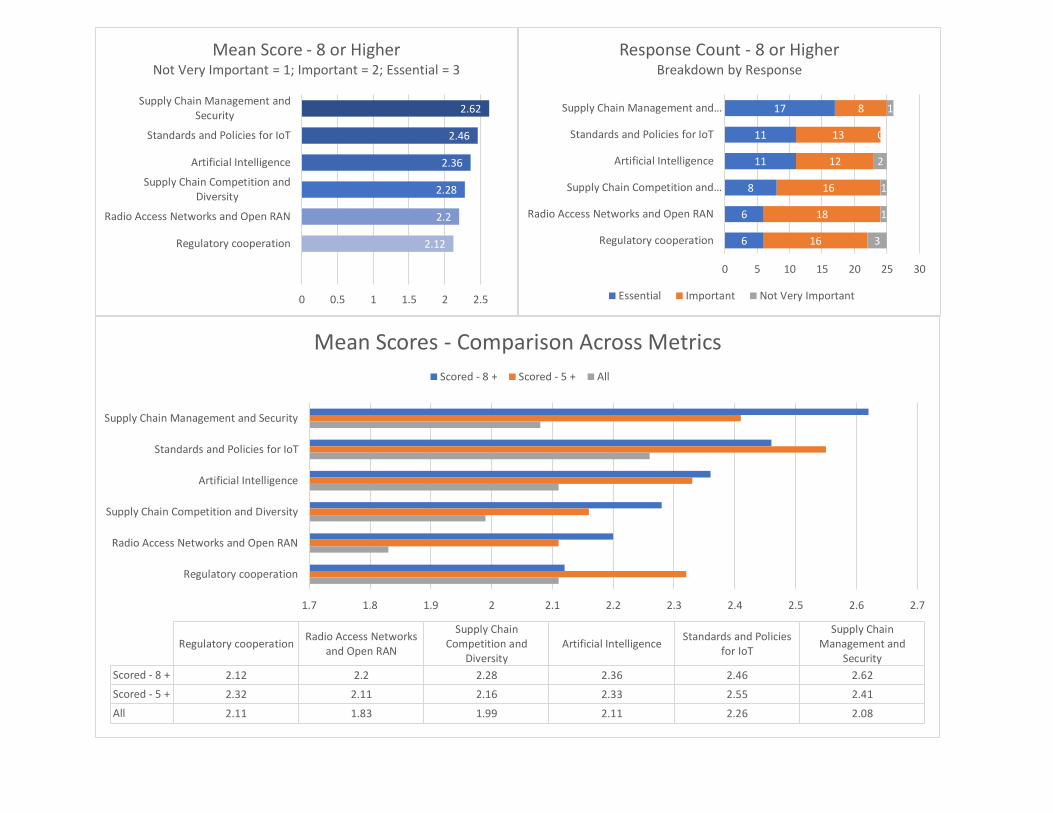
2.62
2.46
2.36
2.28
2.2
2.12
0 0.5 1 1.5 2 2.5
Supply Chain Management andSecurity
Standards and Policies for IoT
Artificial Intelligence
Supply Chain Competition andDiversity
Radio Access Networks and Open RAN
Regulatory cooperation
Mean Score - 8 or HigherNot Very Important = 1; Important = 2; Essential = 3
17
11
11
8
6
6
8
13
12
16
18
16
1
0
2
1
1
3
0 5 10 15 20 25 30
Supply Chain Management and…
Standards and Policies for IoT
Artificial Intelligence
Supply Chain Competition and…
Radio Access Networks and Open RAN
Regulatory cooperation
Response Count - 8 or HigherBreakdown by Response
Essential Important Not Very Important
1.7 1.8 1.9 2 2.1 2.2 2.3 2.4 2.5 2.6 2.7
Supply Chain Management and Security
Standards and Policies for IoT
Artificial Intelligence
Supply Chain Competition and Diversity
Radio Access Networks and Open RAN
Regulatory cooperation
Supply ChainManagement and
Security
Standards and Policiesfor IoT
Artificial IntelligenceSupply Chain
Competition andDiversity
Radio Access Networksand Open RAN
Regulatory cooperation
Scored - 8 + 2.622.462.362.282.22.12
Scored - 5 + 2.412.552.332.162.112.32
All 2.082.262.111.991.832.11
Mean Scores - Comparison Across Metrics
Scored - 8 + Scored - 5 + All

Subject Area Breakdown – Access & Digital Inclusion Cross-Cutting Themes The charts below show the percentage of respondents that selected each theme for the Access & Digital Inclusion Subject Area, based on the rating they gave to Access & Digital Inclusion in Section 3.
72.8%
55.6%
54.3%
45.7%
28.4%
0% 10% 20% 30% 40% 50% 60% 70% 80%
Best Practices and Norms
Emerging Technolgies and Disruption
Intergovernmental Cooperation
Regulation and Enforcement
Technical Standards
Best Practices and NormsEmerging Technolgies and
DisruptionIntergovernmental
CooperationRegulation and EnforcementTechnical Standards
% 72.8%55.6%54.3%45.7%28.4%
Cross-Cutting Themes in Access & Digital Inclusion - All ResponsesPercentage of respondents
79.3%
56.9%
55.2%
50.0%
31.0%
0% 20% 40% 60% 80% 100%
Best Practices and Norms
Emerging Technolgies and…
Intergovernmental Cooperation
Regulation and Enforcement
Technical Standards
Best Practicesand Norms
EmergingTechnolgies
andDisruption
Intergovernmental
Cooperation
Regulationand
Enforcement
TechnicalStandards
% 79.3%56.9%55.2%50.0%31.0%
5 or HigherPercentage of respondents
83.8%
64.9%
62.2%
56.8%
40.5%
0% 20% 40% 60% 80% 100%
Best Practices and Norms
Emerging Technolgies and…
Intergovernmental Cooperation
Regulation and Enforcement
Technical Standards
Best Practicesand Norms
EmergingTechnolgies
andDisruption
Intergovernmental
Cooperation
Regulationand
Enforcement
TechnicalStandards
% 83.8%64.9%62.2%56.8%40.5%
8 or HigherPercentage of respondents

This chart combines the data from the other graphs in this section for easier comparison of results across metrics.
83.8%
64.9%
62.2%
56.8%
40.5%
79.3%
56.9%
55.2%
50.0%
31.0%
72.8%
55.6%
54.3%
45.7%
28.4%
25% 35% 45% 55% 65% 75% 85%
Best Practices and Norms
Emerging Technolgies and Disruption
Intergovernmental Cooperation
Regulation and Enforcement
Technical Standards
Best Practices and NormsEmerging Technolgies and
DisruptionIntergovernmental
CooperationRegulation and EnforcementTechnical Standards
Scored - 8 + 83.8%64.9%62.2%56.8%40.5%
Scored - 5 + 79.3%56.9%55.2%50.0%31.0%
All 72.8%55.6%54.3%45.7%28.4%
Cross-Cutting Themes in Access & Digital Inclusion - Comparison Across Metrics
Scored - 8 + Scored - 5 + All
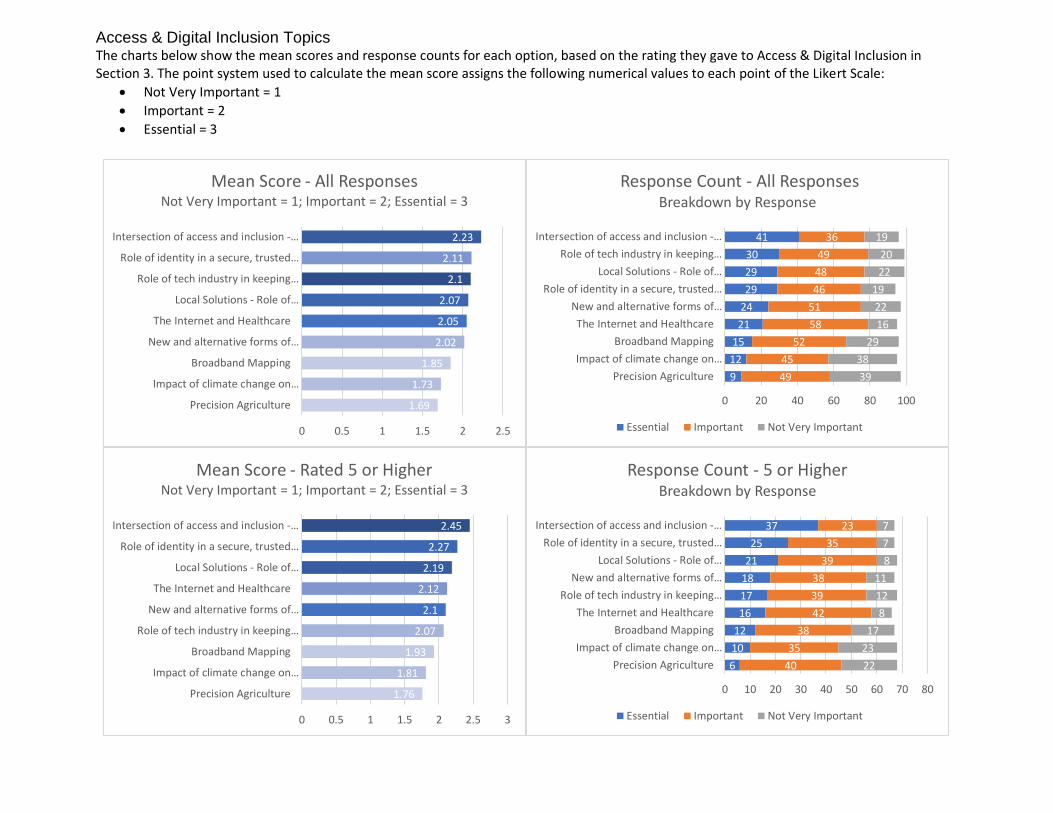
Access & Digital Inclusion Topics The charts below show the mean scores and response counts for each option, based on the rating they gave to Access & Digital Inclusion in Section 3. The point system used to calculate the mean score assigns the following numerical values to each point of the Likert Scale:
• Not Very Important = 1
• Important = 2
• Essential = 3
2.23
2.11
2.1
2.07
2.05
2.02
1.85
1.73
1.69
0 0.5 1 1.5 2 2.5
Intersection of access and inclusion -…
Role of identity in a secure, trusted…
Role of tech industry in keeping…
Local Solutions - Role of…
The Internet and Healthcare
New and alternative forms of…
Broadband Mapping
Impact of climate change on…
Precision Agriculture
Mean Score - All Responses Not Very Important = 1; Important = 2; Essential = 3
41
30
29
29
24
21
15
12
9
36
49
48
46
51
58
52
45
49
19
20
22
19
22
16
29
38
39
0 20 40 60 80 100
Intersection of access and inclusion -…
Role of tech industry in keeping…
Local Solutions - Role of…
Role of identity in a secure, trusted…
New and alternative forms of…
The Internet and Healthcare
Broadband Mapping
Impact of climate change on…
Precision Agriculture
Response Count - All ResponsesBreakdown by Response
Essential Important Not Very Important
2.45
2.27
2.19
2.12
2.1
2.07
1.93
1.81
1.76
0 0.5 1 1.5 2 2.5 3
Intersection of access and inclusion -…
Role of identity in a secure, trusted…
Local Solutions - Role of…
The Internet and Healthcare
New and alternative forms of…
Role of tech industry in keeping…
Broadband Mapping
Impact of climate change on…
Precision Agriculture
Mean Score - Rated 5 or HigherNot Very Important = 1; Important = 2; Essential = 3
37
25
21
18
17
16
12
10
6
23
35
39
38
39
42
38
35
40
7
7
8
11
12
8
17
23
22
0 10 20 30 40 50 60 70 80
Intersection of access and inclusion -…
Role of identity in a secure, trusted…
Local Solutions - Role of…
New and alternative forms of…
Role of tech industry in keeping…
The Internet and Healthcare
Broadband Mapping
Impact of climate change on…
Precision Agriculture
Response Count - 5 or Higher Breakdown by Response
Essential Important Not Very Important

2.72
2.42
2.25
2.24
2.22
2.22
2.05
1.95
1.84
0 0.5 1 1.5 2 2.5 3
Intersection of access and inclusion -…
Local Solutions - Role of…
The Internet and Healthcare
Role of identity in a secure, trusted…
Broadband Mapping
New and alternative forms of…
Role of tech industry in keeping…
Impact of climate change on…
Precision Agriculture
Mean Score - 8 or HigherNot Very Important = 1; Important = 2; Essential = 3
26
17
12
11
10
10
6
5
3
10
20
22
22
25
24
23
29
25
1
3
3
1
2
8
3
9
0 5 10 15 20 25 30 35 40
Intersection of access and inclusion -…
Local Solutions - Role of…
Role of identity in a secure, trusted…
New and alternative forms of…
The Internet and Healthcare
Broadband Mapping
Impact of climate change on…
Role of tech industry in keeping…
Precision Agriculture
Response Count - 8 or HigherBreakdown by Response
Essential Important Not Very Important
1.7 1.9 2.1 2.3 2.5 2.7 2.9
Intersection of access and inclusion - Affordability, accessibility, literacy,…
Local Solutions - Role of governments, libraries, and Community Networks
The Internet and Healthcare
Role of identity in a secure, trusted and inclusive Internet
Broadband Mapping
New and alternative forms of connectivity (Satellites, 5G, mesh)
Intersection of accessand inclusion -Affordability,
accessibility, literacy,economic opportunity
Local Solutions - Role ofgovernments, libraries,
and CommunityNetworks
The Internet andHealthcare
Role of identity in asecure, trusted andinclusive Internet
Broadband MappingNew and alternativeforms of connectivity(Satellites, 5G, mesh)
Scored - 8 + 2.722.422.252.242.222.22
Scored - 5 + 2.452.192.122.271.932.1
All 2.232.072.052.111.852.02
Mean Scores - Comparison Across Metrics
Scored - 8 + Scored - 5 + All

Subject Area Breakdown – Artificial Intelligence Cross-Cutting Themes The charts below show the percentage of respondents that selected each theme for the Artificial Intelligence Subject Area, based on the rating they gave to Artificial Intelligence in Section 3.
70.0%
62.5%
43.8%
43.8%
42.5%
0% 10% 20% 30% 40% 50% 60% 70% 80%
Emerging Technolgies and Disruption
Best Practices and Norms
Regulation and Enforcement
Intergovernmental Cooperation
Technical Standards
Emerging Technolgies andDisruption
Best Practices and NormsRegulation and EnforcementIntergovernmental
CooperationTechnical Standards
% 70.0%62.5%43.8%43.8%42.5%
Cross-Cutting Themes in Artificial Intelligence - All ResponsesPercentage of respondents
74.1%
69.0%
51.7%
50.0%
44.8%
0% 20% 40% 60% 80% 100%
Emerging Technolgies and…
Best Practices and Norms
Intergovernmental Cooperation
Technical Standards
Regulation and Enforcement
EmergingTechnolgies
andDisruption
Best Practicesand Norms
Intergovernmental
Cooperation
TechnicalStandards
Regulationand
Enforcement
% 74.1%69.0%51.7%50.0%44.8%
5 or HigherPercentage of respondents
88.9%
70.4%
63.0%
51.9%
44.4%
0% 20% 40% 60% 80% 100%
Emerging Technolgies and…
Best Practices and Norms
Intergovernmental Cooperation
Regulation and Enforcement
Technical Standards
EmergingTechnolgies
andDisruption
Best Practicesand Norms
Intergovernmental
Cooperation
Regulationand
Enforcement
TechnicalStandards
% 88.9%70.4%63.0%51.9%44.4%
8 or HigherPercentage of respondents
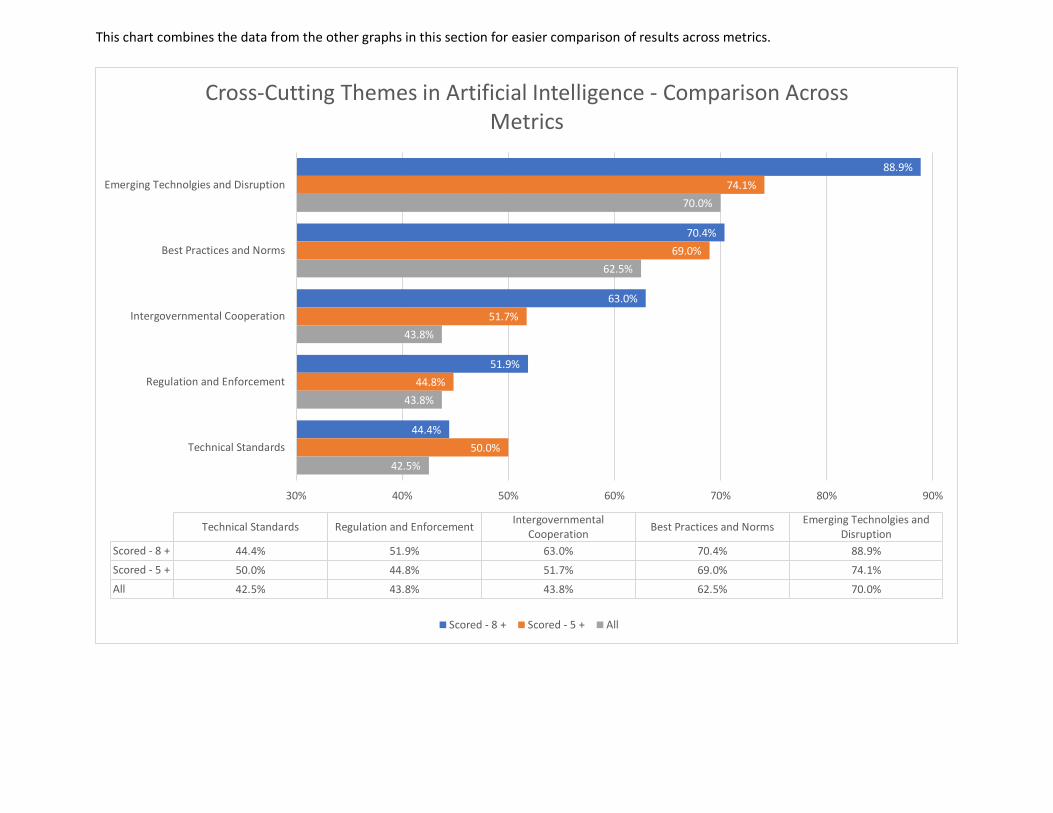
This chart combines the data from the other graphs in this section for easier comparison of results across metrics.
88.9%
70.4%
63.0%
51.9%
44.4%
74.1%
69.0%
51.7%
44.8%
50.0%
70.0%
62.5%
43.8%
43.8%
42.5%
30% 40% 50% 60% 70% 80% 90%
Emerging Technolgies and Disruption
Best Practices and Norms
Intergovernmental Cooperation
Regulation and Enforcement
Technical Standards
Emerging Technolgies andDisruption
Best Practices and NormsIntergovernmental
CooperationRegulation and EnforcementTechnical Standards
Scored - 8 + 88.9%70.4%63.0%51.9%44.4%
Scored - 5 + 74.1%69.0%51.7%44.8%50.0%
All 70.0%62.5%43.8%43.8%42.5%
Cross-Cutting Themes in Artificial Intelligence - Comparison Across Metrics
Scored - 8 + Scored - 5 + All

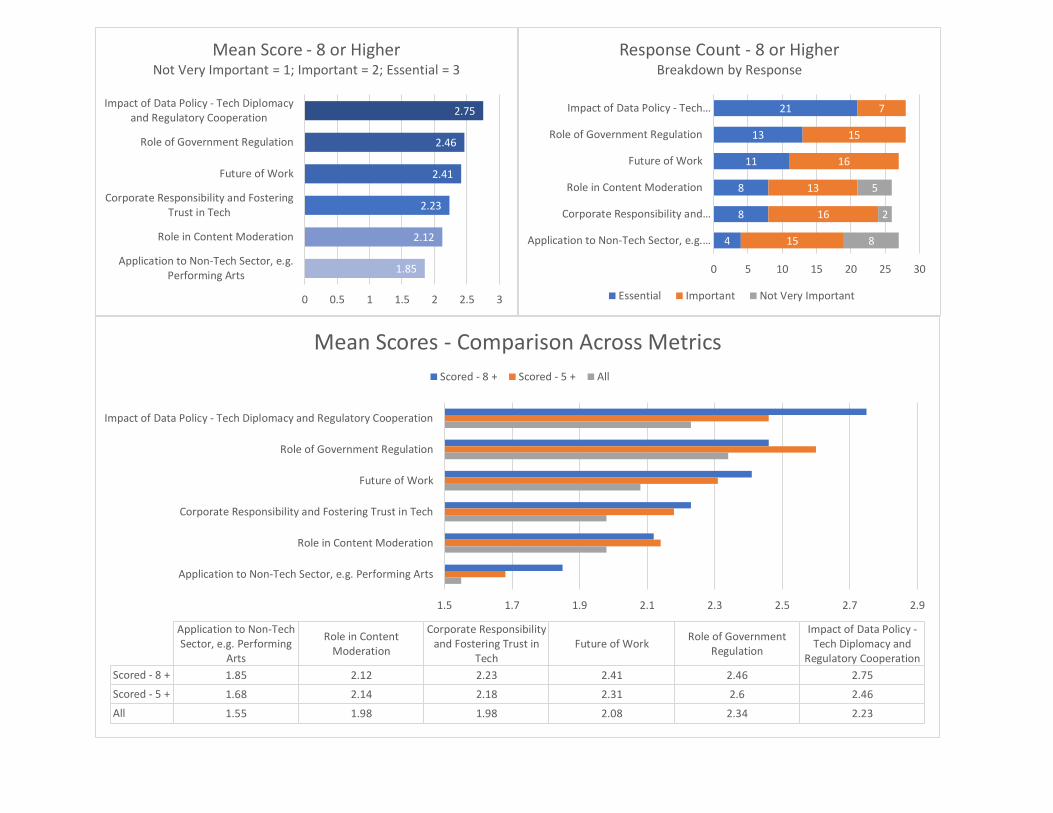
Artificial Intelligence Topics The charts below show the mean scores and response counts for each option, based on the rating they gave to Artificial Intelligence in Section 3. The point system used to calculate the mean score assigns the following numerical values to each point of the Likert Scale:
• Not Very Important = 1
• Important = 2
• Essential = 3
2.34
2.23
2.08
1.98
1.98
1.55
0 0.5 1 1.5 2 2.5
Role of Government Regulation
Impact of Data Policy - Tech Diplomacyand Regulatory Cooperation
Future of Work
Role in Content Moderation
Corporate Responsibility and FosteringTrust in Tech
Application to Non-Tech Sector, e.g.Performing Arts
Mean Score - All Responses Not Very Important = 1; Important = 2; Essential = 3
47
44
25
22
19
8
40
36
54
49
57
37
13
21
17
24
21
52
0 20 40 60 80 100
Role of Government Regulation
Impact of Data Policy - Tech…
Future of Work
Role in Content Moderation
Corporate Responsibility and…
Application to Non-Tech Sector, e.g.…
Response Count - All ResponsesBreakdown by Response
Essential Important Not Very Important
2.6
2.46
2.31
2.18
2.14
1.68
0 0.5 1 1.5 2 2.5 3
Role of Government Regulation
Impact of Data Policy - Tech Diplomacyand Regulatory Cooperation
Future of Work
Corporate Responsibility and FosteringTrust in Tech
Role in Content Moderation
Application to Non-Tech Sector, e.g.Performing Arts
Mean Score - Rated 5 or HigherNot Very Important = 1; Important = 2; Essential = 3
40
36
23
19
18
6
27
26
39
36
41
33
5
3
10
6
27
0 10 20 30 40 50 60 70
Role of Government Regulation
Impact of Data Policy - Tech…
Future of Work
Role in Content Moderation
Corporate Responsibility and…
Application to Non-Tech Sector, e.g.…
Response Count - 5 or Higher Breakdown by Response
Essential Important Not Very Important
2.75
2.46
2.41
2.23
2.12
1.85
0 0.5 1 1.5 2 2.5 3
Impact of Data Policy - Tech Diplomacyand Regulatory Cooperation
Role of Government Regulation
Future of Work
Corporate Responsibility and FosteringTrust in Tech
Role in Content Moderation
Application to Non-Tech Sector, e.g.Performing Arts
Mean Score - 8 or HigherNot Very Important = 1; Important = 2; Essential = 3
21
13
11
8
8
4
7
15
16
13
16
15
5
2
8
0 5 10 15 20 25 30
Impact of Data Policy - Tech…
Role of Government Regulation
Future of Work
Role in Content Moderation
Corporate Responsibility and…
Application to Non-Tech Sector, e.g.…
Response Count - 8 or HigherBreakdown by Response
Essential Important Not Very Important
1.5 1.7 1.9 2.1 2.3 2.5 2.7 2.9
Impact of Data Policy - Tech Diplomacy and Regulatory Cooperation
Role of Government Regulation
Future of Work
Corporate Responsibility and Fostering Trust in Tech
Role in Content Moderation
Application to Non-Tech Sector, e.g. Performing Arts
Impact of Data Policy -Tech Diplomacy and
Regulatory Cooperation
Role of GovernmentRegulation
Future of WorkCorporate Responsibility
and Fostering Trust inTech
Role in ContentModeration
Application to Non-TechSector, e.g. Performing
Arts
Scored - 8 + 2.752.462.412.232.121.85
Scored - 5 + 2.462.62.312.182.141.68
All 2.232.342.081.981.981.55
Mean Scores - Comparison Across Metrics
Scored - 8 + Scored - 5 + All

Subject Area Breakdown – Digital Market and Competition Cross-Cutting Themes The charts below show the percentage of respondents that selected each theme for the Digital Market and Competition Subject Area, based on the rating they gave to Trust in Section 3.
72.9%
70.6%
61.2%
61.2%
22.4%
0% 10% 20% 30% 40% 50% 60% 70% 80%
Regulation and Enforcement
Intergovernmental Cooperation
Best Practices and Norms
Emerging Technolgies and Disruption
Technical Standards
Regulation and EnforcementIntergovernmental
CooperationBest Practices and Norms
Emerging Technolgies andDisruption
Technical Standards
% 72.9%70.6%61.2%61.2%22.4%
% 72.9%70.6%61.2%61.2%22.4%
Cross-Cutting Themes in Digital Markets and Competition - AllPercentage of respondents
76.7%
75.3%
65.8%
60.3%
23.3%
0% 20% 40% 60% 80% 100%
Regulation and Enforcement
Intergovernmental Cooperation
Emerging Technolgies and…
Best Practices and Norms
Technical Standards
Regulationand
Enforcement
Intergovernmental
Cooperation
EmergingTechnolgies
andDisruption
Best Practicesand Norms
TechnicalStandards
% 76.7%75.3%65.8%60.3%23.3%
5 or HigherPercentage of respondents
82.8%
69.0%
62.1%
58.6%
34.5%
0% 20% 40% 60% 80% 100%
Regulation and Enforcement
Emerging Technolgies and…
Best Practices and Norms
Intergovernmental Cooperation
Technical Standards
Regulationand
Enforcement
EmergingTechnolgies
andDisruption
Best Practicesand Norms
Intergovernmental
Cooperation
TechnicalStandards
% 82.8%69.0%62.1%58.6%34.5%
8 or HigherPercentage of respondents

This chart combines the data from the other graphs in this section for easier comparison of results across metrics.
82.8%
69.0%
62.1%
58.6%
34.5%
76.7%
65.8%
60.3%
75.3%
23.3%
72.9%
61.2%
61.2%
70.6%
22.4%
10% 20% 30% 40% 50% 60% 70% 80%
Regulation and Enforcement
Emerging Technolgies and Disruption
Best Practices and Norms
Intergovernmental Cooperation
Technical Standards
Regulation and EnforcementEmerging Technolgies and
DisruptionBest Practices and Norms
IntergovernmentalCooperation
Technical Standards
Scored - 8 + 82.8%69.0%62.1%58.6%34.5%
Scored - 5 + 76.7%65.8%60.3%75.3%23.3%
All 72.9%61.2%61.2%70.6%22.4%
Cross-Cutting Themes in Digital Markets and Competition -Comparison Across Metrics
Scored - 8 + Scored - 5 + All
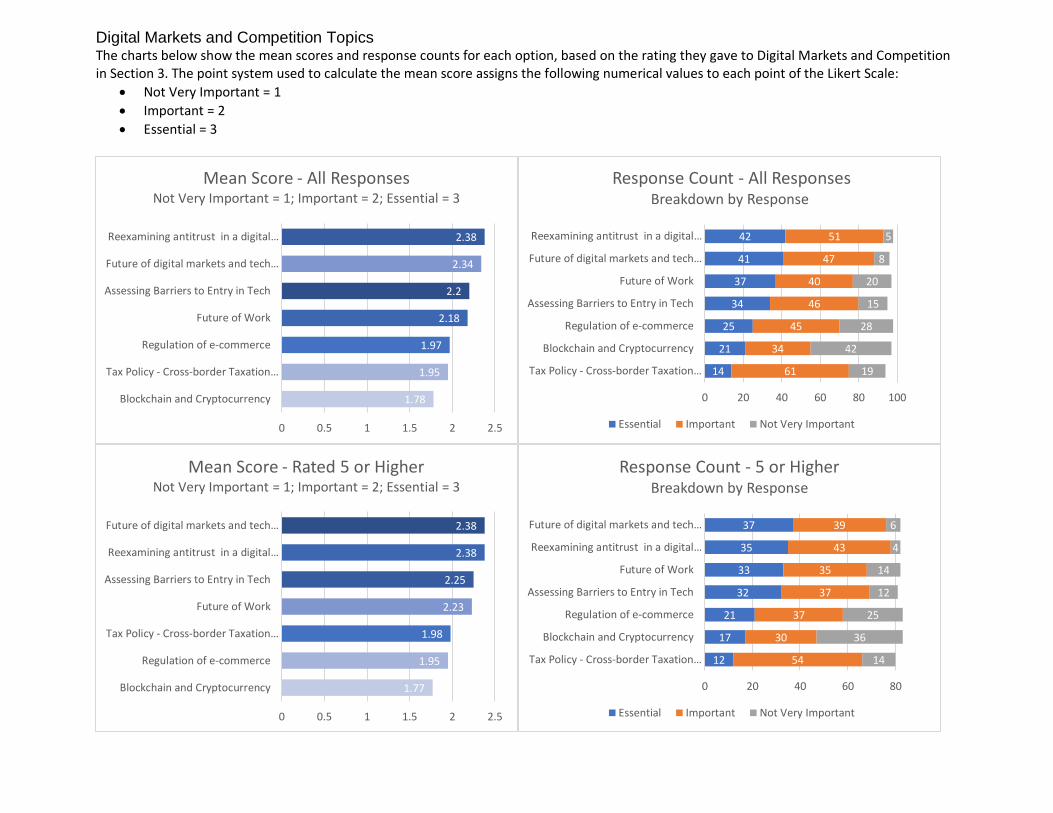
Digital Markets and Competition Topics The charts below show the mean scores and response counts for each option, based on the rating they gave to Digital Markets and Competition in Section 3. The point system used to calculate the mean score assigns the following numerical values to each point of the Likert Scale:
• Not Very Important = 1
• Important = 2
• Essential = 3
2.38
2.34
2.2
2.18
1.97
1.95
1.78
0 0.5 1 1.5 2 2.5
Reexamining antitrust in a digital…
Future of digital markets and tech…
Assessing Barriers to Entry in Tech
Future of Work
Regulation of e-commerce
Tax Policy - Cross-border Taxation…
Blockchain and Cryptocurrency
Mean Score - All Responses Not Very Important = 1; Important = 2; Essential = 3
42
41
37
34
25
21
14
51
47
40
46
45
34
61
5
8
20
15
28
42
19
0 20 40 60 80 100
Reexamining antitrust in a digital…
Future of digital markets and tech…
Future of Work
Assessing Barriers to Entry in Tech
Regulation of e-commerce
Blockchain and Cryptocurrency
Tax Policy - Cross-border Taxation…
Response Count - All ResponsesBreakdown by Response
Essential Important Not Very Important
2.38
2.38
2.25
2.23
1.98
1.95
1.77
0 0.5 1 1.5 2 2.5
Future of digital markets and tech…
Reexamining antitrust in a digital…
Assessing Barriers to Entry in Tech
Future of Work
Tax Policy - Cross-border Taxation…
Regulation of e-commerce
Blockchain and Cryptocurrency
Mean Score - Rated 5 or HigherNot Very Important = 1; Important = 2; Essential = 3
37
35
33
32
21
17
12
39
43
35
37
37
30
54
6
4
14
12
25
36
14
0 20 40 60 80
Future of digital markets and tech…
Reexamining antitrust in a digital…
Future of Work
Assessing Barriers to Entry in Tech
Regulation of e-commerce
Blockchain and Cryptocurrency
Tax Policy - Cross-border Taxation…
Response Count - 5 or Higher Breakdown by Response
Essential Important Not Very Important

2.58
2.39
2.19
2.06
2.03
1.97
1.81
0 0.5 1 1.5 2 2.5 3
Reexamining antitrust in a digital…
Future of digital markets and tech…
Assessing Barriers to Entry in Tech
Regulation of e-commerce
Future of Work
Tax Policy - Cross-border Taxation…
Blockchain and Cryptocurrency
Mean Score - 8 or HigherNot Very Important = 1; Important = 2; Essential = 3
20
13
9
9
9
6
4
12
17
19
16
15
13
21
1
1
3
7
8
12
5
0 5 10 15 20 25 30 35 40
Reexamining antitrust in a digital…
Future of digital markets and tech…
Assessing Barriers to Entry in Tech
Regulation of e-commerce
Future of Work
Blockchain and Cryptocurrency
Tax Policy - Cross-border Taxation…
Response Count - 8 or HigherBreakdown by Response
Essential Important Not Very Important
1.7 1.8 1.9 2 2.1 2.2 2.3 2.4 2.5 2.6 2.7
Reexamining antitrust in a digital economy
Future of digital markets and tech businesses
Assessing Barriers to Entry in Tech
Regulation of e-commerce
Future of Work
Tax Policy - Cross-border Taxation and taxing platforms for news and…
Reexamining antitrust ina digital economy
Future of digital marketsand tech businesses
Assessing Barriers toEntry in Tech
Regulation of e-commerce
Future of Work
Tax Policy - Cross-borderTaxation and taxing
platforms for news andjournalism
Scored - 8 + 2.582.392.192.062.031.97
Scored - 5 + 2.382.382.251.952.231.98
All 2.382.342.21.972.181.95
Mean Scores - Comparison Across Metrics
Scored - 8 + Scored - 5 + All
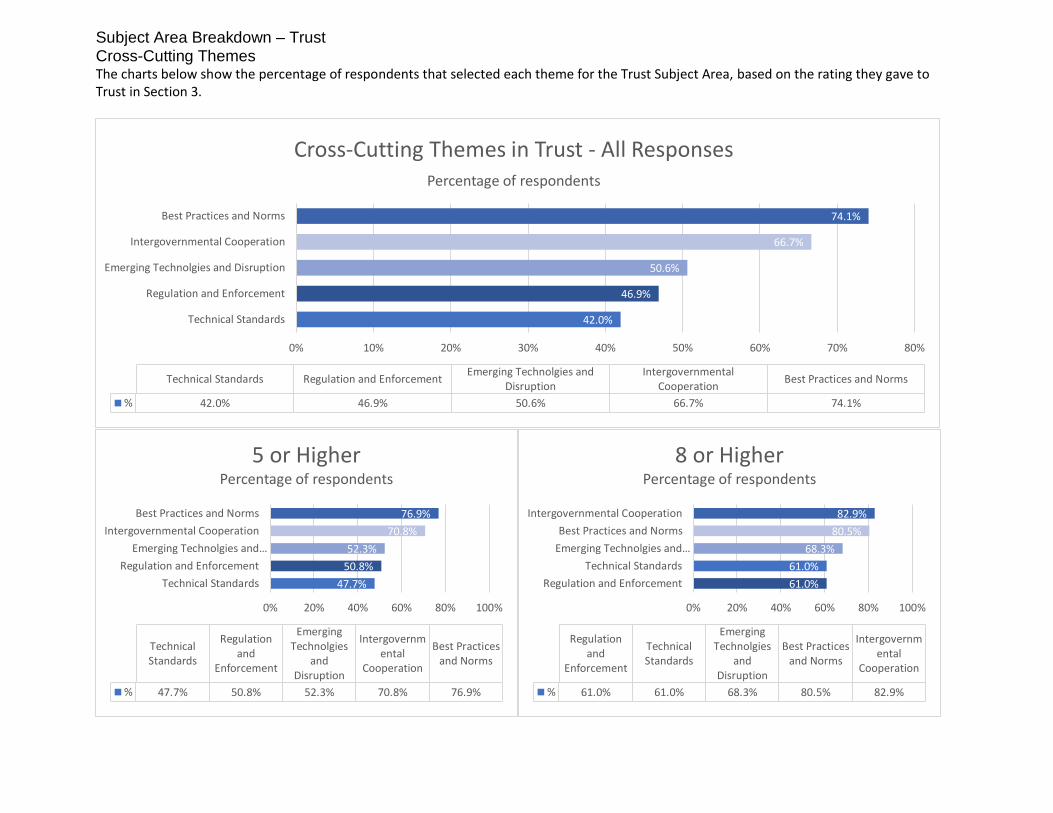
Subject Area Breakdown – Trust Cross-Cutting Themes The charts below show the percentage of respondents that selected each theme for the Trust Subject Area, based on the rating they gave to Trust in Section 3.
74.1%
66.7%
50.6%
46.9%
42.0%
0% 10% 20% 30% 40% 50% 60% 70% 80%
Best Practices and Norms
Intergovernmental Cooperation
Emerging Technolgies and Disruption
Regulation and Enforcement
Technical Standards
Best Practices and NormsIntergovernmental
CooperationEmerging Technolgies and
DisruptionRegulation and EnforcementTechnical Standards
% 74.1%66.7%50.6%46.9%42.0%
Cross-Cutting Themes in Trust - All ResponsesPercentage of respondents
76.9%
70.8%
52.3%
50.8%
47.7%
0% 20% 40% 60% 80% 100%
Best Practices and Norms
Intergovernmental Cooperation
Emerging Technolgies and…
Regulation and Enforcement
Technical Standards
Best Practicesand Norms
Intergovernmental
Cooperation
EmergingTechnolgies
andDisruption
Regulationand
Enforcement
TechnicalStandards
% 76.9%70.8%52.3%50.8%47.7%
5 or HigherPercentage of respondents
82.9%
80.5%
68.3%
61.0%
61.0%
0% 20% 40% 60% 80% 100%
Intergovernmental Cooperation
Best Practices and Norms
Emerging Technolgies and…
Technical Standards
Regulation and Enforcement
Intergovernmental
Cooperation
Best Practicesand Norms
EmergingTechnolgies
andDisruption
TechnicalStandards
Regulationand
Enforcement
% 82.9%80.5%68.3%61.0%61.0%
8 or HigherPercentage of respondents
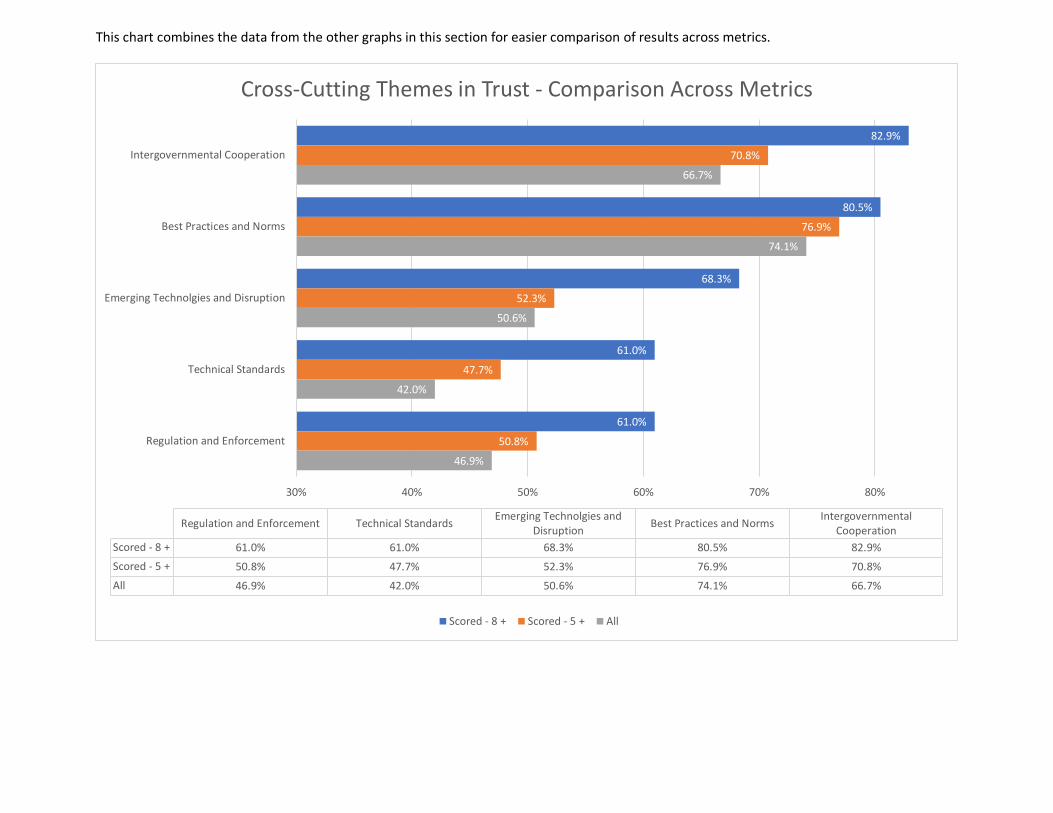
This chart combines the data from the other graphs in this section for easier comparison of results across metrics.
82.9%
80.5%
68.3%
61.0%
61.0%
70.8%
76.9%
52.3%
47.7%
50.8%
66.7%
74.1%
50.6%
42.0%
46.9%
30% 40% 50% 60% 70% 80%
Intergovernmental Cooperation
Best Practices and Norms
Emerging Technolgies and Disruption
Technical Standards
Regulation and Enforcement
IntergovernmentalCooperation
Best Practices and NormsEmerging Technolgies and
DisruptionTechnical StandardsRegulation and Enforcement
Scored - 8 + 82.9%80.5%68.3%61.0%61.0%
Scored - 5 + 70.8%76.9%52.3%47.7%50.8%
All 66.7%74.1%50.6%42.0%46.9%
Cross-Cutting Themes in Trust - Comparison Across Metrics
Scored - 8 + Scored - 5 + All

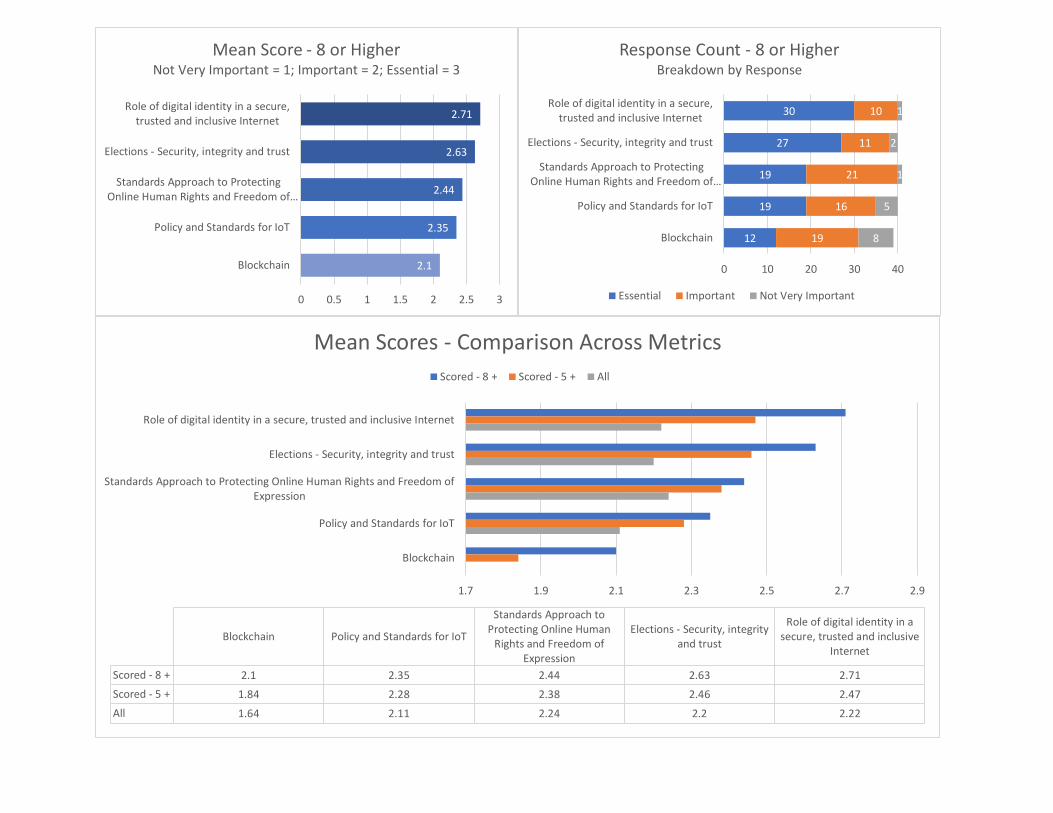
Trust Topics The charts below show the mean scores and response counts for each option, based on the rating they gave to Trust in Section 3. The point system used to calculate the mean score assigns the following numerical values to each point of the Likert Scale:
• Not Very Important = 1
• Important = 2
• Essential = 3
2.24
2.22
2.2
2.11
1.64
0 0.5 1 1.5 2 2.5
Standards Approach to ProtectingOnline Human Rights and Freedom…
Role of digital identity in a secure,trusted and inclusive Internet
Elections - Security, integrity and trust
Policy and Standards for IoT
Blockchain
Mean Score - All Responses Not Very Important = 1; Important = 2; Essential = 3
46
45
36
35
14
32
31
39
54
35
24
25
25
11
50
0 20 40 60 80 100
Role of digital identity in a secure,trusted and inclusive Internet
Elections - Security, integrity and trust
Policy and Standards for IoT
Standards Approach to ProtectingOnline Human Rights and Freedom…
Blockchain
Response Count - All ResponsesBreakdown by Response
Essential Important Not Very Important
2.47
2.46
2.38
2.28
1.84
0 0.5 1 1.5 2 2.5 3
Role of digital identity in a secure,trusted and inclusive Internet
Elections - Security, integrity and trust
Standards Approach to ProtectingOnline Human Rights and Freedom of…
Policy and Standards for IoT
Blockchain
Mean Score - Rated 5 or HigherNot Very Important = 1; Important = 2; Essential = 3
41
40
32
30
13
24
24
34
31
33
7
7
5
10
24
0 10 20 30 40 50 60 70
Role of digital identity in a secure,trusted and inclusive Internet
Elections - Security, integrity and trust
Standards Approach to ProtectingOnline Human Rights and Freedom of…
Policy and Standards for IoT
Blockchain
Response Count - 5 or Higher Breakdown by Response
Essential Important Not Very Important
2.71
2.63
2.44
2.35
2.1
0 0.5 1 1.5 2 2.5 3
Role of digital identity in a secure,trusted and inclusive Internet
Elections - Security, integrity and trust
Standards Approach to ProtectingOnline Human Rights and Freedom of…
Policy and Standards for IoT
Blockchain
Mean Score - 8 or HigherNot Very Important = 1; Important = 2; Essential = 3
30
27
19
19
12
10
11
21
16
19
1
2
1
5
8
0 10 20 30 40
Role of digital identity in a secure,trusted and inclusive Internet
Elections - Security, integrity and trust
Standards Approach to ProtectingOnline Human Rights and Freedom of…
Policy and Standards for IoT
Blockchain
Response Count - 8 or HigherBreakdown by Response
Essential Important Not Very Important
1.7 1.9 2.1 2.3 2.5 2.7 2.9
Role of digital identity in a secure, trusted and inclusive Internet
Elections - Security, integrity and trust
Standards Approach to Protecting Online Human Rights and Freedom ofExpression
Policy and Standards for IoT
Blockchain
Role of digital identity in asecure, trusted and inclusive
Internet
Elections - Security, integrityand trust
Standards Approach toProtecting Online Human
Rights and Freedom ofExpression
Policy and Standards for IoTBlockchain
Scored - 8 + 2.712.632.442.352.1
Scored - 5 + 2.472.462.382.281.84
All 2.222.22.242.111.64
Mean Scores - Comparison Across Metrics
Scored - 8 + Scored - 5 + All

Annex: Alternative Break Downs of Subject Area Ratings
67
65
59
56
55
54
48
48
38
14
16
23
18
19
32
22
22
25
21
20
12
27
24
11
25
19
26
0 20 40 60 80 100 120
Cybersecurity
Data Governance and Privacy
Content Policy
Trust
Global Internet Infrastructure
Digital Markets and Competition
Access & Digital Inclusion
Artificial Intelligence
5G
CybersecurityData
Governance andPrivacy
Content PolicyTrustGlobal InternetInfrastructure
Digital Marketsand Competition
Access & DigitalInclusion
ArtificialIntelligence
5G
7+ 676559565554484838
5 to 6 141623181932222225
1 to 4 212012272411251926
Subject Area Rating - Alternative Break Down by Response Count
7+ 5 to 6 1 to 4
86
82
81
81
74
74
70
70
63
0 10 20 30 40 50 60 70 80 90 100
Digital Markets and Competition
Content Policy
Cybersecurity
Data Governance and Privacy
Trust
Global Internet Infrastructure
Access & Digital Inclusion
Artificial Intelligence
5G
Subject Area Rating - Ranked 5+