iips working start - international institute for population …iipsindia.org/pdf/iips- working paper...
TRANSCRIPT


IIPS Working Paper No. 1
Levels, Differentials and SpatialPatterns of Childlessness in India
Dr. Usha RamAssociate Professor
Department of Public Health & Mortality StudiesInternational Institute for Population Sciences
E-mail : [email protected]; [email protected]
April, 2010
INTERNATIONAL INSTITUTE FOR POPULATION SCIENCESDeonar, Mumbai 400 088, Maharashtra, IndiaTel: +91 22 42372400; Fax: +91 22 25563257
Email: [email protected]: www.iipsindia.org

Levels, Differentials and Spatial Patterns ofChildlessness in India
Usha Ram
Abstract
The paper examines the levels, patterns and differentials of childlessness, the factors affecting
childlessness and its consequences on women. The Indian Census datasets of 1981 and 2001 are
used to study the objectives. Only the ever married women aged 35-39 who have reported
themselves as childless at the time of census enumeration are chosen for the analysis. The paper
further measures the levels of permanent childlessness in various regions of India. Also by using
GIS package the spatial patterns of childlessness are explored. The finding suggests that the
levels of childlessness are moderate in India. The levels vary differently in different regions of the
country and within different sub-groups of women like religion, caste and educational status. Southern
states of the country have shown higher levels of permanent childlessness compared to that of
northern or other states. Women belong to the Schedule Tribe, Christian faith and non-literate
group have reported high levels of permanent childlessness. The number of districts with higher
level of permanent childlessness is growing over time (1981-2001) while those with lower levels
have declined drastically. The GIS analysis shows certain kind of geographical clustering in the
level of childlessness in some regions of the country.

Introduction
According to the World Health Organization (WHO, 1997) estimate, globally there are about60 to 80 million couples with unwanted infertility1 ,2 . The level and patterns of infertility havebeen found to vary widely across population (Belsey, 1978; WHO, 1975; Belsey, 1976;Sherris and Fox, 1983); the incidence levels in some of the African countries being as highas 20 to 30 percent (Erickson and Brunette, 1996). The World Health Organization (WHO,1991) pointed out that infertility is widespread in some of the regions and its prevalencereaching such proportions that it can well be considered as a public health problem affectinglife of the whole society. In its extreme, infertility compounded with pregnancy wastage,infant and child mortality, may lead to depopulation, which poses serious threat to thesocial and economic development of a region.
Various factors affect infertility including genetic, psychopathology, disease, nutritionaldeficiencies and environment (Poston and Trent 1982; 1984)3 . Female circumcision(practiced in more than 30 countries of the world which affects around 2 million girls eachyear) has an impact on infertility levels through health hazards associated with this practice(Anonymous 2005; 2008). Sociologists in various cultural settings have observed thatinfertility is often linked to adultery, immoral behaviour, witchcraft (Greil 1991; Pearce 1999)or curse due to some activity that had angered ancestors, the deities or anyone in thecommunity (Pearce 1999). Scientists focusing on cultural issues often interpret fertilitydifferentials among women at different educational levels as a consequence of the greaterrange of possible lifestyles and other choices increasingly available to women with greatereducational attainment (Lesthaeghe, 1983; Van, 1987; 1996; Surkyn and Lesthaeghe, 2004;Lappegård, 2002). It is also argued that women lower their preferences for children as theyproceed with their education (Rindfuss et. al, 1996) and thus a higher rate of childlessness
Levels, Differentials and Spatial Patterns ofChildlessness in India
Usha Ram
1
1 There is difference between infertility, sub-fecundity and childlessness, however, in this paper they are beingused interchangeably.
2 About 8-12% of them have been estimated to be infertile or faced with inability to conceive a child at somepoint during their reproductive lives with the incidence being similar in most countries independent of the level ofcountry’s development (Reproductive Health Outlook 1999).
3 A detailed discussion on the factors associated with sub-fecundity may be seen in McFalls 1979a and 1979b;Guest 1978 and International Fertility Research Program, 1980.

2
IIPS Working Paper No. 1
among more educated women, which in part can be attributed to their longer stay ineducation. Empirical studies (Rindfuss and Bumpass, 1976; Rindfuss et. al, 1980; Kravdal,2001; Gustafsson, 2001) have found that prolonged education may therefore lead to apostponement of childbearing to a later age, when biological factors may make it moredifficult to conceive. Also the desire for having children is likely to decline when womenhave greater range of options (Jan et.al, 2006).
Etiology of infertility varies from region to region, from one population to another and evenfrom one locality to another within same population. To a major part, involuntary infertility islargely related to conditions that are preventable in nature, such as sexually transmitteddiseases4 (WHO, 1991; Rowe, 1999), infections and parasitic diseases, iatrogenichealthcare practices, exposure to toxic substances either through the diet or through theenvironment (Rowe, 1999) and complications suffered during post partum or post abortionperiod, particularly in illegal induced abortions (WHO, 1991). Further, levels of infertilityalso depend on the prevalence of ‘core’ infertility (biological variation in chromosomal,congenital, and endochronological abnormalities) and ‘acquired’ infertility (geographicvariation in infectious, environmental and occupational factors)5 .
A number of studies have shown varying levels of childlessness among different socioeconomicsub-groups of women. Researchers have argued that the changes in socioeconomic structuresand institutions tend to influence reproductive motivation and fertility by specifying the rewardstructures related with childbearing (Blake, 1973; Hernandez, 1984; Birdsall and Jamison,1983; Poston and Gu ,1987; Sun, 1984; Poston,1988). Rutstein, and Shah (2004) usingDemographic Health Survey datasets of a number of countries found varied levels ofchildlessness. Bloom (1986)6 observed that the changes in the average age at first birth andthe trends toward permanent childlessness differs between black and white women in delayedchildbearing patterns; and also the relationship among educational attainment, wage levelsand timing of childbearing. Vemuri and Manohar (1986) using 1981 census dataset foundthat in India, woman’s education influenced levels of childlessness. Poston and Kramer (1986)observed differential patterns in levels of voluntary and involuntary childlessness amongCatholic and non-Catholic women between the ages 30-35 and 40-44 in the United States.
Females in India marry early (Jain, 1975) and the newly married girls are often blessed bythe elders to beget large number of children. Childless women and women who could notproduce atleast one male child are subjected to prejudice and ill will and social stigma
4 According Population Reports (1983), pelvic inflammatory diseases account for more than half of all femaleinfertility in many regions.
5 Worldwide anatomical, genetic or immunological factors cause about 5% of infertile couples (WHO 1991).
6 He analyzed June 1985 Current Population Survey data for women born between 1935 and 1960 to understandfirst birth fertility patterns and compared baby-boom generation and those born 20 years earlier, in the 1930s.

3
Levels, Differentials and Spatial Patterns of Childlessness in India
(Gandotra and Pandey, 1979). Meade (1979) noted that along with lack of industrialization,cultural factors such as universal and early marriage and childlessness as a social disgraceare the important factors affecting population explosion in India. Despite this, the problemof childlessness in India has been largely overlooked in favor of research and promotion offamily planning (IPPF, 1984). It is surprising to note that the issues related to thechildlessness do not find any place in either recently declared National Population Policy,2000 document or National Health Policy, 2002 of the Government of India (Ministry ofHealth and Family Welfare, 2000; 2002). As a matter of fact infertility research has beenneglected both as a health problem and as a subject for social science research. Thrust ofboth programme and research in the past have been on correlates of high fertility (particularlyunwanted fertility) and its regulation, rather than the context of infertility, its causes andconsequences (Jejeebhoy, 1998; Menken, 1985; Veevers, 1971). The fertility levels of anypopulation are very much influenced by the levels of childlessness (both voluntary andinvoluntary) in the population and it plays an important role in determining the levels anddifferentials of fertility (Roberts, 1972). The evidence in the past has suggested that thedecline in impaired fertility leads to an increase in the Total Fertility Rate (Larsen, 1996).
In the recent years, infertility has received considerable international attention (Bonnar et al.1984; Belsey 1978; Leridon 1979) but its worldwide extent has never been systematicallydescribed. The correct assessment of the future needs of various services such as, housing,education, healthcare, demand for various consumer goods etc. would be as much influencedby the levels of childlessness (both in terms of capacity and desire to reproduce), as thefertility levels. Further, very little is known about the characteristics of women who remainchildless. Recent analysis by Ram (2008) clearly shows that in India permanent childlessnessin urban areas has increased more rapidly compared to the rural areas. According to 1981census results, nearly 4 percent of ever married women aged 35-39 in India were childless inrural and urban areas of the country. The proportion of such women increased to 6 percent in2001 in rural areas while in urban areas it increased to over 7 percent. This raises questionin our mind – whether such rapid increase in urban areas is any indication of changes intypes of childlessness, voluntary versus involuntary, as urbanization and development maylead to rise in latter.
Aims, Data Source and Methodology
Thus in the present paper an attempt is made to examine the levels and differentials ofpermanent childlessness for India and selected states by some selected socioeconomiccharacteristics, such as, religion, caste, education, work status, place of residence amongthe ever married women aged 35-39 years. The analysis has been done using data fromcensus of India. Indian census provides information on children ever born to the ever marriedwomen by many background characteristics. This provides us an opportunity to understanddifferentials in levels of chilldlessness across various sub-groups of population. A detailed
4
IIPS Working Paper No. 1
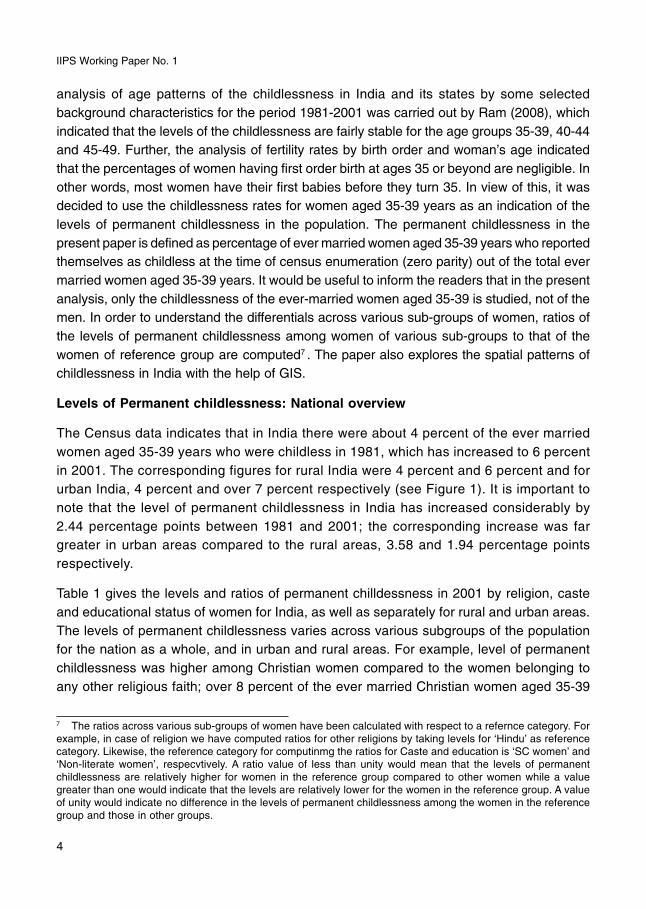
analysis of age patterns of the childlessness in India and its states by some selectedbackground characteristics for the period 1981-2001 was carried out by Ram (2008), whichindicated that the levels of the childlessness are fairly stable for the age groups 35-39, 40-44and 45-49. Further, the analysis of fertility rates by birth order and woman’s age indicatedthat the percentages of women having first order birth at ages 35 or beyond are negligible. Inother words, most women have their first babies before they turn 35. In view of this, it wasdecided to use the childlessness rates for women aged 35-39 years as an indication of thelevels of permanent childlessness in the population. The permanent childlessness in thepresent paper is defined as percentage of ever married women aged 35-39 years who reportedthemselves as childless at the time of census enumeration (zero parity) out of the total evermarried women aged 35-39 years. It would be useful to inform the readers that in the presentanalysis, only the childlessness of the ever-married women aged 35-39 is studied, not of themen. In order to understand the differentials across various sub-groups of women, ratios ofthe levels of permanent childlessness among women of various sub-groups to that of thewomen of reference group are computed7 . The paper also explores the spatial patterns ofchildlessness in India with the help of GIS.
Levels of Permanent childlessness: National overview
The Census data indicates that in India there were about 4 percent of the ever marriedwomen aged 35-39 years who were childless in 1981, which has increased to 6 percentin 2001. The corresponding figures for rural India were 4 percent and 6 percent and forurban India, 4 percent and over 7 percent respectively (see Figure 1). It is important tonote that the level of permanent childlessness in India has increased considerably by2.44 percentage points between 1981 and 2001; the corresponding increase was fargreater in urban areas compared to the rural areas, 3.58 and 1.94 percentage pointsrespectively.
Table 1 gives the levels and ratios of permanent chilldessness in 2001 by religion, casteand educational status of women for India, as well as separately for rural and urban areas.The levels of permanent childlessness varies across various subgroups of the populationfor the nation as a whole, and in urban and rural areas. For example, level of permanentchildlessness was higher among Christian women compared to the women belonging toany other religious faith; over 8 percent of the ever married Christian women aged 35-39
7 The ratios across various sub-groups of women have been calculated with respect to a refernce category. Forexample, in case of religion we have computed ratios for other religions by taking levels for ‘Hindu’ as referencecategory. Likewise, the reference category for computinmg the ratios for Caste and education is ‘SC women’ and‘Non-literate women’, respecvtively. A ratio value of less than unity would mean that the levels of permanentchildlessness are relatively higher for women in the reference group compared to other women while a valuegreater than one would indicate that the levels are relatively lower for the women in the reference group. A valueof unity would indicate no difference in the levels of permanent childlessness among the women in the referencegroup and those in other groups.

5
Levels, Differentials and Spatial Patterns of Childlessness in India
Table 1: Levels of permanent childlessness and ratios by selected backgroundcharacteristics of the women, India 2001
Sub-groups / Categories All India Urban Rural
of woman Percent Ratio Percent Ratio Percent Ratio
ReligionHindu 6.23 1.00 7.41 1.00 5.76 1.00Muslim 6.53 1.05 7.85 1.06 5.75 1.00Christian 8.13 1.30 9.31 1.26 7.47 1.30Others 5.73 0.92 6.08 0.82 5.54 0.96
CasteSchedule Caste (SC) 5.75 1.00 6.65 1.00 5.50 1.00Scheduled Tribe (ST) 6.73 1.17 7.03 1.06 6.70 1.22Non-SC/ST 6.37 1.11 7.59 1.14 5.73 1.04
Educational statusNon-literate 6.02 1.00 7.27 1.00 5.75 1.001-7 years of schooling 5.62 0.93 6.58 0.91 5.16 0.908-9 years of schooling 6.08 1.01 6.83 0.94 5.45 0.9510-14 years of schooling 7.30 1.21 7.64 1.05 6.76 1.1815 or more years of schooling 5.62 0.93 6.58 0.91 5.16 0.90
Total 6.30 7.47 5.79
Source: Census of India, 2001.
Figure 1: Permanent childlessness in India, 1981 and 2001
years were childless in 2001, compared to slightly over 6 percent of Hindu and Muslimwomen while it was less than 6 percent among women from other religious faiths. TheSchedled Tribe (ST) women reported relatively higher level of permanent childlessness(about 7%) compared to Scheduled Caste (SC) and Non-scheduled Caste/Tribe (Non-SC/ST) women (about 6%).

6
IIPS Working Paper No. 1
In terms of ratios, for every 100 childless Hindu women there were 130 Christian childlesswomen, while their number was about 105 among Muslim women. In conrast, there wereonly 92 childless women among those belonging to Other religious faiths for every 100childless Hindu women. Somewhat similar pattern was observed in the rural and urbanareas of the country. However, the gap between Christian and Hindu women, was slightlywider in rural areas than they were in urban areas; for every 100 childless Hindu women inthere were 130 childless Christian women in rural areas whereas their number in urbanareas was 126. In case of Muslim women, there were 106 childless Muslim women inurban areas for every 100 childless Hindu women, whereas it was similar for both Hinduand Muslim women in rural areas. Among women from Other religious faiths, the gap waswider in urban areas compared to rural areas - for every 100 childless Hindu women therewere only 82 childless women from Other religious faith in urban areas and 96 in ruralareas. There were about 111 childless ST women and 117 Non-SC/ST women for every100 childless SC women. In case of the eductaional status of childless women, the patternsare rather unclear at the national level. However, some observations are made for urbanand rural areas. With the excpetion of women who have completed 10-14 years of schooling,educated women were less likely to report childlessness compared to the non-literatewomen. For example, there were only 91-94 childless women for every 100 childless womenamong non-literate women in the urban areas. Similarly, there were about 90-95 childlesswomen in various educational categories for every 100 childless non-literate women in therual areas of the country. Interstingly, for every 100 childless non-literate women in ruraland urban areas, there were only 90-91 childless women respectively, among those whohad completed 15 or more years of schooling.
Levels of Permanent childlessness: State overview
Before understanding the differentials in permanent childlessness by various characteristicsof the woman, it would be useful to understand its variability in different states of India;hence the level of the permanent childlessness for 14 major states of India is presented inFigure 2. These states together comprise over 96 percent of India’s population. The figureclearly reveals that in 2001 the level of permanent childless vary considerably in India fromone state to another; from a low of just about 2 percent in Haryana to nearly 9 percent inAndhra Pradesh and 11 percent in Tamil Nadu. Out of the 14 major states included, threehave higher levels of permanent childlessness than the national average, of these, two aresouthern states, Andhra Pradesh and Tamil Nadu. Incidentally both the states have achievedbelow replacement fertility levels. The third state is Uttar Pradesh with level of permanentchildlessness at about 7 percent. In contrast, Rajasthan and Madhya Pradesh have relativelylower levels (at about 4%), interestingly fertility levels in these states continue to be on thehigher side. States like Punjab, Maharashtra and Gujarat reported relatively moderate levelsof permanent childless (at about 5%) while it was close to 6 percent in states of WestBengal, Orissa, Bihar, Kerala and Karnataka.

7
Levels, Differentials and Spatial Patterns of Childlessness in India
In order to make the analysis more reader friendly, the differentials in levels of permanentchildlessness at state levels have been studied for five selected states only. For this, thestate having highest level of permanent childlessness within every region in 2001 wasselected for the further analysis. The five states selected were Bihar, Gujarat, Punjab,Tamil Nadu and Uttar Pradesh, one each from each of the five geographical region of thecountry as shown below. The differentials in childlessness have been examined by theplace of residence, religion, caste and educational status of the woman for 2001.
Region Name of the States by level of permanent childlessness (%) in 2001
North Haryana (2.52); Punjab (4.93); Rajasthan (3.57)
East West Bengal (5.82); Orissa (5.93); Bihar (5.95)
Central Madhya Pradesh (4.23); Uttar Pradesh (6.64)
West Maharashtra (5.26); Gujarat (5.32)
South Andhra Pradesh (8.72); Karnataka (6.73); Kerala (6.16); Tamil Nadu (10.92)
Levels and Differentials of Permanent Childlessness by Place of Residence
Table 2 provides levels of permanent childlessness in India and in the selected states byplace of residence of the woman and also the childlessness ratio of urban levels to that ofthe rural in 2001. The levels of permanent childlessness vary considerably across ruraland urban areas in all the states selected. About 4-5 percent rural women aged 35-39years in Gujarat and Punjab were childless while their share was nearly 6 percent each inBihar and Uttar Pradesh, and considerably high in Tamil Nadu (10%). In urban areas,
Figure 2: Permanent Childlessness in states of India, 2001

8
IIPS Working Paper No. 1
Table 2: Levels of permanent childlessness by place of residence ofthe woman in selected states of India, 2001
Name of the state Levels of permanent childless Ratio of urban to rural
All India Urban Rural
Bihar 5.95 6.40 5.89 1.09
Gujarat 5.32 6.28 4.68 1.34
Punjab 4.93 5.96 4.35 1.37
Tamil Nadu 10.92 12.11 9.98 1.21
Uttar Pradesh 6.64 8.57 6.06 1.41
India 6.30 7.47 5.79 1.21
Source: Census of India, 2001.
nearly 6 percent each of women in Bihar, Gujarat and Punjab were childless in 2001 whiletheir share in Uttar Pradesh and Tamil Nadu was as high as 9 percent and 12 percentrespectively.
In terms of rural-urban differentials, as measured by ratios, the proportions of childlesswomen was more in urban areas than the rural areas in all states as the ratio in all casesexceed unity. Further, the extent of rural-urban gap varies considerably across selectedstates. For example, in Uttar Pradesh there were 141 childless women in urban areas forevery 100 childless women in the rural areas. The corresponding numbers for Gujarat,Punjab and Tamil Nadu were 134, 137 and 121 respectively. The urban-rural gap in thisrespect was narrow in Bihar; there were about 109 childless women in urban areas forevery 100 such women in the rural areas.
Levels and Differentials of Permanent Childlessness by Religion
Table 3 gives levels of permanent childlessness for Hindu, Muslim, Christian and womenbelonging to other religions in 2001 for the selected states and their urban and rural areas.As seen for the country as a whole (urban and rural), the levels of permanent childlessnessvary considerably for women from various religious faiths in all the selected states.
Further, there are variations across states for women belonging to same religious faiths.For example, the permanent childlessness in Bihar and Gujarat varies from 5.87 percentand 5.15 percent, respectively, for Hindu women to 8.08 percent and 7.47 percent,respectively for those belonging to other religious faiths. In Punjab, it varies from a low of4.74 percent for women of other religions to 5.29 percent for Christian women. Thecorresponding range for Uttar Pradesh is 4.75 percent for Muslim women to 10.75 percentfor Christian women and for Tamil Nadu is 10.67 percent among Muslim women to 19.66percent for those from other religions. Similar patterns may be observed for urban andrural areas of the states.

9
Levels, Differentials and Spatial Patterns of Childlessness in India
With a few exceptions, Hindu women reported lower levels of permanent childlessness inmost of the states slected for analysis as compared to the women from any other religions.For example, Muslim women in Uttar Pradesh reported lower levels compared to the Hinduwomen - there were only 73 childless Muslim women for every 100 childless Hindu women.In contrast, there were 108 childless Muslim women in Bihar and 130 in Gujarat for every100 childless Hindu women. With the exception of Tamil Nadu, Christian women on thewhole have reported higher level childlessness in all the selected states. For example,there were 165 childless Christian women in Uttar Pradesh and 136 in Bihar for every 100childless Hindu women. Women from Other religious faiths too have reported higherpermanent childlessness levels in all states exccept Punjab. For example, there were 180childless women from Other religious faiths in Tamil Nadu and 138 to 145 in Bihar andGujarat and 110 to 120 in Uttar Pradesh for every 100 childless Hindu women. Whereas, inPunjab there were only 90 childless women from Other religious faiths for every 100 childless
Table 3: Levels of permanent childlessness by religion inselected states of India, 2001
State Religion of the woman Ratio to Hindu
Hindu Muslim Christian Other Hindu Muslim Christian Otherreligion religion
All India
Bihar 5.87 6.32 8.01 8.08 1.00 1.08 1.36 1.38Gujarat 5.15 6.68 6.08 7.47 1.00 1.30 1.18 1.45Punjab 5.24 4.92 5.29 4.74 1.00 0.94 1.01 0.90Tamil Nadu 10.92 10.67 10.84 19.66 1.00 0.98 0.99 1.80Uttar Pradesh 6.52 4.75 10.75 7.82 1.00 0.73 1.65 1.20India* 6.23 6.53 8.13 5.73 1.00 1.05 1.30 0.92
Urban
Bihar 6.07 7.83 8.11 8.21 1.00 1.29 1.34 1.35Gujarat 6.05 7.45 7.49 7.52 1.00 1.23 1.24 1.24Punjab 6.09 6.15 7.36 5.74 1.00 1.01 1.21 0.94Tamil Nadu 12.23 10.91 11.82 19.51 1.00 0. 89 0.97 1.60Uttar Pradesh 8.56 8.49 12.11 9.19 1.00 0.99 1.41 1.07India* 7.41 7.85 9.31 6.08 1.00 1.06 1.26 0.82
Rural
Bihar 5.85 6.22 7.93 8.03 1.00 1.06 1.36 1.37Gujarat 4.61 5.52 4.96 7.15 1.00 1.20 1.08 1.55Punjab 4.10 4.03 4.36 4.44 1.00 0.98 1.06 1.08Tamil Nadu 9.99 10.06 9.52 20.04 1.00 1.01 0.95 2.01Uttar Pradesh 6.01 6.29 8.35 6.85 1.00 1.05 1.39 1.14India* 5.76 5.75 7.47 5.54 1.00 1.00 1.30 0.96
Source: Census of India, 2001.Note: * Figures for India have been included only for reference purpose.

10
IIPS Working Paper No. 1
Hindu women. Inter-state comparision shows that the differences were wider in Tamil Naduand Uttar Pradesh and were somewhat moderate in Bihar and Gujrat , while they weremarginal in Punjab.
The patterns seem to be almost similar for rural and urban areas. However, in Bihar andGujarat, Hindu-Muslim differntials in levels of permanent childlessness were wider in ruralareas than in urban areas. In contrast, the levels of childlessness were lower for Muslimwomen in Tamil Nadu and Uttar Pradesh in rural areas compared to their urban counterparts.
Levels and Differentials of Permanent Childlessness by Caste
The level of permanent childlessness and the ratios by caste of the woman in 2001 arepresented in table 4 for all the selected states by place of residence. The data indicatesconsiderable variations in the permanent childlessness levels across various caste groupsin the selected states; the levels were relatively higher in Tamil Nadu for all the three ethnic
Table 4: Levels of permanent childlessness bywoman’s caste for selected states, India, 2001
State Caste of the woman Ratio to SC
SC ST Non-SC/ST SC ST Non-SC/ST
All India (Rural & Urban)Bihar 5.73 7.87 5.97 1.00 1.37 1.04Gujarat 4.73 5.54 5.34 1.00 1.17 1.13Punjab 4.02 NA 5.27 1.00 NA 1.31Tamil Nadu 10.29 14.13 11.03 1.00 1.37 1.07Uttar Pradesh 5.79 7.72 6.86 1.00 1.33 1.18India 5.75 6.73 6.37 1.00 1.17 1.11
Urban
Bihar 5.55 7.25 6.49 1.00 1.31 1.17Gujarat 5.54 6.74 6.33 1.00 1.22 1.14Punjab 5.24 NA 6.14 1.00 NA 1.17Tamil Nadu 11.49 10.26 12.22 1.00 0.89 1.06Uttar Pradesh 7.62 9.95 8.70 1.00 1.31 1.14India 6.65 7.03 7.59 1.00 1.06 1.14
Rural
Bihar 5.74 7.90 5.90 1.00 1.38 1.03Gujarat 4.13 5.41 4.50 1.00 1.31 1.09Punjab 3.58 NA 4.70 1.00 NA 1.31Tamil Nadu 9.77 14.83 9.95 1.00 1.52 1.02Uttar Pradesh 5.50 7.39 6.22 1.00 1.34 1.13India 5.50 6.70 5.73 1.00 1.22 1.04
Source: Census of India, 2001.Note: * Figures for India have been included only for reference purpose.

11
Levels, Differentials and Spatial Patterns of Childlessness in India
sub-groups compared to other selected states. For example, there were about 4-6 percentof women from Scheduled Caste (SC) in Bihar, Gujarat, Punjab and Uttar Pradesh, whereasit was over 10 percent in Tamil Nadu. Among Schedule Tribe (ST) women, it varied from ahigh of over 14 percent in Tamil Nadu to about 5-8 percent in the remaining states; whilefor Non-SC/ST women, it ranged between 11 percent in Tamil Nadu and around 5-7 percentin the remaining states.
In terms of childlessnes ratios, an intersting finding emerged from the analysis. The levelsof permanent childlessness were higher for ST and Non-SC/ST women compared to theSC women in all the selected states. Further, the extent of differentials varied from onegroup to another within the same state and also across states for same group of women.For example, the gap between ST and SC women was greater than that between Non-SC/ST women and SC women in all states; there were about 117 to 137 childless ST womenfor ever 100 childless schedule caste women. In case of Non-SC/ST women, this rangedbetween 104 to 131.
The value of this ratio was greater than unity in all states under analysis with only oneexception of urban Tamil Nadu, where this ratio for ST women was below unity (0.89).
Another intersting finding emerged is that the difference in levels of permanent childlessnessbetween SC and ST women were greater in the rural areas compared to urban areas in allstates. In case of women belong to Non-SC/ST and SC it was found that the gap was widerin urban areas of Punjab and it was narrower in rural areas of Bihar and Gujarat. In UttarPradesh the gap was quite similar in both rural and urban areas.
Levels and Differentials of Permanent Childlessness by education
Table 5 provides levels and ratios of permanent childlessness for 2001 by educationalstatus of the woman for selected states of India by place of residence. The findingssuggest that the levels of childlessness vary by educational status of the woman for allstates; the levels actually rise with advancement in the educational status of the woman.For example, about 4-6 percent of non-literate women in Bihar, Gujarat, Punjab andUttar Pradesh and about 11 percent of them in Tamil Nadu were childless. Whereas,among those who had completed graduate or higher education, their proportion wasover 6 percent in Punjab, 8-9 percent in Bihar and Gujarat, 11 percent in Uttar Pradeshand nearly 16 percent in Tamil Nadu. Similar observations were made for rural andurban areas as well.
With respect to ratios, with only four exceptions, the value of the ratio always exceededunity (also true separately rural and urban areas) indicating that the levels of permanentchildlessness go up with improvement in educational status of the woman. For example,there were about 150 to 181 childless women among those who had completed 15 years

12
IIPS Working Paper No. 1
Table 5: Levels of permanent childlessness bywoman’s education status for selected states, India, 2001
State Educational status of the woman Ratio to Non-literate
Non- 1-7 8-9 10-14 15 or Non- 1-7 8-9 10-14 15 orliterate yrs. yrs. yrs. more literate yrs. yrs. yrs. more
All India (Rural & Urban)
Bihar 5.68 5.76 6.24 7.04 8.62 1.00 1.01 1.10 1.24 1.52Gujarat 4.90 5.02 5.59 6.04 8.15 1.00 1.02 1.14 1.23 1.66Punjab 4.34 4.29 5.23 5.70 6.48 1.00 0.99 1.21 1.31 1.49Tamil Nadu 10.54 10.03 10.33 11.99 15.82 1.00 0.95 0.98 1.14 1.50Uttar Pradesh 5.97 6.52 7.14 9.04 10.82 1.00 1.09 1.20 1.51 1.81India 6.02 5.62 6.08 7.30 9.00 1.00 0.93 1.01 1.21 1.50
Urban
Bihar 6.20 5.77 5.78 6.37 7.93 1.00 0.93 0.93 1.03 1.28Gujarat 6.07 5.64 6.05 6.38 8.15 1.00 0.93 1.00 1.05 1.34Punjab 5.73 5.42 6.14 5.88 6.26 1.00 0.95 1.07 1.03 1.09Tamil Nadu 12.24 10.82 11.25 12.53 16.20 1.00 0.88 0.92 1.02 1.32Uttar Pradesh 7.75 7.72 8.07 9.13 10.55 1.00 1.00 1.04 1.18 1.36India 7.27 6.58 6.83 7.64 8.94 1.00 0.91 0.94 1.05 1.23
Rural
Bihar 5.65 5.75 6.38 7.41 9.56 1.00 1.02 1.13 1.31 1.69Gujarat 4.53 4.51 4.92 5.27 8.16 1.00 1.00 1.09 1.16 1.80Punjab 3.91 3.88 4.62 5.46 7.76 1.00 0.99 1.18 1.40 1.98Tamil Nadu 9.89 9.35 9.01 10.60 13.51 1.00 0.95 0.91 1.07 1.37Uttar Pradesh 5.65 6.08 6.61 8.90 12.17 1.00 1.08 1.17 1.58 2.15India 5.75 5.16 5.45 6.76 9.30 1.00 0.90 0.95 1.18 1.62
Source: Census of India, 2001.Note: * Figures for India have been included only for reference purpose.
of schooling or more for every 100 childless women among non-literate in all states includedin the analysis. However, the differences are more prominent in states of Uttar Pradeshand Gujarat. And also the gap between highly educated and non-literate women widensconsiderably in rural areas as compared to the urban areas (see last panel of table 5).
Levels of Permanent Childlessness: District Scenario
This section tried to understand the distribution of districts in India by levels of childlessnessin 1981 and 2001. This has been done by classifying the districts in the following threebroad categories on the basis of levels of childless8 among women:
8 The classification of districts in the three categories of low, medium and high is to some extent arbitrary. However,as mentioned in the literaure, 2-3% of infertility is considered as inebitable in any population. The WHO recommendsthat 7-8% childlessness levels in a population should be considered as a major public health concern and theprogram should give greater attention to this issue. Accordingly we decided to group districts in this manner.

13
Levels, Differentials and Spatial Patterns of Childlessness in India
Figure 3: Distribution of districts by levels of permanent childlessness inIndia, 1981 and 2001
Category Percentage of childless women
Group I: Low Prevalence Districts (LPD) Up to 2.50 %
Group II: Medium Prevalence Districts (MPD) 2.51 to 7.50 %
Group III: High Prevalence Districts (HPD) Greater than 7.50 %
Majority of districts in India fall in medium prevalence district group (MPD), about 66 percentand 75 percent districts in 1981 and 2001, respectively, had 2.51 to 7.5 percent of childlesswomen aged 35-39 years. Nearly 29 percent of districts in 1981 were low prevalence districts(LPD), which declined to 3 percent in 2001. About 5 percent districts in 1981 were highprevalence districts (HPD) which increased to 22 percent in 2001; indicating a dramatic shiftin the position of many districts from low ore medium prevalence to high prevalence.
Similar pattern may be seen in the rural and urban areas as well, however, proportion ofdistricts in HPD group was quite similar in 1981 (at about 5-6%) which has increasedconsiderably in both the areas but much more rapid in urban areas than the rural areas in2001 (27% compared to 20%). In contrast, proportion of districts in LPD group was 26 percentand 31 percent during 1981 and 2001 respectively in urban and rural areas which by 2001came down to just about 2 percent in urban areas and about 5 percent in rural areas.
Tables no.6.a, b and c depict the prevalence of childlessness in various states of India andalso at rural and urban areas. Of the 115 low prevalence districts in 1981, 27 were fromundivided Uttar Pradesh followed by Karnataka (19), Maharashtra (11), West Bengal (10)and Arunachal Pradesh (9) - thus comprising of about two-thirds of the total districts in thiscategory. Of the 18 low prevalence districts in 2001, 11 were from Haryana, 6 from Rajasthan,

14
IIPS Working Paper No. 1
Table 6.a: Distribution of Districts by the levels ofpermanent childlessness in India, 1981 & 2001
State/UTs 1981 2001
Low Medium High Total Low Medium High Total
Andhra Pradesh 0 16 7 23 0 7 16 23
Bihar 5 26 0 31 0 33 4 37
Jharkhand 0 13 3 16
Gujarat 0 19 0 19 0 25 0 25
Haryana 4 8 0 12 11 8 0 19
Jammu & Kashmir 0 13 1 14 0 6 8 14
Karnataka 19 0 0 19 0 24 3 27
Kerala 6 6 0 12 0 14 0 14
Madhya Pradesh 2 39 4 45 0 45 0 45
Chhatisgarh 0 20 0 20
Maharashtra 11 15 0 26 0 34 1 35
Orissa 0 10 3 13 0 22 8 30
Punjab 1 11 0 12 0 17 0 17
Rajasthan 0 26 0 26 6 26 0 32
Tamil Nadu 0 16 0 16 0 0 30 30
Uttar Pradesh 27 28 1 56 0 55 15 70
Uttarnchal 0 6 0 6
West Bengal 10 6 0 16 0 15 3 18
Andaman&N Island 1 1 0 2 0 1 1 2
Arunachal Pradesh 9 0 0 9 0 11 2 13
Himachal Pradesh 7 5 0 12 1 11 0 12
Manipur 1 3 2 6 0 1 8 9
Meghalaya 5 0 0 5 0 0 7 7
Mizoram 3 0 0 3 0 8 0 8
Nagaland 3 4 0 7 0 1 7 8
Pondicherry 1 3 0 4 0 4 0 4
Sikkim 0 4 0 4 0 4 0 4
Goa 0 1 0 1 0 0 2 2
Daman Diu 0 2 0 2 0 2 0 2
Assam NA NA NA 0 0 13 10 23
Tripura NA NA NA 0 0 15 0 15
Delhi NA NA NA 0 0 3 0 3
Chandigarh NA NA NA 0 0 1 0 1
DN Haveli NA NA NA 0 0 1 0 1
Lakshadweep NA NA NA 0 0 1 0 1
All INDIA (N) 115 262 18 395 18 446 128 592
% 29.11 66.33 4.56 100 3.04 75.34 21.62 100
Source: Census of India, 1981 and 2001 (Same for the following two tables)

15
Levels, Differentials and Spatial Patterns of Childlessness in India
Table 6.b: Distribution of Districts by the levels ofpermanent childlessness in Rural India, 1981 & 2001.
State/UTs 1981 2001
Low Medium High Total Low Medium High Total
Andhra Pradesh 0 15 7 22 0 11 11 22
Bihar 6 25 0 31 0 34 3 37
Jharkhand 0 12 6 18
Gujarat 0 19 0 19 0 25 0 25
Haryana 3 9 0 12 16 3 0 19
Jammu & Kashmir 0 13 1 14 0 6 8 14
Karnataka 19 0 0 19 - 25 2 27
Kerala 6 6 0 12 0 14 0 14
Madhya Pradesh 3 38 4 45 0 45 0 45
Chhatisgarh 0 14 2 16
Maharashtra 11 14 0 25 0 33 0 33
Orissa 0 9 4 13 0 22 8 30
Punjab 1 11 0 12 0 17 0 17
Rajasthan 0 26 0 26 8 24 0 32
Tamil Nadu 0 15 0 15 0 1 28 29
Uttar Pradesh 29 25 2 56 0 60 10 70
Uttarnchal 0 13 0 13
West Bengal 11 4 0 15 0 15 2 17
Andaman&N Island 1 1 0 2 0 1 1 2
Arunachal Pradesh 9 0 0 9 0 11 2 13
Himachal Pradesh 7 5 0 12 1 11 0 12
Manipur 1 3 2 6 0 1 8 9
Meghalaya 5 0 0 5 0 0 7 7
Mizoram 3 0 0 3 0 8 0 8
Nagaland 3 4 0 7 0 1 7 8
Pondicherry 1 2 0 3 0 2 0 2
Sikkim 0 4 0 4 0 4 0 4
Goa 0 1 0 1 0 0 2 2
Daman Diu 0 2 0 2 1 1 0 2
Assam NA NA NA 0 0 15 8 23
Tripura NA NA NA 0 0 4 0 4
Delhi NA NA NA 0 2 5 0 7
Chandigarh NA NA NA 0 0 1 0 1
DN Haveli NA NA NA 0 0 1 0 1
Lakshadweep NA NA NA 0 0 1 0 1
All INDIA (N) 119 251 20 390 28 441 115 584
% 30.51 64.36 5.13 100 4.79 75.51 19.69 100.00

16
IIPS Working Paper No. 1
Table 6.c : Distribution of Districts by the levels ofpermanent childlessness in Urban India, 1981 & 2001
State/UTs 1981 2001
Low Medium High Total Low Medium High Total
Andhra Pradesh 0 13 10 23 0 5 18 23
Bihar 0 31 0 31 0 31 6 37
Jharkhand 0 16 2 18
Gujarat 0 18 0 18 0 22 2 24
Haryana 3 9 0 12 5 14 0 19
Jammu & Kashmir 2 11 1 14 0 7 7 14
Karnataka 19 0 0 19 0 19 8 27
Kerala 1 10 0 11 0 11 3 14
Madhya Pradesh 4 35 6 45 0 45 0 45
Chhatisgarh 0 16 0 16
Maharashtra 13 13 0 26 0 34 1 35
Orissa 0 11 2 13 0 27 3 30
Punjab 1 11 0 12 0 15 2 17
Rajasthan 1 25 0 26 1 31 0 32
Tamil Nadu 0 16 0 16 0 0 30 30
Uttar Pradesh 20 35 1 56 0 37 33 70
Uttarnchal 0 13 0 13
W. Bengal 9 7 0 16 0 12 6 18
A&N Island 1 0 0 1 0 1 0 1
Arunachal Pradesh 5 0 0 5 1 8 3 12
Himachal Pradesh 7 3 0 10 1 9 0 10
Manipur 1 3 2 6 0 0 5 5
Meghalaya 5 0 0 5 0 3 4 7
Mizoram 3 0 0 3 0 7 0 7
Nagaland 5 1 0 6 0 2 6 8
Pondicherry 1 3 0 4 0 4 0 4
Sikkim 1 2 1 4 1 2 1 4
Goa 0 1 0 1 0 0 2 2
Daman Diu 0 2 0 2 0 2 0 2
Assam NA NA NA 0 0 7 16 23
Tripura NA NA NA 0 0 3 1 4
Delhi NA NA NA 0 0 9 0 9
Chandigarh NA NA NA 0 0 1 0 1
DN Haveli NA NA NA 0 0 1 0 1
Lakshadweep NA NA NA 0 0 1 0 1
All INDIA N 102 260 23 385 9 415 159 583
% 26.49 67.53 5.97 100 1.54 71.18 27.27 100.00

17
Levels, Differentials and Spatial Patterns of Childlessness in India
2 from Manipur and one from Himachal Pradesh. All districts from Karnataka, ArunachalPradesh, Meghalaya and Mizoram belonged to LPD group in 1981. Of the 262 mediumprevalence districts in 1981, 39 were from undivided Madhya Pradesh, 28 from undividedUttar Pradesh and 26 each from Rajasthan and undivided Bihar. All the districts from Gujarat,Rajasthan and Tamil Nadu belonged to MPD in 1981. Of the 18 HPD districts in 1981, 7were from Andhra Pradesh, 4 from undivided Madhya Pradesh, 3 from Orissa, 2 fromManipur and one from undivided Uttar Pradesh. The analysis reveals that more districts inthe state have come in this group in 2001 and also many districts from other parts of thecountry have entered in the HPD group.
Spatial Patterns of Permanent Childlessness
The main purpose of the analysis here is to highlight geographical variations in the levelsof childlessness at the district level and also to understand whether there is any spatialpattern with respect to the prevalence of childlessness between 1981 and 2001, and if it isthen whether it has any pattern in terms of topography of the area. It is thus intended tounderstand if levels of childlessness are higher around the coastal line or in the planeareas or if they are more in southern region or other region - north, west or east. This wouldhelp us understand whether women living in a particular geographical condition experiencesvaried chances of childlessness. For the analysis GIS software is used. Based on thelevels of childlessness, the districts of India are grouped in to six categories as below:
Category Level of childlessness (% of childless women) I 0.00 per cent (also includes districts for which data is not available) II 0.01 – 2.50 percent III 2.51 – 5.00 percent IV 5.01 – 7.50 percent V 7.51 – 10.00 percent VI More than 10.00 percent
In Figure 4 we have provided maps of India depicting district scenario of the prevalence ofpermanent childlessness for 1981 and 2001 separately for rural and urban residence. Thisis useful s as analyzing simple distribution of the units (as done above) does not allow usto understand spatial patterns. Plotting the units helps understand the spatial pattern moreeffectively. It may be pointed out to readers that for 2001, the informational levels ofchildlessness for the districts of Delhi are shown separately at the bottom left of the map.
One can clearly see a spatial pattern as far as the levels of permanent childlessness inIndia is concerned. It may be seen that irrespective of time and place of residence, coastalareas of the country tend to have higher levels of childlessness as most of the districtsalong the coastal line fall group depicted with red or purple colors (more so on the easterncoast). Further, levels of childlessness seem to be high in southern states as well as northeastern states of the country as compared to other regions. In contrast, northern as well as

18
IIPS Working Paper No. 1
Figure 4: Spatial patterns of permanent childlessness, 1981 and 2001
All India
Rural India
Urban India
1981 2001

19
Levels, Differentials and Spatial Patterns of Childlessness in India
western districts reveal relatively lower levels of childlessness. Another important findingemerging from the comparison between 1981 and 2001 map is that over time, districtshave moved from lower levels to higher levels of childlessness. The upward shift seemsmore intense in southern region compared to other regions where number of districts whichfell in category-II (0.01 to 2.50%) in 1981 moved to category-III (5.01 to 7.50%) in 2001.Also many districts in southern region have moved from categories-III and IV in 1981 tocategory -VI in 2001. Also some of the districts in north-eastern regions have moved fromcategory-III to category-V over 1981-2001.
Discussions and Concluding Remarks
The study has clearly brought out various dimensions of childlessness at the national, stateand district level. As seen in the analysis, in comparison to other countries the level ofchildlessness in India seems to be moderate. The analysis reveals that over 6 percent ofwomen in India remained childless in 2001 and the level was even higher in the urban areasat over 7 percent. The analysis suggests that there prevail considerable differentials inchildlessness, both at the national and sub-national level of the country, as well as by ruraland urban status. The analysis of the data at the state level indicates that the southern statesseem to report higher levels of childlessness compared to northern states. For example, ofthe four southern states, two states (Andhra Pradesh and Tamil Nadu) have exhibitedconsiderably higher levels of permanent childlessness in 2001 (ranging between 9-11 percent).In contrast, some northern states, where fertility levels continue to be high (Rajasthan andMadhya Pradesh), have shown lower levels of permanent childlessness (4 percent or less).Further, urban areas have indicated higher levels of permanent childlessness not only at thenational level but also at the state levels.
In addition to the differences by state and place of residence, the data indicates prevalenceof wide differences in the levels of permanent childlessness among women by their religion,caste and educational attainment. On the whole, Christian and Muslim women and theScheduled Tribe women have exhibited relatively higher levels of permanent childlessnessas compared to their respective counterparts. For example, levels of permanent childlessnesswere usually higher for Christian women compared to that of Hindu women, both at thenational level as well as at the sub-national level. Likewise, the levels of permanentchildlessness were generally high among Schedule Tribe women and Non-SC/ST women,as compared to the Schedule Caste women. In case of educational status of the childlesswomen, the analysis suggests that non-literate women were far more disadvantages whencompared with the women who have had some level of education; specifically compared tothose who have had 15 or more years of schooling.
The district level analysis indicates that the proportion of the districts falling in the highchildlessness category has increased from less than 5 percent in 1981 to nearly 22 percent

20
IIPS Working Paper No. 1
in 2001. In other words, more than 7.5 percent of the ever married women aged 35-39years reported themselves as childless in 2001 in over one in every five districts in thecountry. Conversely, the proportion of districts with low levels of permanent childlessnesshave declined dramatically from nearly 29 percent in 1981 to just 3 percent in 2001.Interestingly, in 2001, the share of high childlessness prevalence districts was over one-quarter in urban areas compared to about 20 percent in the rural areas, while there wereonly about 5 percent of the districts in rural areas with low levels of permanent childlessnesscompared to less than 2 percent in the urban areas.
The mapping of childlessness rates at the district level reveals spatial patterns in the prevalenceof childlessness in the country suggesting that group of districts in a geographical proximitywhere the rates are higher. The districts in southern regions of the country and those locatedon the eastern coast of the country apparently have higher levels of childlessness whilenorthern districts and those located on the western coast have lower levels.
The analysis clearly brings out various dimensions of childlessness in India, at the nationaland sub-national level. This study highlights the need for greater attention from allstakeholders, policy makers, programmers and researchers to takes up the issues relatedwith childlessness into various programs and research activities.
References
Anonymous. 2005. Female Circumcision Could Cause Infertility- Study. Available at: http://www.redorbit.com/news/health/190921/female_circumcision_could_cause_infertilitystudy/
Anonymous. 2008. Female Genital Mutilation. Fact sheet No. 241, May 2008, Available at: http://www.who.int/mediacentre/factsheets/fs241/en/
Belsey, M.A. 1976. “The Epidemiology of Infertility: A Review with Particular Reference to Sub-Saharan Africa”Bulletin of the WHO, no. 54: 319-341.
Belsey, M. A. 1978. “Epidemiologic Aspects of Infertility.” Paper presented for: The Regional Multi-disciplinaryConsultative Meeting on Human Reproduction, Yaounde, Cameroon, 4-7 December, 1978: 1-36.
Birdsall, Nancy and Jamison, D.T. 1983. “Income and Other Factors Influencing Fertility in China,” Population andDevelopment Review, vol. 9: 651-675.
Blake, Judith. 1973. “Fertility Control and the Problem of Volunteerism in Scientists and World Affairs.” pp. 279-283.In Proceedings of the Twenty-second Pugwash Conference on Science and World Affairs, September, London.
Bloom, David E. 1986. “Fertility Timing, Labor Supply Disruptions, and the Wage Profiles of American Women.” InDiscussion Paper no. 86-8, Center for Population Studies, Harvard University, Massachusetts.
Bonnar, J., Thompson, W. and Harrison R. F. 1984. “Research in Family Planning: Studies in Fertility and Sterility.”In Themes from the 11th World Congress on Fertility and Sterility, Dublin, June 1983. The International Federationof Fertility Societies, MTP Press Ltd.
Erickson, K. and Brunette, T. 1996. “Pattern and Predictors of Infertility among African Women: A Cross-nationalSurvey of 27 Nations.” Social Science and Medicine, vol. 42: 209-220.

21
Levels, Differentials and Spatial Patterns of Childlessness in India
Gandotra, M. M and Pandey, D. N. 1979. “Values Attached to Children in Indian Society and Family size Norms: TheChanges and Impact.” Journal of Family Welfare, 26 (1): 9-14.
Greil, A.L. 1991. Not Yet Pregnant: Infertile Couples in Contemporary America. Rutger University Press, London.
Guest, I. 1978. “Infertility in Africa.” People, 5: 23-34.
Gustafsson, Siv. 2001. “Optimal Age at Motherhood: Theoretical and Empirical Considerations on Postponement ofMaternity in Europe.” Journal of Population Economics, 14: 225-247.
Hernandez, Donald J. 1984. Success or Failure?: Family Planning Programs in the Third World Connecticut.Greenwood Press, Westport.
International Fertility Research Program. 1980. “Sudanese to Study Prevalence and Effects of Female Circumcision.”Network, 4: 4-5.
IPPF (International Planned Parenthood Federation). 1984. “Psychological Aspects of Involuntary Infertility.” In reportof a regional seminar, Espoo, Finland. IPPF, Europe Region, London.
Jain, S. P. 1975. Age at Marriage and Fertility. In Jain S. P. (ed.), Demography. A Status Study on PopulationResearch in India, Volume 2, Tata McGraw-Hill, New Delhi, India, pp. 165-83.
Jan M., Gerda Neyer Hoem and Andersson Gunnar. 2006. “Education and Childlessness: The Relationship betweenEducational Field, Educational Level, and Childlessness among Swedish Women Born in 1955-59.” DemographicResearch. 14, (15): 331-380. Available at: http://www.demographic-research. org/Volumes/Vol14/15/
Jejeebhoy, S. 1998. “Infertility in India: Levels, Patterns and Consequences: Priorities for Social Science Research.”Journal of Family Welfare, 44, (2): 15-24.
Kravdal, Oystein. 2001. “The High Fertility of College Educated Women in Norway: An artifact of the SeparateModeling of Each Parity Transition.” Demographic Research. 5, (6).
Lappegård, Trude. 2002. “Education Attainment and Fertility Pattern among Norwegian Women.” In Statistics Norway,Documents no. 2000/18.
Larsen, U. 1996. “Childlessness, Sub-fertility and Infertility in Tanzania.” Studies in Family Planning. 27, (1): 18-28.
Leridon, H and Menken, J. 1979. “Natural Fertility: Patterns and Determinants of Natural Fertility.” pp. 556. InProceeding of Seminar on Natural Fertility. Liege, Belgium, IUSSP.
Lesthaeghe, Ron. 1983. “A Century of Demographic and Cultural Change in Western Europe: An Exploration ofWnderlying Dimensions.” Population and Development Review, 9, (3): 411-435.
McFalls, J. A. Jr. 1979a. “Frustrated Fertility: A Population Paradox.” Population Bulletin. 34.
McFalls, J. A. Jr. 1979b. Psychopathology and Sub-fecundity. New York Academic Press, New York.
Meade, R. D. 1979. “Persuasion and Population Control in India.” Indian Psychological Review, 18, (1-4):. 97-108.
Menken, J. 1985. “Age and Fertility: How Late Can You Wait.” Demography, 22, (4): 469-483.
Ministry of Health and Family Welfare (MoHFW). 2000. National Population Policy 2000, New Delhi: Department ofFamily Welfare, MoHFW, Government of India.
Ministry of Health and Family Welfare (MoHFW) 2002, National Health Policy 2002. New Delhi: Department ofFamily Welfare, MoHFW, Government of India.
Pearce, Tola. O. 1999. “She will not be Listened to in Public: Perceptions among the Yoruba of Infertility andChildlessness in Women.” Reproductive Health Matters, 7, (13): 69-79.
Population Reports. 1983. “Issues on World Health: Infertility and Sexually Transmitted Diseases: A Public HealthChallenge.” Population Reports Series, L, (4): 113-149.
Poston, Jr., Dudley, L. 1988. “Childlessness Patterns in Taiwan.” Journal of Population Studies, 11: 55-78.

22
IIPS Working Paper No. 1
Poston, Jr., Dudley, L. and Gu, B. 1987. “Socioeconomic Development, Family Planning, and Fertility in China.”Demography, 24: 531-551.
Poston, Jr., Dudley, L. and Trent, K. 1982. “International Variability in Childlessness: A Descriptive and AnalyticalStudy.” Journal of Family Issues, 3, (4): 473-491.
Poston, Jr., Dudley, L. and Trent, K. 1984. “Modernization and Childlessness in the Developing World.” ComparativeSocial Research, 7: 133-153.
Poston, Jr., Dudley L. and Kramer, Kathryn B. 1986. “Patterns of Childlessness among Catholic and Non-CatholicWomen in the U.S.: A Log-linear Analysis.” Sociological Inquiry, 56, (4): 507-522.
Ram, Usha. 2008. Childlessness and Its Consequences in India: Levels, Patterns and Differentials. Project reportsubmitted to the International Institute for Population Sciences, Deonar, Mumbai, India.
Reproductive Health Outlook. 1999. Infertility: Overview and Lessons Learned. Available at www.rho.org.
Rindfuss, Ronald R. and Bumpass Larry L. 1976. “How Old is Too Old? Age and the Sociology of Fertility.” FamilyPlanning Perspectives, 8, (5): 226-230
Rindfuss, Ronald R., Bumpass, Larry and Craig St. John. 1980. “Education and Fertility: Implications for the RolesWomen Occupy.” American Sociological Review, 45: 431-447.
Rindfuss, Ronald R., Morgan, S. Philip and Karen Offutt. 1996. “Education and the Changing Age Pattern of AmericanFertility: 1963-1989.” Demography 33 (3): 277- 290
Roberts, G. W. 1972. “Fertility in Some Caribbean Countries.” pp. 695-711. In International Union for the ScientificStudy of Population (IUSSP), 1971. Liege, Belgium, IUSSP.
Rowe, Patrick J. 1999. “Clinical Aspects of Infertility and the Role of Health Care Services.” Reproductive HealthMatters, 7, (13): 103-111.
Rutstein, Shea O. and Iqbal H. Shah. 2004. “Infecundity, Infertility, and Childlessness in Developing Countries.”DHS Comparative Reports No. 9. Calverton, Maryland, USA: ORC Macro and the World Health Organization. http://www.measuredhs.com/pubs/pdf/CR9/CR9.pdf
Sherris, J D and Fox, G. 1983. “Infertility and Sexually Transmitted Disease: A Public Health Challenge.” PopulationReport, L-116.
Sun, Te-Hsiung. 1984. “Urban-industrial Development as a Force in Rural Fertility Change: The case of Taiwan,Republic of China.” pp. 49-76. In Wayne A. Schutjer and C. Shannon Stokes (Eds.), Rural Development and HumanFertility. New York: Macmillan.
Surkyn, Johan and Lesthaeghe, Ron. 2004. “Value Orientation and the Second Demographic Transition (SDT) inNorthern, Western and Southern Europe: An Update.” In Andersson, Gunnar and Gerda Neyer (eds.) Contemporaryresearch on European fertility: Perspectives and developments. Demographic Research, Special Collection, 3, (3):43-86. www.demographic-research.org
Van de Kaa, Dirk J. 1987. “Europe’s Second Demographic Transition.” Population Bulletin, (42): 1-57.
Van de Kaa, Dirk J. 1996. “Anchored Narratives: The Story and Findings of Half a Century of Research into theDeterminants of Fertility.” Population Studies, 50: 389- 432.
Veevers, Jean, E. 1971. “Differential Childlessness by Color: A Further Examination.” Social Biology, 18: 285-91.
Vemuri, Murali D. and Manohar, D. 1986. “Childlessness in India.” Biology and Society, 3, (4): 163-166.
World Health Organization. 1975. “The Epidemiology of Infertility.” In Report of the WHO Scientific Group, TechnicalReport Series No. 582, WHO, Geneva.
World Health Organization. 1991. “Infertility: ATabulation of Available Data on Prevalence of Primary and SecondaryInfertility.” In Programme on maternal and Child Health and Family Planning, Division of Family Health, WHO, Geneva.
World Health Organization. 1997. “The Global Burden of Reproductive Health.” Progress in Human ReproductionResearch, 42: 2-3.