iito-project po 74 / 90
TRANSCRIPT

IITO-PROJECT PO 74 / 90 (F, I)
BETTER UTILIZATION OF TROPICAL TIMBER RESOURCES IN ORDER TO IMPROVE SUSTAINABILlTY AND REDUCE NEGATIVE ECOLOGICAL IMPACTS
Volume 1, Part 2:
Final Report of the Forest Studies by M. SCHARAI-RAD and D. NOACK
Hamburg 1994
INTERNATIONAL TROPICAL TIMBER ORGANIZATION
ORGANISATION INTERNATIONALE DES BOIS TROPICAUX
ORGANIZACION INTERNACIONAL DE LAS MADERAS TROPICALES

ITTO-PROJECT PO 74/90 (F, I)
BETTER UTILIZATION OF TROPICAL TIMBER RESOURCES
IN ORDER TO IMPROVE SUSTAINABILlTY AND
REDUCE NEGATIVE ECOLOGICAL IMPACTS
Volume 1, Part 2:
Final Report of the Forest Studies
by
M. SCHARAI-RAD AND D. NOACK
Hamburg 1994
BUNDESFORSCHUNGSANSTAL T FOR FORST - UND HOLZWIRTSCHAFT
FEDERAL RESEARCH CENTRE FOR FORESTRY AND FOREST PRODUCTS


CONTENT Page:
1. SITUATION OF FORESTRY IN THE FOUR TROPICAL COUNTRIES ......................... 1
1.1. GHANA ......................................................................................................................... 1 1.1.·1. Forests in GHANA .................................................................•........................ : .............. 1 1.1.2. Forest Management ...................................................................................................... 3 1.1.3. Forest Resources .......................................................................................................... 6 1.2. CAMEROON ......................................................................................................... .' ....... 7 1.2.1. Forests in CAMEROON ................................................................................................ 7 1.2.2. Forest Management ....................................................................................................... 8 1.2.3. Forest Resources ........................................................................................................ 10 1.3. INDONESiA ................................................................................................................. 11 1.3.1. Forests in INDONESIA / EAST KALlMANTAN ............................................................ 11 1.3.2. Forest Management. ................................................................................................... 13 1.3.3. Forest Resources ................................ ; ....................................................................... 16 1.3.4. External Factors Influencing the Forestry Sector ..................................................... ; .. 18 1.4. MALAySiA .................................................................................................................. 18 1.4.1. Forests in MALAYSIA / SARAWAK ............................................................................. 18 1.4.2. Forest Management .................................................................................................... 20 1.4.3. Forest Resources ........ : ............................................................................................... 22 1.4.4. Rehabilitation of Harvested Forests ............................................................................ 22
2. REVIEW OF LITERATURE ON FOREST RESIDUES ................................................ 24
2.1. Studies on Forest Residues in GHANA and CAMEROON ....................................... 24 2.2. Studies on Forest Residues in EAST KALlMANTAN IINDONESIA ......................... 27 2.3. Studies on Forest Residues in SARAWAK/MALAYSIA .......................................... 31 2.3.1. Forest Residues ........................................... ; .............................................................. 31 2.3.2. Environmental Damages ............................................................................................. 33 2.3.3. Reasons for the Large Amount of Forest Residues .................................................... 34 2.4. Conclusions Related to the General Situation of the Forestry in Tropical
Countries ................................................................................................................... 35
3. METHODOLOGY OF THE FOREST STUDIES .......................................................... 36
3.1. Pilot Study in GHANA ................................................................................................ 36 3.1.1. General Description of the Study Site ......................................................................... 36 3.1.2. Methods ...................................................................................................................... 37 3.1.3. Common Methodology ................................................................................................ 39 3.2; Special Aspects of Fores~ Site~ and on the Methodology of the Forest
Studies in GHANA ...................................................................................................... 41 3.2.1. Justification of the Selection of Concessions .............................................................. 41 3.2.2. Materials and Methods .......................................................... ~ ..................................... 41 3.3. Special Aspects of Forest Sites and on the Methodology of the Forest
Studies in CAMEROON 42 3.3.1. Justification of the Selection of Concessions .............................................................. 42 3.3.2. Materials and Methods ................................................................................................ 42

3.4 Special Aspects of Forest Sites and on the Methodology of the Forest Studies in EAST KALlMANTAN I INDONESIA .......................................................... .43
3.4.1. Justification of the Selection of Concessions ............................................................. .43 3.4.2. Materials and Methods ............................................................................................... .43 3.5. Special Aspects of Forest Sites and on the Methodology of the Forest
Studies in SARAWAK I MALAYSIA ........................................................................... 44 3.5.1. Justification of the Selection of Concessions ............................................................. .44 3.5.2. Materials and Methods ..................................................................... : ......................... .45
4. RESULTS OF THE FOREST STUDIES .................................................................... .46 4.1. Results of the Forest Studies in GHANA ................................................................. .46 4.1.1. Standing Stock ............................................................................................................ 46 4.1.2. Forest Residues .......................................................................................................... 46 4.1.3. Felling and Logging Disturbance ................................................................................ .46 4.2. . Results of the Forest Studies in CAMEROON ........................................................ .49 4.2.1. Standing Stock ............................................................................................................ 49 4.2.2. Forest Residues .......................................................................................................... 49 4.2.3. Felling and Logging Disturbance ................................................................................. 50 4.3. Results of the Forest Studies in EAST KALlMANTAN I INDONESIA ....................... 52 4.3.1. Standing Stock .............................................................. , ............................................. 52 4.3.2. Forest Residues .......................................................................................................... 53 4.3.3. Felling and Logging Disturbance ................................................................................. 55 4.4. Results of the Forest Studies in SARAWAK I MALAYSIA ....................................... 57 4.4.1. Standing Stock ............................................................................................................ 57 4.4.2. Forest Residues .......................................................................................................... 57 4.4.3. Felling and Logging Disturbance ................................................................................. 58 4.4.4. Skidding damages ...................................................................................................... 59 4.5. Discussion of the Results ......................................................................................... 60 4.5.1. Volume of Extracted Logs and Residues .................................................................... 60 4.5.2. Stand Damage by Felling Operations ......................................................................... 63
5. Recommendations .................................................................................................... 65
6. Literature ................................................................................................................... 66

TABLES: Page:
Table 1-1: Distribution of Forest land in various political regions of GHANA. ........................ 3 Table 1-2: Wood production in GHANA from 1980 to 1990 [million m3
] ................................ 6 Table 1-3: Land-use planning in CAMEROON ...................................................................... 8 Table 1-4: Roundwood production in CAMEROON in 1990 ................................................ 10 Table 1-5: Functional classification of Forest land in INDONESIA ...................................... 12 Table 1-6: Annual deforestation in INDONESIA between 1982 and 1990 .......................... 13 Table 1-7: Standing stock in permanent production forests of INDONESIA ....................... 13 Table 1-8: Projected area of industrial forest plantations in INDONESIA ............................ 16 Table 1-9: Log production in INDONESiA ........................................................................... 17 Table 1-10: Log export of INDONESIA ................................................................................. 17 Table 1-11: Areas of different forest classes and types in SARAWAK I MALAYSIA ............ 19 Table 1-12: Timber production in SARAWAK I MALAYSIA in 1991 and 1992 ...................... 22 Table 2-1: Volume and percentage of log residues (according to OTOO 1978) ................. 25 Table 2-2: Volume and percentage of log residues (according to FAAKYE 1988) .............. 26 Table 2-3: Total volume of 70 trees and their wood residues in EAST
KALlMANTAN (according to RADTKE 1990) ..................................................... 29 Table 2-4: Forest residues resulting from the felling of 44 trees in EAST
KALlMANTAN (according to RADTKE 1990) ......................................................... 30 Table 2-5: Category and percentage of damage in a logged forest (according to
FOX 1968) ......................................................................................................... 32 Table 2-6: Quantity of forest residues in the three terrain classes (according to
MANGGILL 1980) .............................................................................................. 33 Table 3-1: Forest area and forest management planning in the concessions in
EAST KALlMANTAN (1987) .......................................... ~ ................................... .44 Table 4-1: Whole tree volume, extracted log volume and amount of wood residues
related to GHANA .............................................................................................. 46 Table 4-2: Average tree size and gap area in the study sites of GHANA .......................... .47 Table 4-3: Summary of felling damage in the felling gaps in GHANA ................................ .47 Table 4-4: Skidding damages along the skidding tracks in the sample plots ..................... .47 Table 4-5: Skidding damage frequency (slightly and severely damaged trees)
appointed to diameter class and part of the tree in GHANA ............................. .48 Table 4-6: Description of logging roads, skidding tracks, and loading bays in
GHANA ............................................................................................................... 48-Table 4-7: Inventory of the sample plots prior to exploitation in CAMEROON ................... .49 Table 4-8: Whole tree volume, extracted log volume, and amount of wood
residues related to CAMEROON ........................................................................ 50 Table 4-9: A verage gap area per tree related to tree species and study site in
CAMEROON ...................................................................................................... 50 Table 4-10: Damages to the residual stand caused by felling operations in
CAMEROON ...................................................................................................... 51 Table 4-11: Description of logging roads and skidding tracks in CAMEROON ..................... 51 Table 4-12: Distribution of tree species in the study sites of EAST KALlMANTAN I
INDONESIA ....................................................................................................... 52 Table 4-13: Tree density (number of trees per ha) in the study sites of EAST
KALlMANTAN I INDONESIA .............................................................................. 52 Table 4-14: Standing stock (m3 timber per ha) in the study sites of EAST
KALIMANTAN I INDONESIA .............................................................................. 52

Table 4-15:
Table 4-16:
Table 4-17: Table 4-18:
Table 4-19:
Table 4-20: Table 4-21:
Table 4-22:
Table 4-23:
Table 4-24:
Table 4-25:
Table 4-26:
Table 4-27:
Table 4-28:
Table 4-29:
FIGURES:
Standing stock and extracted logs as volume of the clear bole (m3 timber per ha) in the study sites of EAST KALlMANTAN { INDONESIA ....................................................................................................... 53 Whole tree volume, extracted log volume, and amount of wood residues determined in the study sites of EAST KALlMANTAN { _ INDONESIA ....................................................................................................... 53 Stand damage in relation to extracted tree in EAST KALlMANTAN .................. 54 Number of damaged trees in relation to the diameter class in EAST KALlMANTAN {INDONESiA .............................................................................. 55 Gap size in relation to the number and cjimensions of the tree and to the extracted timber logs in EAST KALlMANTAN {INDONESIA ........................ 55 Description of the skidding tracks in EAST KALlMANTAN {INDONESIA .......... 56 Degree and number of trees damaged by skidding operations in EAST KALlMANTAN {INDONESiA .............................................................................. 56 Number of sound and exploitable trees with a diameter between 20 and 49 cm per ha after harvesting operations in EAST KALlMANTAN ..................... 56 Standing stock of trees with a diameter (dbh) of 20 cm and above in the study sites of SARAWAK {MALAYSIA .............................................................. 57 Whole tree volume, extracted log volume, and amount of wood residues related to SARAWAK{ MALAySiA ...................................................... 58 Number of trees of the residual stand damaged by felling operations in SARAWAK{ MALAySiA .................................................................................... 58 Mean gap size of various tree species in the Mixed Swamp Forest of SARAWAK {MALAYSIA .................................................................................... 59 Number of damaged and undamaged trees per ha and their basal area after logging operations in SARA WAK { MALAySiA .......................................... 59 Total area of forest opening after harvesting operations in different study sites in SARAWAK{ MALAYSIA .............................................................. 60 Area of felling gaps and damages on gap areas in the four tropical countries ............................................................................................................ 64
Figure 4-1: Volume of extracted logs and of wood residues as part of the whole trees in GHANA ........................................................................................ .' .. : ..... 61
Figure 4-2: Volume of extracted logs and of wood residues as part of the whole trees in CAMEROON ......................................................................................... 61
Figure 4-3: Volume of extracted logs and of wood residues as part of the whole trees in EAST KALlMANTAN {INDONESiA ....................................................... 62
Figure 4-4: Volume of extracted logs and of wood residues as part of the whole trees in SARAWAK {MALAYSIA ....................................................................... 63


1. SITUATION OF FORESTRY IN THE FOUR TROPICAL COUNTRIES
In order to represent the variability of· tropical forests to some extent and by typical examples, different forest sites in two different tropical countries of. two different tropical regions, AFRICA and SOUTHEAST ASIA, have been chosen for the forest studies of this investigation. Even if certain similarities exist in the African forests of GHANA and CAMEROON on the one hand and in the Southeast Asian forests of INDONESIA and MALAYSIA on the other hand, we have to stress that the situation of forestry in the four countries concerned is rather different. These distinctions of the present situation of forestry of the four tropical countries are caused by:
• differences in forest legislation and different organisation of forest administration,
• dissimilar forest resources with different standing stock of commercial timbers,
• different export policy (including ban of the export of logs), and
• different level of training of foresters and personnel in forestry at various labour and management levels.
In order to demonstrate the different situation in forestry of the four tropical countries, the forest resources, forest management as well as the wood production are summarised in chapters 1.1 to 1.4 for each country.
1.1. GHANA
1.1.1. Forests in GHANA
Forest types
GHANA is characterised by two broad vegetation types:
• The savannah·vegetation situated in the Northern part as well as in some parts of the Coast line covering up to about 66 % of the total land area of GHANA, and
• the tropical high forest zone located in the Central and South west parts of GHANA covering 34 % (8.2 million hectares) of the total land area.
GHANA's tropical high forest zone consists of four main forest types:
• The Wet Evergreen Forest (WEF) is located in the South western part of GHANA. It is the richest forest type in terms of its floristic composition. The annual rainfall is more than 1 750 mm. Despite the large number of plant species per hectare (about 200 species have been determined in a 25 m x 25 m plot) the number of commercial timber species growing in WEF, such as Azobe (Lophira alata), Dibetou (Lovoa trichilioides) , and Niangon (Heritiera utilis) , is rather small.
• The Moist Evergreen Forest (MEF) is located between the Wet Evergreen Forest and the Moist Semi-deciduous Forests. The. number of plant species per hectare is somewhat lower than in the Wet Evergreen Forest (about 170 species have been determined within a
1

25 m x 25 m plot). However, the number of commercial tree species, such as Tiama (Entandrophragma ango/ense) , Sapelli (E. cylindricum) , and Khaya (Khaya ivorensis) , is somewhat larger. The annual rainfall varies from 1 500 mm to 1 750 mm.
• The Moist Semi-deciduous Forest (MSF) is classified into two subtypes; a drier North-west type and a wetter South-east type. The annual rainfall ranges between 1 250 mm and 1 700 mm. The species composition is lower than that of the Wet Evergreen and Moist Evergreen Forest types (up to only 100 plant species have been determined in a 25 m x 25 m plot).
On the other hand, the most important commercial timber species occur frequently in this forest type. Notable commercial wood species of this forest type are: Sapelli (Entandrophragma cylindricum), Sipo (E. utile), Tiama (E. ango/ensis), Khaya (Khaya ivorensis), Krala (K. anthotheca), and Makore (Tieghemella heckelii).
• The Dry Semi-deciduous Forest (DSF) is located north of the Moist Semi-deciduous Forests, in areas where the annual rainfall varies between 1 250 mm and 1 500 mm. The two subtypes corresponding to the rainfall peaks are the Inner Zone of DSF in the wetter South, and the Fire Zone of DSF in the Northern section. The number of plant species growing in the Dry Semi-deciduous Forest is much lower than that in the other forest types (40 to 100 species in a 25 m x 25 m plot). The most predominant commercial timber trees are (Milicia exce/sa) and Abachi (Trip/ochiton se/eroxy/on). Doussie (Afzelia africana) and African Ebony (Diospyros mespi/iformis), known as savannah species grow also in the DSF.
• Besides the four natural forest types WEF, MEF, MSF, and DSF, about 70 000 hectares forest plantations of Teak (Tectona grandis), Gmelina (Gme/ina arborea) and Cedrela (Cedre/a spp.) exist at present in GHANA.
Forest Reserves
The total area of closed tropical high forests in GHANA amounts to about 8.1 million hectares, of which about 1.8 million hectares (22 %) have been declared as forest reserves consisting of the following three forest categories:
• Production forests of 1.2 million hectares,
• •
Protection forests Wildlife reserves
of of
0.4 million hectares, and 0.2 million hectares.
Forest Stocking
The total number of tree species of GHANA's tropical high forests amounts to about 680. However, only 200 tree species grow to a log size of over 50 cm diameter at breast height (dbh). Related to the commercial importance the GHANAIAN timber species are classified into three Classes: • Class I represents 66 exported timber species which include the traditional species as
well as those of lesser commercial importance. About 47 % of the growing stock and a" tree species felled and exported between 1973 and 1988 belong to this class.
• Class" consists of 60 wood species with a dbh up to 70 cm which grow in marketable quantities, but which have never been exploited in the past.
2
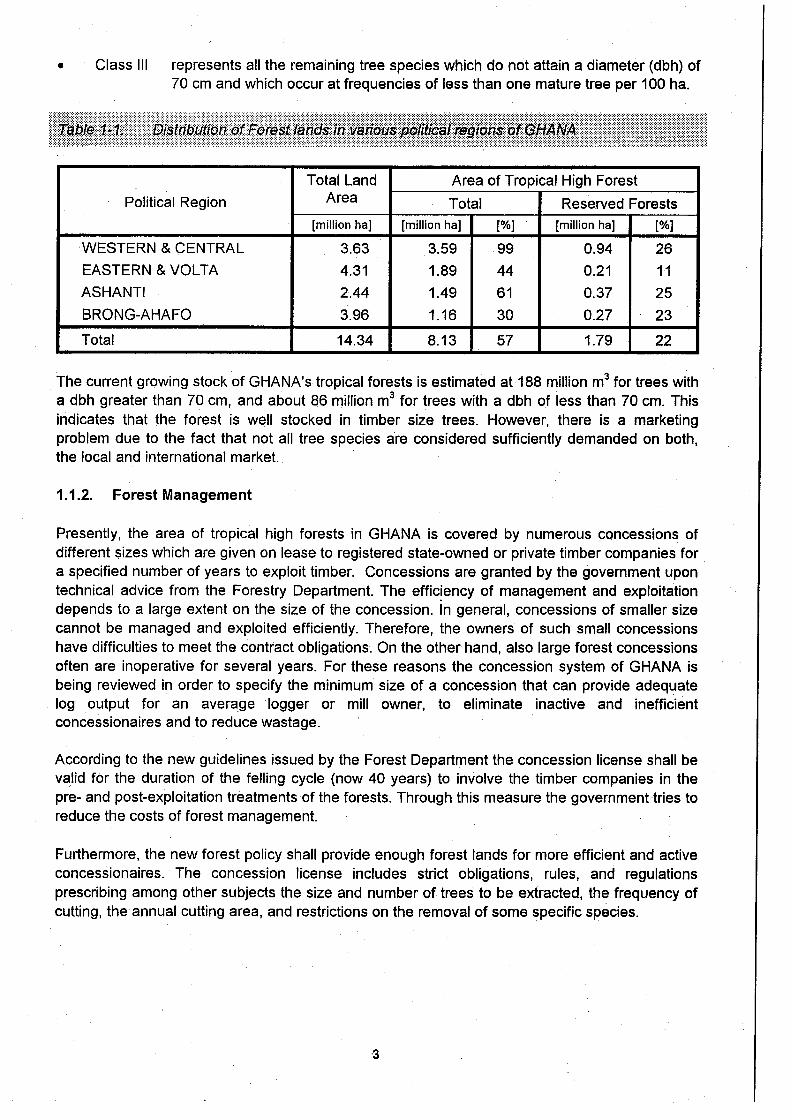
• Class III represents all the remaining tree species which do not attain a diameter (dbh) of 70 cm and which occur at frequencies of less than one mature tree per 100 ha.
Total Land Area of Tropical High Forest
Political Region Area Total Reserved Forests [million ha] [million ha] [%] [million ha] [%]
WESTERN & CENTRAL 3.63 3.59 99 0.94 26
EASTERN & VOL TA 4.31 1.89 44 0.21 11
ASHANTI 2.44 1.49 61 0.37 25
BRONG-AHAFO 3.96 1.16 30 0.27 23
Total 14.34 8.13 57 1.79 22 L _____ .. _____________
The current growing stock of GHANA's tropical forests is estimated at 188 million m3 for trees with a dbh greater than 70 cm, and about 86 million m3 for trees with a dbh of less than 70 cm. This indicates that the forest is well stocked in timber size trees. However, there is a marketing problem due to the fact that not all tree species are considered sufficiently demanded on both, the local and international market.
1.1.2. Forest Management
Presently, the area of tropical high forests in GHANA is covered by numerous concessions of different sizes which are given on lease to registered state-owned or private timber companies for a specified number of years to exploit timber. Concessions are granted by the government upon technical advice from the Forestry Department. The effic!ency of management and exploitation depends to a large extent on the size of the concession. In general, concessions of smaller size cannot be managed and exploited efficiently. Therefore, the owners of such small concessions have difficulties to meet the contract obligations. On the other hand, also large forest concessions often are inoperative for several years. For these reasons the concession system of GHANA is being reviewed in order to specify the minimum size of a concession that can provide adeqt.,late log output for an average logger or mill owner, to eliminate inactive and inefficient concessionaires and to reduce wastage.
According to the new guidelines issued by the Forest Department the concession license shall be valid for the duration of the felling cycle (now 40 years) to involve the timber companies in the pre- and post-exploitation treatments of the forests. Through this measure the government tries to reduce the costs of forest management.
Furthermore, the new forest policy shall provide enough forest lands for more efficient and active concessionaires. The concession license includes strict obligations, rules, and regulations prescribing among other subjects the size and number of trees to be extracted, the frequency of cutting, the annual cutting area, and restrictions on the removal of some specific species.
-3

Royalties and Fees
There are three main types of revenues for the GHANAIAN government from logging concessions: • a relatively low annual rent
for the total land t;lrea of the concession paid by the concessionaire throughout the concession validity period;
• the silvicultural fee paid in respect of annual coupe in a forest reserve and used mainly for silvicultural operations in the forest reserve. The silvicu/tura/ fee per he~tare may be considered to be low but also inadequate for any meaningful silvicultural operation.
• royalties charged in respect of trees felled during logging; royalties are the major revenue, they vary with tree species. Before 1990, the royalties were quite low. In 1990, however, new royalties were introduced in order to increase the revenue earned from the forest. In the beginning, the royalties were fixed at 6 % of the f.o.b. price for an average standing tree volume of a particular species above the minimum felling diameter, but already in 1991 they were increased to 12 %. The concessionaires, however, expect detrimental effects on their business and they are, therefore, not willing to accept the new fees.
Regulations for Minimum Felling Diameter, Felling Cycle, Allowable Cut, and Environ~entally Sound Logging
For all commercial tree species regulations with regard to the minimum felling diameter (dbh), the felling cycle, the allowable cut as well as an environmentally compatible logging
have been given to all concessionaires by the Forest Department in order to maintain a stocking level which is sufficient to sustain the forest for the subsequent felling cycles.
The minimum felling diameter defines the maturity size of a tree of a particular timber species. The diameter class interval is 20 cm, and it is estimated that it takes an average of 40 years for the major commercial tree species to grow from one diameter class to the next higher one.
Therefore, the felling cycle has actually been prolonged from 25 years to 40 years. The prolongation was necessary due to the results of the current forest inventory showing that the removal of the mature and over-mature trees between 1972 and 1987 can only be justified for a felling cycle of 40 years.
To protect the current commercial tree species, the volume of the allowable' cut is related to the amount of the increment of each particular tree species and to the fact, that the general stocking of some important species such as Makore (Dumoria hecke/ii) and Afrormosia (Afrormosia e/ata) has decreased drastically, and that there is often a poor representation of some size classes in the exploited forests (especially the sapling and pole sizes). In order to improve the Situation, some restrictions have been imposed on the exploitation of the relevant tree species.
4

To ensure environmentally less destructive logging practices, rules and regulations have been introduced with regard to road and bridge constructions, installations of work camps and loading bays, after-logging treatment of loading bays as well as of tree felling itself with very severe penalties for offence against these regulations.
Control of Exploitation in Concessions
The logging operations in a concession are restricted to an annual coupe or a periodic block of annual coupes. The area of the annual coupe corresponds to the ratio between the total concession area and the felling cycle of 40 years. For small concessions the annual coupe may be .smaller than one compartment and, consequently, uneconomic to work. Therefore, for the existing concessions, periodic blocks of coupes for 2 to 5 years may be issued to give an economic exploitable area. Moreover, the new concession system prescribes the minimum size of concession areas in order to avoid economic problems for the concessionaires.
Since, due to marketing difficulties, the allowable cut cannot always be removed at the first entry, . frequent re-entries into the same compartment or annual coupe are unavoidable. Therefore, the concessionaire has to carry out logging in a given coupe within a perio(j of three years after which no felling is allowed before the next felling cycle.
Yield Rem~:)Val in Concessions
In GHANA, concessionaires are expected to exploit as many of the timber species as possible. Therefore, yield is calculated for all the class I species growing in the compartment. Where the stocking is very dense, over 500 trees could be offered for felling per compartment (of an area of 130 ha). But all the class I species are not equally desired at the market, hence, only few are usually exploited. For instance in one concession at ASUKESE Forest Reserve:
1 083 trees comprising 35 species were prescribed for felling in an annual coupe of 259 ha, but at the end of the felling of the first entry of logging, only 254 trees (about 25 %) comprising only 12 species had been exploited.
In GHANA, it has been warned that an optimum cutting intensity should be established, because the more species become marketable the number of trees to be felled per ha under the present yield prescription will increase, and this is likely to result in an extensive logging damage and canopy opening.
Planning of Logging Operations
Before starting with the logging operations, an intensive timber inventory has to be carried out in the annual coupe which includes the identification, counting, numbering, and mapping of all timber trees above a dbh of 50 cm. This inventory is normally carried out by the District Forest staff, but is financed by the concessionaire who may only be permitted to conduct the inventory by himself, if he has the qualified staff. The inventory data are recorded in a stock map and stand table.
• The stock map indicates the trees in the compartment by position, species, diameter, and stock number. The trees to be cut are selected from the stock map.
• The stand table shows the number of species, diameter distribution, and stem frequencies. The stand table provides figures for the calculation of the allowable cut.
5

To monitor the log production, both the concessionaire and the Forestry Department tabulate the yield by indicating the tree species, log diameter, and stock survey number. To control and prevent illegal logging, the concessionaire has to identify the trees felled as well as the logs produced during logging. In this context, the name of the tree species, the concessionaire's registered property mark, the stock map number as well as the stump number are written on the stump in white waterproof paint. The Forest Reserve Code, compartment number, Forest District locality mark, name of the tree species, stock map number, log number, and property mark are written on each individual log.
The Forestry Department has also produced a logging manual in order to control possible environmental hazards in unplanned and uncontrolled logging. The loggers are committed to follow all regulations in this manual. Very severe penalties are inflicted by offence against these regulations. The concessionaire is obliged to prepare logging schedules and plans before logging permits are issued to them. The manual also gives standard specifications for roads, skid tracks, logging machinery as well as general forest hygiene.
1.1.3. Forest Resources
GHANA supplies its wood demand from the tropical high forest, from the savannah forests, and from plantations. The tropical high forest is the major source of saw logs and veneer logs while the savannah forests and the plantations provide poles for rural housing, fuelwood, and wood for charcoal production. Table 1-2 shows the total roundwood production in GHANA between 1980 and 1990 which increased by about 35 % from 12.9 to 17.4 million m3
. The log production for timber and veneers was only a relatively small part of the total roundwood production in the order of about 7.5 % with an increase from 1.0 to 1.3 million m3
. The annual fuelwood and charcoal production which are mainly for domestic uses increased in a similar way.
Out of 66 commercial timber exploited from GHANAIAN forests, 51 are released for export in roundwood or log form. The remainder which are classified as primary species are processed in local mills into lumber, veneer, plywood, and knock-down furniture before exportation. This policy has been adopted to increase the export value of the wood.
Total roundwood Conversion of roundwood to
Year production Fuelwood Charcoal Timber logs [million m3
] [million m3] [million m3
] [million m3]
1980 12.9 9.6 2.3 1.0
1985 16.5 12.4 3.0 1.1
1990 17.4 12.9 3.2 1.3 --- -
Source: FAO Forest Products Yearbook 1990 and FPIB Summary of log production (1987 - 1990)
Except a few cases, most logging residues are still not utilised. Only logs rejected at loading bays are occasionally processed into sawn timber. Furthermore, Afrormosia branches are utilised by a timber company for the production of flooring. Due to the abundance of fuelwood in most of the logging areas, no attention has been given to the possibility of using. branchwood for charcoal production so far. Individuals involved in the charcoal production use especially sawmill off-cuts or trees felled on farmland during site preparation.
6

1.2. CAMEROON
1.2.1. Forests in CAMEROON
Forest Types
Due to the high diversity of ecosystems, CAMEROON can to some extent be characterised as Miniature Africa. In the Southern part of the country there are various types of tropical humid forests which differ considerably from the forests in the North where the savannah vegetation is dominating. The Savannah is characterised by savannah forest, savannah bush, open savannah partly covered with individual trees, savannah herbs, and Sahel steppe.
The tropical humid forests cover an area of 22 million ha which correspond to 45 % of the country's territory. 14.5 million ha or about 60 % of these forests are exploitable. A forest inventory carried out in the exploitable part of the tropical humid forests has led to the following results:
• Almost 10 million ha consists of high humid forests and of areas of secondary growth. These forests are at present exploitable.
• Half of the 600 tree species occurring in the humid forests are characterised as commercial timber with diameters at breast height (dbh) between 50 and 130 cm. However, at present only about 50 tree species are commercially utilised, whereas the remainder of 250 species can be characterised as lesser-used species. As shown in Table 1-4, the tree species Abachi/Ayous (Triplochiton scleroxylon) and Sapelli (Entandrophragma cylindricum) are dominating with 34 % and 17 % of the total roundwood production, respectively, and 20 commercial tree species, including Abachi and Sapelli, make up for nearly 90 % of the total log production in CAMEROON.
• With regard to the timber resources, CAMEROON is the second most important timber country in Africa. It is estimated that the standing stock of CAMEROON's 22 million ha tropical humid forests is greater than 1· 500 million m3
.
Land-use in CAMEROON
The annual destruction of tropical forests due to encroachment of local settlers and by shifting cultivation as well as by agro-industrial projects is in the order of 200 000 hectares. In order to utilise the 14 million ha of exploitable tropical forests in a proper manner, a National forestry plan has been prepared and is in the approval phase. Details about the land-use in CAMEROON are given in Table 1-3.
7

Forest Classes Area
[million ha] [%]
Permanent Forest Area 9.0 63
Production Forests 6.1 43
Ecological Reserves 1.4 10
Protection Forests 0.6 4
Collective Forests 0.3 2
Community Forests 0.3 2
National Parks, Recreation Forests, Sanctuaries, Recreation Forests, Training and Research Forests 0.3 2
Agroforestry Zones, Settled Areas, 5.1 35
Agricultural Plantations 0.1 1
Mining Areas, Hydro-electricity Projects 0.1 1
Total Area of exploitable 14.3 100
Tropical Forests
1.2.2. Forest Management
Management Plan in Production Forests
The objectives of management and the description of the area concerned are laid down in detail in the management plan. Moreover, the management plan contains rules prescribing the felling cycle, the minimum felling diameter, and the annual allowable cut.
In case of CAMEROON, the felling cycle is set to 20 and 30 years, and the minimum felling diameter (dbhminJ ranges from 50 to 100 cm depending on the tree species considered.
The logging operations are approved and controlled by the Forestry administration. The exploiting companies have to describe all activities concerning harvesting and extraction of logs in the logging sites.
Presently, the following projects are assisting CAMEROON's efforts for a proper management of its forests and for a sound log production:
• SO'O LALA Project of 42000 ha and SOUTH-BAKUNDU Project of 18500 ha, both supported by ITTO,
• Management Project DIMAKO of 600 000 ha being implemented in co-operation with "LA MISSION DE CO-OPERATION FRANCAISE", and
• Pilot Project "LA FORET D'EDEA" of 200 000 ha with CANADIAN assistance.
8

Forest Utilisation System
Due to the lack of clearly defined forest policy, the forest management is based on a cautiously conducted forest inventory. The total area of forests appointed to exploitation is about 400 000 ha per year, while the individual areas assigned for felling and extraction of timber, the coupes, have a size of 2 500 ha each. These coupes have to be accurately inventoried by the Forest Department before felling operations can commence. The felling technique is decided by the feller during the operations in the forest. Caterpillars are used for skidding of the logs to the closeby logyard.
The· selective felling involves the danger of impoverishment of biodiversity. Therefore, the Government of CAMEROON expects a positive ecological effect from sustainable forest management as well as by preservation of forest ecosystems.
In CAMEROON, within the framework of silvicultural activities forest plantations have been established by the Government. These plantations cover an area of about 33 000 ha which consists of 23 000 ha located in high forests, 6 000 ha located in humid savannah areas and 4 000 ha located in dry savannah forests.
Concession System
The new forest management regulations of CAMEROON prescribe the sustainable management of production forests under consideration of felling cycles ranging between .20 and 30 years. The maximum size of a concession area shall be 500 000 ha. The present system of concession rights, which is under revision by the Forest Department, prescribes a 5 years lasting logging operation by the concessionaires which in case of mutual interest may be renewed by the Forest Department for further 5 years.
The concession area is sub-divided into coupes of 2 500 ha. The logging operations are carried out within three years, and afterwards the exploited coupes are closed for at least 20 years. Before starting with logging operations the concessionaires are obliged to conduct an inventory and to submit it to the Forestry Administration.
Forests in the agroforestry zones are managed privately. In the rural areas, the forests are allocated to the community and are utilised by the local people. The people decide on the methods to be used for the management of those community forests.
Revenue System
There are two kinds of taxes:
• Fixed taxes which are related to the size of the concession area, and
• variable taxes which are based on the produced timber volume. The tax for felled trees amounts to 10 % of the market value of the tree species concerned. In case of log export, an additional tax of 5 % of the market value is claimed.
Law Enforcement and Control
For a better protection of forest land and for an efficient use of the existing timber resources, the Government of CAMEROON is revising its forest policy and the existing forest laws. The objectives of the new forest policy are:
9

• to improve the utilisation of timber resources in the agroforestry zones, and
• to develop more efficient forestry activities in the private sector and among the village communities.
These objectives can be achieved if all activities are controlled and if all parties concerned are familiar with the new forest legislation.
Due to the lack of well-trained personnel the control of exploitation by the Forestry Administration is at present incomplete and not satisfactory. This situation may explain why the volume of timber cut illegally is estimated between 300000 up to 500 000 m3/year.
1.2.3. Forest Resources
Roundwood Production
The production of roundwood has increased considerably from 400 000 m3 in 1960 to 2.5 million m3 in 1991. The most important commercial timber species are Abachi, Sapelli, Azobe, Limba (Frake), Tali, Iroko, Movingui, Sipo, and Makore (Moabi). About 50 % of the roundwood produced in 1990 are Abachi and Sapelli. Table 1-4 shows the volume of roundwood produced in 1990.
Utilisation of Logging Residues
In general, logging residues are produced in locations which are far from places of possible utilisation. The high costs of collection and specially of transportation of the logging residues from the remote forests to the residential areas exclude an economic utilisation of logging residues so far. A demand for residues in the concession areas themselves does not exist.
But there are some possibilities for the utilisation of forest residues left behind. For example, big branches and buttresses could be processed to sawn timber by mobile sawing machines in the forest site. Certain residues are also suitable for the production of table and chair elements, .. particularly of legs of tables and chairs.
Tree species Botanical name Roundwood Production [m3]
Abachi Triplochiton scleroxylon 850000
Sapelli Entandrophragma cylindricum 420000
Azobe Lophira alata 180000
Limba Terminalia superba 120000
Tali Entandrophragma ivorense 90000
lroko Chlorophora excelsa 80000
Movingui DistemonanthUs benthamianus 70000
Sipo Entandrophragma utile 60000
Makore Dumoria heckelii 60000
Other species - 550000
TOTAL - 2480000
10

Residues of smaller size can be used as firewood and as raw material for charcoal production, but in this case a co-operation between different wood users is necessary directly at the forest site.
Only in residential areas, close to the cities, the wood residues are used for various purposes, such as
• sawdust for cattle and other animal breeding, • solid wood residues for construction purposes, and • fire wood.
Furthermore, in the wood industry residues are used as fuel to generate heat and electricity.
External Factors Influencing the Forestry Sector
The rapid population growth is the most important factor influencing the forestry sector negatively. The increasing demand of farmland and agricultural products has led to enormous devastations of tropical forests. The area destroyed by shifting cultivation and by agro-industrial activities is estimated at about 200 000 ha per year. The increasing demand for ground in the building sector shall also not be underestimated. The growing population leads to more building activities in residential areas and in the. vicinity of larger cities. The victim, however, is the forest which is
. destroyed in order to provide land for more houses, public buildings, and the necessary infrastructure.
1.3. INDONESIA
1.3.1. Forests in INDONESIA I EAST KALlMANTAN
Forest Types
In INDONESIA, almost the entire natural forests are far away from JAVA, the Nation's centre of population and culture. Therefore, the Ministry of Forestry concentrates its activities in land-use policy almost exclusively on forest land located on INDONESIA's outer islands. Therefore, the forest studies of this project have also been carri.ed out at three different sites in the Province of EAST-KALlMANTAN on BORNEO Island.
As reported by the experts of MULAWARMAN University, it is likely that in the past, INDONESIA was almost entirely covered with tropical rainforest which has been permanently reduced through the. action of man. The degradation of watersheds became already evident about 100 years ago, with the consequence that logging was legally prohibited in certain hilly areas in order to protect steep slopes against erosion. In 1984, comprehensive regulations for land-use planning on JAVA Island were introduced, including detailed definitions of those areas which have to be kept as permanent protection forests. These regulations shall guarantee the preservation of forests in WEST JAVA at an elevation above sea level of 1 650 m and in CENTRAL and EAST JAVA above 1 450 m, respectively. But also in less mountainous regions, forests around springs and lakes were preserved.
In INDONESIA, an entire land classification system based on elevation was introduced by the Ministry of the Interior. In 1967, the Ministry of Forestry followed this approach, when the Concession Codes were introduced in which, accordingly, elevation was embodied in a restrictive
11
clause in Forest legislation prohibiting logging above 500 m elevation above sea level for all concessions throughout INDONESIA.
The next step in the development' of. forest land classification was to superimpose upon this general regulations a Site Index derived from the universal soil loss equation of the INDONESIAN Soil Classification System. For the land-use planning, three criteria are used in the Site Index evaluation process, these are:
• slope (with 5 slope classes: 0 ... 3 %, '3 ... 8 %,8 ... 15 %, 15 ... 25 %, and 25 .. .45 %); land areas with slopes greater than 45 % are automatically assigned to the Protection Forest Status,
• soil erodibility (with 5 soil classes ranging from Class 1 "not susceptible to erosion" to Class 5 "very susceptible to erosion"), and
• rainfall intensity on slopes less than 45 % (with 5 rainfall intensity Classes of the mean annual rainfall [in mm] divided by the total number of raindays in one year, ranging from 0 ... 13.6 mm/d to >34.8 mm/d).
The relative importance of each criterion is reflected by weighing factors which are 20, 15, and 10 for the slope Class, soil erodibility Class, and rainfall intensity Class, respectively. Related to the Site Index, the INDONESIAN forests are classified as follows:
• • •
Production Forest and Conservation Forest Limited Production Forest Protection Forest
Site Index = Site Index = Site Index =
0 ... 124 125 ... 174
above 174
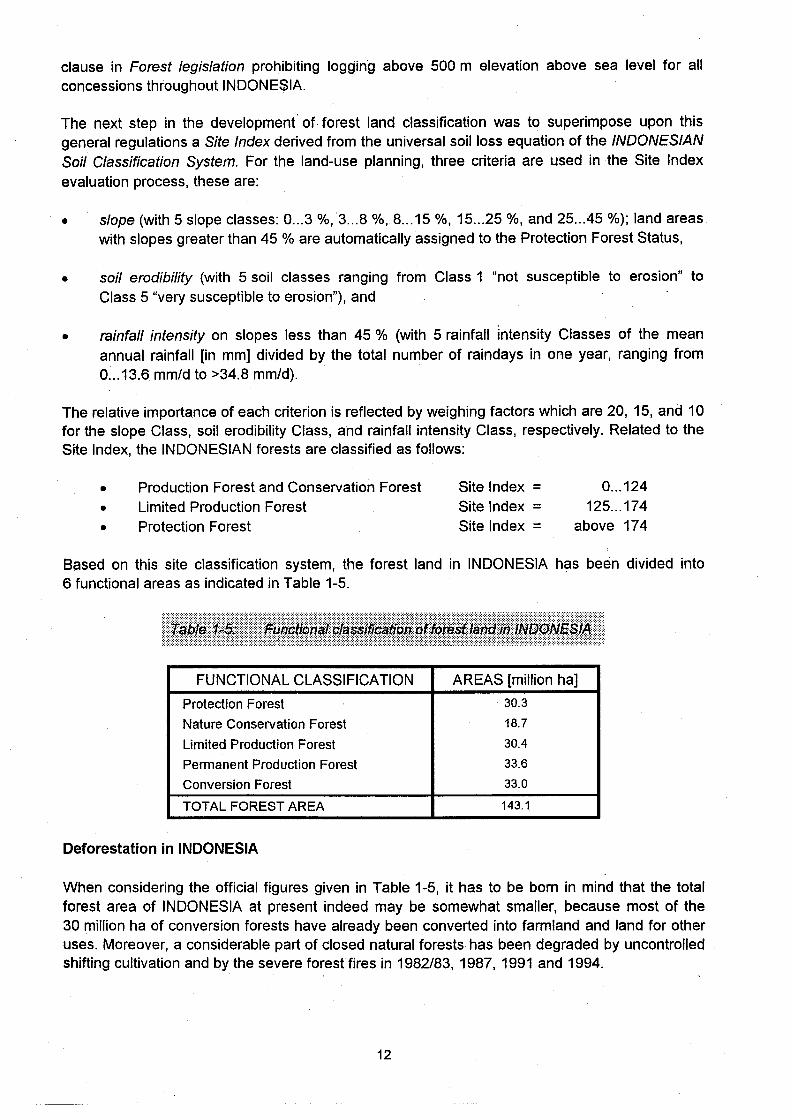
Based on this site classification system, the forest land in INDONESIA has been divided into 6 functional areas as indicated in Table 1-5.
FUNCTIONAL CLASSIFICATION AREAS [million ha]
Protection Forest 30.3
Nature Conservation Forest 18.7
Limited Production Forest 30.4
Permanent Production Forest 33.6
Conversion Forest 33.0
TOTAL FOREST AREA 143.1
Deforestation in INDONESIA
When considering the official figures given in Table 1-5, it has to be born in mind that the total forest area of INDONESIA at present indeed may be somewhat smaller, because most of the 30 million ha of conversion forests have already been converted into farmland and land for other uses. Moreover, a considerable part of closed natural forests· has been degraded by uncontrolled shifting cultivation and by the severe forest fires in 1982/83, 1987, 1991 and 1994.
12

Reason for Deforestation Area [ha]
Crop plantations (e.g. rubber and oil palm plantations) 160000
Transmigration and related infrastructure 300000
Shifting cultivation 300000
Normal forest fires 100000
Exceptional forest fires 380000
Other reasons (spontaneous transmigration, illicit logging, 80000
mining, urban development, etc.)
TOTAL 1 320000
This deforestation, as far as controlled by the Government of INDONESIA, is regarded as a necessary measure for the Nation's economic development and for the needs of a growing population .
. 1.3.2. Forest Management
Sustained Yield Management in Natural Forests
8ythe end of 1989, over 60 million ha of forests were leased to about 560 private and stateowned concession holders. However, based on 1987/88 estimates, the actual area of production forest within these concessions were in the order of about 43 million ha only, out of which over 4.6 million ha have been released for conversion to other uses and another 1.9 million ha are planned to be converted into plantations for an industrial timber estate programme. Therefore, some 37 million ha are regarded as natural production forests with concessions designated to produce timber on a permanent sustainable basis. The standing stock of these permanent production forests can be characterised by the figures given in Table 1-7.
Category Amount Share [%]
Total area of concession forests 60 million ha 100 Estimate of heavily logged forests 23 million ha 35
Permanent production forests 37 million ha 65
Total standing stock in permanent production forests 3 200 million m3 100 Volume of commercial species 2 700 million m3 85
Mean standing stock 85 m3/ha 100
Standing stock of trees with dbh > 35 cm 755 million m3 100 Mean volume of trees with dbh > 35 cm 21 m3/ha 25
Standing stock of commercial trees with dbh > 35 cm 575 million m3 76 Mean standing stock of commercial trees with dbh > 35 cm 15.5 m3/ha 18
13

The volume of the standing stock in permanent production forests, of which the mean value is estimated at about 85 m3/ha, differs considerably between unlogged forests and logged forests. At the end of, 1989, the total unlogged forests of INDONESIA, including those outside of concessions, has been estimated at about 30 million ha. The stock volume of these unlogged forests with regard to trees with a diameter (dbh) > 50 cm is in the order of 2 600 million m3
• At a projected average annual wood production of 31.4 million m3 during the coming decades, some of the natural timber stock will survive well beyond the year 2050.
But deforestation, wasteful logging, creaming off the most valuable tree species, forest fires, and other factors will adversely affect the growing stock. Furthermore, due to population and industrial growth, the, projections suggest that the raw material situation in INDONESIA will become critical already in about one decade, if INDONESIA continues to maintain its dominance on the tropical timber market and its rapid development of the wood industry, and if forest resource management and utilisation efficiency do not improve significantly in the near future.
Up till 1989, the forest management system in INDONESIA was based on the INDONESIAN Selective Cutting system (TPI) which was prescribed for almost all natural production forests. But in 1989, TPI was replaced by the INDONESIAN Selective Cutting and Planting system (TPTI) in order to force the concessionaires to establish enrichment pla,nting in the logged forest. TPI and TPTI specify a cutting cycle of 35 years and a minimum diameter (dbh) of 50 cm for trees to be felled in permanent production forests, and a minimum diameter of 60 cm for trees in limited production forests. In addition, the TPTI system stipulates that a minimum of 25 trees per hectare of commercial species within the diameter classes of 20 to 49 cm must remain after logging.
According to observations made in the tropical forests of Southeast Asia, a felling cycle of 35 years can be considered as far too short to support long-term sustainable harvesting. Obviously, it takes far more than 35 years for the diameter classes of 20 to 50 cm to provide an adequate volume of mature timber in the second cut. It seems more likely that the TPTI system requires up to 60 and even 70 years before the new crop is ready for harvesting.
Forest Concession System
The Government of INDONESIA issues the concession license to the private sector on the basis of the legal Concession Agreement (HPH) which authorises the concessionaires to operate in a defined forest area. The conditions of the present concession system are based on the first concession license, issued in 1969, which was granted for a period of 20 years and, therefore, have reached the stage of consideration for renewal. This concession system was introduced with the intention that the concessionaires act as the responsible agent for a proper management of the forest. However, this view now appears to have been too optimistic because some key activities, such as reforestation and strict observance of the annual limitations with regard to the number and extent of harvestable concession blocks has not been satisfactory until now. Moreover, due to the fact that some concessionaires did not adequately observe the prescriptions regarding forest management and other aspects, the Government of INDONESIA had to introduce fines against them, including revoking of concessions.
In case of approval for issuing the concession license by the Ministry of Forestry, the concession holder has to observe regulation with regard to:
• the estimation of growing stock and allowable cut, • the preparation of management maps, • the construction of roads, • logging specifications (tree species and sizes),
14

• post logging operations, • fire protection, • boundary maintenance, and • reforestation.
It is the task of the public forestry sector to supervise the forest concessions and to control the enforcement of concession regulations. The Government renews the concession licenses and, if necessary, imposes also sanctions to concessionaires such as:
• suspension of timber harvesting for a fixed period of time, • reduction of the production target or production area in the forest concession, • imposing of fines, and • revocation of the concession license.
At present, the Ministry of Forestry is reviewing and improving the concession system and forest management system with the assistance of the World Bank.
Forest Revenue System
At present, the forest revenues are composed of the following charges: • license fee (per ha), • land and building tax (per ha), • reforestation fees (per m3
),
• royalty (per m\ • grading fees (per ton), • sawn timber export tax (per m\
Among these charges, the major revenue sources are royalty and reforestation fee. The royalty for timber is 6 % of the timber price, set by the Ministry of Forestry. Until 1990, the royalty was collected for an estimated timber volume, based on the output of processed products under the assumption of a definite conversion factor. However, since August 1990, a new calculation system of timber royalty has been introduced which is based on the size of the log in the mill's logyard. The new calculation system shall encourage the wood processing industry to improve the efficiency of wood processing and to raise the recovery of value added products.
The revenue system, up to now, does not include any charge for environmental costs.
Forest Plantations
There are three types of plantations in INDONESIA with a total area of about 9 million ha of which:
• 2.1 million ha are plantations for industrial timber production, of which Teak plantations, mostly located in MIDDLE and EAST JAVA, cover an area of about 0.9 million ha. The first Teak plantations have success fully been established in 1880.
• 1.2 million ha are plantations with fast growing species, such as Eucalyptus spp., Acacia mangium, Paraserianthes falcataria, Gmelina arborea, and Shorea spp.
• 1.2 million ha are plantations inside the forest as conservation measures for the rehabilitation of forest land, and about
15

• 5.8 million ha of re-greening plantations with the participation of the rural communities in order to rehabilitate agricultural land and water-sheds outside forest areas.
Concession Rights for Industrial Timber
With the 4th Five Year Economic Programme for INDONESIA (Repelita IV), the INDONESIAN Government strongly supports the conversion of about 4.4 million ha of unproductive land into productive industrial plantations. For this purpose, the Ministry of Forestry has projected a special plantation programme under the umbrella of the Concession Rights for Industrial Timber Estate (HPHTI-Programme).
The objectives of the HPHTI-Programme are: • provision of employment for inhabitants of rural communities, • protection of natural forests by reducing the need to exploit this resource for the
supply of subsidiary industrial timber, and • establishment of bLiffer zones around reserves, conservation forests, and other
parts of permanent forest estates.
The HPHTI-plantation programme of industrial timber has been carried out by concession holders, state enterprises, provincial forestry service, and private companies based on a contract for a specific establishment. The projected areas of those industrial forest plantations are given in Table 1-8.
Items 1990 1995 2020 2030
Area of HPHTI plantations [million ha] 1.4 1.8 ? 10.5
Percentage of pulpwood trees 30 35 40 20
Percentage of industrial timber trees 70 65 60 80 . -
------~-.-
1.3.3 Forest Resources
Roundwood Production
The tree species for roundwoqd production in INDONESIA can be divided into two main groups:
• the Dipterocarps group (Shorea spp., Oryobalanops spp., etc.), and
• the Non-Dipterocarps group (Gonystylus bancanus, Alstonia scholaris, Tectona grandis, Pinus spp., etc.).
Table 1-9 shows the log production in the fiscal year 1989/90 of INDONESIA and of the Province EAST KALlMANTAN as well as the average annual log production within the period from 1972 to 1990. Moreover, data for the years with the highest and lowest log production are given in Table 1-9.
16

Log production INDONESIA EAST KALlMANTAN
In the fiscal year 1989/90 21.9 6.3
Average of the period 20.3 6.4 from 1972 to 1990
Maximum production (year) 27.6 (in 1987/88) 10.2 (in 1978)
Minimum production (year) 14.6 (in 1985/86) 3.1 (in 1981)
The drastic decrease of log production in 1981 and 1985 is related to the imposition of the restriction on log export in the early 1980s, followed by the complete ban of log exports in 1985. According to the official statistics of the Ministry of Forestry, given in Table 1-10, the volume of exported logs decreased rapidly from 1980 to 1984.
Year Log exports [million m3]
1980 14.9
1981 6.4
1982 3.1
1983 3.0
1984 1.6
The annual log production between 1981 and 1985 was almost as low as 15 million m3. In the
following years, the log production increased again due to the expansion of the production capacity in the wood processing industry. Accordingly, the highest production figures are recorded in the fiscal years 1987/88 with 27.6 million m3 and 1988/89 with 26.4 million m3
,
respectively.
In the fiscal year 1989/90, there was a considerable change of the Government's policy concerning the export of sawn timber. Based on a new law, the export of sawn timber was subject to an additional export tax varying from 250 US $ to 2500 US $ per m3
, depending on timber species. Consequently, the log production in 1989/90 decreased toa volume of 21.9 million m3
,
which is a reduction of approximately 4.5 million m3 compared with the log production in 1988/89.
Utilisation of Logging Residues
The utilisation of logging residues in INDONESIA differs considerably depending on the locality. On the densely populated ISLAND OF JAVA, the clean bole of teak trees is utilised as raw material for the furniture industry, whereas the remaining parts, such as branches, are used as firewood and for charcoal production. On the outer Islands of INDONESIA, however, such an efficient use of wood and logging residues does not exist. Even people living in the vicinity of natural forests do not use residues generated by logging operations. In KALlMANTAN, for example, there is sufficient firewood available around the settlement areas of relatively low population density with the result that no demand for logging residues exists. A further detrimental factor for an utilisation of logging residues are the high costs which the transportation of logging residues from remote logging sites to the residential areas require.
17
1.3.4. External Factors Influencing the Forestry Sector
The external factors which have considerable influences on the forestry sector are: • establishment of residential areas, • transmigration projects, • shifting cultivation practices in agriculture, • plantations, and • mining exploration.
On JAVA, the dominating external factors are of socio-economic character. In comparison with the other large islands like SUMATRA, KALlMANTAN, SULAWESI, and IRIAN JAYA, JAVA is an extremely dense populated island, giving homeland to more than 110 million people. Thus, the standard of living of JAVANESES people is influenced by the severe pressure of small land holdings in agriculture and the very high competition on job opportunities. This situation often leads to land robbery and illegal occupation of forest land and forces the Government to countermeasures such as re-vegetation of bare land and extension of transmigration programmes. The latter one has to some extent transferred the socio-economic and ecological problems to the outer islands. Therefore, the socio-economic and ecological aspects have to be taken into consideration by the forestry sector in order to achieve the goal of ITTO regarding the sustainable management of tropical rainforests.
1.4. MALAYSIA
1.4.1. Forests in SARAWAK I MALAYSIA
Land laws
In the constitution of MALAYSIA, land is a matter of the State and, therefore, the legislative and executive authority over the forests is the State. In MALAYSIA, the Federal Government has installed a special National Land Council (NLC) consisting of a Minister or Governor as the ruler and a maximum of 10 representatives appointed by the Federal Government.
It is the task of the National Land Council to formulate the National policy for the promotion and control of the utilisation of land throughout the Federation in mining, agriculture, forestry or for any other purposes. In this context, the NLC co-operates closely with the Federal Government, the State Governments and the National Finance Council.
For the forestry sector specifically, the National Land Council has established the National Forestry Council which has the duty to guarantee:
• a co-ordinated and common approach to forestry, • an effective forest management, and • an efficient utilisation of forest resources, ensuring that forests will be maintained as a
long-term renewable resources with protective functions to the environment.
The forests of the State of SARAWAK belong to the State Government of which the State Ministry of Forestry is responsible for regulations regarding the utilisation of tropical forests including the granting of concession licenses.
18

Forest Types and Forest Classes in SARAWAK
The natural forests of the State of SARAWAK amount to about 8.7 million ha, covering about 70 % of SARAWAK's total land area of about 12 million ha (Table 1-11). The main forest classes are:
• production forests, • protection forests, and • State land forests.
Area [million ha]
Forest Classes Forest types Total Area
Hill Mixed Peat Swamp Forest Mangrove Forest [million ha] Dipterocarp Forest
Production Forest 5.0 1.0 0.06 6.0 officially announced 3.7 0.8 0.04 4.5 proposed for constitution 1.3 0.2 0.02 1.5
Protection Forest 1.0 0.02 0.02 1.0 officially announced 0.3 0.01 - 0.3 proposed for constitution 0.7 0.01 0.02 0.7
State Land Forest 1.3 0.3 0.1 1.7
About 6 million ha of the natural forests are allocated· to the Production Forests as Permanent Forest Estate, these are forests designated for the sustainable production of timber and nonwood products. Out of these 6 million ha, 4.5 million ha have already been officially announced as Production Forests under the Forest Regulations, whereas the remainder of 1.5 million ha is proposed for installation.
The State land forest covers an area of about 1.7 million ha. These forest areas are partly used for planned agricultural plantations and for other land developments, and partly for timber production.
The major forest types in the State SARAWAK are: • Hill Mixed Dipterocarp Forest (HMDF), • Peat Swamp Forest (PSF), and • Mangrove Forest (MF).
The Hill Mixed Dipterocarp Forest and the Peat Swamp Forest are of special social and economic importance to the State of SARAWAK due to the harvesting of mature and over-mature trees.
Details about the forest classes and the different forest types are given in Table 1-11.
Forestry Conservation
. In SARAWAK, active forest conservation started as early as in the 1950's with the legislation of three enactments:
• the Forestry Ordinance legislated in 1954, • the National Parks Ordinance legislated in 1956, and • the Wildlife Protection Ordinance legislated in 1958.
19

With the existence of these ordinances, more than 1 million ha of primary forests were designated as Totally Protected Areas, the functions of which are the preservation of the natural genetic variety of flora and fauna and the recreation of the protected areas, and it may be mentioned that, at present, more than 20 plant species and 60 animal species are protected by law in SARAWAK. The Totally Protected Areas include National Parks, Wildlife Sanctuaries, Wildlife-Rehabilitation Centres, Marine Parks and Nature Reserves which have been established under the National Parks Ordinance.
Out of these 1 million ha of protected forests, a total of 290 000 ha have already officially been declared as protection forest while the remaining 740 000 ha proposed for this purpose are at various stages of preparation.
Furthermore, an area of about 580 000 ha within the permanent forest estate area is excluded from harvesting of trees due to the steep slopes of the terrain. These areas, therefore, will remain in the primary state as protection forests.
Economic and Social Aspects of Forestry
In 1991, the forestry sector contributed nearly 30 % of SARAWAK's Gross Domestic Product (GDP). The Government's revenues from several forms of royalty amounted to about 280 million US $ in 1992 which were mostly spent on projects related to socio-economic development of the State in its rural sector. About 80 000 persons are directly employed by the forestry sector, of which 85 % are local people from the rural areas, and other 150 000 peop,le are working in sectors which are directly related to the forestry sector. That means that the forestry sector provides direct and indirect employment to about 230 000 people which likewise correspond to about 30 % of the total amount of jobs in SARAWAK.
1.4.2. Forest Management
Forest Management Plan
The objectives of the forest management in the permanent forest estate are: • to optimise the utilisation of SARAWAK's forest resource, • to regulate timber harvesting on a sustained yield basis, • to remove timber in an orderly manner to minimise damage to the residual stand and
to the environment, and • to rehabilitate harvested forest areas in order to improve forest stocking of valuable
timber species by proper silvicultural techniques.
The forest management plan contains the description of the forest area concerned, the objectives of management as well as instructions and regulations about harvesting. These regulations are especially related to the cutting cycle, the limits of the minimum cutting diameter, and the annual allowable cut. The annual coupe, which 'is the area of harvesting of a management unit for any given year, is a very important parameter for the determination and control of the yield. Furthermore, the management plan outlines responsibilities and duties of the concession holder and defines the branches of the State Forest Department involved in the implementation of the regulations.
The rules prescribed for a proper management of tropical rainforests contain among others the following information:
20
• The cutting cycles in Hill Mixed Dipterocarp Forests and in the Peat, Swamp Forest are 25 and 45 years, respectively;
• In Hill Mixed Dipterocarp Forests, the minimum cutting diameter at breast height depends on the tree species; for Dipterocarp species a dbh of 60 cm is prescribed whereas the minimum cutting diameter of other tree species is set to 45 cm;
• In the Peat Swamp Forest the limits of the cutting diameter are also depending on the tree species; for Ramin (Gonystylus bancanus) the minimum dbh is 40 cm and for most other tree species it is 50 cm.
The Forest Management Plan is applied to long-term concessions in the Permanent Forest Estate which are usuaily granted for a period of 10 years with the possibility of prolongation. During the ten years period, the Forest Management Plan may be refined from time to time in order to
. incorporate new policy and ideas. After the ten years' period, the plan is normally revised before prolongation.
In the State Land Forest, smaller-sized concessions are granted as Forest Timber Licenses for a shorter term of one to five years, only. In these cases, the felling plan for short-term concessions differs from that of long-term concessions in the following points:
• No limits are given for the felling diameter because the concession area may quickly be used for other land developments after harvesting has finished, and
• the annual yield control is not specified in the felling plan.
Forest Engineering Plan
As a part of the forest management plan, the forest engineering plan has the objective to ensure well planned and carefully conducted harvesting operations in the Hill Mixed Dipterocarp Forest. In this context, the forest engineering plan also has the function to increase the efficiency of harvesting and to minimise damages to the residual stand and to the environment. Moreover, the forest engineering plan gives standards of logging roads and limitations of harvesting in areas with slopes of 60 % and greater.
In the planning stage, the concessionaires have to submit a general harvesting plan and a survey map with a the scale of 1 : 50 000 to the Forest Department. After the approval of the general plan, the harvesting operators start the operational stage of forest harvesting by commencing the general plan with the detailed planning of each individual coup.
Forest Harvesting
In the Permanent Forest Estate, the logging operations are based on the system of selective cutting which is adopted in the harvesting of both, the Hill Mixed Dipterocarp Forests and the Peat Swamp Forest. The principle of this selective cutting system is to remove selectively all the mature and over-mature trees in a single felling operation. The residual stand shall still contain a sufficient number of trees in the intermediate diameter classes to form the next crop. The limiting factors hereby are the minimum felling diameter at breast height and the cutting cycle.
Each of the following operational activities in harvesting has to be approved by the Forest Department. In the Hill Mixed Dipterocarp Forests, the operational activities have the following sequence:
1. demarcation and survey of the boundaries of the coupe, 2. preparation of a topographic map,
21
3. survey and alignment of the proposed forest roads on the ground, 4. start with the road construction as planned in the approved map,
demarcation and survey of the boundaries of logging blocks and enumeration of trees, and
5. felling and skidding of individual trees in approved blocks.
The operational activities in the Peat Swamp Forest have the following sequence: 1. demarcation and survey of the boundaries of the coupe,
clearing the forest aisles for the rail lines, 2. total enumeration of the annual coupe, 3. construction of rail lines, and 4. preparation of the sliding tracks (prepared by small roundwood sleepers), felling and
extraction of logs by the combined sliding and rail line system.
1.4.3. Forest Resources
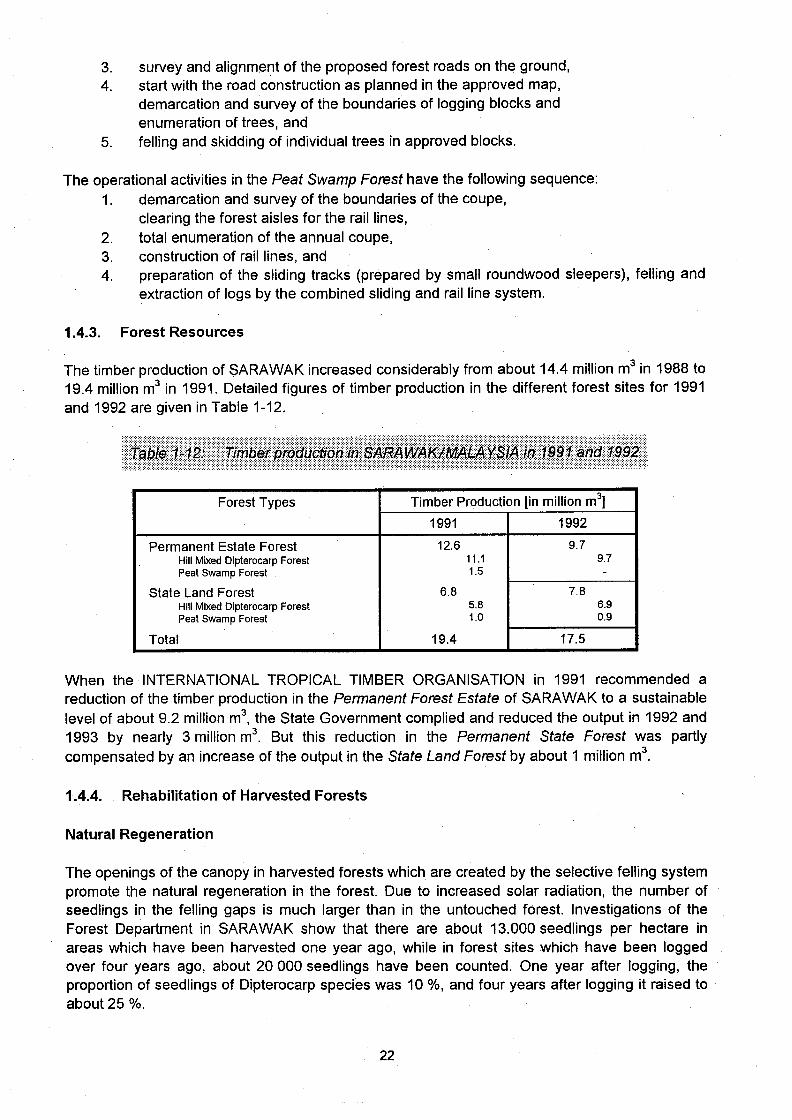
The timber production of SARAWAK increased considerably from about 14.4 million m3 in 1988 to 19.4 million m3 in 1991. Detailed figures of timber production in the different forest sites for 1991 and 1992 are given in Table 1-12.
Forest Types Timber Production [in million m3]
1991 1992
Permanent Estate Forest 12.6 9.7 Hill Mixed Dipterocarp Forest 11.1 9.7 Peat Swamp Forest 1.5 -
State Land Forest 6.8 7.8 Hill Mixed Dipterocarp Forest 5.8 6.9 Peat Swamp Forest 1.0 0.9
Total 19.4 17.5
When the INTERNATIONAL TROPICAL TIMBER ORGANISATION in 1991 recommended a reduction of the timber production in the Permanent Forest Estate of SARAWAK to a sustainable level of about 9.2 million m3
, the State Government complied and reduced the output in 1992 and 1993 by nearly 3 million m3
. But this reduction in the Permanent State Forest was partly compensated by an increase of the output in the State Land Forest by about 1 million m3
.
1.4.4. Rehabilitation of Harvested Forests
Natural Regeneration
The openings of the canopy in harvested forests which are created by the selective felling system promote the natural regeneration in the forest. Due to increased solar radiation, the number of seedlings in the felling gaps is much larger than in the untouched forest. Investigations of the Forest Department in SARAWAK show that there are about 13.000 seedlings per hectare in areas which have been harvested one year ago, while in forest sites which have been logged over four years ago, about 20 000 seedlings have been counted. One year after logging, the proportion of seedlings of Dipterocarp species was 10 %, and four years after logging it raised to about 25 %.
22

Silvicultural Treatments
The aim of silvicultural treatments is to obtain forest stands with sound, undamaged and wellformed trees of all native species and sizes. In the Peat Swamp Forest which contains valuable commercial tree species such as Ramin (Gonystylus bancanus), Meranti (Shorea spp.), Septir (Copaifera palustria) and Jongkong (Dactylocladus stenostachys) , the silvicultural treatment is characterised by a poison-girdling treatment of unsound, damaged and poor-formed trees with a diameter (dbh) of 30 cm and above one year after harvesting. Then, the treated forest is left to regenerate for a period of about 10 years, after which a diagnostic sampling is conducted in order to assess the silvicultural condition of the forest and to identify areas which may require further treatment to stimulate the development of the stand.
In the Hill Mixed Dipterocarp Forest, the silvicultural treatment normally consists of a liberation thinning if the costs of such a treatment can be kept at a reasonable level which, from the ecological and economic points of view, can be considered to be beneficial and profitable.
Fo~est Plantations and Agroforestry
In SARAWAK, plantations of fast growing species are only established in deforested areas. In the Permanent Forest Estate, about 120.000 ha have already been degraded by shifting cultivation, and it is planned by the State Government to reforest approximately 10 000 ha of these areas annually. Until 1992, only about 7 000 ha have been planted with Acacia mangium, Araucaria cunninghamii, Gmelina arborea, Swietenia macrophylla, and also some local species such as Engkabang (Shorea spp.) and Durian (Durio zibethinus).
The activities in agroforestry on deforested land areas have two objectives: • to provide employment to shifting cultivators by engaging them in various activities
related to plantation establishments, and • to emphasise the role of forestry in the rural community development.
23
2. REVIEW OF LITERATURE ON FOREST RESIDUES
In the tropics, the two main sources of wood residues are • the production forests where logging operations are carried out and • the wood processing industries.
The wood residues produced by other sources, such as carpentries, handicraft workshops, low cost housing in the rural areas, and other small scale enterprises, are mostly utilised as firewood by local inhabitants.
The forest residues, however, are widely distributed in remote. areas. They cannot be easily collected and utilised by the wood industry or by the people in the densely populated areas of the countries due to the long distances of transportation and high transportation costs.
Forest residues result from harvesting and logging operations, such as:
• road construction, • tree felling and tree cross-cutting, • skidding, • debarking and grading in the logyard.
Accordingly, the forest residues of harvesting and logging operations can be classified into:
• stumps of felled tree, • lower and upper sections of the tree trunk, and • branchwood of different quality and dimension, as well as • trees uprooted or damaged by felling and skidding.
Some wood residues may also be generated during transportation outside the forests, such as: • transportation of the logs by truck to the mills or to the export harbour, and • loading operations in the harbour.
Due to the relatively low efficiency in the wood processing industry in tropical countries, the mill residues make up a considerable part of the processed roundwood and could, therefore, also become a major source of raw material for further industrial processing.
2.1. Studies on Forest Residues in GHANA and CAMEROON
In Africa, logging residues have not attracted much attention of foresters and forest research institutions. With regard to the situation in GHANA, so far only a few studies are available for an evaluation, while the situation of CAMEROON is still worse. It is, therefore, recommended that new research programmes should be conducted in order to determine the quality and quantity of wood residues arising from silvicultural activities and harvesting operations. This research should also include recommendations concerning the reduction and utilisation of useful biomass left over in the forest. Concerning the necessity of those studies on the felling damage and logging residues, OTOO (1978) has expressed the following reasons:
• Felling residues reduce the profitability of harvesting and increase the costs of wood to the final consumer, and
• since the tropical high forests in GHANA are managed under a polycyclic system, it is necessary to get some factual data on the extent of felling damage
24
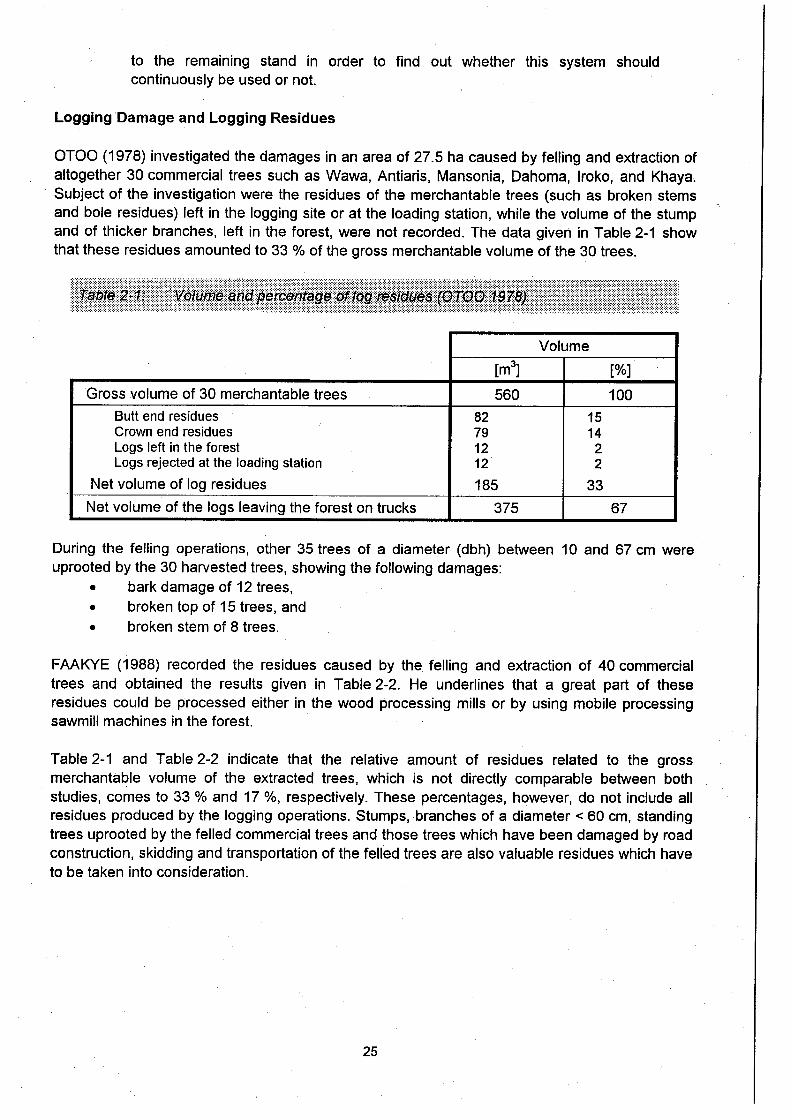
to the remaining stand in order to find out whether this system should continuously be used or not.
Logging Damage and Logging Residues
OTOO (1978) investigated the damages in an area of 27.5 ha caused by felling and extraction of altogether 30 commercial trees such as Wawa, Antiaris, Mansonia, Dahoma, Iroko, and Khaya. Subject of the investigation were the residues of the merchantable trees (such as broken stems and bole residues) left in the logging site or at the loading station, while the volume of the stump and of thicker branches, left in the forest, were not recorded. The data given in Table 2-1 show that these residues amounted to 33 % of the gross merchantable volume of the 30 trees.
Volume i
[m3] [%]
Gross volume of 30 merchantable trees 560 100 I
Butt end residues 82 15 Crown end residues 79 14 Logs left in the forest 12 2 Logs rejected at the loading station 12 2
Net volume of log residues 185 33
Net volume of the logs leaving the forest on trucks 375 67 - -_._.- -_ ..
During the felling operations, other 35 trees of a diameter (dbh) between 10 and 67 cm were uprooted by the 30 harvested trees, showing the following damages:
• bark damage of 12 trees, • broken top of 15 trees, and • broken stem of 8 trees.
FAAKYE (1988) recorded the residues caused by the felling and extraction of 40 commercial trees and obtained the results given in Table 2-2. He underlines that a great part of these residues could be processed either in the wood processing mills or by using mobile processing sawmill machines in the forest.
Table 2-1 and Table 2-2 indicate that the relative amount of residues related to the gross merchantable volume of the extracted trees, which is not directly comparable between both studies, comes to 33 % and 17 %, respectively. These percentages, however, do not include all residues produced by the logging operations. Stumps, branches of a diameter < 60 cm, standing trees uprooted by the felled commercial trees and those trees which have been damaged by road construction, skidding and transportation of the felled trees are also valuable residues which have to be taken into consideration.
25
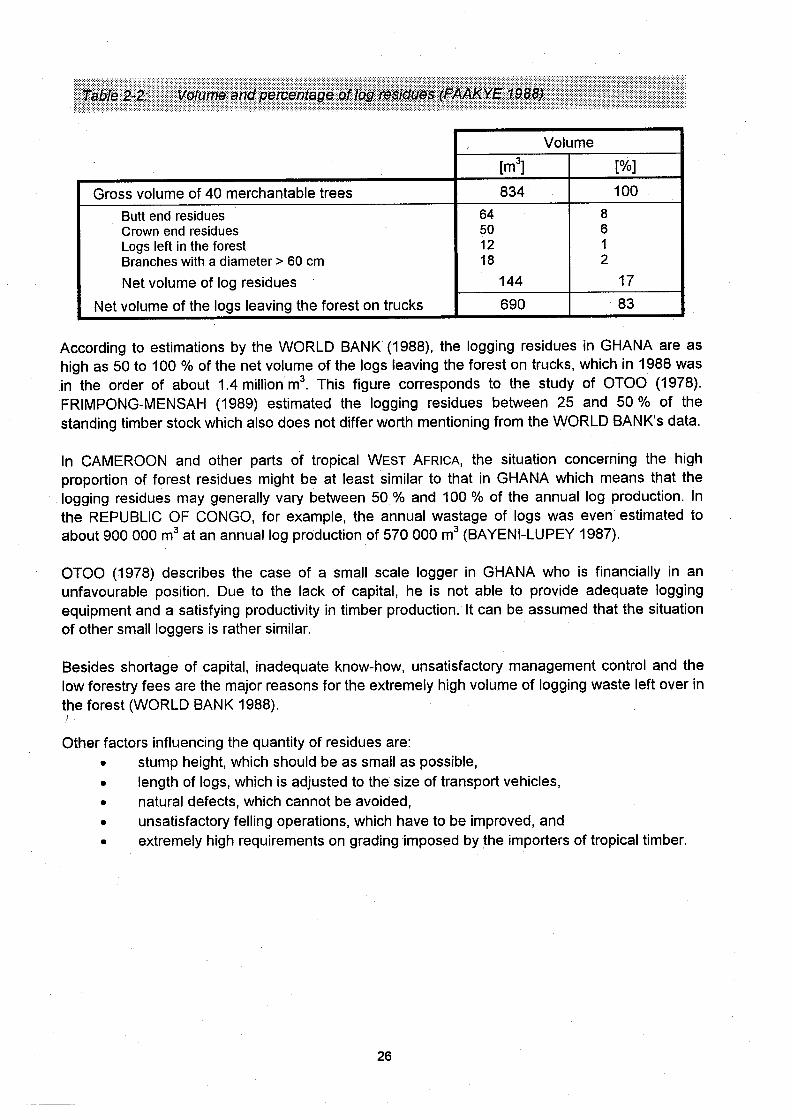
Volume
[m1 [%]
Gross volume of 40 merchantable trees 834 100
Butt end residues 64 8 Crown end residues 50 6 Logs left in the forest 12 1 Branches with a diameter> 60 cm 18 2
Net volume of log residues 144 17
Net volume of the logs leaving the forest on trucks 690 83
According to estimations by the WORLD BANK (1988), the logging residues in GHANA are as high as 50 to 100 % of the net volume of the logs leaving the forest on trucks, which in 1988 was .in the order of about 1.4 million m3
. This figure corresponds to the study of OTOO (1978). FRIMPONG-MENSAH (1989) estimated the logging residues between 25 and 50 % of the standing timber stock which also does not differ worth mentioning from the WORLD BANK's data.
In CAMEROON and other parts of tropical WEST AFRICA, the situation concerning the high proportion of forest residues might be at least similar to that in GHANA which means that the logging residues may generally vary between 50 % and 100 % of the annual log production. In the REPUBLIC OF CONGO, for example, the annual wastage of logs was even estimated to about 900 000 m3 at an annual log production of 570000 m3 (BAYENI-LUPEY 1987).
OTOO (1978) describes the case of a small scale logger in GHANA who is financially in an unfavourable position. Due to the lack of capital, he is not able to provide adequate logging equipment and a satisfying productivity in timber production. It can be assumed that the situation of other small loggers is rather similar.
Besides shortage of capital, inadequate know-how, unsatisfactory management control and the low forestry fees are the major reasons for the extremely high volume of logging waste left over in the forest (WORLD BANK 1988).
)
Other factors influencing the quantity of residues are: • stump height, which should be as small as possible, • length of logs, which is adjusted to the size of transport vehicles, • natural defects, which cannot be avoided, • unsatisfactory felling operations, which have to be improved, and • extremely high requirements on grading imposed by the importers of tropical timber.
26

2.2. Studies on Forest Residues in INDONESIA
The existing literature on forest residues in INDONESIA is mainly based on studies which have been carried out during the last 10 years.
In INDONESIA, forest residues are defined as pieces of wood with a diameter of more than 15 cm, generated by felling, skidding, and transportation as well as by road constructions and forest tending measures. They originate from the felled trees and from trees damaged or overthrown through the logging operations (Anonymous 1990). Studies conducted in different forest sites show different results which are obviously related to the methodology and measuring instruments, the forest site and the exploited tree species.
SAMPERAJA and SOENARSO (1981) carried out studies in 24 forest concessions distributed over 11 Provinces. They found that the amount of forest residues varies between 25 % and 48 % of the total log production. ABIDIN (quoted from SURJONO ET AL. 1987) reported that the mean volume of forest residues, excluding branches, amounted to about 30 % of the total harvested roundwood.
Concerning harvesting residues in EAST KALlMANTAN, the report of the Directorate General of Forest Utilisation (DGFU/Ministry of Forestry 1990) is of particular interest. A team of 20 researchers, supported actively by the concession holders, studied the volume of forest residues in 6 concession areas. In this study, the trees were classified into the four diameter classes: 15 to 29 cm, 30 to 44 cm, 45 to 59 cm, and above 60 cm, and it was distinguished between commercial and non-commercial tree species. From this study, the following conclusions can be drawn:
1. The volume of wood residues caused by logging operations amounts to about 91.5 m3/ha or 85 % of all wood residues.
2. The tending measures created wood residues with a volume of about 15.5 m3/ha or about 15 % of all forest residues.
3. The logging residues of 91.5 m3/ha consist of the following components: Residues of commercial trees:
stump: 3.6 m3/ha cut-ofts of the bole: 14.9 m3/ha stem section above the first branch: 10.1 m3/ha branches: 8.7 m3/ha trees overthrown or broken by skidding: 5.2 m3/ha damages due to felling operations: 9.2 m3/ha economically and technically useless trees: 27.4 m3/ha
Residues from non-commercial trees: trees overthrown or broken by skidding: 4.3 m3/ha trees overthrown or broken by road construction: 2.8 m3/ha other residues: 5.3 m3/ha
27

Another, less extensive study performed in the RIAU PROVINCE OF S.UMA TRA ISLAND leads to the following results (Anonymous 1992):·
Skidding damages: 4.4 trees/ha, Skidding residues: 2.9 m3/ha, Road construction damage per 1 km forest road: 30 trees/ha, Road construction residues per 1 km forest road: 33.3 m3/ha, Felled trees: 4.2 trees/ha, Standing trees, damaged by felling: Felling residues: Residues caused by natural defects: Residues related to topographic conditions of the site: Residues caused by natural defects: Residues caused by technical/economic reasons:
Figures, such as: • number and percentage of commercial trees per ha, • standing stock in m3/ha, • volume of useful stem in m3/ha,
5.1 m3/ha, 2.4 m3/ha 2.2 m3/ha 2.4 m3/ha 1.1 m3/ha
• diameter at breast height (dbh) of commercial trees in cm, • clean bole length in m, • stump height in m and stump volume in m3/ha, • volume of upper stem section in m3/ha, and • volume of branchwood in m3/ha
6.7 trees/ha,
has been subject of a research programme conducted by RADTKE (1990) in the ITCI-Concession area in EAST KALlMANTAN. He also determined the damages resulting from the felling of 70 commercial trees. The main results of this research programme are given in Tables 2-3 to 2-7 and may be summarised as follows:
• About 70 % of all commercial timbers belong to the Meranti group, • the mean standing stock in the study area of 25 ha amounted to 111 m3/ha, • the largest stem volume per tree [m3/tree] was found for Bangkirai
trees (Shorea laev;folia), the smallest one for the other nonDipterocarp hardwoods (mixed light hardwoods - MLH), thus the mean diameter dbh of the harvestable Bangkirai trees was 90 cm and that of the mixed light hardwoods only 58 cm,
• the maximum length of. the stem (to the bottom branch of the crown) of 22 m was measured for the Dipterocarp species Yellow Merant and Keruing,
• the number of harvestable commercial trees in the study area of 25 ha was 508, which means 20 trees/ha, out of which 215 trees (or 8.6 trees/ha) have been exploited.
• Among the Meranti group, the White Merantis dominated with 29.3 m3/ha. • Out of the 215 harvested trees, 70 trees which were taken from a cutting area of
8.4 ha, have been studied in detail (see Table 2-3).
28

Timber Red White Yellow Keruing Bangkirai Mixed Light Totall Meranti Meranti Meranti Hardwoods Average Number of trees 17 28 7 2 12 4 70 Total volume of the tree [m
3/tree] 16.4 12.4 15.15 24.8 20.3 12.1 15.4
standard deviation of tree volume [m3Itree] 6.8 6.4 7.0 11.7 9.6 4.8 8.0 Total timber volume per ha [m%a] 38.7 51.7 3.0 2.0 27.6 5.3 128.3 Total residues per tree [m3
/tree] 6.6 4.3 9.3 10.3 9.9 5.6 6.6 standard deviation of residues [m3/tree] 4.3 2.5 6.3 4.5 6.9 4.8 4.8
Total residues per ha [m%a] 15.7 18.4 1.9 0.8 13.4 2.4 52.6 Residues of sawn timber quality [m3ltree) 2.6 2.5 3.3 4.8 4.8 1.8 3.0 Residues of sawn timber quality [m 3/ha] 6.0 10.5 0.7 0.4 6.6 0.8 24.9
Total log volume per tree [m 3/tree] 9.8 8.1 5.9 14.5 10.4 6.5 8.8
Total log volume per ha [m%a] 23.0 33.3 1.1 1.2 14.2 2.9 75.7 I stump height [m] 1.3 0.9 1.1 1.5 1.2 1.2 1.1 ,
Stump volume [mJ/tree] 0.7 0.3 1.8 0.9 1.1 0.7 0.7 Residues 4.6 2.7 5.7 3.0 4.6 2.9 3.8 Volume of upper part of the stem [m3/tree]
Volume of upper part of the stem [m%a] 10.8 11.4 1.1 0.2 6.2 1.3 31.0 Residues convertible into sawn timber 2.5 2.2 3.1 1.6 3.3 1.6 2.5 [mJ/tree]
Residues convertible into sawn timber [mJ/ha] 5.9 9.4 0.6 0.1 4.5 0.7 21.2 Residues convertible into industrial wood of good quality [m 3/tree] 0.7 0.5 0.4 1.4 1.2 0.8 0.7 Residues convertible into industrial wood of good quality [mJ/ha] 1.6 1.9 0.1 0.1 1.6 0.4 5.7 Residues convertible into industrial wood of low quality [m3/tree] 1.4 - 2.2 - - 0.1 0.6 Residues convertible into industrial wood of low quality [m 3/ha] 3.3 0.1 0.4 - 0.1 0.2 4.1
Branchwood 1.4 1.4 1.9 6.4 4.2 1.9 2.1 Volume of branches per tree [m
3/tree] 3.2 5.9 0.4 0.6 5.7 0.9 16.7 Volume of branches per ha [m3/ha]
Branchwood convertible into sawn timber 0.1 0.3 0.2 3.2 1.5 0.2 0.5 [m3/tree]
Branchwood convertible into sawn timber 0.1 1.1 - 0.3 2.1 0.1 3.7 [m%a]
Branchwood convertible into industrial wood 1.1 1.0 1.6 2.5 2.3 1.5 1.3 of good quality [m3/tree] Branchwood convertible into industrial wood, 2.7 4.2 0.3 0.2 3.1 0.7 11.2 of good quality [m3/ha]
Branchwood convertible into industrial wood 0.2 0.1 0.1 0.6 0.4 0.3 0.2 of low quality [m 3/tree] Branchwood convertible into industrial wood 0.4 0.6 - 0.1 0.5 0.1 1.7 of low quality [m3/ha]
Buttress
Number of trees with buttress 11 6 3 1 5 3 29 Height of buttress [m] 2.3 1.9 2.1 1.5 3.9 3.6 2.6 -- ------ - --- - -- -
__ L...

•
•
• •
•
According to the study by RADTKE (1990), the total log production
amounted to the volume of wood related to the whole tree was on average:
with lowest and highest values of 4.0 and 44.5 m3/tree, respectively. The
mean value for mixed light hardwoods was and that of
Bangkirai was as high as showing the large standard deviation of all
values. The total volume of wood of all 70 trees harvested corresponds to:
from which the volume of residues was on average:
which corresponds to a volume of residues per hectare of about:
the minimum value of White Meranti was
and a maximum value for Keruing was
Ofthese residues was of sawn timber quality a total volume of:
with a minimum value for mixed light hardwoods of:
and a maximum value for Keruing and Bangkarai of:
Timber Red White Yellow Keruing Bangkirai
Meranti Meranti Meranti
Number of trees 8 20 5 3 5
Mean height of the trees [m] 56 44 51 56 58
Mean radius of the crown [m] 17 12 12 16 19
Total residues per tree [m3/tree] 3.7 1.6 0.9 4.0 5.3
Total residues per hectare [m%a] B.7 6.5 0.2 0.3 7.1
Residues of sawn timber quality [m 3/tree) 1.1 0.3 - 1.0 1.0
Residues of sawn timber quality [m%a] 2.6 1.2 - 0.1 1.3
Residues of industrial wood quality
[m3/tree] 2.6 1.3 0.9 3.0 4.3
Residues of industrial wood quality
[m3/ha) 6.1 5.3 0.2 0.2 5.B
Mixed Light Hardwoods
3
50
15
2.4
1.0
0.3
0.1
2.0
0.9
3 75.7 m Iha,
15.4 m3/tree,
12.1 m3/tree, 24.8 m3/tree,
128.3 m3/ha,
6.6 m3/tree, 52.6 m3/ha,
4.3 m3/tree 10.2 m3/tree.
24.9 m3/ha, 1.8 m3/tree
4.8 m3/tree.
Totall Average
44
50
14
2.5
23.8
0.5
5.3
2.0
18.5
• The damages to the stand, caused by exploitation, are uprooted trees, broken tree trunks,
and/or severe damages of the crown. In a separate study of the damages caused by felling
of 44 commercial trees (see Table 2-4), RADTKE (1990) counted 152 trees with a diameter
at breast height of 20 cm and above which were destroyed completely.
The main reasons for the relatively large volume of forest residues are:
• The height of the stump increases with increasing length of the tree.
• The length of the logs has to be adjusted to the size of the transport vehicles used and,
therefore, it does usually not meet the requirements of the wood processing industries.
30

• Felling and skidding damages are unavoidable, but they can be reduced by technical measures.
• Natural defects contribute to an increase of the forest residues.
• The INDONESIAN selective cutting system only allows the removal of roundwood with a diameter at breast height of 50 cm and above. The removal of roundwood residues with a diameter below 50 cm, therefore, requires special permission causing severe administrative obstacles.
• In general, the felling operations are not satisfactory. The chain-saw operator often works as a subcontractor who eagerly tries. to cut as much as possible. For him, the quality of the logs is less important than the quantity (RUSLlM 1992).\
• The dimension and the form of the tree influence the felling direction considerably. Since the crown of Dipterocarp species is often asymmetrical and its centre of gravity is directed slope downwards, the fellers are often not able to adjust the felling direction by using the traditional felling techniques. Hence, the damages to the felled trees as well as to trees standing in the surroundings are high (RUSLlM 1992).
• Due to uncertainties of the felling direction, the skidding distances increase, causing more damage to the remaining commercial and non-commercial trees as well as to other vegetation (RUSLlM 1992).
• The skidding and transport workers are also paid by contract on a quantity basis, where one skidding team transports about 12 to 15 trees or 70 to 100 m3 per day. This procedure also leads to an intensive use of main and secondary skidding roads, causing high stand and soil damages (RUSLlM 1992).
Environmental Damages
Besides the considerable loss of raw material in the form of forest residues, improper logging operations may negatively influence the forest site by soil erosion and destroying of fauna and flora. In order to illustrate these damages of vegetation, AHRENHOLZ (1991) determined the areas of frequented skidding roads, turning cycles, and widenings. He found that the ratio of damaged area to the total area varies from 30 % to 50 %, and that each removed tree causes a frequented road area of about 233 m2 which corresponds to 17 to 36 m2 per m3 log volume extracted from the forest.
2.3. Studies on Forest Residues in SA RAWA K I MALAYSIA
In MALAYSIA, the main areas of tropical rainforest are located in the Eastern States of SARAWAK and SABAH, where the log production and log export are important sectors of the National economy.
2.3.1. Forest Residues
Concerning the management of tropical rainforest and the large amount of forest residues, MALAYSIA has similar problems as INDONESIA. According to BRUENIG (1991), the rapid expansion of exploitation of Mixed Dipterocarp Forest has exceeded the technological and
31

administrative capacities of the Forest Department with - among other problems - the result of a
production of excessive residues of merchantable timbers. Also with regard to MALAYSIA, the
available literature about logging residues is rather limited and essentially based on studies which
have been carried out by FOX (1968), MANGGIL (1980), KORSGAARD (1985), CHIEW (1988),
and EISENMANN (1991).
In a test area of 16 hectares located in a heavily logged forest in SABAH I MALAYSIA, FOX
(1968) studied the proportion of various categories of damage and obtained the results given in
Table 2-5.
Category Percentage
Totally damaged trees: fallen or broken off 53.5
bark damage 9.8
crown damage 3.1 66.4
Minor crown damage 10.8
Undamaged trees 22.8 33.6
Total 100.0 100.0
According to the investigation by FOX (1968), the number of trees with minor or no damage per
acre (0.405 ha) could be reduced from 17 to only 6. With regard to the natural regeneration, 43 %
of the area was unstocked due to damage on skidding and tractor paths and forest roads, while
other 32 % were destroyed due to fallen trees, debris, etc.
MANGGIL (1980) estimated the quantity of forest residues produced from logging in three
different concessions located in the Hill Mixed Dipterocarp Forest in SARAWAK/MALAYSIA. The
study areas were blocks of a size of 60 to 100 ha, located in three different terrain classes (T1,
T2, and T3). Under these conditions, MANGGIL (1980) obtained the following results:
• The average volume of extracted timber in the different study areas varied considerably from
63.6 m3/ha for terrain class T1 to 40.4 m3/ha and as low as 27.6 m3/ha for the terrain classes
T2 and T3, respectively. The intensity of timber harvesting was not only affected by the terrain
conditions, but also by factors such as log size and grade, buyers specifications, shipping
facilities, and quality and composition of the forest.
• As shown in Table 2-6, the volume of forest residues was different in the different terrain
classes and ranged from about 24 m3/ha to 38 m3/ha.
• The Dipterocarp species Meranti (Shorea and Pentacme spp.), Keruing (Dipterocarpus
grandiflorus), and Kapur (Dryobalanops lanceolata) made up about 75 % of the total amount of \ '
trees felled and extracted.
• Most logging enterprises extracted only export grade logs of certain species and sizes, as
specified by the overseas buyers. Because of the high quality standards, a big volume of
merchantable timber and even logs with minor defects, such as little heart rot/decay, small
knots, and slightly bent shape, were left unremoved in the forest.
32
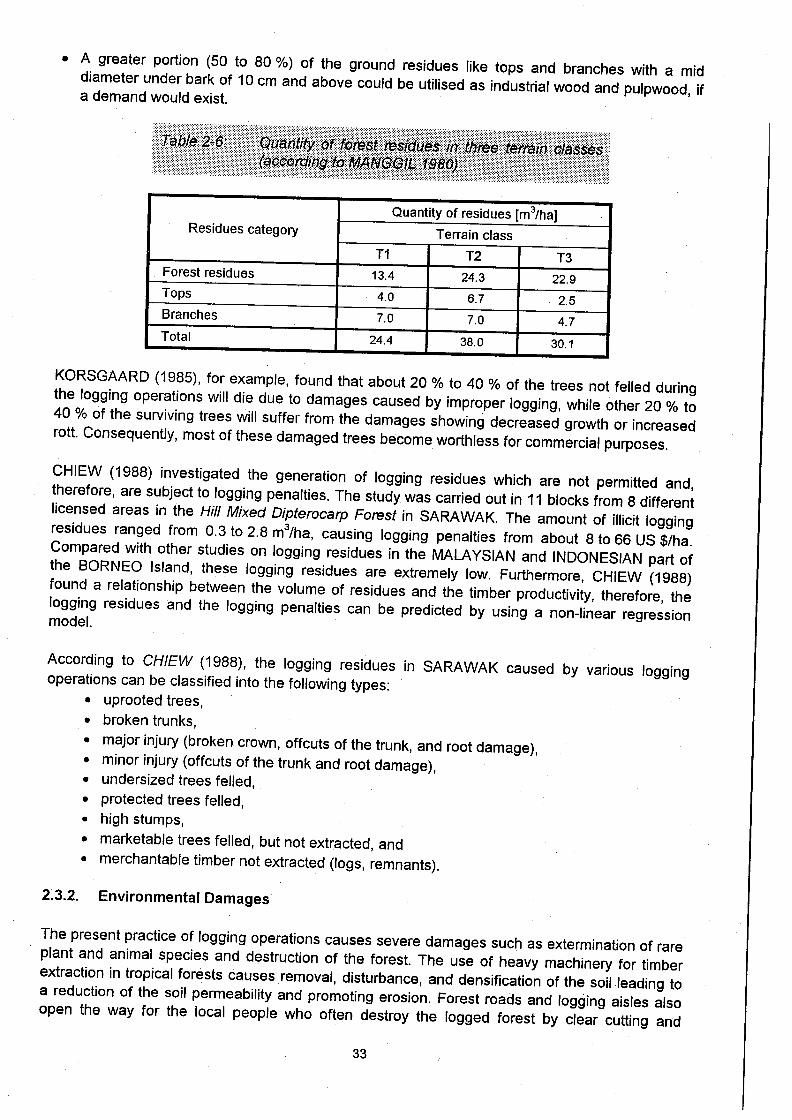
• A greater portion (50 to 80 %) of the ground residues like tops and branches with a mid diameter under bark of 10 cm and above could be utilised as industrial wood and pulpwood, if a demand would exist.
Quantity of residues [m 3/ha] Residues category Terrain class
T1 T2 T3 Forest residues 13.4 24.3 22.9 Tops 4.0 6.7 2.5 Branches 7.0 7.0 4.7 Total 24.4 38.0 30.1
KORSGAARD (1985), for example, found that about 20 % to 40 % of the trees not felled during the logging operations will die due to damages caused by improper logging, while other 20 % to 40 % of the surviving trees will suffer from the damages showing decreased growth or increased rott. Consequently, most of these damaged trees become worthless for commercial purposes.
CHIEW (1988) investigated the generation of logging residues which are not permitted and, therefore, are subject to logging penalties. The study was carried out in 11 blocks from 8 different licensed areas in the Hill Mixed Dipterocarp Forest in SARAWAK. The amount of illicit logging residues ranged from 0.3 to 2.8 m3/ha, causing logging penalties from about 8 to 66 US $/ha. Compared with other stUdies on logging residues in the MALA YSIAN and INDONESIAN part of the BORNEO Island, these logging residues are extremely low. Furthermore, CHIEW (1988) found a relationship between the volume of residues and the timber productivity, therefore, the logging residues and the logging penalties can be predicted by using a non-linear regression model.
According to CHIEW (1988), the logging residues in SARAWAK caused by various logging operations can be classified into the following types:
• uprooted trees, • broken trunks, • major injury (broken crown, offcuts of the trunk, and root damage), • minor injury (offcuts of the trunk and root damage), • undersized trees felled, • protected trees felled, • high stumps, • marketable trees felled, but not extracted, and • merchantable timber not extracted (logs, remnants).
2.3.2. Environmental Damages
The present practice of logging operations causes severe damages such as extermination of rare plant and animal species and destruction of the forest. The use of heavy machinery for timber extraction in tropical forests causes removal, disturbance, and densification of the soil leading to a reduction of the soil permeability and promoting erosion. Forest roads and logging aisles also open the way for the local people who often destroy the logged forest by clear cutting and
33

open the way for the local people who often destroy the logged forest by clear cutting and
burning in order to gain farmland. MALMER and GRIP (1991) discovered that about 24 % of the
overall logging area was affected by new tractor trails which lead to a removal of the upper most
soil layers, whereas the coverage of the manual skid rails was only about 4 %.
Unprotected logged forests can also facilitate other illegal activities, such as hunting of game and
trade with protected plant and animal species. These illegal activities are the reason why the
habitat of many species have already disappeared or were reduced to inaccessible forest sites.
2.3.3. Reasons for the Large Amount of Forest Residues
Considerable quantities of forest residues are left in the Dipterocarp Forest of SARAWAK and
SABAH. The authors of the above mentioned studies describe the reasons for this unfavourable
situation as follows:
1. Generally, about 45 % ofthe timber cut during logging is left unused in the rainforest.
2. About 50 to 60 % of the residual stock is damaged due to inappropriate felling and
skidding methods.
3. Poor harvesting technology and unfair grading and trading practices have detrimental
consequences to the country.
4. Insects and fungal decay considerably increase the quantity of defective timber.
5. The fellers are usually paid on a quantity basis. Therefore, their main interest is
related to the output and not to a minimisation of damage. Consequently, they leave
plenty of merchantable wood estimated to 4 to 12 % of the residual volume
unextracted in the logged forest. Another disadvantage with regard to a reduction of
damages to the residual stand is the fact that there is practically no formal training of
fellers and tractor drivers.
6. The marketing of small-sized timber and of uncommon and up to now non-commercial
wood species is difficult.
With regard to a considerable reduction of forest residues, the following recommendations should
be observed:
1. FOX (1968) is of the opinion that the forest damages may be reduced by:
- climber cutting prior to logging to facilitate directional felling,
- closer attention to the extent and direction of tractor paths, and
- marking of trees prior to felling.
2. With regard to factors influencing the output of commercial timber, FOX further
recommends to cut the trees at low heights (2 to 4 feet from the ground) in order to
reduce damages, such as shatter, splitting, broken logs, and torn bases.
3. KORSGAARD (1985) demonstrated in his experiments that efforts which are made in
proper planning and careful conduction of harvesting operations pay back quickly by a
more efficient utilisation of manpower and equipment, and by a significant reduction of
forest residues. Due to these improvements, it was possible to reduce:
34

- the skidding costs by 25 %, - the area occupied by skidding rails by 22 %, - the area of temporary open space by 44 %, - the amount of damaged commercial trees by 33 %, - the volume of sound felled timber, accidentally left in the forest, by 48 %, and - the cost per m3 extracted logs by 26 %.
Another advantage of these harvesting improvements was the increase of the productivity in m3 per hour by 36 %.
2.4. Conclusions Related to the General Situation of the Forestry in Tropical Countries
With regard to the situation of the forestry sector in the four tropical countries concerned, it can be stated that the forest residues, generated by harvesting operations, have only been subject of limited systematic investigations. The results of existing studies are limited to small areas and are not directly comparable. Therefore, comprehensive studies under comparable conditions are necessary to get qualitative and quantitative data on forest residues produced by logging activities to find out possibilities of an utilisation of these forest residues. A reduction of forest residues by improved logging techniques and by a better utilisation of the felled trees could reduce the pressure on the tropical forests. Furthermore, it could create more employment in the local wood industry. Moreover, the downstream wood processing based on roundwood and mill residues as raw materials may lead to more creativity and- innovation in the tropical countries.
The objectives of those comprehensive studies are:
• forest inventories to characterise the forest stand with regard to tree species, stand density, stand volume, and sustainable growth,
• intensive studies on tree felling and logging in typical forest sites to determine the log production and the amount of forest residues,
• determination of the extent of felling and skidding damages, such as gap opening, area of skidding trails and forest roads, damage to the forest floor, and damage to residual trees,
• determination of the proportions and the intensity of utilisation of main components of the felled trees, such as crown, bole and stump.
These investigations will result in recommendations for:
• a reduction of felling and skidding damages to the residual stand and to the forest floor, and
• an improved utilisation for forest residues.
35

3. METHODOLOGY OF THE FOREST STUDIES
In order to achieve the objectives of the comprehensive forest studies mentioned in chapter 2.4.,
investigations were carried out in selected forest areas of GHANA, CAMEROON, EAST
KALlMANTANI INDONESIA, and SARAWAKI MALAYSIA. The methodology employed in these
studies should be as similar as possible in order to obtain comparable results. Therefore, it was
necessary to develop a common methodology on the basis of a pilot study which was conducted
at the beginning of the project in the NKRABIA FOREST RESERVE in GHANA. The objectives of
the pilot study were:
• to develop a precise and practical method to determine wood ~esidues as well as felling and
skidding damages which is independent of local circumstances in all countries and ecological
zones concerned,
• to measure the proportion of crown, bole, and stump of selected trees extracted from one plot,
• to derive recommendations for possible uses of crown, bole, and stump residues,
• to measure the extent of felling and skidding damages to the forest floor in one plot, and
• to determine the number of trees damaged by felling and skidding.
Due to the differences in topography, vegetation type, tree density, volume of standing stock,
felling intensity, and logging machinery between the four countries, the methodology was slightly
modified in order to achieve an appropriate application in each country.
The results of the pilot study in GHANA are given in detail in Appendix 2, therefore, only the most
important aspects are summarised in chapter 3.1.
3.1. Pilot Study in GHANA
3.1.1. Description of the Study Site
The NKRABIA Forest Reserve is situated about 100 km south of Kumasi and covers an area of
approximately 10 100 ha consisting of 9 600 ha production forest, almost 500 ha protection
forest, and about 40 ha farmland. The terrain is undulated to hilly and generally ranges between
120 and 150 m above sea level. The highest point is located in the south-eastern part with a
height of 411 m above sea level. The Nkrabia Forest Reserve lies within the transition area
between the Moist Evergreen and the Moist Semi-Deciduous Forest Type and is dominated by
tall trees with heights up to about 50 m. Regarding the forest structure, the NKRABIA Forest
shows three distinct stories, the upper and middle ones are open while the lower canopy is rather
close.
The NKRABIA Forest Reserve is, in general, a young secondary forest type. The traditionally
valuable timber trees have already been extracted during previous logging operations. On old
skidding tracks, pioneer species such as Musanga, Trema, and Solanum proceed quiCkly.
Moreover, Ceiba pentandra, Mansonia altissima, Terminalia superba, Celtis mildbaedii, Antiaris
toxicaria, Triplochiton scleroxylon, and Piptadeniastrum africanum are regenerating well. A forest
inventory carried out in 1989 led to the following results:
36

• Nkrabia Forest Reserve has an estimated standing wood volume of 2.4 million m3
(approximately 250 m3/ha) of which 1.4 million m3 consist of trees with a diameter at breast height (dbh) of 70 cm and above and of which the remaining 1.0 million m3 are coming from trees with a diameter between 30 and 69 cm. Among the trees with a diameter above 70 cm, about 94 % belong to class I species, and 6 % to class" species. 1
• The average stem frequency of about 990 trees per hectare for all species classes in the Nkrabia Forest Reserve is considered as high in comparison with the National mean of about 840 trees/ha and, particularly, with regard to smaller diameter classes.
• The class I tree species Celtis mildbraedii, Cylicodiscus gabunensis, Triplochiton scleroxylon, Piptadeniastrum a fricanum, Terminalia superba, Alstonia boonai, Khaya ivorensis, Petersianthus macrocarpus, Pycnanthus angolensis, and Aningeria robusta are we" represented, while other class I speciEls, such as Entandrophragma candollei, Ceiba pentandra, and Termi-nalia ivorensis, show an unequal distribution in different diameter classes.
• The total number of tree species recorded in the Nkrabia Forest Reserve was 153, which is rather low compared with the estimate of 296 tree species recorded in other GHANAIAN forests of this vegetation type.
• The regeneration in the Nkrabia Forest Reserve is very good; 124 of the 153 tree species were recorded in the diameter class below 30 cm. 40 tree species of the 124 ones belong to the species class I, and about 90 tree species were recorded in the diameter class below 10 cm, 27 of which belong to species class I.
3.1.2. Methods
Before starting the field work, the boundaries of the strips and the compartment were clear cut and numbered pegs were placed at every 50 m of the 28 strips of the compartment. The direction and altitude of the strips were determined every 25 m.
Establishment of Small Plots
15 sample plots (small plots) of 0.25 ha were defined by placing a grid with 15 square plots on the map of the compartment. The small plots were located at the centre of the grid intersections and were labelled with square "Q1". Within each plot Q1, three other squares (Q2, Q3, and Q4) with a smaller area are positioned in the way that the lower number square includes the higher number square: • square Q1 with an area of 2500 m2 includes Q2, Q3, and Q4, • square Q2 with an area of 900 m2 includes Q3 and Q4, • square Q3 with an area of 100 m2 includes Q4 which has an area of 25 m2
.
The measurement of trees and seedlings in the squares Q1, Q2, Q3, and Q4 was based on the principle, that in the square • Q 1, a" trees with a diameter of 30 cm and above are inventoried, • Q2, all trees with a diameter between 10 and 30 cm are inventoried, • Q3, a" trees with a diameter between 5 and 10 cm are recorded, and • Q4 all seedlings and saplings are inventoried.
1 With regard to the definition of species classes see chapter 1.1. (p. 8-9)
37

The inventory of trees which were located directly at the boundary of the plots was based on the
following decisions:
• if 50 % of the tree falls inside, and 50 % outside the plot or square, every second tree
was recorded,
• if the centre of the stem falls inside the plot or square, the tree was recorded, and
• if the centre of the stem falls outside the plot or square, the tree was not recorded.
For every 10 ha, one small plot was allocated to reach a sampling density of 2.5 % of the entire
compartment with an area of 120 to 150 ha. The actual sampling density was only 2.3 % due to
an underestimation of the· compartment size on the basis of the map of the Nkrabia Forest
Reserve.
The inventory of the small plots consisted of the following steps:
• Identification of the trees by local tree finders and botanists, mainly by bark slashes.
• Measuring of the diameter of the trees over bark at breast height (1.35 m), and classification
into 8 diameter classes. By multiplying the mean number of trees with an area related
conversion factor, the mean number of trees per ha was calculated for each diameter class.
The conversion factor for the squares Q 1, Q2, Q3, and Q4 are 4, 11.1, 100, and 400,
respectively.
• Measuring of the length of the bole up to the first crown-forming branch of every tenth tree
using the relascope.
• Identifying and counting the seedlings and saplings in square Q4.
• Subdividing the inventory data into species classes according to the GHANAIAN Forest
Inventory Project (GFIP).
Establishment of One Large Plot
The felling and skidding damages as well as the wood residues were determined in a large plot
with an area of about 5 ha, ensuring that the large plot:
• contains at least 15 merchantable timber trees,
• is located outside swamp or hill areas,
• represents most of the physiographical characteristics of compartment 17, and
• is located as close to the north-eastern corner of the compartment as possible to keep
the daily walking distance short.
The large plot was marked by clear-cutting the boundaries.
The inventory of the large plot consisted of the following steps:
• Identification and recording of all trees with a diameter (dbh) of 30 cm and above. Trees with a
diameter < 30 cm had not been taken into account due to the extremely high natural mortality
among these trees.
38
• Selection of timber trees for felling. This selection was done in co-operation between the research team and the concessionaire who decided about the tree species and the quality requirements for the bole.
• Inventory of climbers with a diameter of 5 cm climbing on the selected timber trees. In case of climbers with a diameter < 5 cm, it was assumed that they do not influence the felling operation.
• Determination of the felling direction by the feller. It was considered that the selected trees shall fall inside the large plot when being cut. To avoid "observer effects", nobody of the research team was present during felling operations.
• Recording of the felling gaps by determining their position in the large plot, by taking 13 measurements of the gap width along each bole, and by taking 3 measurements of the part of the gap caused by the crown of the tree. The gap area was calculated with the aid of a portable computer.
• Determination of the felling damage on residual standing trees by classifying all trees with a diameter of 30 cm and above into: - Class 1: no visible stem or crown damage, - Class 2: minor visible damages on stem (bark) and/or crown
from which the tree is expected to recover, and - Class 3: severe damage on stem and/or crown from which
the tree is not expected to recover.
• Recording of the wood volume of each tree by measuring the length of the bole and the crosswise diameters over bark at both ends of the bole.
• Determining the volume of crown branches with a minimum diameter of 20 cm. For these measurements, the branches were cut into sections of a length of 1 m. The branch sections were classified as "straight", "curved", "curled", "forked", and "broken". All defective branch sections were classified as "broken". The volume of the branch sections were calculated according to usual geometric methods.
• Determination of the volume of the extracted logs by measuring the length of the log, the cross-wise diameters over bark, and the thickness of the bark. In case of logs with buttress flanges, the volume of the buttress flanges was added to the log volume.
• Measuring of the length, direction and width of the skidding tracks every 10 m, calculation of the area of the skidding tracks, and mapping of the skidding tracks.
• Inventory of trees growing adjacent to the skidding tracks. Depending on the extent of damage, these trees were classified into the above defined damage classes 1, 2, and/or 3.
3.1.3. Common Methodology
Based on the results obtained in the pilot study, a common methodology of the forest studies in the four different tropical countries was established which ensures comparability of the collected data about: • the forest inventory before and after logging,
39
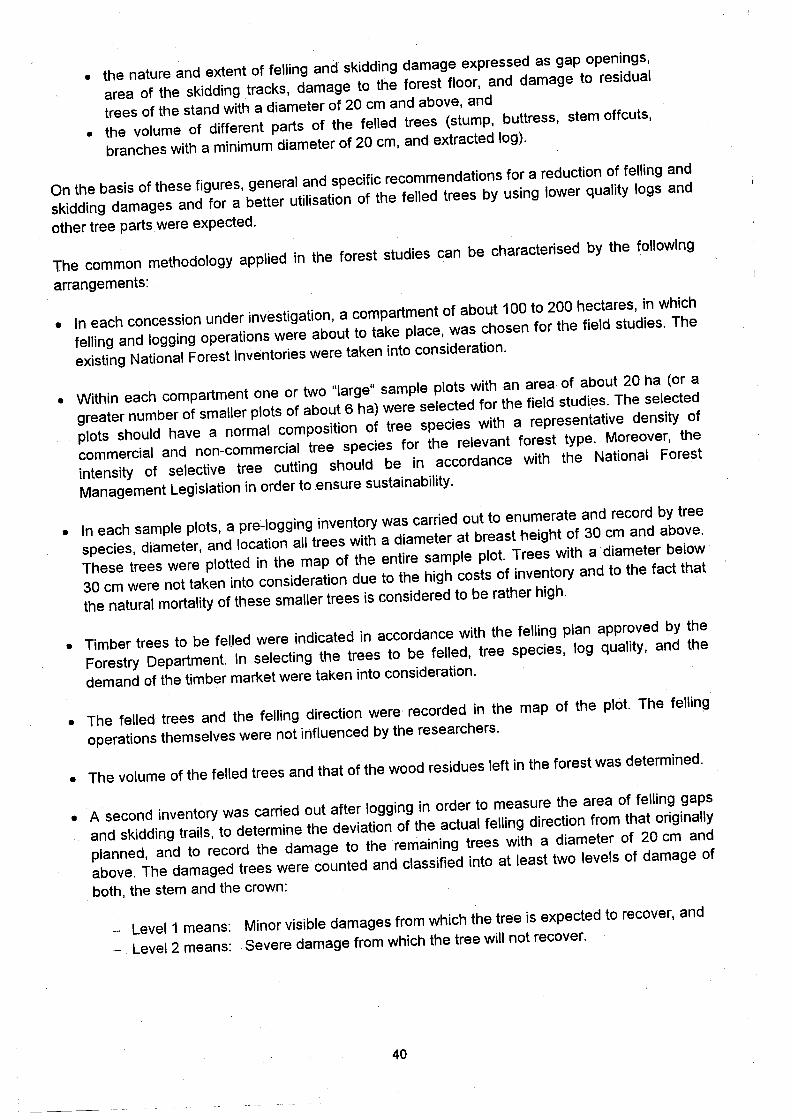
• the nature and extent of felling and skidding damage expressed as gap openings,
area of the skidding tracks, damage to the forest floor, and damage to residual
trees of the stand with a diameter of 20 cm and above, and
• the volume of different parts of the felled trees (stump, buttress, stem offcuts,
branches with a minimum diameter of 20 cm, and extracted log).
On the basis of these figures, general and specific recommendations for a reduction of felling and
skidding damages and for a better utilisation of the felled trees by using lower quality logs and
other tree parts were expected.
The common methodology applied in the forest studies can be characterised by the following
arrangements:
• In each concession under investigation, a compartment of about 100 to 200 hectares, in which
felling and logging operations were about to take place, was chosen for the field studies. The
existing National Forest Inventories were taken into consideration.
• Within each compartment one or two "large" sample plots with an area of about 20 h~ (or a
greater number of smaller plots of about 6 ha) were selected for the field studies. The selected
plots should have a normal composition of tree species with a representative density of
commercial and non-commercial tree species for the relevant forest type. Moreover, the
intensity of selective tree cutting should be in accordance with the National Forest
Management Legislation in order to ensure sustainability.
• In each sample plots, a pre-Iogging inventory was carried out to enumerate and record by tree
species, diameter, and location all trees with a diameter at breast height of 30 cm and above.
These trees were plotted in the map of the entire sample plot. Trees with a diameter below
30 cm were not taken into consideration due to the high costs of inventory and to the fact that
the natural mortality of these smaller trees is considered to be rather high.
• Timber trees to be felled were indicated in accordance with the felling pian approved by the
Forestry Department. In selecting the trees to be felled, tree species, log quality, and the
demand of the timber market were taken into consideration.
• The felled trees and the felling direction were recorded in the map of the plot. The fellin~
operations themselves were not influenced by the researchers.
• The volume of the felled trees and that of the wood residues left in the forest was determined.
• A second inventory was carried out after logging in order to measure the area of felling gaps
and skidding trails, to determine the deviation of the actual felling direction from that originally
planned, and to record the damage to the remaining trees with a diameter of 20 cm and
above. The damaged trees were counted and classified into at least two levels of damage of
both, the stem and the crown:
- Level 1 means: Minor visible damages from which the tree is expected to recover, and
- Level 2 means: Severe damage from which the tree will not recover.
40

3.2. Special Aspects of Forest Sites and on the Methodology of the Forest Studies in GHANA
3.2.1. Justification of the Selection of Concessions
In order to conduct,a comparative analysis of the extent and variation of logging damages and wood residues, concessions located in the three most important forest types were selected as forest sites, these are the: • NKRABIA Forest Reserve, a concession of the A TWIMA Timbers (ATL) in the moist
evergreen forest type, • ASUKESE Forest Reserve, a concession of the Timber and Transport (TAT) in the
moist semi-deciduous forest type, and the • AFRAM HEADWA TERS Forest Reserve, a concession of the EHWIA Wood
. Products Limited (EPL) in the dry semi-deciduous forest type.
For the realisation of the objectives of the forest studies, the following requirements had to be fulfilled: • the study had to be carried out under actual logging conditions, • the concessionaire must agree to the conduction of the forest study in the desired
area, and • the concession must be accessible and not too far from the res.earch centre.
3.2.2. Materials and Methods
Each forest study was conducted in one compartment with an area of approximately 130 ha. The three companies selected are medium scale loggers and mill enterprises. Each of the companies maintains a logging crew of 17 to 22 men and uses similar machinery which includes chain saws for felling and bucking, crawler tractors (caterpillar) for road construction, skidding, and loading, as well as wheel tractors for loading trucks and towing them over hilly and muddy terrain.
A detailed forest inventory was necessary to obtain accurate information on the composition and diameter distribution of the tree species as well as on the stocking density expressed in number of stems and basal area in m2 per hectare. This inventory was conducted in 15 to 17 square plots of 120 m x 120 m and included all trees with a diameter of 20 cm and above.
The logging disturbance was also determined in plots with an area of 120 m x 120 m in which at least one mature tree was likely to be felled. The felling direction was pre-determined by the feller. The difference between the pre-determined and the actual felling direction was recorded in angular degrees. The number of climbers with a diameter of 5 cm and above on the trees selected for felling was also recorded in order to find a possible relationship between the felling direction and the presence of climbers.
Damages caused by felling and skidding were determined in terms of felling gaps, skidding tracks, and forest roads.
In deviation from the felli,ng plan, the choice of the tree species to be cut by selective felling was highly influenced by the actual demand of the timber and log market. Therefore, the number of trees of different tree species which could be studied was dependent on the relevant ,prescriptions of the Forestry Department. In the three selected forest sites, a total of 38 trees of 14 tree species was investigated.
41

3.3. Special Aspects of Forest Sites and on the Methodology of the Forest Studies
in CAMEROON
3.3.1. Justification of the Selection of Concessions
Also in CAMEROON, the forest studies were carried out in· three different forest concessions
which represent three different ecological zones:
• The first forest site was located in the Coastal Region where the moist evergreen
rainforest is characterised by the tree species Azobe/Bongossi (Lophira a/ata) and
Ozouga (Saccoglotis gabonensis). This forest has been exploited since 1930 and is
therefore poor in highly valuable tree species.
• The second forest site is located in the Centre Region of moist semi-deciduous forest.
The forests of this region have been exploited since 1950 and are now in the second
cycle of exploitation.
• The third forest site is located in the East Province in a transition zone between the
forest of Sterculaceae and Ulmaceae and the moist semi-deciduous CONGO forest. This
forest has not been exploited before.
3.3.2. Materials and Methods
The size of the study sites in the three ecological zones in CAMEROON were somewhat different,
namely: • 100 ha in the Coastal Region,
• 93.5 ha in the Centre Region, and
• 50 ha in the East Province.
Each of the study site was sub-divided into smaller units of 25 ha with the dimensions of
250 m x 1 000 m.
The forest inventory carried out before exploitation showed that altogether about 60 tree species
with trees of a diameter of 20 cm and above were represented in the three sample plots.
The inventory of skidding tracks, felling gaps, and wood residues carried out after the felling
operations showed that:
• The mean length of the skidding tracks marked at distances of 50 m was about
7.5 km and their mean width was about 5 m.
• The damages caused by felling operations were classified into three categories:
- Category I: slightly damaged trees,
- Category 11: heavily damaged trees, and
- Category Ill: dead trees.
• For the determination of the wood residues and log yield, a total of 35 trees were
investigated.
The results of the forest studies are related to the felling operations which took place during the
investigation. Unfortunately, these felling operations were reduced d,ue to the actual conditions of
42

the timber and log market. In the East Province, the conduction of the forest studies was delayed becau se the logger had to operate in other coupes as previously planned. Consequently, new inventory measures were necessary and led to further delay of the evaluation of the forest study.
3.4. Special Aspects of Forest Sites and on the Methodology of the Forest Studies in INDONESIA/EAST KALlMANTAN
3.4.1. Justification of the Selection of Concessions
In EAST KALlMANTAN, the three forest studies were carried out in the following concessions located in the Hill Mixed Dipterocarp Forest:
• The concession of the relatively small private company P.T. MARIMUN TIMBER INDUSTRY (MTI) covers an area of about 2-7000 ha and is located close to the equatorial line at an altitude between 100 and 700 m above sea level. The annual rainfall varies between 2 500 and 3 000 mm.
• The concession of the private company P.T. INTERNATIONAL TIMBER CORPORATION INDONESIA (lTCI) covers an area of about 470 000 ha and is also located close to the equatorial line at an altitude between 0 and 1 200 m above sea level. The annual precipitation varies between 2 000 and 2 500 mm. ITCI is one of the oldest forest concessions in INDONESIA.
• The concession of the State company P.T. INHUTANI (INDUSTRI HUTAN INDONESIAIHTN) covers a total area of about 1 600000 ha which is composed of many separated smaller areas scattered in different sites over the province. The altitude varies between 0 and 1 500 m above sea level and the annual rainfall ranges between 3 000 and 3 600 mm.
In all three concessions, the Dipterocarp species are dominating, and the number of tree species per hectare varies between 100 and 200. Data on the productive and non-productive forest areas, the allowable cut, the current annual cutting, and the Five Year Planning (1993.;1998) are given in Table 3-1.
3.4.2. Materials and Methods
All three study sites were laid out in forest areas which had been undisturbed prior to logging. The intenSity of the logging operations carried out in 1992 were rather dependent on the weather conditions.
The locations of the three logging areas were as follows:
• in the concession of MIT, the study site was located in Block 256, 100 m above sea level,
• in the concession of ITCI, the study site was located in Block TN-R3W03, 600 m above sea level,'and
• in the concession of IHTN, the study site was located in Block 78, 100 m above sea level and in a distance of approximately 30 km from the log pond of the company.
43
The logging areas were already laiel out by the respectiv~ companies as required by the
INDONESIAN Forestry Regulation on Selective Cutting and Planting (TPTI) which prescribes that
the minimum diameter (dbh) of trees for exploitation is 60 cm. In each study site, the square plot
of 25 ha was set up at random within the logging area of 100 ha. In order to facilitate the
inventory of the stand and of the forest residues as well as the harvesting disturbance, each plot
was divided into 25 strips with a width of 20 m, oriented in the north/south direction.
For the assessment of commercial logs and of wood residues, altogether 35 felled trees were
studied.
The damages caused by logging operations were classified into the three classes: "light",
"medium" and "heavy". In case of heavy damages of the crown, stem or root, it is assumed that
the damaged tree will not be able to recover. .
Logging company
MIT ITCI IHTN
Concession area [ha] 27000 470200 1 584800
- Productive area [ha] 24000 393200 1319200
- Non-productive area [ha] 3000 77000 265600
Annual allowable cut (AAC) I
- Maximum MC [m3 /ha] 41300 500000 650000 I
I
- Minimum MC [m%a] 25900 300000 550000 I I
Area of current annual cut (ha] 400 3800 900·T
Five year planning (1993 to 1998)
- Area [ha1 2700 26300 112500
- Volume [m3] 131 700 2208000 3750000
*) represents only the area of the corresponding concession site out of the Whole areas
under IHTN management
3.5. Special Aspects of Forest Sites and on the Methodology of the Forest Studies
in SARAWAK/MALAYSIA
3.5.1. Justification of the Selection of Concessions
In the initial planning of the project, it was decided that two study areas in SARAWAK should be
located in the Hill Mixed Dipterocarp Forest arid one in the Peat Swamp Forest in order to
represent the two major forest types with different harvesting techniques. Furthermore, the
distance of the concession areas to a major town with timber processing industry and to export
ports were additional factors for the choice of the three study sites which are located in the
Permanent Forest Estate.
The following concessions were been chosen for the forest studies:
• The DAPOI HILL concession is located in the very far interior of SARAWAK, a logging
road and the BARAM river are the only transportation ways. The study plot was located
in Block no. 22 of coupe 16 which belongs to the forest type MD3 III (High Density Hill
44

Mixed Dipterocarp Forest with terrain class Ill). The concession area is managed under a long term license with a cutting cycle of 25 years, and the harvesting operations are based on a Forest Management Plan with selective felling.
• The MUKAH HILL concession is located close to the major town SIBU. The SIBUBINTULU-Highway and the BALlNGIAN river are the main transportation ways to the timber processing industry at SIBU and the export harbour of Tanjong Manis. The study plot was located in Block no. 12 of coupe 16C which belongs to the forest type MD2 11 (Medium Density Hill Mixed Dipterocarp Forest with terrain class 11). The MUKAH HILL concession is also under a long-term license with a cutting cycle of 25 years and under the Forest Management Plan with selective felling.
• The RASAU Swamp concession is also located close to the major town SIBU. However, the only transport way is the river. The study plot was located in Block no. 13 of coupe 27B, Line 14, which belongs to the forest type 3.1 of the Peat Swamp Forest. The· RASAU Swamp concession is managed under a long term license. According to the Forest Management Plan, the logging operations are based on selective felling with a cutting cycle of 45 years.
3.5.2. Materials .and Methods
The study plots in the two Hill Mixed Dipterocarp Forest concessions had an area of 20 ha with the dimensions of 400 m x 500 m, while due to the special local conditions, the study plot in the RASAU Peat Swamp Forest measured only 200 m x 292 m = 5.8 ha. Accordingly, the parallel strip lines (sub-plots) of the study plot in the RASAU Peat Swamp Forest with a length of 292 m had a width of 40 m.
Whereas all trees with a diameter (dbh) of 30 cm and above are intentoried and mapped for each study plot, in one sub-plot of each study plot the trees down to a diameter of 20 cm were also determined and mapped.
10 felled and extracted trees were used for the utilisation study. For trees with a diameter of 45 cm and above (for Ramin with a diameter> 30 cm) also the merchantable log with a minimum length of 3.6 m and a minimum top diameter of 30 cm was determined for a possible utilisation in sawmilling.
The damages caused by logging operations were classified into the 3 damage classes: • Class I: Slight bark and/or crown damage; the damaged tree is expected to recover. • Class 11: Severe bark and/or crown damage; the damaged tree is not expected to recover. • Class Ill: Tree entirely destroyed (e.g. by uprooting, broken trunk or destroyed crown).
In case of Peat Swamp Forest besides the skidding tracks also the area of the rail lines were determined and mapped.
45

4. RESULTS OF THE FOREST STUDIES
4.1. Results of the Forest Studies in GHANA
4.1.1. Standing Stock
General data on the potential of GHANA's tropical high forests are given in Chapter 1.1.1.
(page 9). The total growing stock is estimated to about 274 million m3 for trees with a diameter
(dbh) of 30 cm and above growing on about 8 million ha of forest land, while the annual wood
production - including fuelwood and charcoal - was in the order of 17 million m3 during the years
from 1985 to 1990, only.
4.1.2. Forest Residues
A total of 38 timber trees were felled and investigated in the three study areas. 14, 15, and 9 of
the 38 trees were from the ASUKESE, AFRAM, and NKRABIA study sites, respectively. The total
wood volume of the trees, of the extracted logs as well as of the various types of wood residues
are given in Table 4-1.
Number Volume of the
Study site of Extracted Residues of the Whole
trees stem Stump Buttress Stem offcuts Crown tree
[m3
] [%) [m3] [%) [m
3] [%) [m
3] [%) [m
3] [%) [m3
] [%)
ASUKESE 14 180 52 11 3 34 10 34 10 84 24 343 100
AFRAM 15 368 50 19 3 39 5.5 63 8.5 246 33 735 100
NKRABIA 9 89 36 12 5 9 4 69 28 66 27 245 100
TOTAL 38 637 48 42 3 82 6 166 13 396 30 1323 100
4.1.3. Felling and Logging Disturbance
Obviously, the accurate felling direction is a basic problem of the fellers to avoid larger damages
of the residual stand. For 23 trees studied, only 8 fell within the angel range of 0 to 10 degrees of
the planned direction, and the total range of deviation varied between 0 and 170 degrees.
The structure of the crown and the total height of the: tree influence the extent of vegetation
disturbance. A strong correlation exists between the basal area of the felled tree and the area of
the gap with a correlation coefficient of 0.92 for the ASUKESE forest site and 0.79 for the AFRAM
forest site, respectively.
The GHANAIAN study also shows a relationship between the gap area created by individual trees
and the crown volume which is the volume of the branches with a minimum diameter of 20 cm.
The correlation coefficients of this relationship were 0.32 and 0.69 for the ASUKESE and AFRAM
forest sites, respectively (Table 4-2).
46

Number Dimensions of the felled trees (average values) Gap I of Diameter (dhb) Total height Crown depth Crown diameter area Study site trees [cm) [m) [m) [m) 1m2)
ASUKESE 34 101 45 19 15 345 AFRAM 18 130 52 23 25 602 NKRABIA 9 96 - - - 606
The effects of felling on the residual trees are as follows:
• The damage was more frequent and severe on the crowns than on the stems. • The crown of felled trees caused more damage to the residual trees than the stems. • Smaller trees with a diameter(dbh) of 50 cm and less were the most affected ones. • There was a relationship between the number of trees completely destroyed in the felling gap and the size of the gap. The correlation coefficients were 0.72 at ASUKESE and 0.62 at AFRAM study site.
Total area of Section of Damage category (Number of trees) Study site felling gaps tree no damage slightly severely uprooted [ha] damaged
damaged damaged ASUKESE 1.18 stem 67 85 23 64
crown 28 53 94 AFRAM 1.08 stem 125 89 14 45
crown 93 95 40 NKRABIA 0.55 whole tree 52 16 5
The skidding of the felled trees also causes heavy damages to the residual stand within and along the skidding tracks. The average number of trees destroyed per felled and extracted tree was 6 at ASUKESE and 9 at AFRAM study site. Over 80 % of the destroyed trees had a diameter (dbh) less than 30 cm. Furthermore, the results show that for every 100 m of skidding track, about 4 trees of a diameter between 10 and 50 cm were completely destroyed at ASUKESE and AFRAM study site, respectively. The skidding damages are summarised in Table 4-4 and Table 4-5.
Total area of Section of Damage category (Number of trees) Study site skidding tree no damage slightly severely uprooted tracks [ha] damaged
damaged damaged ASUKESE 0.96 stem 38 22 1 60
crown 25 35 1 AFRAM 1.20 stem 29 31 3 78
crown 28 31 4 NKRABIA 0.55 whole tree 9 9 2
47

Study site Type of Number of trees per diameter class [cm}
damage 10 to 20 to 30 to 50 to 70 to 90 to 110 to >130 TOTAL
19 29 49 69 89 109 129
Stem 11 10 1 0 1 0 0 0 23
ASUKESE Root 7 8 10 6 3 2 0 0 36
uprooted 48 8 3 1 0 0 0 0 60
Stem 7 13 11 2 1 o· 0 0 34
AFRAM Root 6 12 10 5 1 0 1 0 35
uprooted 21 42 14 1 3 0 1 0 82 I I
TOTAL A" parts 100 93 49 15 9 2 2 0 270 I I
Skidding with large and heavy caterpillar tractors resulted in wide skidding tracks and in
displacement of huge volumes of top soil. Thus, the actual average widths of the skidding tracks
were 5.9 m, 5.6 m, and 5.0 m in the ASUKESE, AFRAM, and NKRABIA study site, respectively.
These values were much higher than the width laid down in the standard specification by the
Forest Department which is only 4.0 m.
Furthermore, the lack of proper road planning and alignment resulted in several curves and
diversions thus increasing the road. intensity which is defined as percentage of the forest area
(Table 4-6). There were also far more loading bays per compartment (four loading bays in each of
the ASUKESE and AFRAM study site) than specified in the logging regulations (which was one
loading bay, only).
Logging roads Skidding tracks Number of Area disturbed per
Study site density intensity width density intensity loading 1 m3 extracted log
[m/ha) [%) [m) [m/ha) [%) bays [m<) [%)
ASUKESE 8.7 0.6 5.9 85 5.9 4 54 0.5
AFRAM 8.4 0.7 5.6 92 5.5 4 52 0.5
NKRABIA - - 5.0 109 7.5 - 100 1.0
STANDARD - - 4.0 - - 1 - -
The forest studies in GHANA show that the extraction of 1 m3 timber log disturbed an average
area of 54 m2 at the ASUKESE study site, 52 m2 at the AFRAM study site, and about 100 m2 at
the NKRABIA study site. These areas are equivalent to an extraction intensity of 0.54, 0.52, and
1.0 % per 1 m3 10g volume, respectively.
48

4.2. Results of the Forest Studies in CAMEROON
4.2.1. Standing Stock
The volume of the standing stock prior to exploitation is summarised in Table 4-7. The tree species were classified into the categories Commercial timber I (Principal 1), Commercial timber If (Principal 2), Less important timber (Secondaires), and Complimentary timber (Complimentaires).
Table 4-7 does not contain the data of the inventory which has been carried out after the exploitation because there were some discrepancies between both inventories with regard to the number of commercial species in the category Commercial timber I and the fact that the complementary timber species had not been inventoried in the second inventory.
4.2.2. Forest Residues
A total of 12 felled trees were analysed with regard to the volume of the stem, stump, buttress, and the branches with a minimum diameter of 20 cm. The data obtained are given in Table 4-8. The results show that the crown residues contain a considerable part of the total tree volume; its portion varies from 25 % for Tali up to 58 % for lroko, and the mean value of all 12 trees was 41 %.
Number of trees Volume of trees [m3] ,
-Study site Area diameter class [cm] total diameter class [cm] Total I
[ha] a b all a b all
COASTAL REGION 100
Commercial timber I 32 24 56 90 330 420
Commercial timber 11 64 74 138 92 694 786
Less important timber 892 1228 2120 1150 12980 14130
Complementary timber 9 88 97 11 931 942
CENTRE REGION 94
Commercial timber I 80 3 83 168 45 213
Commercial timber 11 383 62 445 903 460 1363
Less important timber 783 311 1094 1160 1466 2626
Complementary timber 175 343 518 151 1493 1644
EAST PROVINCE 50
Commercial timber I 77 42 119 239 445 684
Commercial timber 11 12 22 34 25 118 143
Less important timber 92 223 315 168 1157 1325
Complementary timber 265 600 865 279 2678 2957
a: Trees with a diameter at breast height (dbh) between 20 cm and the minimum felling diameter of the particular wood species
b: Trees with a diameter (dbh) above the minimum felling diameter - --------------- -------- - -- --
49

Number Volume of the
Tree species of Extracted Residues of the Whole trees stem Stump Buttress Crown tree
[m3]
[%) [m~] [%) [m~] [%) [m"] [%) [m--:r] [%)
Ayous 3 51 55 3 3 7.5 8 5 34 93 100
Sape\li 2 17 39 2 5 1.5 4 22.5 52 43 100
Iroko 2 23 28 3 4 8 10 47 58 81 100
Sipo 2 40.5 53 4 5 7.5 10 25 32 77 100
Movingui 2 11.5 50 3 13 1 4.5 7.5 32 23 100
Tali 1 12.5 65 5 8 0.5 2 4.5 25 19 100
TOTAL 12 155 46 16.5 5 26.5 8 138 41 336 100
4.2.3. Felling and Logging Disturbances
The felling gap area had been determined for altogether 115 trees. The mean values related to the study site as well as to particular tree species are given in Table 4-9. These values indicate that the highest felling disturbance occurred at the study site "East Province", where especially the gap areas of the tree species lroko and Bosse were relatively large.
Study site Tree Number of Gar, area species felled trees [m Itree]
CENTRE REGION all 27 140 Ayous 14 154
Movingui 11 120
Sapelli 1 200
Iroko 1 140
EAST PROVINCE all 42 235 Frake 17 210
Tali 15 221
Sapelli 3 228
Iroko 2 390
Dossie 2 287
Bosse 1 360
Sipo 1 250
Ayous 1 225
COASTAL REGION all 46 180 I TOTAL all 115 190
The damages to the residual stand caused by felling operations and related to individual tree species as well as to the study site are indicated in Table 4-10.
50

The length of skidding tracks ,(with a calculated average width of 4 m) and the length of logging roads (with a calculated average width of 18 m) had been determined in the three study sites with the results given in Table 4-11. In the Coastal Region, it was not necessary to construct special logging roads because the existing. ones could be used. Therefore, the length of 0 m does not reflect the reality.
The total area covered with skidding tracks and logging roads was 20 000 m2 in the Centre Region, 33 100 m2 in the East Province, and 13750 m2 in the Coastal Region, respectively. The road intensity, therefore, were 2.1 % in the Centre Region, 6.6 % in the East Province, and 1.4 % in the Coastal Region, respectively. By adding the gap areas caused by felling operations, the total opening intensity in the three study sites were 2.5 % in the Centre Region, 8.6 % in the East Province, and 2,2 % in the Coastal Region, respectively.
Tree Number Damage category species of felled I
Study site trees slightly damaged heavily damaged dead trees
Total Number per Total Number per Total Number per
number felled tree number felled tree number felled tree
CENTRE REGION all 27 41 1.5 82 3.0 82 3.0 Ayous 14 1.5 2.9 3.3
Movingui 11 1.2 3.0 2.9
Sapelli 1 4.0 1.0 3.0
Iroko 1 1.0 5,.0 2.0
EAST PROVINCE all 42 68 1.3 62 1.2 104 2.0 Tali 15 1.3 1.3 2.3
Frake 17 1.6 1.2 1.8
Sapelli 3 1.0 1.6 1.7
Iroko 2 2.0 - 2.0
Dossie 2 0.5 0.5 1.0
Bosse C 1 - - 4.0
Sipo 1 - - 2.0
Ayous 1 3.0 - 4.0
COASTAL REGION all 46 112 2.4 145 3.2 78 1.7
TOTAL all 115 1.9 289 2.7 264 2.2
Logging roads Skidding tracks Total intensity of roads
Study site density intensity width length density intensity length per trefi! and skidding tracks
[m/ha] [%] [m] [m] [m/ha] [%] [m/tree] [%]
CENTRE REGION 3 0.5 4 3645 39 1.6 135 2.1 EAST PROVINCE 27 4.9 4 2155 43 1.7 51 6.6 COASTAL REGION (0) (0) 4 3440 34 1.4 75 (1.4)
- - - ----
51

4.3. Results of the Forest Studies in EAST KALlMANTANIINDONESIA
4.3.1. Standing Stock
In the study areas of EAST KALlMANTAN, the forest vegetation is lowland Dipterocarps forest and mountain Dipterocarps forest. With regard to the composition of tree species, there are some differences between the three study sites (Table 4-12), which is indicated by the wide range of the number of tree species varying from 12 in the IHTN forest concession to 46 in the ITCI forest concession.
Number of tree species
Study site Dipterocarps Non-Dipterocarps Total exploitable protected exploitable protected
MTI concession 10 1 15 7 33
ITCI concession 8 1 28 9 46
IHTN concession 6 1 3 2 12
Another important characteristic of tropical forests is the tree density defined as the number of trees per hectare (Table 4-13). The tree density of the three forest concessions varied between 74 trees/ha in the ITCI forest concession to about 88 trees/ha in the MTI forest concession.
Tree density [Number of trees/ha]
Dipterocarps species Non-Dipterocarps species All Study site Exploitable Protected Sub- Exploitable Protected Sub- TOTAL
total total Diameter dbh [cm]
20 to 50 > 50 20 to 50 > 50 >20 20 to 50 > 50 20 to 50 > 50 > 20 > 20
MTI concession 50.4 16.0 0.6 0.6 67.6 16.1 2.3 1.4 0.4 20.2 87.8
ITCI concession 16.4 12.7 1.1 0.8 31.0 29.4 2.5 11.5 6.1 49.5 80.5
IHTN concession 41.2 23.9 1.5 1.1 67.7 4.8 1.0 0.2 0.1 6.1 73.8
Standing stock volume [m3/ha] Dipterocarps species Non-Dipterocarps species All
Study site Exploitable Protected Sub- Exploitable Protected Sub- TOTAL total total
Diameter dbh [cm]
20 to 50 > 50 20 to 50 >50 >20 20 to 50 > 50 20 to 50 > 50 > 20 > 20
MTI concession 80 180 2 7 269 19 22 3' 3 47 316
ITCI concession 19 166 1 9 195 22 11 11 27 71 266
IHTN concession 109 230 4 16 359 11 11 1 1 24 383
52

Data on the standing stock in the three forest concessions are given in Table 4-14 showing that the Dipterocarps dominate in all three forest concessions with a proportion between 74 and 95 % of the total stock. The proportion of the clear bole volume in relation to the volume of the whole stem ranged from 60 to 66 % for the Dipterocarps whereas this proportion amounted to only about 40 % for the non-Dipterocarps species.
4.3.2. Forest Residues
Forest residues were related to the felled trees as well as to the stand damages. During the felling operations, 5 to 7 trees per hectare were harvested in the three study sites irrespective of the different standing stocks (Table 4-15). This corresponds with a rather high intensity of timber exploitation which lay between 30 % at the IHTN study site and about 60 % at the ITCI study site.
Standing stock Extracted logs Exploitation intensity Numper of Volume V1 Number of Volume V2 n2.X 100/n1 V2X 100N1
Study Site trees n1 trees n2 [no'/ha) [m'/ha) [no'/ha) [m>tha) [%) [%)
MTI concession (25 ha) 18.3 123 5.6 54 30 44
ITCI concession (25 ha) 15.2 109 7.0 67 46 61
IHTN concession (15 ha) 24.9 148 5.7 42 23 28 -----
As a basis of the determination of wood residues, about 40 trees were studied in the three study areas. Details showing the types and volume of wood residues in the three study sites and in relation to the main tree species are given in Table 4-16. The comparison between the total tree volume and the volume of wood residues gained from the felled trees shows that the average value for each study site is almost the same, ranging from 35 % in the MTI and ITCI forest site to 39 % in the IHTN forest site.
Volume
Study site and Number Extracted Residues Whole
tree species of trees stem Stump Buttress Stem offcuts Crown tree
[m3] [%] [m3] [%] [m3] [%] [m3] [%] [m3] [%] [m3] [%] ,
MTI Meranti 9 77 66 6 5 3 3 3 3 27 23 116 100
Keruing 14 155 68 12 5 3 1 3 1 56 25 229 100
Bangkirai 12 120 64 11 6 6 3 6 3 45 25 188 100
Others 5 38 58 3 5 2 3 1 1 22 33 66 100
SUB-TOTAL MTI 40 390 65 32 5 14 3 13 2 150 25 599 100
ITCI Meranti 34 595 64 47 5 51 6 75 8 160 17 928 100
Kapur 1 13 68 1 5 2 11 1 5 2 11 19 100
others 1 20 80 1 4 - - 4 16 25 100
SUB-TOTAL ITCI 36 628 65 49 5 53 5 76 8 166 17 972 100 '---..--- -------
53
i

Volume
Study site and Number Extracted Residues Whole
tree species of trees stem Stump Buttress Stem offcuts Crown tree
[m3] [%) [m3
] [%) [m3] [%] [m3
] [%) [m3] [%] [m3
] [%]
IHTN Meranti 20 117 58 11 6 5 3 16 8 51 25 200 100
Keruing 20 153 62 13 5 6 11 9 4 68 27 249 100
Others 2 13 72 1 6 - - 4 22 18 100
SUB-TOTAlIHTN 42 283 61 25 5 11 2 25 5 123 27 467 100
Meranti 63 789 63 64 5 58 5 94 8 238 19 1243 100
Keruing 34 308 64 25 5 9 2 12 3 124 26 478 100
Bangkirai 12 121 64 11 6 6 3 6 3 45 24 189 100
Kapur 1 13 68 1 5 2 11 1 5 2 11 19 100
Others 8 70 64 5 5 3 3 1 1 30 25 109 100
GRAND-TOTAL 118 1301 64 106 5 78 4 114 6 439 21 2038 100
During the felling operations, it was observed that some trees were pulled out by the physical force which was exerted by liana plants; Therefore, some of the protected tree species had also suffered from the harvesting operations. Field observations have also shown that a great number of standing trees which originally were considered for the future standing stock, suffered severe damages. In this case, the trees of a smaller diameter were far more damaged than those of a bigger size (Table 4-18).
The damage of the residual stand was classified into the categories "light", "medium", and "heavy" (Table 4-17). In case of light damage, it is assumed that the tree recovers easily. The medium and heavy damages have not been clearly defined in the INDONESIAN report. However, it can be assumed that heavily damaged trees will never recover, while trees of medium damage will be utilisable as commercial timber to some extent.
Extracted trees Damaged trees
Study site Number Number per m3 Number per
Number Log Damage category Total log extracted extracted trees
volume light medium heavy
[No.) [m3) [No.) [No.) [No.) [No.] [No.lm 3
) [No.ltree]
MTI concession 139 1355 151 78 75 304 0.22 2.2
ITCI concession 174 1665 120 50 228 398 0.24 2.3
IHTN concession 86 635 26 36 36 98 0.15 1.1
54

Damaged trees
Study site Diameter class [cm] Total 20 to 29 30 to 39 40 to 49 50 to 59 60 to 69 > 70
[No.] [%] [No.] [%] [No.] [%) [No.] [%] [No.] [%) [No.] [%) [No.] [%)
MTI concession 141 46 74 24 58 19 26 9 3 1 2 1 304 100
ITCI concession 133 33 104 26 87 22 30 8 21 5 23 6 398 100
IHTN concession 13 13 22 23 41 42 14 14 8 8 0 0 98 100
4.3.3. Felling and Logging Disturbance
With regard to felling gaps which had been measured on altogether 399 trees, a good relationship between the diameter class of the felled trees and the gap size exists (Table 4-19). The overall mean of the gap size per felled tree was 280 m2/tree with only minor differences between the three study sites, and the overall mean of the gap size per m3 extracted log amounted to 30.5 m2 (Table 4-19).
Gap size [m2] Extrac- Gap
ted log size Diameter class [cm] SUB-TOTAL Gap volume per log
Study size per
site 50 to 59 60 to 69 70 to 79 80 to 89 90 to 99 > 100 all tree volume
No. [m2) No. [m2
) No. [m2) No. [m2
] No. [m2) No. [m2
) No. [m2) [m2
) [m~ [m2/m~
MTI 3 760 27 6670 34 8700 30 7170 20 5810 25 6180 139 35290 254 1355 26.0
ITCI 9 2430 22 5730 43 11960 39 10210 37 12270 24 8900 174 51500 296 1665 30.9
IHTN 18 2080 39 10900 20 5740 8 2040 7 2240 4 1610 86 24610 286 635 38.8
TOTAL 30 5270 88 23300 97 26400 77 19420 64 20320 53 16690 399 111400 279 3655 30.5 L ___
In all three study sites, tractors were used to skid the logs from the felling site to the loading bays. In the MTI and IHTN forest concessions, the skidding roads were not planned prior to logging operations. Consequently, the tractors handled more freely in finding the best track. In the ITCI forest concession, however,_ the tractor drivers were guided by marked ribbons to follow the track and, therefore, in comparison with the other concessions the destruction of the stand was lower.
The width of the skidding tracks was similar in all study sites, ranging from 4 to 6 m, but the length of the skidding tracks was considerably different in the three study sites. The mean length of the skidding tracks per ha ranged from 62 m in the ITCI study site to 120 m in the MTI study site. A description of the skidding tracks in the EAST KALlMANTAN study sites is given in Table 4-20.
55

Skidding tracks
Study site Density Width Intensity
[m/ha] [m] [%]
MTI concession 120 4 to 6 6.0
ITCI concession 62 4 to 6 3.1
IHTN concession 68 4 to 6 3.4
TOTAL 86 5 4.3
The disturbance of the stand due to the skidding of logs is shown in Table 4-21. The total number of damaged trees per 100 m skidding track ranged from 1.9 to 5.4. From these trees 0.6 to 2.6 had medium and heavy damages.
Study site Number of damaged trees Number of
Damage category*) Tree species Total damaged
light medium heavy Dipterocarps Non-Dipterocarps trees per 100 m skid ding track
MTI concession 68 17 2 66 21 87 2.9
ITCI concession 7 4 18 8 21 29 1.9
IHTN concession 29 14 12 51 4 55 5.4
.} Note: Light = Small part of the tree was damaged but the tree can continue growing Medium = More than one part of the tree was damaged (crown, root, stem), but the tree may
continue growing Heavy = One or more parts of the tree were damaged and the tree will die
I The number of sound exploitable trees with a diameter (dbh) between 20 and 49 cm, which were still growing in the forest after the harvesting operations, ranged between 32 and 52 (Table 4-22). This number exceeded the requirements of the TPTI Forest Regulations which prescribe that 25 sound and exploitable trees per hectare have to remain in the stand after the harvesting operations.
Sound trees Damaged trees caused by Sound trees
Study site before Felling Skidding Total after harvesting harvesting
[tree/ha) [tree/ha) [trees/ha) [trees/ha) [trees/ha)
MTI concession 66.5 10.9 3.2 14.1 52.4
ITCI concession 45.8 13.0 1.0 14.0 31.8
IHTN concession 46.0 5.1 1.9 7.0 39.0
56

4.4. Results of the Forest Studies in SARAWAK/MALAYSIA
4.4.1. Standing Stock
The inventory in the three study sites in SARAWAK carried out prior to harvesting included all trees with a diameter (dbh) of 20 cm and above. Table 4-23 illustrates the dominance of the Dipterocarp species in the tropical hill forests as the most important commercial timber of SA RAWAK.
Tree density Net industrial stemwood Study site and Tree species trees/ha Portion Volume Portion
[No.lha] [%] [m3/ha] [%]
DAPOI Hill FOREST Dipterocarps 40 48 88.5 64
Non-Dipterocarps 43 52 49.5 36
Sub-total DAPOI Hill FOREST 83 100 138 100
MUKAH Hill FOREST Dipterocarps 33 65 72.3 79
Non-Dipterocarps 18 35 19.7 21
Sub-total MUKAH Hill FOREST 51 100 92.0 100
RASAU Swamp Forest Ramin 11 27 20.5 19
Other species 30 73 88.0 81
Sub-total RASAU Swamp Forest 41 100 108.5 100
The two plots in the Hill Mixed Dipterocarp Forest show obvious differences with regard to the number of trees and the net volume of industrial stemwood per hectare. These differences are caused by the different type of the Hill Mixed Dipterocarp Forests which were of medium density (MD2) and heavy density (MD3) in the MUKAH and DAPOI forest concessions, respectively.
In the Mixed Swamp Forest, the tree species are classified into commercially valuable timber and those of less importance. The valuable commercial species amount to only 25 % of the trees with a diameter (dbh) of 20 cm and above, and the leading tree species is Rama/Ramin (Gonystylus bancanus) with again 25 % of the commercially valuable species. Commercially less important species are Alan (Shorea albida) , Rengas Hutan/Rehu (Bachanania spp.), Nyatoh/Nyto (Pa/aquium spp.), and Jelutong (Dyera spp.).
4.4.2. Forest Residues
In each of the three study sites, 10 trees were felled and measured in order to determine the volume of extracted logs and the volume of the wood residues left in the forest. The results are summarised in Table 4-24, in which the stem residues include the lower stem offcuts (between the stump and the log) and the upper stem offcuts (between the log and the crown).
57

Volume
Study site Residues
and Number Extracted Stump Buttress & Crown Whole Tree
Tree species of trees stem Stem offcuts
[m3] [%] [m3
] [%] [m3] [%] [m3
] [%] [m3] [%]
Mixed Dipterocarp Forest (HMDF)
DAPOI HILL FOREST 10 118 62 25 13 22 11 26 14 191 100
MUKAH HILL FOREST 10 57 52 7 6 25 23 21 19 110 100
SUB-TOTAL HMDF 20 175 58 32 11 47 15 47 16 301 100
Peat Swamp Forest
RASAU Swamp Forest
Rama/Ramin (Gonystylus 10 24 89 - - 3 11 - - 27 100
bancanus)
Rehu (Buchaniania spp.) & 7 9 Nyto (Palaquium spp.) 10 40 60 5 16 24 6 67 100
Alan (Shorea albida) 10 99 51 5 3 14 7 75 39 193 100
4.4.3. Felling and Logging Disturbance
For the determination of the felling disturbance, 35 trees were felled in each study plot of the Hill Mixed Dipterocarp Forest. The size of the felling gaps varies between 155 and 815 m2/tree in DAPOI HILL concession and between 215 and 815 m2/tree in MUKAH HILL concession, respectively. On gentle slopes and in lowland areas, the gap size increases generally with the size of the tree felled, whereas in hilly and rugged terrain no clear relationship was found between the tree size and the gap size. Table 4-25 shows the damages to the residual trees caused by the felling operations.
Number of damaged trees per felled tree Damage Diameter range [cm] All diameter classes
Study site class 20 to 45 > 45 [trees/felled trees] [trees/felled trees] [trees/felled trees]
DAPOI Hill concession 1 2.9 1.2 4.1 8.5 2&3 3.6 0.8 4.4
MUKAH Hill concession 1 3.8 1.3 5.1 8.1 2&3 2.5 0.5 3.0
In the Swamp Forest plot, however, it was not possible to determine the felling disturbance by this method. Due to the special extraction method in the Swamp Forest based on a rail line system, pole sized trees were cut in the vicinity of the extraction route to get the material for the rail line stringers and sleepers. In the case of Swamp Forest exploitation, the forest stand was already disturbed before the felling operations began. Therefore, the determination of the felling damage
58
I
I
:
I
I

could only be carried out after the completion of harvesting. The mean sizes of the felling gaps of the main tree species in the Mixed Swamp Forest are given in Table 4-26.
Tree species Mean gap size
[m2/tree]
Ramin (Gonystylus bancanus) 165 Alan (S/lOrea albida) 483 Rengas Hutan (Bacl1anania spp.) 264 Jelutong (Dyera spp.) 414
"-----Nyatoh (Palaquium spp.) 316
4.4.4. Skidding Damages
The investigation of the skidding damages was only conducted in the two study sites, the DAPOI HILL FOREST and the Rasau Swamp Forest. In the third concession, the Mukah Hill Forest, the logging was not completed in due time and made an investigation therefore impossible. A summary of the results of this investigation is given in Table 4-27.
Damaged trees Felled and Residual, TOTAL _ Damage class*) extracted undisturbed
Study site trees trees Class 1 Class 2 Class 3 (Class 4) (Class 5) All classes
[No.lha] [%] [No.lha] [%] [No.lha] [%] [No.lha] [%] [No.lha] [%] [No./ha] [%]
DAPOI hill 16 7 6 2 31 13 4 2 180 76 237 100
RASAuswamp 35 18 12 6 106 53 29 15 16 8 198 100
Basal area Basal area Basal area Basal area Basal area Basal area
[m'/ha] [%] [m'/ha] [%] [m'/ha] [%] [m'/ha] [%] [m'/ha] [%] [m'/ha] [%]
DAPOI hill 2.9 7 0.9 2 3.7 10 2.4 6 29.2 75 39.1 100
RASAuswamp 3.6 14 1.3 5 7.8 31 10.7 42 1.9 8 25.3 100
*} Damage class 1 : Trees with slight damage to bark and crown (trees are able to recover) Damage class 2: Trees with severe damage to bark and/or crown (trees are not able to recover Damage class 3: Trees uprooted, trunk breakage, missing, feUed but not extracted
In the Hill Mixed Dipterocarp Forest, about 75 % of the dan1aged trees (or 40 trees/ha) belonged to the diameter classes below 45 cm, and only 25 % belonged to the higher diameter classes.
In terms of the basal area of the stand in m2 timber per hectare, Table 4-27 shows that the severe damages of damage class 2 and 3 caused by logging operations were in the order of 12 %. The intensity of selective felling and extraction of logs in the Hill Mixed Dipterocarp Forest was in the order of 6 %. Only in the Swamp Forest, where the intensity of selective felling and extraction of logs was as high as 42 % of the original basal area, th~ severe logging damages were also in the order of 35 %.
59

The total area of forest opening caused by harvesting operations is summarised in Table 4-28 for the study sites of DAPOI HILL Dipterocarp Forest and RASAU Swamp Forest which are managed under quite different and, therefore, non comparable harvesting procedures.
Area
Study site Total plot skidding tracks Felling gaps Total forest opening
ha % ha % ha % ha %
DAPOI HILL FOREST concession 20 100 0.94 4.7 3.2 16 4.2 21
RASAU Swamp Forest 5.8 100 - - - - 4.0 68
concession
4.5. Discussion of the Results Obtained
4.5.1. Volume of Extracted Logs and of Forest Residues
The common methodology had to be adapted to the specific situation in each country, taking into account the different types of forests with regard to:
• the topography and vegetation type of the felling and study sites, • the standing stock, • the number of logs extracted, and • the width of skidding tracks.
The methodology developed for all forest studies was based on the results of a pilot study in GHANA covering:
• the yield of commercial logs, • the volume of various forest residues, • the damage of the residual stand caused by felling and skidding operations.
Unfortunately, in many study sites, the logging operations were continued after finishing the field studies. In these cases it was, therefore, not possible to get the final result of the condition of the forest sites which existed after the harvesting operations had been finished.
In GHANA and CAMEROON, both important producers of tropical timber, the selected study sites differ from each other considerably. Therefore, the evaluation of the results had to consider the specific conditions of each study site. In GHANA, the selected study sites were located in moist evergreen forest, moist semi-deciduous forest, and dry semi-deciduous forest, while in CAMEROON, the forest studies were carried out in the Coastal Region, the East Province, and the CENTRE REGION, respectively.
~
The study sites in EAST KALlMANTANIINDONESIA and in SARAWAK/MALAYSIA are located on the . Island of Borneo. They, therefore, show similar vegetation types of the Hill Mixed Dipterocarp Forest sites, where the Dipterocarp species are dominating. The important features characterising the differences between the two SOUTHEAST ASIAN countries INDONESIA and MALAYSIA are forest policy and the forest management system.
60

The only exception in the SOUTHEAST ASIAN Region, where the vegetation is very different from that of the Hill Mixed Dipterocarp Forests,. is the RASAU Swamp Forest of SARAWAK, where Ramal Ramin is the most important timber.
The volume of the extracted logs and that of the wood residues left in the forest as analysed in Table 4-1 (page 54) for GHANA, Table 4-8 (page 58) for CAMEROON, Table 4-16 (page 63) for EAST KALlMANTANI INDONESIA, and Table 4-24 (page 67) for SARAWAK I MALAYSIA is illustrated as part of the total tree volume in the Figures 4-1 to 4-4, respectively.
100%~------Tr------,,-------nr-----~
90%
80%
70%
60%
50%
40%
30%
20%
10%
0%
~-
o crown
I!I stem offcuts
IlIIJjmmtlllll IS! buttress III stump • Extracted loas
Asukese Afram Nkrabia Total
Study Site
100%
90%
80%
70%
60%
-c Gl 50% >=
40%
30%
20%
10%
0%
Tree species
In GHANA, the volume of the extracted logs in relation to the volume of the whole trees including branches with a diameter of 20 cm and more is rather low and ranged between 36 and 52 %, with a total average value of 49 % (Figure 4-1). These values are to some extent comparable to the values which had been obtained by the investigation of only 12 trees in CAMEROON (Figure 4-2), which ranged between 28 and 65 % with an overall average of 46 %, but the volume of the sample of CAMEROON was too small for drawing more far-reaching conclusions.
61

100% 100%
90% 90%
80%
70%
60% 60%
"'C "'C
~ 50% Qj 50% >=
40% 40%
30% 30%
20% 20%
10% 10%
0% 0%
MTI ITCI IHTN Total
Study Site
Tree species
In EAST KALlMANTAN as well as in the DAPOI HILL Dipterocarp Forest of SARAWAK, the .relative volume of the commercial wood, represented by the volume of the extracted log, varies between 60 % and 65 % of the total volume of the tree including all branches with a diameter larger than 20 cm. Only in the second study site of SARAWAK, the MUKAH HILL Forest, the relative volume of the extracted logs was somewhat lower and amounted to about 50 %. Among the forest residues, the branchwood generally shows the highest percentage ranging from 14 % to 27 %.
Quite different conditions exist in the Mixed Swamp· Forest (RASAU Swamp Forest) of SARAWAK, where Ramin is the most important tree species with a very high log yield of about 87 %. The reason for this high yield percentage is the fact that Ramin trees do not have branches with a diameter above 20 cm.
62

100%
90%
80%
70%
60%
""Cl Qi 50% >=
40%
30%
20%
10%
0% Dapa; M ukah
Study Site
4.5.2. Stand Damage by Felling Operations
RASAU RASAU Swamp Ramin Forest without Ramin
Dcrown ~buttress & offcuts EIIlstump .Extracted logs
The disturbance of a logged-over forest stand caused by harvesting operations can be characterised by:
• the size of the felling gaps as well as the damages to the gap areas, and • the size of the skidding tracks as well as forest roads and the damages to the track and
road areas.
These parameters depend strongly on: • the specific local conditions of the individual forest site, • the logging practices, and • the differences in the procedures of survey.
The felling disturbance varies within very wide ranges not only between different tropical countries, but also within a particular country between different forest sites. Even the mean size of the felling gaps in the four countries concerned ranges from about 140 m2/tree in CAMEROON (Centre Region) up to more than 600 m2/tree in GHANA (NKRABIA forest site) (Table 4-29).
63
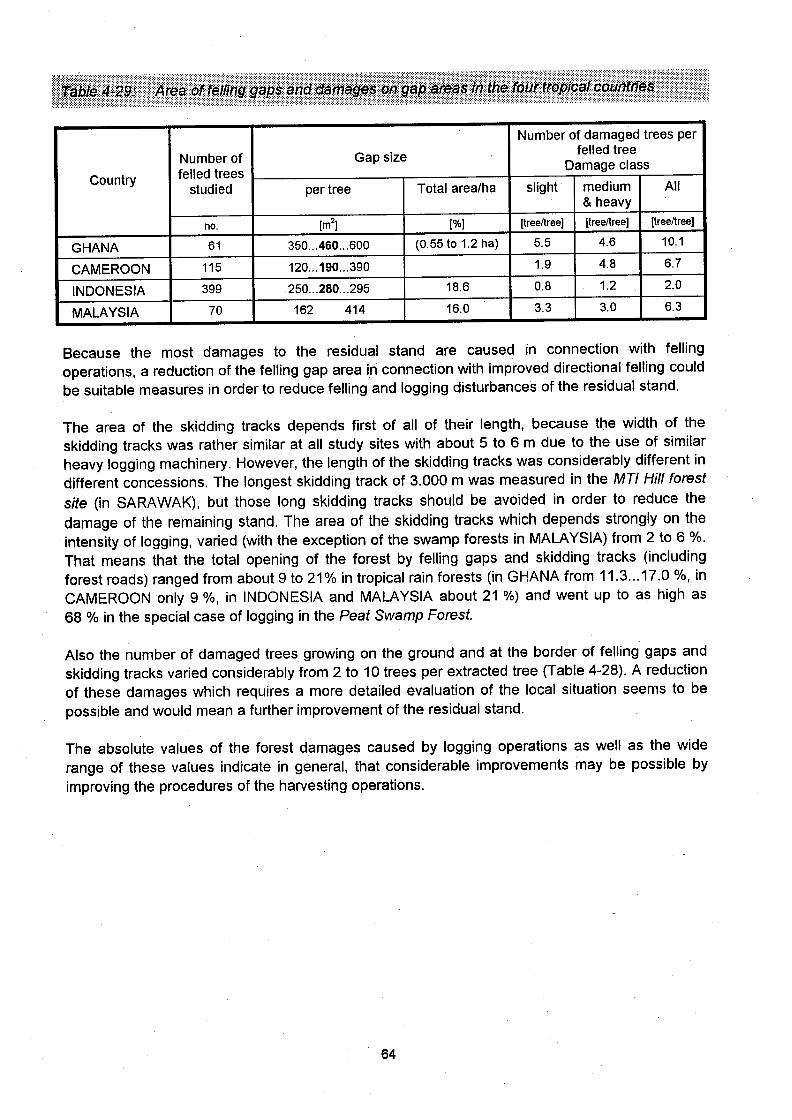
Number of damaged trees per
Number of Gap size felled tree
Country felled trees Damage class
studied per tree Total area/ha slight· medium All & heavy
no. [m2) [%) [tree/tree) [tree/tree) [tree/tree)
GHANA 61 350 ... 460 ... 600 (0.55 to 1.2 ha) 5.5 4.6 10.1
CAMEROON 115 120 ... 190 ... 390 1.9 4.8 6.7
INDONESIA 399 .250 ... 280 ... 295 18.6 0.8 1.2 2.0
MALAYSIA 70 162 414 16.0 3.3 3.0 6.3
Because the most damages to the residual stand are caused in connection with felling operations, a reduction of the felling gap area in connection with improved directional felling could be suitable measures in order to reduce felling and logging disturbances of the residual stand.
The area of the skidding tracks depends first of all of their length, because the width of the skidding tracks was rather similar at all study sites with about 5 to 6 m due to the use of similar heavy logging machinery. However, the length of the skidding tracks was considerably different in different concessions. The longest skidding track of 3.000 m was measured in the MTI Hill forest site (in SARAWAK), but those long skidding tracks should be avoided in order to reduce the damage of the remaining stand. The area of the skidding tracks which depends strongly on the intensity of logging, varied (with the exception of the swamp forests in MALAYSIA) from 2 to 6 %. That means that the total opening of the forest by felling gaps and skidding tracks (including forest roads) ranged from about 9 to 21 % in tropical rain forests (in GHANA from 11.3 ... 17.0 %, in CAMEROON only 9 %, in INDONESIA and MALAYSIA about 21 %) and went up to as high as 68 % in the special case of logging in the Peat Swamp Forest.
Also the number of damaged trees growing on the ground and at the border of felling gaps and skidding tracks varied considerably from 2 to 10 trees per extracted tree (Table 4-28). A reduction of these damages which requires a more detailed evaluation of the local situation seems to be possible and would mean a further improvement of the residual stand.
The absolute values of the forest damages caused by logging operations as well as the wide range of these values indicate in general, that considerable improvements may be possible by improving the procedures of the harvesting operations.
64

5. RECOMMENDATIONS
The sustainable management of tropical forests is one of the major objectives of ITTO. The present practice of harvesting and, particularly, of the felling and skidding operations leads to extensive harvesting disturbance causing irreversible damages to the residual stand. In order to improve the situation and to achieve a fast and complete recovery of the logged over forests, the following measures are recommended:
• To investigate in detail the factors which influence the gap size and the degree of destruction caused by felling operations, e.g. directional felling, in order to reduce their effects.
• To apply a uniform methodology for classifying logging damages in differenttropical·countries. Up to now, even countries with similar forest conditions have different rules and classification systems. The international co-operation on sustainable management of tropical forests requires international rules and standards. ITTO, therefore, should try to achieve an international consensus on the classification of harvesting damages.
• To improve the national forest management systems with regard to the felling and logging operations in order to reduce negative ecological effects. In this respect particular attention should be given to damaged trees belonging to higher diameter classes.
• ITTO and other national and international forestry organisations should promote, support, and co-ordinate approaches and research programmes dealing with the improvement of harvesting methods and reduction of logging disturbance. The improvement of harvesting methods will reduce heavy damages of the residual stand and contribute to the recovery of damaged trees.
65

6. LITERATURE CITED
AARON, A. D. and J.D. MAMIT 1993 Final Report to ITTO PROJECT PD 74/90: "Assessment of Wood Residues and Harvesting Damage in Harvested Forests of SARAWAKI MALAYSIA" Forest Department, Kuching, SARAWAKlMALAYSIA
AHRENHOLZ, T.1991 Die ErschlieBungssituation bei der Nutzung tropischer immergriiner Feuchtwalder in Ostkalimantan, Indonesien - Eine Fallstudie aneinem Beispielbetrieb (Harvesting Situation of Tropical Evergreen Forests in East-Kalimantan, INDONESIA - A Case Study in a Forest Company) Diplomarbeit am Forstwissenschaftlichen Fachbereich der Universitat Gottingen/GERMANY
ANONYMOUS 1985 Pemanfaatan Limbah Eksploitas (Utilisation of Harvesting Residues) Direktorat Pengolahan Hasil Hutan, Departemen Kehutanan, Jakarta Editor Gunarwan Suratmo, Ishemat Soerianegara, Sarajar, G. & Surdiding Ruhendi, Pemanfaatan Limbah Kayu, Fakultas Kehutanan, IPB, BogorllNDONESIA
ANONYMOUS 1990 Studi Identifikasi Pemanfaatan Limbah Penebangan Di Propinsi Kalimantan Timur (Study on the Utilisation of Residues in East-Kalimantan) Hutan, January 1990, Jakarta/INDoNESIA
ANONYMOUS 1992 Lost in the Forest Forest Product Abstracts, 15 (1) [Quoted from "The Economist", 31. August 1991]
BAYENI-LUPEY, G. 1987 Untersuchungen iiber Mengen und Beschaffenheit der Holzreste bei der Rohholzgewinnung und -aufberei-tung in Holzeinschlagsgebieten der VR Kongo . Diplomarbeit an der Technischen Universitat Dresden/GERMANY, 84 pages
BRUENIG, E.F. 1991 Research and Development Programme for Forestry in SARAWAK - A Pilot Model Approach towards Sustainability Forest Management and Economic Development Universitat Hamburg/GERMANY, 26 pages
CHIEW, O.C. 1988 Estimators of Logging Residues and Logging Penalty in the Hill Mixed Dipterocarp Forests Forest Department, Kuching, SARAWAKlMALAYSIA, 14 pages
EISEMANN, K. 1991 Entwicklungsmoglichkeiten der Holzwirtschaft (Industrie und Handwerk) in SARAWAKlMALAYSIA Diplomarbeit an der Universitat Hamburg/GERMANY, 99 pages
FAAKYE, C. Y. 1988 Survey into Logging Waste in Selected Forest Reserves of GHANA, Proposal to Full Tree Utilisation Diploma Thesis, University of Science and Technology, Kumasi/GHANA
FRIMPONG-MENSAH, K. 1989 Requirement of the Timber Industry, GHANA Forestry Inventory Project Seminar Proceedings, GHANA Forestry Department, Accra/GHANA, 70 pages
66

Fox, J. E. D. 1968 Logging Damage and the Influence of Climber Cutting Prior Logging in the Lowland Dipterocarp Forest of Sabah The Malayan Forester 31 (4): 326-347
Fox, J. E. D. 1968 Defect, Damage and Wastage The Malayan Forester 31 (3)
ITTO 1990 The Promotion of Sustainable Forest Management - A Case in SARAWAKlMALAYSIA
ITTO 1992 Better Utilization of Tropical Timber Resources in Order to Improve Sustainability and Reduce Negative Impacts - Wood Residues and Logging Damages in Nkrabia Forest Reserve, GHANA Contribution to ITTO-Project 74/90, Forestry Research Institute, Kumasi/GHANA
ITTO 1994 Better Utilization of Tropical Timber Resources in Order to Improve Sustainability and Reduce Negative Impacts - Contribution Mulawarman University in Samarinda to ITTO-Project 74/90 Samarinda/EAsT KAUMANTANIINDONESIA
KEDE, O. C. SEMEY, and P. LE FANG 1994 Possibilite de Promouvoir une Utilisation ecologiquement Justifee des Forets Tropicales Humides -Contribution to ITTO Project PD 74/90 Ministere de I'Environnment et des Forets, Office Nationale de Development des Forets YAoUNDE/CAMEROON
KORSGAARD;S.1985 Special Study on Forest Management, Afforestation and Utilisation of Forest Resources in the Developing Regions (Asia-Pacific Region), Guidelines for Sustained Yield Management of Mixed Dipterocarp Forests of South East Asia FAO, Bangkok
MALMER, A. and H. GRIP, 1990 Soil Disturbance and Loss of Infiltrability Caused by Mechanised and Manual Extraction of Tropical Rainforest in Sabah, MALAYSIA Forest Ecology and Management, NETHERLANDS
MANGGIL, P. 1980 Report on Logging Residues Study in Some Selected Permanent Hill Mixed Dipterorcarp Forests in SARAWAK Forest Department, Kuching, SARAWAKlMALAYSIA, 22 pages
Ministry of Forestry 1990 Study on the Utilisation of Logging Residues in East Kalimantan, Directorate of Forest Products Utilisation JakartallNDONESIA
Ministry of Forestry 1991 Forestry Statistics of INDONESIA, Secretariat General of Ministry of Forestry, Bureau of Planning JakartallNDONESIA
OFORI, J., A. R. ADAM, and A. OFoso-AsIEDU 1993 Better Utilization of Tropical Timber Resources in Order to Improve Sustainability and Reduce Negative Impacts - Contribution to the ITTO Project PD 74/90 Forestry Research Institute, Kumasi/GHANA
67

OTOO, P. 1978 Logging Wastes on a Felling Area of a Small Scale Logger in GHANA Diploma Thesis, University of Science and Technology, Kumasi/GHANA
RAOTKE, W. 1980 Die Restholzproblematik der PrimalWaldnutzung in Ostkalimantan/lndonesien (Problems of Residues Related to Primary Forest Utilisation in EAST KALlMANTAN/INDONESIA Diplomarbeit an der Forstwissenschaftlichen Fakultat der Universitat Freiburg/GERMANY
RUSLlM, Y. 1992 TropenwalderschlieBung in Indonesien am Beispiel der Forstkonzession PT.ITCI ir:l Ostkalimantan (Forest Harvesting in EAST KALlMANTAN- Study on the Forest Concession PT.ITCI. Magister thesis an dem Forstwissenschaftlichen Fachbereich der UniveriUit Gottingen/GERMANY
* * *
68


Published by
INTERNATIONAL TROPICAL TIMBER ORGANIZATION (IT TO)
INTERNATIONAL ORGANIZATIONS CENTER, 5TH FLOOR
PACIFICO-YOKOHAMA, 1-1-1, MINATO-MIRAI, NISHI-KU, YOKOHAMA, 220-0012 JAPAN
TEL: (81-45) 223-1110, FAX: (81-45) 223-1111, E-mail :itto@mail. itto-unet.ocn.ne.jp http://www.itto.or.jpi
International Tropical Timber Organization (ITTO)

Printed by HAKUSHUDOH PRINTING INC., Japin I Desipd by C.S.L lNc..lapaD