illinois environmental protection agency
TRANSCRIPT
Illinois Environmental Protection Agency Cahokia Canal/Horseshoe Lake Watershed TMDL Stage One Third Quarter Draft Report
April 2006
Draft Report

THIS PAGE INTENTIONALLY LEFT BLANK

Contents
Section 1 Goals and Objectives for Cahokia Canal/Horseshoe Lake Watershed (0714010105, 0714010106, 0714010104)
1.1 Total Maximum Daily Load (TMDL) Overview............................................. 1-1 1.2 TMDL Goals and Objectives for Cahokia Canal/Horseshoe Lake Watershed 1-2 1.3 Report Overview.............................................................................................. 1-4
Section 2 Cahokia Canal/Horseshoe Lake Watershed Description 2.1 Cahokia Canal/Horseshoe Lake Watershed Location...................................... 2-1 2.2 Topography...................................................................................................... 2-1 2.3 Land Use .......................................................................................................... 2-1 2.4 Soils.................................................................................................................. 2-2
2.4.1 Cahokia Canal/Horseshoe Lake Watershed Soil Characteristics....... 2-3 2.5 Population ........................................................................................................ 2-4 2.6 Climate and Streamflow .................................................................................. 2-4
2.6.1 Climate............................................................................................... 2-4 2.6.2 Streamflow......................................................................................... 2-5
Section 3 Public Participation and Involvement 3.1 Cahokia Canal/Horseshoe Lake Watershed Public Participation and
Involvement ..................................................................................................... 3-1
Section 4 Cahokia Canal/Horseshoe Lake Watershed Water Quality Standards 4.1 Illinois Water Quality Standards...................................................................... 4-1 4.2 Designated Uses............................................................................................... 4-1
4.2.1 General Use........................................................................................ 4-1 4.2.2 Public and Food Processing Water Supplies ..................................... 4-1
4.3 Illinois Water Quality Standards...................................................................... 4-1 4.4 Potential Pollutant Sources .............................................................................. 4-3
Section 5 Cahokia Canal/Horseshoe Lake Watershed Characterization 5.1 Water Quality Data .......................................................................................... 5-1
5.1.1 Stream Water Quality Data................................................................ 5-1 5.1.1.1 Fecal Coliform ................................................................. 5-1 5.1.1.2 Dissolved Oxygen............................................................ 5-2 5.1.1.3 Manganese ....................................................................... 5-3
5.1.2 Lake and Reservoir Water Quality Data............................................ 5-3 5.1.2.1 Horseshoe Lake................................................................ 5-3
5.1.2.1.1 Total Phosphorus .......................................... 5-4 5.1.2.1.2 pH ................................................................. 5-5
5.1.2.2 Frank Holten Lakes 1, 2, and 3 ........................................ 5-5
DRAFT i
C:\CAHOKIA\TOC.DOC
Table of Contents Development of Total Maximum Daily Loads Cahokia Canal/Horseshoe Lake Watershed
5.1.2.2.1 Total Phosphorus .......................................... 5-7 5.1.2.2.2 DO................................................................. 5-8
5.2 Reservoir Characteristic................................................................................... 5-8 5.2.1 Horseshoe Lake.................................................................................. 5-8 5.2.2 Frank Holten Lakes 1, 2, and 3 .......................................................... 5-9
5.3 Point Sources ................................................................................................. 5-10 5.3.1 Municipal and Industrial Point Sources........................................... 5-10
5.3.1.1 Cahokia Canal Segment JN 02 ...................................... 5-10 5.3.1.2 Horseshoe Lake Segment RJC....................................... 5-11 5.3.1.3 Harding Ditch Segment JMAC02.................................. 5-11 5.3.1.4 Canteen Creek Segment JNA 01.................................... 5-12 5.3.1.5 Other .............................................................................. 5-12
5.3.2 Mining Discharges ........................................................................... 5-12 5.4 Nonpoint Sources........................................................................................... 5-12
5.4.1 Crop Information ............................................................................. 5-12 5.4.2 Animal Operations ........................................................................... 5-13 5.4.3 Septic Systems ................................................................................. 5-14
5.5 Watershed Studies and Other Watershed Information................................... 5-15
Section 6 Approach to Developing TMDL and Identification of Data Needs 6.1 Simple and Detailed Approaches for Developing TMDLs.............................. 6-1 6.2 Approaches for Developing TMDLs for Stream Segments in the Cahokia
Canal/Horseshoe Lake Watershed ................................................................... 6-1 6.2.1 Recommended Approach for DO TMDLs for Segments with
Major Point Sources........................................................................... 6-1 6.2.2 Recommended Approach for Fecal Coliform TMDLs...................... 6-2 6.2.3 Recommended Approach for Manganese TMDL.............................. 6-3
6.3 Approaches for Developing TMDLs for Lakes and Reservoirs in the Cahokia Canal/Horseshoe Lake Watershed ................................................................... 6-3 6.3.1 Recommended Approach for Total Phosphorus, DO, and pH
TMDLs............................................................................................... 6-3 Appendices Appendix A Land Use Categories Appendix B Soil Characteristics Appendix C Water Quality Data
ii DRAFT
C:\CAHOKIA\TOC.DOC

Figures
1-1 Cahokia Canal/Horseshoe Lake Watershed..................................................... 1-5 2-1 Cahokia Canal/Horseshoe Lake Watershed Elevation .................................... 2-7 2-2 Cahokia Canal/Horseshoe Lake Watershed Land Use .................................... 2-9 2-3 Cahokia Canal/Horseshoe Lake Watershed Soils.......................................... 2-11 5-1 Cahokia Canal/Horseshoe Lake Water Quality Stations............................... 5-17 5-2 Harding Ditch JMAC02 Total Fecal Coliforms ............................................ 5-19 5-3 Cahokia Canal Segment JN02 Dissolved Oxygen Concentrations ............... 5-21 5-4 Canteen Creek JNA01 Total Manganese Concentrations ............................. 5-23 5-5 Horseshoe Lake Average Annual Phosphorus Concentrations at One-
Foot Depth..................................................................................................... 5-25 5-6 Horseshoe Lake Average Annual pH Values................................................ 5-27 5-7 Frank Holten Lakes Annual Average Total Phosphorus Concentrations...... 5-29 5-8 Frank Holten Lake #3 Dissolved Oxygen Concentrations............................ 5-31 5-9 Cahokia Canal/Horseshoe Lake Watershed NPDES Permits ....................... 5-33
DRAFT iii
C:\CAHOKIA\TOC.DOC
List of Figures Development of Total Maximum Daily Loads Cahokia Canal/Horseshoe Lake Watershed
THIS PAGE INTENTIONALLY LEFT BLANK
iv DRAFT
C:\CAHOKIA\TOC.DOC

Tables
1-1 Impaired Water Bodies in Cahokia Canal/Horseshoe Lake Watershed .......... 1-3 2-1 Land Use in Cahokia Canal/Horseshoe Lake Watershed ................................ 2-2 2-2 Average Monthly Climate Data in Cahokia, IL............................................... 2-4 4-1 Summary of Water Quality Standards for Potential Cahokia
Canal/Horseshoe Lake Watershed Lake Impairments..................................... 4-2 4-2 Summary of Water Quality Standards for Potential Cahokia
Canal/Horseshoe Lake Watershed Stream Impairments ................................. 4-2 4-3 Summary of Potential Sources for Cahokia Canal/Horseshoe Lake
Watershed ........................................................................................................ 4-4 5-1 Existing Fecal Coliform Data .......................................................................... 5-2 5-2 Existing Dissolved Oxygen Data for Cahokia Canal/Horseshoe Lake
Watershed Impaired Stream Segments ............................................................ 5-2 5-3 Data Availability for DO Data Needs Analysis and Future Modeling
Efforts .............................................................................................................. 5-3 5-4 Existing Manganese Data ................................................................................ 5-3 5-5 Horseshoe Lake Data Inventory for Impairments............................................ 5-3 5-6 Horseshoe Lake Data Availability for Data Needs Analysis and Future
Modeling Efforts.............................................................................................. 5-4 5-7 Average Total Phosphorus Concentrations (mg/L) in Horseshoe Lake at
One-Foot Depth ............................................................................................... 5-5 5-8 Average pH in Horseshoe Lake ....................................................................... 5-5 5-9 Frank Holten Lakes - Data Inventory for Impairments ................................... 5-5 5-10 Frank Holten Lakes - Data Availability for Data Needs Analysis and
Future Modeling Efforts .................................................................................. 5-6 5-11 Average Total Phosphorus Concentrations (mg/L) in the Frank Holten
Lakes at One-Foot Depth................................................................................. 5-7 5-12 Average Dissolved Oxygen Concentrations (mg/L) in Frank Holten
Lake #3 at One-Foot Depth ............................................................................. 5-8 5-13 Average Depths (ft) for Horseshoe Lake Segment RJC .................................. 5-9 5-14 Frank Holten Lakes.......................................................................................... 5-9 5-15 Average Depths (ft) for Frank Holten Lake No. 1........................................... 5-9 5-16 Average Depths (ft) for Frank Holten Lake No. 2........................................... 5-9 5-17 Average Depths (ft) for Frank Holten Lake No. 3......................................... 5-10 5-18 Effluent Data from Point Sources Discharging Upstream of or Directly
to Cahokia Canal Segment JN 02 .................................................................. 5-11 5-19 Effluent Data from Point Sources Discharging to Horseshoe Lake
Segment RJC.................................................................................................. 5-11 5-20 Effluent Data from Point Sources Discharging to Harding Ditch
Segment JMAC02.......................................................................................... 5-12 5-21 Effluent Data from Point Sources Discharging to Canteen Creek
Segment JNA 01 ............................................................................................ 5-12
DRAFT v
C:\CAHOKIA\TOC.DOC

List of Tables Development of Total Maximum Daily Loads Cahokia Canal/Horseshoe Lake Watershed
5-22 Tillage Practices in Madison County............................................................. 5-13 5-23 Tillage Practices in St. Clair County.............................................................. 5-13 5-24 Tillage Practices in Monroe County .............................................................. 5-13 5-25 Madison County Animal Population ............................................................. 5-13 5-26 St. Clair County Animal Population .............................................................. 5-14 5-27 Monroe County Animal Population............................................................... 5-14 5-28 Estimated Septic Systems in the Cahokia Canal/Horseshoe Lake
Watershed ...................................................................................................... 5-14
vi DRAFT
C:\CAHOKIA\TOC.DOC

Acronyms
°F degrees Fahrenheit BMP best management practice BOD biochemical oxygen demand CBOD5 5-day carbonaceous biochemical oxygen demand cfs cubic feet per second CRP Conservation Reserve Program cfu Coliform forming units CWA Clean Water Act DMR Discharge Monitoring Reports DO dissolved oxygen ft Foot or feet GIS geographic information system HUC Hydrologic Unit Code IDA Illinois Department of Agriculture IDNR Illinois Department of Natural Resources IL-GAP Illinois Gap Analysis Project ILLCP Illinois Interagency Landscape Classification Project Illinois EPA Illinois Environmental Protection Agency INHS Illinois Natural History Survey IPCB Illinois Pollution Control Board LA load allocation LC loading capacity lb/d pounds per day mgd Million gallons per day mg/L milligrams per liter MHP mobile home park mL milliliter MOS margin of safety NA Not applicable NASS National Agricultural Statistics Service NCDC National Climatic Data Center NED National Elevation Dataset NPDES National Pollution Discharge Elimination System NRCS National Resource Conservation Service
DRAFT vii
C:\CAHOKIA\TOC.DOC
List of Acronyms Development of Total Maximum Daily Loads Cahokia Canal/Horseshoe Lake Watershed
PCBs polychlorinated biphenyl PCS Permit Compliance System SOD sediment oxygen demand SSURGO Soil Survey Geographic Database STORET Storage and Retrieval STP Sanitary Treatment Plant SWCD Soil and Water Conservation District TMDL total maximum daily load TSS total suspended solids ug/L Micrograms per liter USEPA U.S. Environmental Protection Agency USGS U.S. Geological Survey WLA waste load allocation WTP Water Treatment Plant
viii DRAFT
C:\CAHOKIA\TOC.DOC

Section 1 Goals and Objectives for Cahokia Canal/ Horseshoe Lake Watershed (0714010105, 0714010106, 0714010104) 1.1 Total Maximum Daily Load (TMDL) Overview A Total Maximum Daily Load, or TMDL, is a calculation of the maximum amount of a pollutant that a water body can receive and still meet water quality standards. TMDLs are a requirement of Section 303(d) of the Clean Water Act (CWA). To meet this requirement, the Illinois Environmental Protection Agency (Illinois EPA) must identify water bodies not meeting water quality standards and then establish TMDLs for restoration of water quality. Illinois EPA lists water bodies not meeting water quality standards every two years. This list is called the 303(d) list and water bodies on the list are then targeted for TMDL development.
In general, a TMDL is a quantitative assessment of water quality problems, contributing sources, and pollution reductions needed to attain water quality standards. The TMDL specifies the amount of pollution or other stressor that needs to be reduced to meet water quality standards, allocates pollution control or management responsibilities among sources in a watershed, and provides a scientific and policy basis for taking actions needed to restore a water body.
Water quality standards are laws or regulations that states authorize to enhance water quality and protect public health and welfare. Water quality standards provide the foundation for accomplishing two of the principal goals of the CWA. These goals are:
Restore and maintain the chemical, physical, and biological integrity of the nation's waters
Where attainable, to achieve water quality that promotes protection and propagation of fish, shellfish, and wildlife, and provides for recreation in and on the water
Water quality standards consist of three elements:
The designated beneficial use or uses of a water body or segment of a water body
The water quality criteria necessary to protect the use or uses of that particular water body
An antidegradation policy
Examples of designated uses are recreation and protection of aquatic life. Water quality criteria describe the quality of water that will support a designated use. Water quality criteria can be expressed as numeric limits or as a narrative statement.
DRAFT 1-1
C:\Cahokia\Sec 1 Cahokia Cl - Horseshoe L.doc

Section 1 Goals and Objectives for Cahokia Canal/Horseshoe Lake Watershed
Antidegradation policies are adopted so that water quality improvements are conserved, maintained, and protected.
1.2 TMDL Goals and Objectives for Cahokia Canal/ Horseshoe Lake Watershed The Illinois EPA has a three-stage approach to TMDL development. The stages are:
Stage 1 – Watershed Characterization, Data Analysis, Methodology Selection
Stage 2 – Data Collection (optional)
Stage 3 – Model Calibration, TMDL Scenarios, Implementation Plan
This report addresses Stage 1 TMDL development for the Cahokia Canal/Horseshoe Lake Watershed. Stage 2 and 3 will be conducted upon completion of Stage 1. Stage 2 is optional as data collection may not be necessary if additional data is not required to establish the TMDL.
Following this process, the TMDL goals and objectives for the Cahokia Canal/ Horseshoe Lake Watershed will include developing TMDLs for all impaired water bodies within the watershed, describing all of the necessary elements of the TMDL, developing an implementation plan for each TMDL, and gaining public acceptance of the process. Following are the impaired water body segments in the Cahokia Canal/Horseshoe Lake Watershed for which a TMDL will be developed:
Cahokia Canal (JN 02)
Horseshoe Lake (Madison) (RJC)
Prairie Du Pont Creek (JMAA01)
Harding Ditch (JMCA02)
Frank Holten Main Lake (RJK)
Frank Holten Lake #2 (RJL)
Frank Holten Lake #3 (RJM)
Canteen Creek (JNA 01)
These impaired water body segments are shown on Figure 1-1. There are 8 impaired segments within the Cahokia Canal/Horseshoe Lake Watershed. Table 1-1 lists the water body segment, water body size, and potential causes of impairment for the water body.
1-2 DRAFT
C:\Cahokia\Sec 1 Cahokia Cl - Horseshoe L.doc

Section 1 Goals and Objectives for Cahokia Canal/Horseshoe Lake Watershed
Table 1-1 Impaired Water Bodies in Cahokia Canal/Horseshoe Lake Watershed
Water Body Segment ID
Water Body Name Size
Causes of Impairment with Numeric Water Quality Standards
Causes of Impairment with Assessment Guidelines
JN 02 Cahokia Canal 11.87 miles
Dissolved oxygen Total nitrogen, sedimentation/siltation, habitat alterations (streams), total phosphorus
RJC Horseshoe Lake
2,107 acres
Total phosphorus, pH Excess algal growth, non-native fish/animals, heptachlor, PCBs, zinc, total phosphorus, total suspended solids (TSS)
JMAA01 Prairie Du Pont Creek
14.34 miles
Dissolved oxygen(1) Total phosphorus
JMAC02 Harding Ditch 10.48 miles
Total fecal coliform
RJK Frank Holten Main Lake
97 acres Total phosphorus TSS, excess algal growth, PCBs, total phosphorus
RJL Frank Holten Lake #2
40 acres Total phosphorus TSS, excess algal growth, PCBs, total phosphorus
RJM Frank Holten Lake #3
80 acres Total phosphorus, dissolved oxygen
TSS, excess algal growth, non-native fish/animals, PCBs, total phosphorus
JNA 01 Canteen Creek
4.31 miles Manganese Total nitrogen, sedimentation/siltation, habitat alterations (streams), TSS, total phosphorus
(1)Data collected in 2005 indicates that Prairiie Du Pont Creek is no longer impaired for dissolved oxygen and the stream will no longer be on the State’s 303(d) list. Therefore, a TMDL for dissolved oxygen is not being developed.
Illinois EPA are currently only developing TMDLs for parameters that have numeric water quality standards, and therefore the remaining sections of this report will focus on the manganese, dissolved oxygen, total phosphorus (numeric standard), pH, and total fecal coliform impairments in the Cahokia Canal/Horseshoe Lake Watershed. For potential causes that do not have numeric water quality standards as noted in Table 1-1, TMDLs will not be developed at this time. However, in the implementation plans completed during Stage 3 of the TMDL, many of these potential causes may be addressed by implementation of controls for the pollutants with water quality standards.
The TMDL for the segments listed above will specify the following elements:
Loading Capacity (LC) or the maximum amount of pollutant loading a water body can receive without violating water quality standards
Waste Load Allocation (WLA) or the portion of the TMDL allocated to existing or future point sources
Load Allocation (LA) or the portion of the TMDL allocated to existing or future nonpoint sources and natural background
DRAFT 1-3
C:\Cahokia\Sec 1 Cahokia Cl - Horseshoe L.doc

Section 1 Goals and Objectives for Cahokia Canal/Horseshoe Lake Watershed
Margin of Safety (MOS) or an accounting of uncertainty about the relationship between pollutant loads and receiving water quality
These elements are combined into the following equation:
TMDL = LC = ΣWLA + ΣLA + MOS The TMDL developed must also take into account the seasonal variability of pollutant loads so that water quality standards are met during all seasons of the year. Also, reasonable assurance that the TMDL will be achieved will be described in the implementation plan. The implementation plan for the Cahokia Canal/Horseshoe Lake Watershed will describe how water quality standards will be attained. This implementation plan will include recommendations for implementing best management practices (BMPs), cost estimates, institutional needs to implement BMPs and controls throughout the watershed, and timeframe for completion of implementation activities.
1.3 Report Overview The remaining sections of this report contain:
Section 2 Cahokia Canal/Horseshoe Lake Watershed Characteristics provides a description of the watershed's location, topography, geology, land use, soils, population, and hydrology
Section 3 Public Participation and Involvement discusses public participation activities that occurred throughout the TMDL development
Section 4 Cahokia Canal/Horseshoe Lake Watershed Water Quality Standards defines the water quality standards for the impaired water body
Section 5 Cahokia Canal/Horseshoe Lake Watershed Characterization presents the available water quality data needed to develop TMDLs, discusses the characteristics of the impaired reservoirs in the watershed, and also describes the point and non-point sources with potential to contribute to the watershed load.
Section 6 Approach to Developing TMDL and Identification of Data Needs makes recommendations for the models and analysis that will be needed for TMDL development and also suggests segments for Stage 2 data collection.
1-4 DRAFT
C:\Cahokia\Sec 1 Cahokia Cl - Horseshoe L.doc

Figure 1-1Cahokia Canal/Horseshoe Lake Watershed
DRAFT
£¤3
£¤203
£¤111
£¤162
£¤15
£¤3
£¤157
£¤163
£¤13
£¤159
£¤161
§̈¦I 270
§̈¦I 255
§̈¦I 64
§̈¦I 55
St. Clair Cnty
Monroe Cnty
Madison CntySt. Clair Cnty
Mississippi River/Missouri State Line
Chai
n of
Roc
ks C
anal
Spar
row C
reek
Palmer Creek Hic
kman
Cre
ek
Dead Creek
Burdick Branch
Horseshoe LakeRJC
Cahokia Canal
JN 02Canteen Creek
JNA01
Harding Ditch
JMAC02
Frank Holten 1, 2, 3RJK, RJL, RJM
Prairie Du Pont Creek
Columbia
Judy's Branch
Pontoon Beach
Centreville
Belleville
Collinsville
Edwardsville
Granite City
Glen Carbon
Millstadt
Venice
Madison
Cahokia
East St. Louis
Sauget
Fairview Heights
Caseyville
Maryville
Fairmont City
Washington Park
Alorton
Dupo
East Carondelet
Long Lake
0 5 102.5 Miles
/
WatershedMunicipality
Lake or ReservoirMajor Stream303(d) Listed WaterbodiesCounty Boundary
LegendInterstateUS and State Highway
Section 1 Goals and Objectives for Cahokia Canal/Horseshoe Lake Watershed
THIS PAGE INTENTIONALLY LEFT BLANK
1-6 DRAFT
C:\Cahokia\Sec 1 Cahokia Cl - Horseshoe L.doc

Section 2 Cahokia Canal/Horseshoe Lake Watershed Description 2.1 Cahokia Canal/Horseshoe Lake Watershed Location The Cahokia Canal/Horseshoe Lake watershed (Figure 1-1) is located in southern Illinois, flows in a southwesterly direction, and drains approximately 181,673 acres within the state of Illinois. Approximately 75,472 acres lie in southwestern Madison County, 97,427 acres lie in western St. Clair County, and 8,775 acres lie in northern Monroe County.
2.2 Topography Topography is an important factor in watershed management because stream types, precipitation, and soil types can vary dramatically by elevation. National Elevation Dataset (NED) coverages containing 30-meter grid resolution elevation data are available from the USGS for each 1:24,000-topographic quadrangle in the United States. Elevation data for the Cahokia Canal/Horseshoe Lake watershed was obtained by overlaying the NED grid onto the GIS-delineated watershed. Figure 2-1 shows the elevations found within the watershed.
Elevation in the Cahokia Canal/Horseshoe Lake watershed ranges from 702 feet above sea level in the headwaters of Cahokia Canal to 374 feet at its most downstream point at the Mississippi River. The absolute elevation change is 26 feet over the approximately 12-mile stream length of Cahokia Canal, which yields a stream gradient of approximately 2.2 feet per mile. Prairie DuPont Creek, located in the southern half of the watershed, yields an absolute elevation change of 262 feet over the approximately 20-mile stream length and a stream gradient of approximately 13.3 feet per mile.
2.3 Land Use Land use data for the Cahokia Canal/Horseshoe Lake watershed were extracted from the Illinois Gap Analysis Project (IL-GAP) Land Cover data layer. IL-GAP was started at the Illinois Natural History Survey (INHS) in 1996, and the land cover layer was the first component of the project. The IL-GAP Land Cover data layer is a product of the Illinois Interagency Landscape Classification Project (IILCP), an initiative to produce statewide land cover information on a recurring basis cooperatively managed by the United States Department of Agriculture National Agricultural Statistics Service (NASS), the Illinois Department of Agriculture (IDA), and the Illinois Department of Natural Resources (IDNR). The land cover data was generated using 30-meter grid resolution satellite imagery taken during 1999 and 2000. The IL-GAP Land Cover data layer contains 23 land cover categories, including detailed classification in the vegetated areas of Illinois. Appendix A contains a complete listing of land cover
DRAFT 2-1
C:\Cahokia\Sec 2 Cahokia Cl - Horseshoe L.doc

Section 2 Cahokia Canal/Horseshoe Lake Watershed Description
categories. (Source: IDNR, INHS, IDA, USDA NASS's 1:100,000 Scale Land Cover of Illinois 1999-2000, Raster Digital Data, Version 2.0, September 2003.)
The land use of the Cahokia Canal/Horseshoe Lake watershed was determined by overlaying the IL-GAP Land Cover data layer onto the GIS-delineated watershed. Table 2-1 contains the land uses contributing to the Cahokia Canal/Horseshoe Lake watershed, based on the IL-GAP land cover categories and also includes the area of each land cover category and percentage of the watershed area. Figure 2-2 illustrates the land uses of the watershed.
The land cover data reveal that approximately 73,373 acres, representing nearly 40 percent of the total watershed area, are devoted to agricultural activities. Corn and soybean farming account for nearly 13 percent and 15 percent of the watershed area, respectively. Urban areas occupy approximately 33 percent of the watershed (about nine percent high density, 17 percent low/medium density, and eight percent urban open space). Upland forests occupy approximately 11 percent of the watershed, and urban open space and wetlands each occupy approximately eight percent. Other land cover categories represent five percent or less of the watershed area.
Table 2-1. Land Use in Cahokia Canal/Horseshoe Lake Watershed
Land Cover Category Area (Acres) Percentage
Corn 22,892 12.6% Soybeans 27,284 15.0% Winter Wheat 3,554 2.0% Other Small Grains & Hay 552 0.3% Winter Wheat/Soybeans 7,651 4.2% Other Agriculture 2,440 1.3% Rural Grassland 9,000 5.0% Upland 19,385 10.7% Forested Areas 5,283 2.9% High Density 15,606 8.6% Low/Medium Density 30,259 16.7% Urban Open Space 14,126 7.8% Wetlands 14,213 7.8% Surface Water 8,591 4.7% Barren & Exposed Land 837 0.4% Total 181,673 100%
1. Forested areas includes partial canopy/savannah upland. 2. Wetlands includes shallow marsh/wet meadow, deep marsh,
seasonally/temporally flooded, floodplain forest, and shallow water.
2.4 Soils Detailed soils data and spatial coverages are available through the Soil Survey Geographic (SSURGO) database for a limited number of counties in Illinois. For SSURGO data, field mapping methods using national standards are used to construct the soil maps. Mapping scales generally range from 1:12,000 to 1:63,360 making SSURGO the most detailed level of NRCS soil mapping.
2-2 DRAFT
C:\Cahokia\Sec 2 Cahokia Cl - Horseshoe L.doc

Section 2 Cahokia Canal/Horseshoe Lake Watershed Description
The Cahokia Canal/Horseshoe Lake Watershed falls within Madison, Monroe and St. Clare Counties. Figure 2-3 displays the SSURGO soil series in the Cahokia Canal/Horseshoe Lake watershed. Attributes of the spatial coverage can be linked to the SSURGO database which provides information on various chemical and physical soil characteristics for each map unit and soil series. Of particular interest for TMDL development are the hydrologic soil groups as well as the K-factor of the Universal Soil Loss Equation. The following sections describe and summarize the specified soil characteristics for the Cahokia Canal/Horseshoe Lake watershed.
2.4.1 Cahokia Canal/Horseshoe Lake Watershed Soil Characteristics Appendix B contains the SSURGO soil series for the Cahokia Canal/Horseshoe Lake Watershed. The table also contains the area, dominant hydrologic soil group, and k-factor range. Each of these characterizations is described in more detail in the following paragraphs. The predominant soil type in the watershed is Darwin Silty Clay on zero to 2 percent slopes followed by Marine Silt Loam on zero to five percent slopes.
Hydrologic soil groups are used to estimate runoff from precipitation. Soils are assigned to one of four groups. They are grouped according to their infiltration rates under saturated conditions during long duration storm events. All four hydrologic soil groups (A, B, C, and D) are found within the Cahokia Canal/Horseshoe Lake watershed with the majority of the watershed falling into category B. Category B soils are defined as "soils having a moderate infiltration rate when thoroughly wet". Category B soils "consist chiefly of moderately deep or deep, moderately well drained or well drained soils that have moderately fine texture to moderately coarse texture". These soils have a moderate rate of water transmission. (NRCS, 2005) A commonly used soil attribute is the K-factor. The K-factor:
Indicates the susceptibility of a soil to sheet and rill erosion by water. (The K-factor) is one of six factors used in the Universal Soil Loss Equation (USLE) to predict the average annual rate of soil loss by sheet and rill erosion. Losses are expressed in tons per acre per year. These estimates are based primarily on percentage of silt, sand, and organic matter (up to 4 percent) and on soil structure and permeability. Values of K range from 0.02 to 0.69. The higher the value, the more susceptible the soil is to sheet and rill erosion by water (NRCS 2005).
The distribution of K-factor values in the Cahokia Canal/Horseshoe Lake watershed range from 0.02 to 0.55.
DRAFT 2-3
C:\Cahokia\Sec 2 Cahokia Cl - Horseshoe L.doc
Section 2 Cahokia Canal/Horseshoe Lake Watershed Description
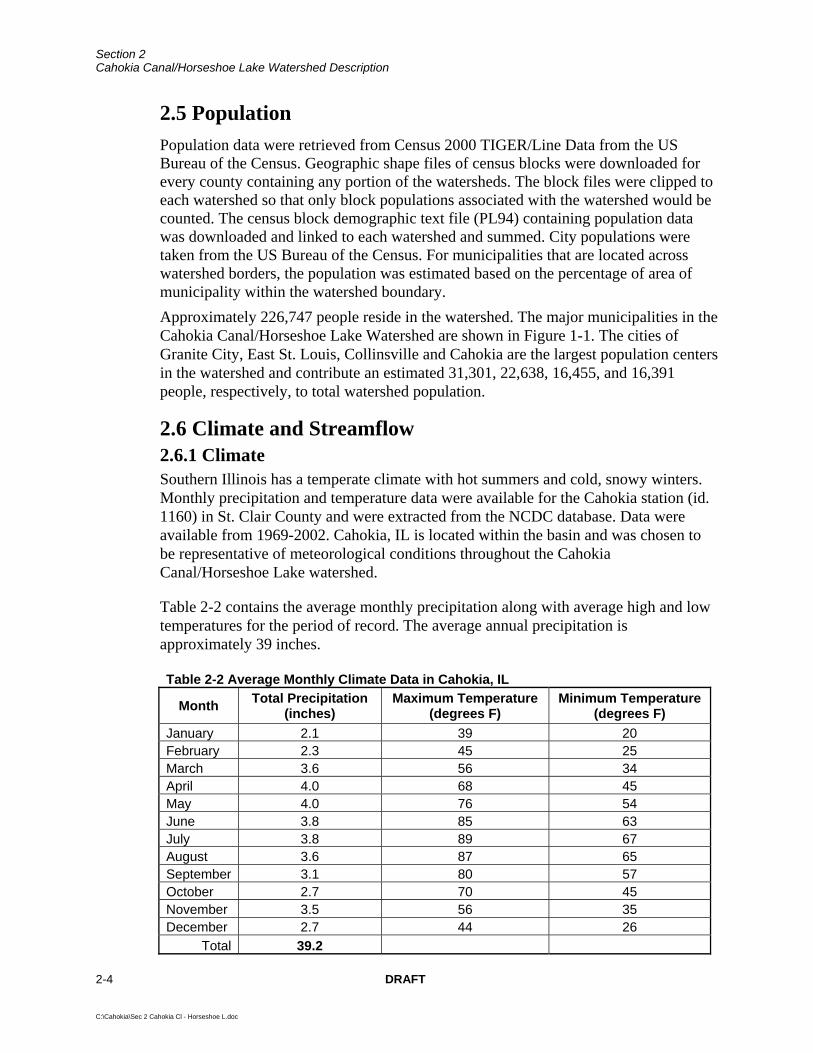
2.5 Population Population data were retrieved from Census 2000 TIGER/Line Data from the US Bureau of the Census. Geographic shape files of census blocks were downloaded for every county containing any portion of the watersheds. The block files were clipped to each watershed so that only block populations associated with the watershed would be counted. The census block demographic text file (PL94) containing population data was downloaded and linked to each watershed and summed. City populations were taken from the US Bureau of the Census. For municipalities that are located across watershed borders, the population was estimated based on the percentage of area of municipality within the watershed boundary. Approximately 226,747 people reside in the watershed. The major municipalities in the Cahokia Canal/Horseshoe Lake Watershed are shown in Figure 1-1. The cities of Granite City, East St. Louis, Collinsville and Cahokia are the largest population centers in the watershed and contribute an estimated 31,301, 22,638, 16,455, and 16,391 people, respectively, to total watershed population.
2.6 Climate and Streamflow 2.6.1 Climate Southern Illinois has a temperate climate with hot summers and cold, snowy winters. Monthly precipitation and temperature data were available for the Cahokia station (id. 1160) in St. Clair County and were extracted from the NCDC database. Data were available from 1969-2002. Cahokia, IL is located within the basin and was chosen to be representative of meteorological conditions throughout the Cahokia Canal/Horseshoe Lake watershed.
Table 2-2 contains the average monthly precipitation along with average high and low temperatures for the period of record. The average annual precipitation is approximately 39 inches.
Table 2-2 Average Monthly Climate Data in Cahokia, IL
Month Total Precipitation (inches)
Maximum Temperature (degrees F)
Minimum Temperature (degrees F)
January 2.1 39 20 February 2.3 45 25 March 3.6 56 34 April 4.0 68 45 May 4.0 76 54 June 3.8 85 63 July 3.8 89 67 August 3.6 87 65 September 3.1 80 57 October 2.7 70 45 November 3.5 56 35 December 2.7 44 26
Total 39.2
2-4 DRAFT
C:\Cahokia\Sec 2 Cahokia Cl - Horseshoe L.doc

Section 2 Cahokia Canal/Horseshoe Lake Watershed Description
2.6.2 Streamflow Analysis of the Cahokia Canal/Horseshoe Lake watershed requires an understanding of flow throughout the drainage area. Unfortunately, there are no USGS gages within the watershed that have current, or even recent, streamflow data. Streamflow values can possibly be collected in the watershed if any Stage 2 data collection occurs or values can be estimated through the drainage area ratio method which assumes that the flow per unit area is equivalent in watersheds with similar characteristics. If new data becomes available, it will be incorporated into Stage 3 TMDL development. In the absence of new data, flows will be estimated from a gage in a neighboring watershed.
DRAFT 2-5
C:\Cahokia\Sec 2 Cahokia Cl - Horseshoe L.doc

Section 2 Cahokia Canal/Horseshoe Lake Watershed Description
THIS PAGE INTENTIONALLY LEFT BLANK
2-6 DRAFT
C:\Cahokia\Sec 2 Cahokia Cl - Horseshoe L.doc

Figure 2-1Cahokia Canal/Horseshoe Lake Watershed
Elevation
DRAFT0 5 102.5 Miles
£¤3
£¤203
£¤111
£¤162
£¤15
£¤3
£¤157
£¤163
£¤13
£¤159
£¤161
§̈¦I 270
§̈¦I 255
§̈¦I 64
§̈¦I 55
St. Clair Cnty
Monroe Cnty
Madison CntySt. Clair Cnty
Mississippi River/Missouri State Line
Chai
n of
Roc
ks C
anal
Spar
row C
reek
Palmer Creek Hic
kman
Cre
ek
Dead Creek
Burdick Branch
Horseshoe LakeRJC
Cahokia Canal
JN 02Canteen Creek
JNA01
Harding Ditch
JMAC02
Frank Holten 1, 2, 3RJK, RJL, RJM
Columbia
Judy's Branch
Pontoon Beach
Belleville
Collinsville
Edwardsville
Granite City
Glen Carbon
Millstadt
Venice
Madison
Cahokia
East St. Louis
Sauget
Fairview Heights
Caseyville
Mississippi River
Prairie Du Pont Creek
Long Lake
/Lake or Reservoir
Legend
County Boundary
303(d) Listed Waterbody
Watershed
Major Stream
InterstateUS and State Highway
Elevation (feet)376 - 400401 - 425426 - 450451 - 475476 - 500501 - 525526 - 550551 - 575576 - 600601 - 625626 - 650651 - 675676 - 702701 - 725
Section 2 Cahokia Canal/Horseshoe Lake Watershed Description
THIS PAGE INTENTIONALLY LEFT BLANK
2-8 DRAFT
C:\Cahokia\Sec 2 Cahokia Cl - Horseshoe L.doc

Figure 2-2Cahokia Canal/Horseshoe Lake Watershed
Land Use
DRAFT0 5 102.5 Miles
£¤3
£¤203
£¤111
£¤162
£¤15
£¤3
£¤157
£¤163
£¤13
£¤159
£¤161
§̈¦I 270
§̈¦I 255
§̈¦I 64
§̈¦I 55
St. Clair Cnty
Monroe Cnty
Madison CntySt. Clair Cnty
Mississippi River/Missouri State Line
Chai
n of
Roc
ks C
anal
Spar
row C
reek
Palmer Creek Hic
kman
Cre
ek
Dead Creek
Burdick Branch
Horseshoe LakeRJC
Cahokia Canal
JN 02Canteen Creek
JNA01
Harding Ditch
JMAC02
Frank Holten 1, 2, 3RJK, RJL, RJM
Columbia
Judy's Branch
Pontoon Beach
Belleville
Collinsville
Edwardsville
Granite City
Glen Carbon
Millstadt
Venice
Madison
Cahokia
East St. Louis
Sauget
Fairview Heights
Caseyville
Mississippi River
Prairie Du Pont Creek
Long Lake
/
Legend
Land CoverCornSoybeansWinter Wheat
Other Small Grains & HayWinter Wheat/SoybeansOther AgricultureRural Grassland
UplandForested AreasHigh Density
Low/Medium DensityUrban Open SpaceWetlandsSurface Water
Barren & Exposed Land
County Boundary
303(d) Listed Waterbody
Watershed
Major Stream
InterstateUS and State Highway

Section 2 Cahokia Canal/Horseshoe Lake Watershed Description
THIS PAGE INTENTIONALLY LEFT BLANK
2-10 DRAFT
C:\Cahokia\Sec 2 Cahokia Cl - Horseshoe L.doc

Figure 2-3Cahokia Canal/Horseshoe Lake Watershed
Soils
DRAFT0 5 102.5 Miles
£¤3
£¤203
£¤111
£¤162
£¤15
£¤3
£¤157
£¤163
£¤13
£¤159
£¤161
§̈¦I 270
§̈¦I 255
§̈¦I 64
§̈¦I 55
St. Clair Cnty
Monroe Cnty
Madison CntySt. Clair Cnty
Mississippi River/Missouri State Line
Chai
n of
Roc
ks C
anal
Spar
row C
reek
Palmer Creek Hic
kman
Cre
ek
Dead Creek
Burdick Branch
Horseshoe LakeRJC
Cahokia Canal
JN 02Canteen Creek
JNA01
Harding Ditch
JMAC02
Frank Holten 1, 2, 3RJK, RJL, RJM
Columbia
Judy's Branch
Pontoon Beach
Belleville
Collinsville
Edwardsville
Granite City
Glen Carbon
Millstadt
Venice
Madison
Cahokia
East St. Louis
Sauget
Fairview Heights
Caseyville
Mississippi River
Prairie Du Pont Creek
Long Lake
1070L
1071A
113A
113B
123
1248A
1591A
165A
2071L
2079D
2079E
216G
2183A
2284A
2304B
2384B
2477B
2592A
267A
267B
283B
283C2
3038B
3070L
3071L
3076A
3092B
3180A
31A
3333A
3334L
3336A
3391A
3394A
3394B
3415A
3592A
35F
3646A
37A
37B
3847L
384A
384B
385A
438B
441B
441C2
466A
46A
477B
477B2
477B3
477C2
477C3
477D3
491B2
5079C
5079D
5079G
50A
515C2
515C3
515D3
517A
517B
533
536
582B
582B2
582C2
630D3
7037A
7037B
7053B
7075B
7081A
7122B
7122C
7150A
7151A
7338A
7430A
7445A
75B
75C
75D
75F
7741B
7741C
79B
79C2
79C3
79D2
79D3
79F
79F3
79G
801B
801D
802B
802D
8038B
8070A
8071L
8078A
8084A
8162A
8180A
8183A
81A
821G
825B
826D
8284A
8302A
8304B
8331A
8333A
8334A
8336A
8338B
8338C
8394A
8394B
8415A
8434B
8457L
8591A
8592A
864
8646A
865
866
8674A
871B
871D
871G
8787A
880B2
8831A
884C3
886F3
897D3
90A
962D2
962F2
962G
M-W
W
/
Lake or Reservoir
Legend
County Boundary
303(d) Listed Waterbody
Watershed
Major Stream
InterstateUS and State Highway
SSURGO Soil Units

Section 2 Cahokia Canal/Horseshoe Lake Watershed Description
THIS PAGE INTENTIONALLY LEFT BLANK
2-12 DRAFT
C:\Cahokia\Sec 2 Cahokia Cl - Horseshoe L.doc

Section 3 Public Participation and Involvement 3.1 Cahokia Canal/Horseshoe Lake Watershed Public Participation and Involvement Public knowledge, acceptance, and follow through are necessary to implement a plan to meet recommended TMDLs. It is important to involve the public as early in the process as possible to achieve maximum cooperation and counter concerns as to the purpose of the process and the regulatory authority to implement any recommendations.
Illinois EPA, along with CDM, will hold up to four public meetings within the watershed throughout the course of the TMDL development. This section will be updated once public meetings have occurred.
DRAFT 3-1
C:\Cahokia\Sec 3 Cahokia Cl - Horseshoe L.doc

Section 3 Public Participation and Involvement
THIS PAGE INTENTIONALLY LEFT BLANK
3-2 FINAL
C:\Cahokia\Sec 3 Cahokia Cl - Horseshoe L.doc
Section 4 Cahokia Canal/Horseshoe Lake Watershed Water Quality Standards 4.1 Illinois Water Quality Standards Water quality standards are developed and enforced by the state to protect the "designated uses" of the state's waterways. In the state of Illinois, setting the water quality standards is the responsibility of the Illinois Pollution Control Board (IPCB). Illinois is required to update water quality standards every three years in accordance with the CWA. The standards requiring modifications are identified and prioritized by Illinois EPA, in conjunction with USEPA. New standards are then developed or revised during the three-year period.
Illinois EPA is also responsible for developing scientifically based water quality criteria and proposing them to the IPCB for adoption into state rules and regulations. The Illinois water quality standards are established in the Illinois Administrative Rules Title 35, Environmental Protection; Subtitle C, Water Pollution; Chapter I, Pollution Control Board; Part 302, Water Quality Standards.
4.2 Designated Uses The waters of Illinois are classified by designated uses, which include: General Use, Public and Food Processing Water Supplies, Lake Michigan, and Secondary Contact and Indigenous Aquatic Life Use (Illinois EPA 2005). The designated uses applicable to the Cahokia Canal/Horseshoe Lake Watershed are the General Use and Public and Food Processing Water Supplies Use.
4.2.1 General Use The General Use classification is defined by IPCB as: The General Use standards will protect the state's water for aquatic life, wildlife, agricultural use, secondary contact use and most industrial uses and ensure the aesthetic quality of the state's aquatic environment. Primary contact uses are protected for all General Use waters whose physical configuration permits such use.
4.2.2 Public and Food Processing Water Supplies The Public and Food Processing Water Supplies Use is defined by IPCB as: These are cumulative with the general use standards of Subpart B and must be met in all waters designated in Part 303 at any point at which water is withdrawn for treatment and distribution as a potable supply or for food processing.
4.3 Illinois Water Quality Standards To make 303(d) listing determinations for aquatic life uses, Illinois EPA first collects biological data and if this data suggests that impairment to aquatic life is occurring, then a comparison of available water quality data with water quality standards occurs.
DRAFT 4-1
C:\Cahokia\Sec 4 Cahokia Cl - Horseshoe L.doc

Section 4 Cahokia Canal/Horseshoe Lake Watershed Water Quality Standards
For public and food processing water supply waters, Illinois EPA compares available data with water quality standards to make impairment determinations. Tables 4-1 and 4-2 present the water quality standards of the potential causes of impairment for both lakes and streams within the Cahokia Canal/Horseshoe Lake Watershed. Only constituents with numeric water quality standards will have TMDLs developed at this time.
Table 4-1 Summary of Water Quality Standards for Potential Cahokia Canal/Horseshoe Lake Watershed Lake Impairments
Parameter Units General Use Water Quality Standard
Public and Food Processing Water Supplies
Excess Algal Growth NA No numeric standard No numeric standard Heptachlor mg/L No numeric standard 0.1 Non-Native Fish/animals NA No numeric standard No numeric standard PCBs - Statistical Guideline
NA No numeric standard No numeric standard
6.5 minimum pH 9.0 maximum
No numeric standard
Total Phosphorus mg/L 0.05(1) No numeric standard
Total Phosphorus - Statistical Guideline
NA No numeric standard No numeric standard
Total Suspended Solids NA No numeric standard No numeric standard Zinc 9000 NA No numeric standard No numeric standard
µg/L = micrograms per liter mg/L = milligrams per liter NA = Not Applicable 1. Standard applies in particular inland lakes and reservoirs (greater than 20 acres) and in any stream at the point where it enters any such lake or reservoir.
Table 4-2 Summary of Water Quality Standards for Potential Cahokia Canal/Horseshoe Lake Watershed Stream Impairments
Parameter Units General Use Water Quality Standard
Public and Food Processing Water Supplies
Habitat Alterations (Streams)
NA No numeric standard No numeric standard
Manganese µg/L 1000 150 5.0 instantaneous
minimum; Oxygen, Dissolved mg/L
6.0 minimum during at least 16 hours of any 24
hour period
No numeric standard
Sedimentation/ Siltation NA No numeric standard No numeric standard
4-2 DRAFT
C:\Cahokia\Sec 4 Cahokia Cl - Horseshoe L.doc

Section 4 Cahokia Canal/Horseshoe Lake Watershed Water Quality Standards
Table 4-2 Summary of Water Quality Standards for Potential Cahokia Canal/Horseshoe Lake Watershed Stream Impairments (continued)
Parameter Units General Use Water Quality Standard
Public and Food Processing Water Supplies
May through Oct – 200(1), 400(2)
Total Fecal Coliform Count/ 100 mL
Nov though Apr – no numeric standard
2000(1)
Total Nitrogen as N NA No numeric standard No numeric standard Total Phosphorus - Statistical Guideline
NA No numeric standard No numeric standard
Total Suspended Solids NA No numeric standard No numeric standard
µg/L = micrograms per liter exp(x) = base natural logarithms raised to the x- power mg/L = milligrams per liter ln(H) = natural logarithm of hardness of the receiving water in mg/L NA = Not Applicable * = conversion factor for multiplier for dissolved metals 1. Geometric mean based on a minimum of 5 samples taken over not more than a 30 day period. 2. Standard shall not be exceeded by more than 10% of the samples collected during any 30 day period
4.4 Potential Pollutant Sources In order to properly address the conditions within the Cahokia Canal/Horseshoe Lake Watershed, potential pollution sources must be investigated for the pollutants where TMDLs will be developed. The following is a summary of the potential sources associated with the listed causes for the 303(d) listed segments in this watershed. They are summarized in Table 4-3.
DRAFT 4-3
C:\Cahokia\Sec 4 Cahokia Cl - Horseshoe L.doc

Section 4 Cahokia Canal/Horseshoe Lake Watershed Water Quality Standards
Table 4-3 Summary of Potential Sources for Cahokia Canal/Horseshoe Lake Watershed Segment ID
Segment Name Potential Causes Potential Sources
JN 02 Cahokia Canal
Total nitrogen as N, sedimentation/siltation, dissolved oxygen, habitat alterations (streams), total phosphorus
Agriculture, crop-related sources, nonirrigated crop production, construction, land development, urban runoff/storm sewers, hydromodification, channelization, source unknown
RJC Horseshoe Lake
Total phosphorus, pH, total suspended solids, excess algal growth, non-native fish/animals, heptachlor, PCBs, zinc, total phosphorus
Industrial point sources, agriculture, crop-related sources, nonirrigated crop production, urban runoff/storm sewers, contaminated sediments, other, source unknown
JMAA01 Prairie Du Pont Creek
Dissolved oxygen, total phosphorus Municipal point sources, agriculture, crop-related sources, nonirrigated crop production, intensive animal feeding operations, urban runoff/storm sewers
JMAC02 Harding Ditch Total fecal coliform Source unknown RJK Frank Holten
Main Lake Total phosphorus, total suspended solids, excess algal growth, PCBs, total phosphorus
Urban runoff/storm sewers, land disposal, onsite wastewater systems (septic tanks), recreation and tourism activities (other than boating), source unknown
RJL Frank Holten Lake #2
Total phosphorus, total suspended solids, excess algal growth, PCBs, total phosphorus
Urban runoff/storm sewers, land disposal, onsite wastewater systems (septic tanks), recreation and tourism activities (other than boating), source unknown
RJM Frank Holten Lake #3
Total phosphorus, dissolved oxygen, total suspended solids, excess algal growth, non-native fish/animals, PCBs, total phosphorus
Urban runoff/storm sewers, land disposal, onsite wastewater systems (septic tanks), other, source unknown
JNA 01 Canteen Creek
Manganese, total nitrogen as N, sedimentation/siltation, habitat alterations (streams), total suspended solids, total phosphorus
Municipal point sources, agriculture, crop-related sources, nonirrigated crop production, construction, land development, urban runoff/storm sewers, hydromodification, channelization, source unknown
4-4 DRAFT
C:\Cahokia\Sec 4 Cahokia Cl - Horseshoe L.doc
Section 5 Cahokia Canal/Horseshoe Lake Watershed Characterization Data was collected and reviewed from many sources in order to further characterize the Cahokia Canal/Horseshoe Lake Watershed. Data has been collected for water quality, reservoirs, and both point and nonpoint sources. This information is presented and discussed in further detail in the remainder of this section.
5.1 Water Quality Data There are 14 historic water quality stations within the Cahokia Canal/Horseshoe Lake Watershed that were used for this report. Figure 5-1 shows the water quality data stations within the watershed that contain data relevant to the impaired segments.
The impaired water body segments in the Cahokia Canal/Horseshoe Lake Watershed were presented in Section 1. Refer to Table 1-1 for impairment information specific to each segment. The following sections address both stream and lake impairments. Data is summarized by impairment and discussed in relation to the relevant Illinois numeric water quality standard. Data analysis is focused on all available data collected since 1990. The information presented in this section is a combination of USEPA Storage and Retrieval (STORET) database and Illinois EPA database data. STORET data is available for stations sampled prior to January 1, 1999 while Illinois EPA data (electronic and hard copy) are available for stations sampled after that date. The following sections will first discuss Cahokia Canal/Horseshoe Lake Watershed stream data followed by Cahokia Canal/Horseshoe Lake Watershed lake/reservoir data.
5.1.1 Stream Water Quality Data The Cahokia Canal/Horseshoe Lake Watershed has four impaired streams within its drainage area that are addressed in this report. There are five active water quality stations on impaired segments (see Figure 5-1). The data summarized in this section include water quality data for impaired constituents as well as parameters that could be useful in future modeling and analysis efforts. All historic data is available in Appendix C.
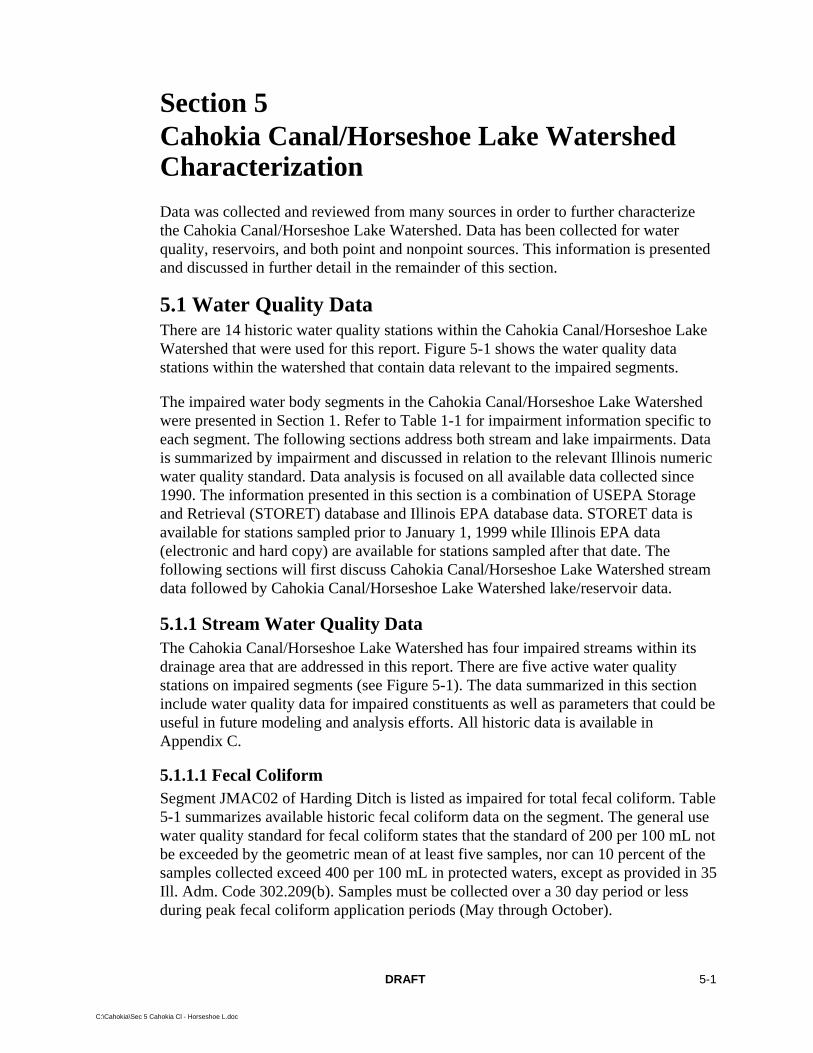
5.1.1.1 Fecal Coliform Segment JMAC02 of Harding Ditch is listed as impaired for total fecal coliform. Table 5-1 summarizes available historic fecal coliform data on the segment. The general use water quality standard for fecal coliform states that the standard of 200 per 100 mL not be exceeded by the geometric mean of at least five samples, nor can 10 percent of the samples collected exceed 400 per 100 mL in protected waters, except as provided in 35 Ill. Adm. Code 302.209(b). Samples must be collected over a 30 day period or less during peak fecal coliform application periods (May through October).
DRAFT 5-1
C:\Cahokia\Sec 5 Cahokia Cl - Horseshoe L.doc

Section 5 Cahokia Canal/Horseshoe Lake Watershed Characterization
There are no instances since 1990 where at least five samples have been collected during a 30-day period. The summary of data presented in Table 5-1 reflects single samples compared to the standards during the appropriate months. Figure 5-2 shows the total fecal coliform samples collected over time on the impaired segment. Data is limited on the segment because samples collected between 1997 and 2003 were omitted due to exceeding the holding time.
Table 5-1 Existing Fecal Coliform Data
Sample Location and Parameter
Period of Record and Number of
Data Points
Geometric mean of all
samples Maximum Minimum
Number of
samples > 200 (1)
Number of
samples > 400 (1)
Harding Ditch Segment JMAC02; Sample Location JMAC02 Total Fecal Coliform (cfu/100 mL)
1990-2004; 73 2,028 20,000 165 37 34
(1) Samples collected during the months of May through October (2) Only two samples were available during the months of May through October
5.1.1.2 Dissolved Oxygen Segment JN02 of Cahokia Canal and JMAA01 of Prairie Du Pont Creek are currently listed as impaired for dissolved oxygen (DO). Recent data collected on segment JMAA01 show that a DO impairment no longer exists. In the summer of 2005 3-day continuous DO monitoring data was taken at half-hour intervals on three different locations on the stream segment. There were no violations in this data, and therefore, this segment will be delisted for DO in the future when new assessments are made. Table 5-2 summarizes the available historic DO data since 1990 for Segment JN02 of Cahokia Canal (raw data contained in Appendix C). The table also shows the number of violations recorded on the segment. A sample was considered a violation if it was below 5.0 mg/L. Figure 5-3 shows the instantaneous DO concentrations over time on the Cahokia Canal.
Table 5-2 Existing Dissolved Oxygen Data for Cahokia Canal/Horseshoe Lake Watershed Impaired Stream Segments
Sample Location and Parameter
Illinois WQ Standard
(mg/L)
Period of Record and Number of Data Points Mean Maximum Minimum
Number of Violations
Cahokia Canal Segment JN02; Sample Location JN02 DO 5.0(1) 1990-2003; 126 8.2 13.9 2.3 16 (1) Instantaneous Minimum Table 5-3 contains information on data availability for other parameters that may be useful in data needs analysis and future modeling efforts for DO. Where available, all nutrient, biological oxygen demand (BOD), and total organic carbon data has been collected for possible use in future analysis.
5-2 DRAFT
C:\Cahokia\Sec 5 Cahokia Cl - Horseshoe L.doc
Section 5 Cahokia Canal/Horseshoe Lake Watershed Characterization
Table 5-3 Data Availability for DO Data Needs Analysis and Future Modeling Efforts
Sample Location and Parameter Available Period of Record Post 1990
Number of Samples
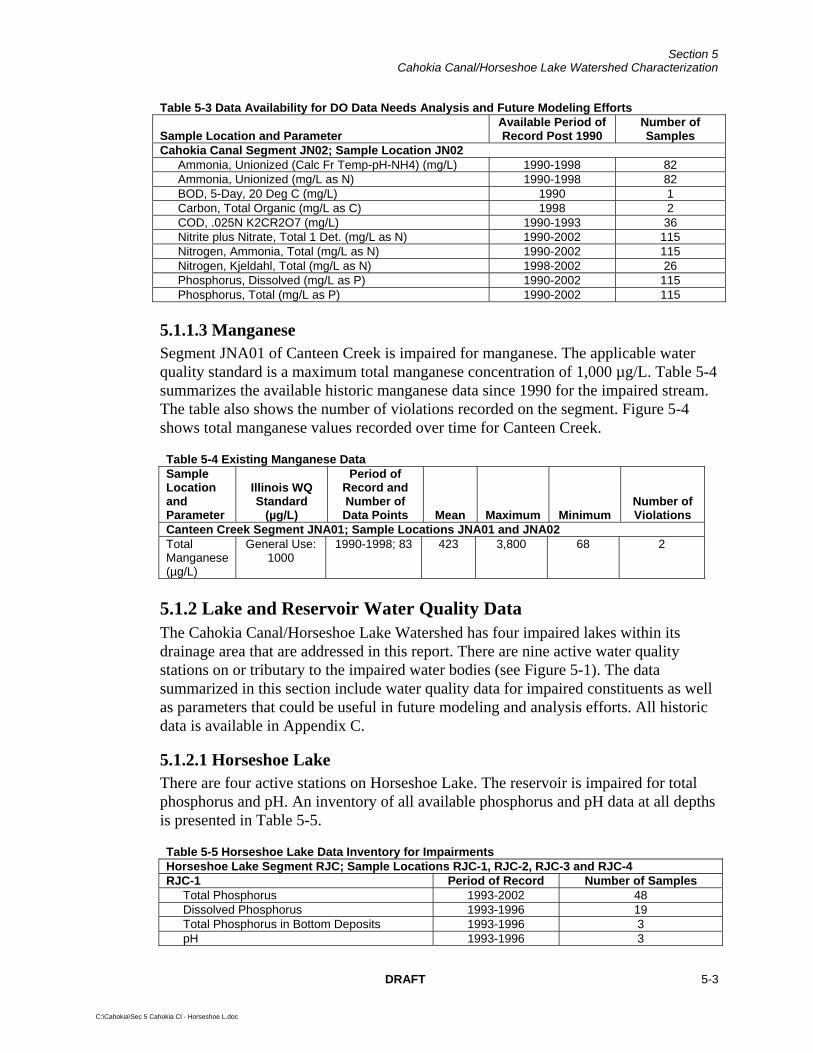
Cahokia Canal Segment JN02; Sample Location JN02 Ammonia, Unionized (Calc Fr Temp-pH-NH4) (mg/L) 1990-1998 82 Ammonia, Unionized (mg/L as N) 1990-1998 82 BOD, 5-Day, 20 Deg C (mg/L) 1990 1 Carbon, Total Organic (mg/L as C) 1998 2 COD, .025N K2CR2O7 (mg/L) 1990-1993 36 Nitrite plus Nitrate, Total 1 Det. (mg/L as N) 1990-2002 115 Nitrogen, Ammonia, Total (mg/L as N) 1990-2002 115 Nitrogen, Kjeldahl, Total (mg/L as N) 1998-2002 26 Phosphorus, Dissolved (mg/L as P) 1990-2002 115 Phosphorus, Total (mg/L as P) 1990-2002 115 5.1.1.3 Manganese Segment JNA01 of Canteen Creek is impaired for manganese. The applicable water quality standard is a maximum total manganese concentration of 1,000 µg/L. Table 5-4 summarizes the available historic manganese data since 1990 for the impaired stream. The table also shows the number of violations recorded on the segment. Figure 5-4 shows total manganese values recorded over time for Canteen Creek.
Table 5-4 Existing Manganese Data Sample Location and Parameter
Illinois WQ Standard
(µg/L)
Period of Record and Number of Data Points Mean Maximum Minimum
Number of Violations
Canteen Creek Segment JNA01; Sample Locations JNA01 and JNA02 Total Manganese (µg/L)
General Use: 1000
1990-1998; 83 423 3,800 68 2
5.1.2 Lake and Reservoir Water Quality Data The Cahokia Canal/Horseshoe Lake Watershed has four impaired lakes within its drainage area that are addressed in this report. There are nine active water quality stations on or tributary to the impaired water bodies (see Figure 5-1). The data summarized in this section include water quality data for impaired constituents as well as parameters that could be useful in future modeling and analysis efforts. All historic data is available in Appendix C.
5.1.2.1 Horseshoe Lake There are four active stations on Horseshoe Lake. The reservoir is impaired for total phosphorus and pH. An inventory of all available phosphorus and pH data at all depths is presented in Table 5-5.
Table 5-5 Horseshoe Lake Data Inventory for Impairments Horseshoe Lake Segment RJC; Sample Locations RJC-1, RJC-2, RJC-3 and RJC-4 RJC-1 Period of Record Number of Samples Total Phosphorus 1993-2002 48 Dissolved Phosphorus 1993-1996 19 Total Phosphorus in Bottom Deposits 1993-1996 3 pH 1993-1996 3
DRAFT 5-3
C:\Cahokia\Sec 5 Cahokia Cl - Horseshoe L.doc

Section 5 Cahokia Canal/Horseshoe Lake Watershed Characterization
Table 5-5 Horseshoe Lake Data Inventory for Impairments (continued) Horseshoe Lake Segment RJC; Sample Locations RJC-1, RJC-2, RJC-3 and RJC-4 RJC-2 Period of Record Number of Samples Total Phosphorus 1993-2002 20 Dissolved Phosphorus 1993-1996 10 pH 1993-2002 19 RJC-3 Total Phosphorus 1993-2002 21 Dissolved Phosphorus 1993-1996 11 Total Phosphorus in Bottom Deposits 1993-1996 3 pH 1993-2002 20 RJC-4 Total Phosphorus 1993-2002 19 Dissolved Phosphorus 1993-1996 10 pH 1993-2002 19
Table 5-6 contains information on data availability for other parameters that may be useful in data needs analysis and future modeling efforts for total phosphorus. DO at varying depths as well as chlorophyll-a data has been collected where available.
Table 5-6 Horseshoe Lake Data Availability for Data Needs Analysis and Future Modeling Efforts Horseshoe Lake Segment RJC; Sample Locations RJC-1, RJC-2, RJC-3 and RJC-4 RJC-1 Period of Record Number of Samples Chlorophyll-a Corrected 1993-2002 28 Chlorophyll-a Uncorrected 1993-2002 28 Total Depth 1993-2002 679 Dissolved Oxygen 1993-2002 598 Temperature 1993-2002 598 RJC-2 Chlorophyll-a Corrected 1993-2002 18 Chlorophyll-a Uncorrected 1993-2002 18 Total Depth 1993-2002 120 Dissolved Oxygen 1993-2002 48 Temperature 1993-2002 19 RJC-3 Chlorophyll-a Corrected 1993-2002 18 Chlorophyll-a Uncorrected 1993-2002 18 Total Depth 1993-2002 135 Dissolved Oxygen 1993-2002 60 Temperature 1993-2002 20 RJC-4 Chlorophyll-a Corrected 1993-2002 18 Chlorophyll-a Uncorrected 1993-2002 18 Total Depth 1993-2005 114 Dissolved Oxygen 1993-2005 41 Temperature 1993-2002 19
5.1.2.1.1 Total Phosphorus Compliance with the total phosphorus standard is based on samples collected at a one-foot depth from the lake surface. The average total phosphorus concentrations at a one-foot depth for each year of available data at each monitoring site in Horseshoe Lake are presented in Table 5-7. The water quality standard for total phosphorus is a concentration less than or equal to 0.05 mg/L.
5-4 DRAFT
C:\Cahokia\Sec 5 Cahokia Cl - Horseshoe L.doc

Section 5 Cahokia Canal/Horseshoe Lake Watershed Characterization
Table 5-7 Average Total Phosphorus Concentrations (mg/L) in Horseshoe Lake at One-Foot Depth RJC-1 RJC-2 RJC-3 RJC-4 Lake Average
Year
Data Count;
Number of Violations Average
Data Count;
Number of Violations Average
Data Count;
Number of Violations Average
Data Count; Number of Violations Average
Data Count;
Number of Violations Average
1993 5;4 0.11 5;4 0.14 5;4 0.09 5;4 0.16 20;16 0.13 1996 5;5 0.15 5;5 0.22 5;5 0.14 5;5 0.22 20;20 0.18 1997 5;5 0.18 NA NA NA NA NA NA 5;5 0.18 1998 5;5 0.14 NA NA NA NA NA NA 5;5 0.14 1999 5;5 0.25 5;5 0.10 5;4 0.25 5;5 0.29 20;19 0.22 2002 4;4 0.15 4;4 0.40 4;4 0.17 4;4 0.26 16;16 0.25
The annual averages for total phosphorus at all four sites where data was available as well as the lake average have been greater than the 0.05 mg/L standard. The majority of the samples taken at all sites have been above the standard. Figure 5-5 shows the average values by year.
5.1.2.1.2 pH Table 5-8 summarizes the available historic pH data since 1990 for the lake. The table also shows the number of violations for each segment. A sample was considered a violation if the value was not within the 6.5-9.0 pH range.
Table 5-8 Average pH in Horseshoe Lake RJC-1 RJC-2 RJC-3 RJC-4 Lake Average
Year
Data Count;
Number of Violations Average
Data Count;
Number of Violations Average
Data Count;
Number of Violations Average
Data Count; Number of Violations Average
Data Count;
Number of Violations Average
1993 9;0 7.87 5;0 8.18 6;0 8.25 5;1 8.36 25;1 8.16 1996 10;0 7.90 5;0 8.82 5;1 8.90 5;0 8.82 20;1 8.61 1999 10;0 7.75 5;0 8.62 5;1 8.84 5;0 8.72 20;1 8.48 2002 8;1 7.43 4;0 8.70 4;1 8.78 4;0 8.85 20;2 8.44
The average pH concentration was within the standard range at all locations. One violation occurred when pH values where sampled below 6.5. That sample was collected in 2002 at RJC-1. The remaining violations occurred when samples were above 9.0. Figure 5-6 shows the average annual pH values.
5.1.2.2 Frank Holten Lakes 1, 2, and 3 There are five active stations on the Frank Holten Lakes. The lakes are impaired for total phosphorus and Lake 3 is also impaired for DO. An inventory of all available phosphorus data for each lake as well as DO data for Lake 3 at all depths is presented in Table 5-9.
Table 5-9 Frank Holten Lakes - Data Inventory for Impairments Frank Holten Lakes 1, 2, and 3 – Segments RJK, RJL, and RJM
RJK-1 Period of Record Number of Samples
Total Phosphorus 1990-2002 89 Dissolved Phosphorus 1990-2002 21
DRAFT 5-5
C:\Cahokia\Sec 5 Cahokia Cl - Horseshoe L.doc

Section 5 Cahokia Canal/Horseshoe Lake Watershed Characterization
Table 5-9 Frank Holten Lakes - Data Inventory for Impairments (continued) Frank Holten Lakes 1, 2, and 3 – Segments RJK, RJL, and RJM
RJL-1 Period of Record Number of Samples
Total Phosphorus 1990-2002 104 Dissolved Phosphorus 1990-2002 88 Total Phosphorus in Bottom Deposits 1992-1996 3 RJM-1 Total Phosphorus 1990-2002 201 Dissolved Phosphorus 1990-2002 113 Total Phosphorus in Bottom Deposits 1992-1996 6 Dissolved Oxygen 1990-2002 388 RJM-2 Total Phosphorus 1990-2002 84 Dissolved Phosphorus 1990-2002 76 Dissolved Oxygen 1990-2002 378 RJM-3 Total Phosphorus 1990-2002 100 Dissolved Phosphorus 1990-2002 76 Total Phosphorus in Bottom Deposits 1992-1996 4 Dissolved Oxygen 1990-2002 332
Table 5-10 contains information on data availability for other parameters that may be useful in data needs analysis and future modeling efforts for total phosphorus and DO. DO and chlorophyll-a data has been collected where available for phosphorus impairments while nutrient data has been collected for the DO impairment.
Table 5-10 Frank Holten Lakes -Data Availability for Data Needs Analysis and Future Modeling Efforts Frank Holten Lakes 1, 2, and 3 – Segments RJK, RJL, and RJM RJK-1 Period of Record Number of Samples Chlorophyll-a Corrected 1996-2002 29 Chlorophyll-a Uncorrected 1996-2002 29 Total Depth 1990-2002 290 Dissolved Oxygen 1999-2002 80 Temperature 1990-2002 21 RJL-1 Chlorophyll-a Corrected 1990-2002 42 Chlorophyll-a Uncorrected 1990-2002 42 Depth of Pond or Reservoir in Feet 1990-2002 369 Oxygen, Dissolved, Analysis by Probe (mg/L) 1999-2002 115 Temperature 1990-2002 88 RJM-1
Ammonia, Unionized (Calc Fr Temp-pH-NH4) (mg/L) 1990-1996 80 Ammonia, Unionized (mg/L as N) 1990-1996 80 Chlorophyll-a Corrected 1990-2002 74 Chlorophyll-a Uncorrected 1990-2002 74 COD, .025N K2CR2O7 (mg/L) 1990-1992 100 Depth of Pond or Reservoir in Feet 1990-2002 312 Nitrite plus Nitrate, Total 1 Det. (mg/L as N) 1990-1996 184 Nitrogen, Ammonia, Total (mg/L as N) 1990-1996 182 Nitrogen, Kjeldahl, Total (mg/L as N) 1990-1996 146 Dissolved Oxygen, % of Saturation 1990-1996 344 Temperature 1990-2002 388
5-6 DRAFT
C:\Cahokia\Sec 5 Cahokia Cl - Horseshoe L.doc

Section 5 Cahokia Canal/Horseshoe Lake Watershed Characterization
Table 5-10 Frank Holten Lakes -Data Availability for Data Needs Analysis and Future Modeling Efforts (continued) Frank Holten Lakes 1, 2, and 3 – Segments RJK, RJL, and RJM RJM-2
Ammonia, Unionized (Calc Fr Temp-pH-NH4) (mg/L) 1990-1996 66 Ammonia, Unionized (mg/L as N) 1990-1996 66 Chlorophyll-a Corrected 1990-2002 78 Chlorophyll-a Uncorrected 1990-2002 78 COD, .025N K2CR2O7 (mg/L) 1990-1992 56 Depth of Pond or Reservoir in Feet 1990-2002 264 Nitrite plus Nitrate, Total 1 Det. (mg/L as N) 1990-1996 74 Nitrogen, Ammonia, Total (mg/L as N) 1990-1996 74 Nitrogen, Kjeldahl, Total (mg/L as N) 1990-1996 66 Dissolved Oxygen, % of Saturation 1990-1996 338
Temperature 1990-2002 378 RJM-3 Ammonia, Unionized (Calc Fr Temp-pH-NH4)
(mg/L) 1990-1996 66
Ammonia, Unionized (mg/L as N) 1990-1996 66 Chlorophyll-a Corrected 1990-2002 74 Chlorophyll-a Uncorrected 1990-2002 74 COD, .025N K2CR2O7 (mg/L) 1990-1992 56 Depth of Pond or Reservoir in Feet 1990-2002 236 Nitrite plus Nitrate, Total 1 Det. (mg/L as N) 1990-1996 90 TKN Bottom Deposits 1992-1996 4 Nitrogen, Ammonia, Total (mg/L as N) 1990-1996 90 Nitrogen, Kjeldahl, Total (mg/L as N) 1990-1996 66 Temperature 1990-2002 332 5.1.2.2.1 Total Phosphorus The average total phosphorus concentrations at a one-foot depth for each year of available data at each monitoring site in the Frank Holten Lakes are presented in Table 5-11. The water quality standard for total phosphorus is a concentration less than or equal to 0.05 mg/L and compliance is assessed at a one-foot depth from the lake surface.
Table 5-11 Average Total Phosphorus Concentrations (mg/L) in the Frank Holten Lakes at One-Foot Depth RJK-1 RJL-1 RJM-1 RJM-2 RJM-3
Year
Data Count;
Number of Violations Average
Data Count;
Number of Violations Average
Data Count;
Number of Violations Average
Data Count; Number of Violations Average
Data Count;
Number of Violations Average
1990 21; 21 0.44 16; 15 0.14 64; 64 0.15 24; 24 0.15 24; 24 0.17 1991 7; 7 0.20 23; 23 0.16 50; 50 0.17 22; 22 0.15 46; 46 0.19 1992 24; 24 0.37 8; 8 0.15 38; 38 0.16 16; 16 0.11 10; 10 0.16 1996 6; 5 0.11 5; 5 0.15 10; 10 0.16 12; 12 0.17 10; 10 0.22 1997 6; 6 0.16 NA NA NA NA NA NA NA NA 1998 5; 5 0.15 NA NA NA NA NA NA NA NA 1999 5; 5 0.06 5; 5 0.06 5; 5 0.10 5; 5 0.11 5; 5 0.12 2002 5; 5 0.14 5; 5 0.15 5; 5 0.21 5; 5 0.23 5; 5 0.26
Only one sample collected was below the phosphorus standard on both Frank Holten Lake 1 (RJK) and 2 (RJL). No samples have been below the 0.05 mg/L total phosphorus standard on Frank Holten Lake 3 (RJM). Figure 5-7 shows the annual
DRAFT 5-7
C:\Cahokia\Sec 5 Cahokia Cl - Horseshoe L.doc
Section 5 Cahokia Canal/Horseshoe Lake Watershed Characterization
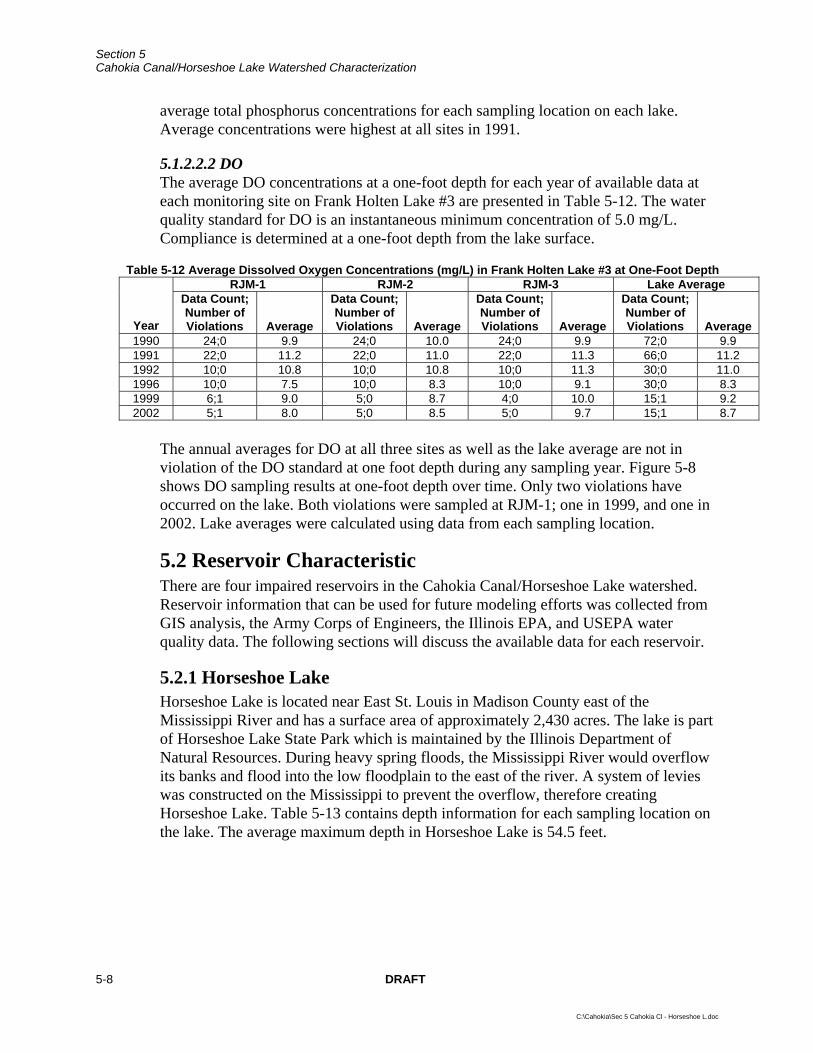
average total phosphorus concentrations for each sampling location on each lake. Average concentrations were highest at all sites in 1991.
5.1.2.2.2 DO The average DO concentrations at a one-foot depth for each year of available data at each monitoring site on Frank Holten Lake #3 are presented in Table 5-12. The water quality standard for DO is an instantaneous minimum concentration of 5.0 mg/L. Compliance is determined at a one-foot depth from the lake surface.
Table 5-12 Average Dissolved Oxygen Concentrations (mg/L) in Frank Holten Lake #3 at One-Foot Depth RJM-1 RJM-2 RJM-3 Lake Average
Year
Data Count; Number of Violations Average
Data Count; Number of Violations Average
Data Count; Number of Violations Average
Data Count; Number of Violations Average
1990 24;0 9.9 24;0 10.0 24;0 9.9 72;0 9.9 1991 22;0 11.2 22;0 11.0 22;0 11.3 66;0 11.2 1992 10;0 10.8 10;0 10.8 10;0 11.3 30;0 11.0 1996 10;0 7.5 10;0 8.3 10;0 9.1 30;0 8.3 1999 6;1 9.0 5;0 8.7 4;0 10.0 15;1 9.2 2002 5;1 8.0 5;0 8.5 5;0 9.7 15;1 8.7
The annual averages for DO at all three sites as well as the lake average are not in violation of the DO standard at one foot depth during any sampling year. Figure 5-8 shows DO sampling results at one-foot depth over time. Only two violations have occurred on the lake. Both violations were sampled at RJM-1; one in 1999, and one in 2002. Lake averages were calculated using data from each sampling location.
5.2 Reservoir Characteristic There are four impaired reservoirs in the Cahokia Canal/Horseshoe Lake watershed. Reservoir information that can be used for future modeling efforts was collected from GIS analysis, the Army Corps of Engineers, the Illinois EPA, and USEPA water quality data. The following sections will discuss the available data for each reservoir.
5.2.1 Horseshoe Lake Horseshoe Lake is located near East St. Louis in Madison County east of the Mississippi River and has a surface area of approximately 2,430 acres. The lake is part of Horseshoe Lake State Park which is maintained by the Illinois Department of Natural Resources. During heavy spring floods, the Mississippi River would overflow its banks and flood into the low floodplain to the east of the river. A system of levies was constructed on the Mississippi to prevent the overflow, therefore creating Horseshoe Lake. Table 5-13 contains depth information for each sampling location on the lake. The average maximum depth in Horseshoe Lake is 54.5 feet.
5-8 DRAFT
C:\Cahokia\Sec 5 Cahokia Cl - Horseshoe L.doc

Section 5 Cahokia Canal/Horseshoe Lake Watershed Characterization
Table 5-13 Average Depths (ft) for Horseshoe Lake Segment RJC (Illinois EPA 2002 and USEPA 2002a)
Year RJC-1 RJC-2 RJC-3 RJC-4 1993 54.5 3.8 9.4 2.1 1996 53.0 3.4 4.5 2.9 1997 10.9 3.5 3.6 8.1 1998 14.5 4.2 4.8 4.0 1999 60.0 3.5 4.0 2.5 2002 59.1 3.7 4.8 2.9 2005 – – – 2.0
Average 54.5 3.8 9.4 2.1 5.2.2 Frank Holten Lakes 1, 2, and 3 The Frank Holten Lakes are located in East St. Louis in St. Clair County. All three lakes are located within the Frank Holten State Park, which is maintained by the Illinois Department of Natural Resources. Table 5-14 contains lake information for each lake.
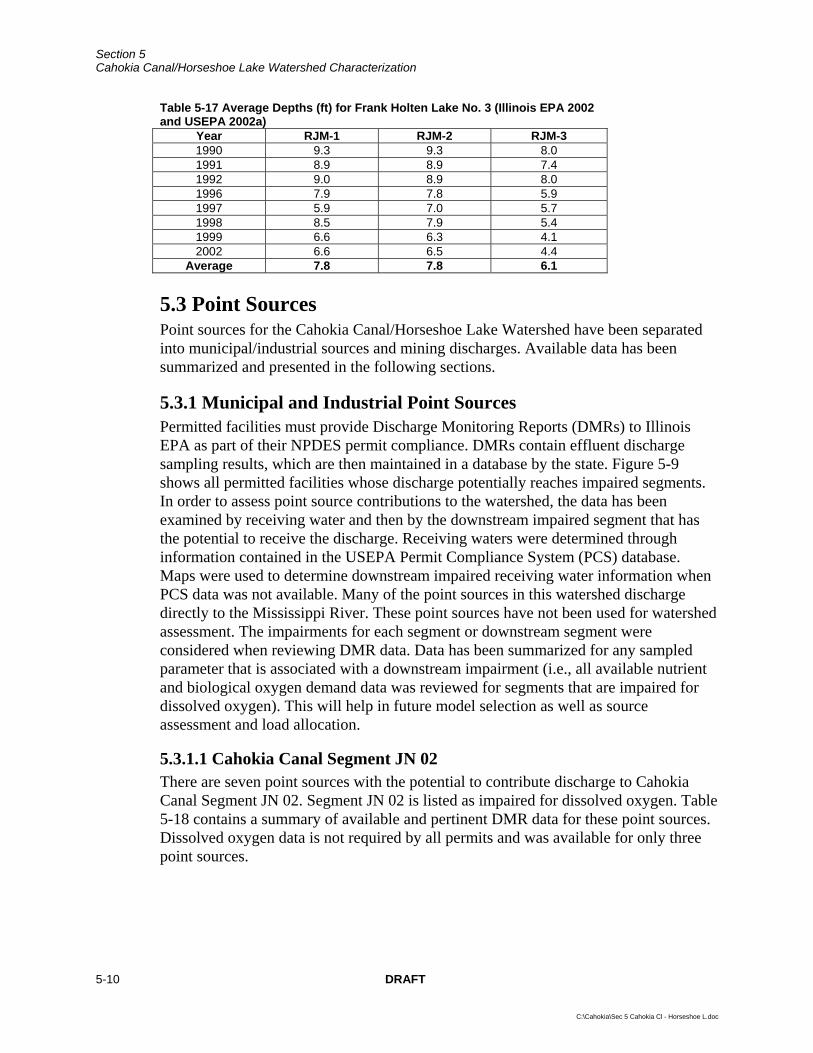
Table 5-14 Frank Holten Lakes Lake No. 1 Lake No. 2 Lake No. 3 Surface Area (acres) 97 40 80 Capacity (acre-feet) 500 NA 92.4 Shoreline (miles) 2.5 NA 2 Tables 5-15, -16, and -17 contain depth information for each sampling location on the lakes. The maximum water depths for Frank Holten Lakes No. 1, No. 2, and No. 3 are 13.0 feet, 21.1 feet, and 7.8 feet respectively.
Table 5-15 Average Depths (ft) for Frank Holten Lake No. 1 (Illinois EPA 2002 and USEPA 2002a)
Year RJK-1 1990 13.7 1991 15.5 1992 13.2 1996 11.3 1997 6.7 1998 8.6 1999 17.1 2002 17.5
Average 13.0 Table 5-16 Average Depths (ft) for Frank Holten Lake No. 2 (Illinois EPA 2002 and USEPA 2002a)
Year RJL-1 1990 23.5 1991 23.6 1992 23.1 1996 15.8 1999 19.7 2002 21.4
Average 21.2
DRAFT 5-9
C:\Cahokia\Sec 5 Cahokia Cl - Horseshoe L.doc
Section 5 Cahokia Canal/Horseshoe Lake Watershed Characterization
Table 5-17 Average Depths (ft) for Frank Holten Lake No. 3 (Illinois EPA 2002 and USEPA 2002a)
Year RJM-1 RJM-2 RJM-3 1990 9.3 9.3 8.0 1991 8.9 8.9 7.4 1992 9.0 8.9 8.0 1996 7.9 7.8 5.9 1997 5.9 7.0 5.7 1998 8.5 7.9 5.4 1999 6.6 6.3 4.1 2002 6.6 6.5 4.4
Average 7.8 7.8 6.1 5.3 Point Sources Point sources for the Cahokia Canal/Horseshoe Lake Watershed have been separated into municipal/industrial sources and mining discharges. Available data has been summarized and presented in the following sections.
5.3.1 Municipal and Industrial Point Sources Permitted facilities must provide Discharge Monitoring Reports (DMRs) to Illinois EPA as part of their NPDES permit compliance. DMRs contain effluent discharge sampling results, which are then maintained in a database by the state. Figure 5-9 shows all permitted facilities whose discharge potentially reaches impaired segments. In order to assess point source contributions to the watershed, the data has been examined by receiving water and then by the downstream impaired segment that has the potential to receive the discharge. Receiving waters were determined through information contained in the USEPA Permit Compliance System (PCS) database. Maps were used to determine downstream impaired receiving water information when PCS data was not available. Many of the point sources in this watershed discharge directly to the Mississippi River. These point sources have not been used for watershed assessment. The impairments for each segment or downstream segment were considered when reviewing DMR data. Data has been summarized for any sampled parameter that is associated with a downstream impairment (i.e., all available nutrient and biological oxygen demand data was reviewed for segments that are impaired for dissolved oxygen). This will help in future model selection as well as source assessment and load allocation.
5.3.1.1 Cahokia Canal Segment JN 02 There are seven point sources with the potential to contribute discharge to Cahokia Canal Segment JN 02. Segment JN 02 is listed as impaired for dissolved oxygen. Table 5-18 contains a summary of available and pertinent DMR data for these point sources. Dissolved oxygen data is not required by all permits and was available for only three point sources.
5-10 DRAFT
C:\Cahokia\Sec 5 Cahokia Cl - Horseshoe L.doc

Section 5 Cahokia Canal/Horseshoe Lake Watershed Characterization
Table 5-18 Effluent Data from Point Sources Discharging Upstream of or Directly to Cahokia Canal Segment JN 02 (Illinois EPA 2005) Facility Name Period of Record Permit Number
Receiving Water/ Downstream Impaired Waterbody Constituent
Average Value
Average Loading
(lb/d) Average Daily Flow 0.655 mgd NA Elementis Pigments,
Inc. 1995-2005 IL0038709
Schoenberger Creek/Cahokia Canal Segment JN 02
Nitrogen, Ammonia 1.12 mg/L 5.64
General Chemical LLC 2003-2004 IL0000647
Rose Creek/Cahokia Canal Segment JN 02
Average Daily Flow 0.0037 mgd NA
Average Daily Flow 19 mgd NA Dot-Dist 8 Bowman Ave Pump Station 1997-2005 IL0070955
Cahokia Canal/Cahokia Canal Segment JN 02 Nitrogen, Ammonia 0.722 mg/L 83.1
Maryville WTP 1996-2003 ILG640139
NA/Cahokia Canal Segment JN 02
Average Daily Flow 0.01 mgd NA
Average Daily Flow 0.07 mgd NA BOD, 5-Day 157.9 mg/L CBOD, 5-Day 5.58 mg/L 2.05 Oxygen, Dissolved 7.2 mg/L
Stone Meadows MHP 1994-2004 IL0046914
Cahokia Canal/Cahokia Canal Segment JN 02
Nitrogen, Ammonia 1.23 mg/L 0.36 Average Daily Flow 0.015 mgd NA BOD, 5-Day 431.8 mg/L – CBOD, 5-Day 6.22 mg/L 0.258
Wheel Ranch MHP-Collinsville 1996-2003 IL0044598
NA/Cahokia Canal Segment JN 02
Nitrogen, Ammonia 2.94 mg/L 0.122 Average Daily Flow 0.05 mgd NA BOD, 5-Day 181.4 mg/L 71.9 CBOD, 5-Day 7.01 mg/L 1.99
Holiday MHP 1995-2004 IL0038288
Unnamed Tributary to Cahokia Canal/Cahokia Canal Segment JN 02
Nitrogen, Ammonia 2.69 mg/L 0.39 5.3.1.2 Horseshoe Lake Segment RJC There is one permitted facility that discharges to Horseshoe Lake Segment RJC. Horseshoe Lake is listed for total phosphorus and pH impairments. Table 5-19 contains a summary of available DMR data for this point source. Phosphorus sampling is not required by the US Steel-Granite City permit.
Table 5-19 Effluent Data from Point Sources Discharging to Horseshoe Lake Segment RJC (Illinois EPA 2005) Facility Name Period of Record Permit Number
Receiving Water/ Downstream Impaired Waterbody Constituent
Average Value
Average Loading
(lb/d) Average Daily Flow 26.3 mgd NA United States Steel-
Granite C 1989-2005 IL0000329
Horseshoe Lake/ Horseshoe Lake Segment RJC
pH 7.80 su
5.3.1.3 Harding Ditch Segment JMAC02 There is one point source with the potential to contribute discharge to Harding Ditch Segment JMAC02. Segment JMAC02 is impaired for total fecal coliform. Table 5-20 contains a summary of available DMR data.
DRAFT 5-11
C:\Cahokia\Sec 5 Cahokia Cl - Horseshoe L.doc

Section 5 Cahokia Canal/Horseshoe Lake Watershed Characterization
Table 5-20 Effluent Data from Point Sources Discharging to Harding Ditch Segment JMAC02 (Illinois EPA 2005) Facility Name Period of Record Permit Number
Receiving Water/ Downstream Impaired Waterbody Constituent
Average Value
Average Loading
(lb/d) Average Daily Flow 0.786 mgd NA Caseyville Township
West STP 1993-2004 IL0023043
Clare Creek/Harding Ditch Segment JMAC02 Total fecal coliform 138.0 mg/L –
5.3.1.4 Canteen Creek Segment JNA 01 There is one point source with the potential to contribute discharge to Canteen Creek Segment JNA 01. Segment JNA 01 is impaired for manganese. Table 5-21 contains a summary of available DMR data.
Table 5-21 Effluent Data from Point Sources Discharging to Canteen Creek Segment JNA 01 (Illinois EPA 2005) Facility Name Period of Record Permit Number
Receiving Water/ Downstream Impaired Waterbody Constituent
Average Value
Average Loading
(lb/d) Average Daily Flow 4.41 mgd NA Collinsville STP
1989-2005 IL0028215
Canteen Creek/Canteen Creek Segment JNA01 Manganese 0.017 mg/L –
5.3.1.5 Other There are no permitted facilities that discharge directly to any of the Frank Holten Lakes.
5.3.2 Mining Discharges There are no permitted mine sites or recently abandoned mines within the Cahokia Canal/Horseshoe Lake Watershed. If additional information becomes available, it will be reviewed and considered during Stage 3 of TMDL development.
5.4 Nonpoint Sources There are many potential nonpoint sources of pollutant loading to the impaired segments in the Cahokia Canal/Horseshoe Lake Watershed. This section will discuss site-specific cropping practices, animal operations, and area septic systems. Data was collected through communication with local NRCS, Soil and Water Conservation District (SWCD), Public Health Department, and County Tax Department officials.
5.4.1 Crop Information A portion of the land found within the Cahokia Canal/Horseshoe Lake watershed is devoted to crops. Corn and soybean farming account for approximately 13 percent and 15 percent of the watershed respectively. Tillage practices can be categorized as conventional till, reduced till, mulch-till, and no-till. The percentage of each tillage practice for corn, soybeans, and small grains by county are generated by the Illinois Department of Agriculture from County Transect Surveys. The most recent survey was conducted in 2004. Data specific to the Cahokia Canal/Horseshoe Lake Watershed
5-12 DRAFT
C:\Cahokia\Sec 5 Cahokia Cl - Horseshoe L.doc

Section 5 Cahokia Canal/Horseshoe Lake Watershed Characterization
were not available; however, the Madison, St. Clair, and Monroe County practices were available and are shown in the following tables.
Table 5-22 Tillage Practices in Madison County Tillage System Corn Soybean Small Grain Conventional 68% 8% 6% Reduced - Till 21% 35% 21% Mulch - Till 7% 22% 23% No - Till 4% 35% 49%
Table 5-23 Tillage Practices in St. Clair County Tillage System Corn Soybean Small Grain Conventional 96% 27% 0% Reduced - Till 1% 22% 0% Mulch - Till 1% 10% 0% No - Till 1% 41% 0%
Table 5-24 Tillage Practices in Monroe County Tillage System Corn Soybean Small Grain Conventional 60% 10% 6% Reduced - Till 32% 37% 21% Mulch - Till 2% 19% 23% No - Till 6% 33% 49%
The Cahokia Canal/Horseshoe Lake Watershed is situated in a predominately urban area. Much of the watershed in Madison County is situated in the Mississippi River flood plain and is protected by a US Army Corps of Engineers levee system. Communications with local NRCS offices indicate that soils are favorable for subsurface tile drainage systems although no specific watershed data is available. It is estimated that approximately 5,000 acres are tiled in the Madison county portion of this watershed. Tile drainage estimates from other watershed counties were not available. Site-specific data will be incorporated if it becomes available. Without local information, soils data will be reviewed for information on hydrologic soil group in order to provide a basis for tile drain estimates.
5.4.2 Animal Operations Watershed specific animal numbers were not available for the Cahokia Canal/Horseshoe Lake Watershed. Data from the National Agricultural Statistics Service was reviewed and is presented below to show countywide livestock numbers.
Table 5-25 Madison County Animal Population (2002 Census of Agriculture) 1997 2002 Percent Change Cattle and Calves 17,690 15,809 -11% Beef 5,890 5,931 1% Dairy 1,774 1,683 -5% Hogs and Pigs 46,331 29,844 -36% Poultry 1,517 NA NA Sheep and Lambs 1,047 1,013 -3% Horses and Ponies NA 1,226 NA
DRAFT 5-13
C:\Cahokia\Sec 5 Cahokia Cl - Horseshoe L.doc

Section 5 Cahokia Canal/Horseshoe Lake Watershed Characterization
Table 5-26 St. Clair County Animal Population (2002 Census of Agriculture) 1997 2002 Percent Change Cattle and Calves 8,362 6,985 -16% Beef 1,888 1,656 -12% Dairy 1,096 1,039 -5% Hogs and Pigs 39,433 30,188 -23% Poultry 1,426 790 -45% Sheep and Lambs 449 374 -17% Horses and Ponies NA 879 NA
Table 5-27 Monroe County Animal Population (2002 Census of Agriculture) 1997 2002 Percent Change Cattle and Calves 10,200 9,846 -3% Beef 3,525 3,451 -2% Dairy 950 1,351 42% Hogs and Pigs 52,235 42,551 -19% Poultry 444 560 26% Sheep and Lambs 973 667 -31% Horses and Ponies NA 446 NA
Again, the Cahokia Canal/Horseshoe Lake Watershed is situated in a predominately urban area. It is estimated that there are very few livestock operations, although it is thought that there are a small number of horse stables located in the watershed. Any additional site-specific information that becomes available will be incorporated.
5.4.3 Septic Systems Many households in rural areas of Illinois, which are not connected to municipal sewers, make use of onsite sewage disposal systems, or septic systems. There are a variety of types of septic systems, but the most common septic system is composed of a septic tank draining to a septic field, where nutrient removal occurs. However, the degree of nutrient removal is limited by soils and system upkeep and maintenance.
Information on septic systems has been obtained for St. Clair and Monroe Counties. Septic system information for Madison County is not available. Table 5-28 is a summary of the available septic system data in the Cahokia Canal/Horseshoe Lake Watershed.
There are approximately 5,000 septic systems in the Cahokia Canal/Horseshoe Lake watershed. The area within St. Clair County falls under three separate jurisdictions: St. Clair County, Fairview Heights, and East Side Health District. Estimates of the number of septic systems in the watersheds were obtained for each of the three entities and summed for the county total. There are 700 septic systems within St. Clair County's jurisdiction, 4,000 in Fairview Heights, and 300 within the East Side Health District's jurisdiction. All of the area in Monroe County within the watershed is served by septic systems. Most of the
Table 5-28 Estimated Septic Systems in the Cahokia Canal/Horseshoe Lake Watershed
County
Estimated No. of Septic
Systems Source of Septic Areas/ No. of Septic Systems
Madison N/A St. Clair 5,000 County Health
Department, East Side Health District, City of Fairview Heights
Monroe 45 Health Department Total 5,045
5-14 DRAFT
C:\Cahokia\Sec 5 Cahokia Cl - Horseshoe L.doc
Section 5 Cahokia Canal/Horseshoe Lake Watershed Characterization
municipalities surrounding Long Lake, Horseshoe Lake, and Frank Holten 1, 2, and 3 are sewered.
5.5 Watershed Studies and Other Watershed Information Previous planning efforts have been conducted in the Cahokia Canal/Horseshoe Lake Watershed. In the summer of 1998, and intensive survey of the Mississippi South Central Basin was conducted. A Phase III, Post-Restoration Monitoring Report was also completed for the Frank Holten Lakes in 1994. Data from these studies will be used as a reference during Stage 3 of TMDL development. Further investigation will be conducted on other watershed planning efforts and local watershed groups. Any available and relevant information will be collected and incorporated during Stage 3 of TMDL development.
DRAFT 5-15
C:\Cahokia\Sec 5 Cahokia Cl - Horseshoe L.doc

Section 5 Cahokia Canal/Horseshoe Lake Watershed Characterization
THIS PAGE INTENTIONALLY LEFT BLANK
5-16 DRAFT
C:\Cahokia\Sec 5 Cahokia Cl - Horseshoe L.doc

Figure 5-1Cahokia Canal/Horseshoe Lake Watershed
Water Quality Stations
DRAFT
")
")
")")
") ")
")")
")
")
")
")")
£¤3
£¤203
£¤111
£¤162
£¤15
£¤3
£¤157
£¤163
£¤13
£¤159
£¤161
§̈¦I 270
§̈¦I 255
§̈¦I 64
§̈¦I 55
St. Clair Cnty
Monroe Cnty
Madison CntySt. Clair Cnty
Chai
n of
Roc
ks C
anal
Spar
row C
reek
Palmer Creek Hic
kman
Cre
ek
Dead Creek
Burdick Branch
Horseshoe LakeRJC
Cahokia Canal
JN 02Canteen Creek
JNA01
Harding Ditch
JMAC02
Frank Holten 1, 2, 3RJK, RJL, RJM
Columbia
Judy's Branch
Pontoon Beach
Centreville
Belleville
Collinsville
Edwardsville
Granite City
Glen Carbon
Millstadt
Venice
Madison
Cahokia
East St. Louis
Sauget
Fairview Heights
Caseyville
JMAA-01
JMAC-02
RJM-2,RJM-3
RJK-1RJL-1
RJC-2RJC-1
RJC-3
RJC-4
JN-02, JNA-01
Mississippi River/Missouri State Line
RJM-1
Prairie Du Pont Creek
Long Lake
0 5 102.5 Miles
/
WatershedMunicipality
Lake or ReservoirMajor Stream303(d) Listed WaterbodiesCounty Boundary
Legend
InterstateUS and State Highway
") Water Quality Station

Section 5 Cahokia Canal/Horseshoe Lake Watershed Characterization
THIS PAGE INTENTIONALLY LEFT BLANK
5-18 DRAFT
C:\Cahokia\Sec 5 Cahokia Cl - Horseshoe L.doc

A
V:\6 Cahokia Canal_Horseshoe Lake\Data\Stream-Fecal.xlsCahokia Canal Fecal
Figure 5-2:Harding Ditch JMAC02
Total Fecal Coliform
10
100
1000
10000
100000
Janu
ary-
90
July
-90
Janu
ary-
91
July
-91
Janu
ary-
92
July
-92
Janu
ary-
93
July
-93
Janu
ary-
94
July
-94
Janu
ary-
95
July
-95
Janu
ary-
96
July
-96
Janu
ary-
97
July
-97
Janu
ary-
98
July
-98
Janu
ary-
99
July
-99
Janu
ary-
00
July
-00
Janu
ary-
01
July
-01
Janu
ary-
02
July
-02
Janu
ary-
03
July
-03
Janu
ary-
04
July
-04
Cou
nt (c
fu/m
L)
JMAC02
General Use - 200
General Use - 400

Section 5 Cahokia Canal/Horseshoe Lake Watershed Characterization
THIS PAGE INTENTIONALLY LEFT BLANK
5-20 DRAFT
C:\Cahokia\Sec 5 Cahokia Cl - Horseshoe L.doc

A
T:\GIS\6 Cahokia Canal_Horseshoe Lake\Data\Stream-DO.xlsDO-timeseries
Figure 5-3:Cahokia Canal Segment JN02
Dissolved Oxygen Concentrations
0.0
2.0
4.0
6.0
8.0
10.0
12.0
14.0
16.0
Janu
ary-
90
July
-90
Janu
ary-
91
July
-91
Janu
ary-
92
July
-92
Janu
ary-
93
July
-93
Janu
ary-
94
July
-94
Janu
ary-
95
July
-95
Janu
ary-
96
July
-96
Janu
ary-
97
July
-97
Janu
ary-
98
July
-98
Janu
ary-
99
July
-99
Janu
ary-
00
July
-00
Janu
ary-
01
July
-01
Janu
ary-
02
July
-02
Janu
ary-
03
July
-03
Janu
ary-
04
Con
cent
ratio
n (m
g/L)
JN 02
Dissolved Oxygen Standard

Section 5 Cahokia Canal/Horseshoe Lake Watershed Characterization
THIS PAGE INTENTIONALLY LEFT BLANK
5-22 DRAFT
C:\Cahokia\Sec 5 Cahokia Cl - Horseshoe L.doc

A
V:\6 Cahokia Canal_Horseshoe Lake\Data\Stream-Other.xlsManganese
Figure 5-4:Canteen Creekk JNA01
Total Manganese Concentrations
0
500
1000
1500
2000
2500
3000
3500
4000
Janu
ary-
90
July
-90
Janu
ary-
91
July
-91
Janu
ary-
92
July
-92
Janu
ary-
93
July
-93
Janu
ary-
94
July
-94
Janu
ary-
95
July
-95
Janu
ary-
96
July
-96
Janu
ary-
97
July
-97
Janu
ary-
98
July
-98
Janu
ary-
99
Con
cent
ratio
n (u
g/L)
General Use StandardJNA 01

Section 5 Cahokia Canal/Horseshoe Lake Watershed Characterization
THIS PAGE INTENTIONALLY LEFT BLANK
5-24 DRAFT
C:\Cahokia\Sec 5 Cahokia Cl - Horseshoe L.doc
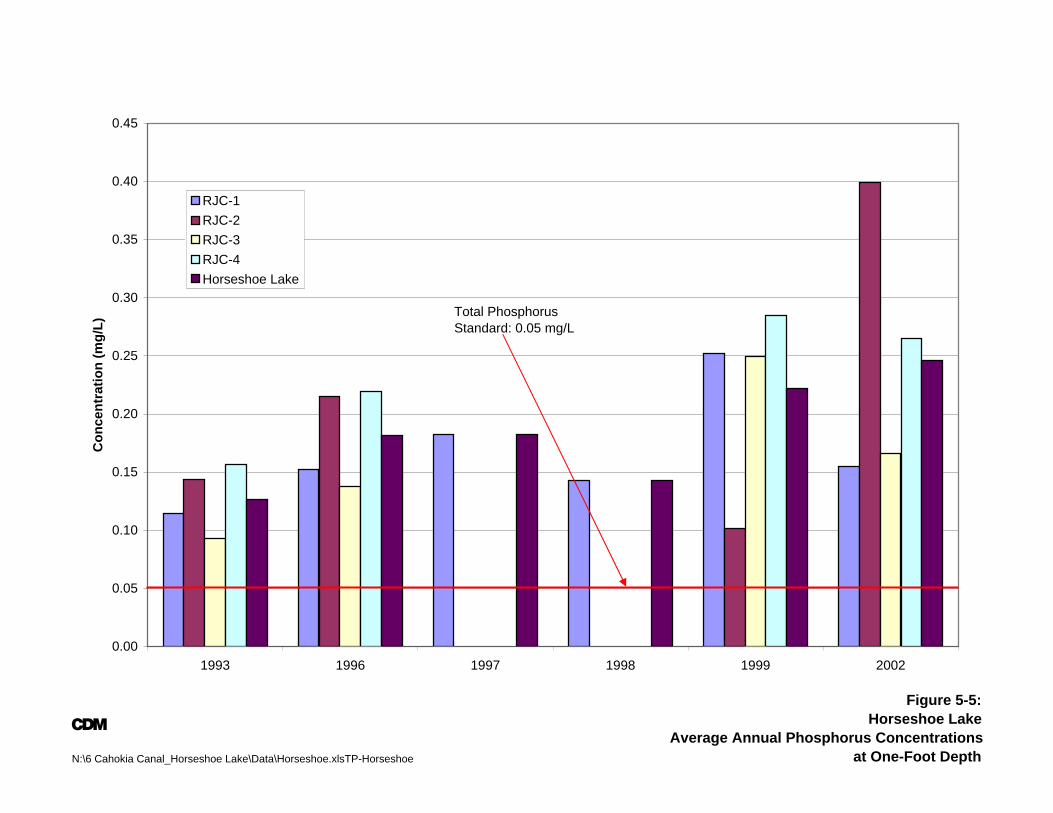
A
N:\6 Cahokia Canal_Horseshoe Lake\Data\Horseshoe.xlsTP-Horseshoe
Figure 5-5:Horseshoe Lake
Average Annual Phosphorus Concentrations at One-Foot Depth
0.00
0.05
0.10
0.15
0.20
0.25
0.30
0.35
0.40
0.45
1993 1996 1997 1998 1999 2002
Con
cent
ratio
n (m
g/L)
RJC-1RJC-2RJC-3RJC-4Horseshoe Lake
Total Phosphorus Standard: 0.05 mg/L
Section 5 Cahokia Canal/Horseshoe Lake Watershed Characterization
THIS PAGE INTENTIONALLY LEFT BLANK
5-26 DRAFT
C:\Cahokia\Sec 5 Cahokia Cl - Horseshoe L.doc

A
N:\6 Cahokia Canal_Horseshoe Lake\Data\Horseshoe.xlspH-Horseshoe
Figure 5-6:Horseshoe Lake
Average Annual pH Values
6.00
6.50
7.00
7.50
8.00
8.50
9.00
9.50
1993 1996 1999 2002
Stan
dard
Uni
ts
RJC-1 RJC-2 RJC-3 RJC-4 Horseshoe Lake
pH Standard:6.5 Minimum9.0 Maximum

Section 5 Cahokia Canal/Horseshoe Lake Watershed Characterization
THIS PAGE INTENTIONALLY LEFT BLANK
5-28 DRAFT
C:\Cahokia\Sec 5 Cahokia Cl - Horseshoe L.doc

A
N:\6 Cahokia Canal_Horseshoe Lake\Data\frank-holten-data.xlsTP-Frank Holten
Figure 5-7:Frank Holten Lakes
Annual Average Total Phosphorus Concentrations
0.00
0.05
0.10
0.15
0.20
0.25
0.30
0.35
0.40
0.45
0.50
1990 1991 1992 1996 1997 1998 1999 2002
Con
cent
ratio
n (m
g/L)
RJK-1RJL-1RJM-1RJM-2RJM-3
Total Phosphorus Standard: 0.05 mg/L

Section 5 Cahokia Canal/Horseshoe Lake Watershed Characterization
THIS PAGE INTENTIONALLY LEFT BLANK
5-30 DRAFT
C:\Cahokia\Sec 5 Cahokia Cl - Horseshoe L.doc

A
N:\6 Cahokia Canal_Horseshoe Lake\Data\frank-holten-data.xlsDO
Figure 5-8:Frank Holten Lake #3
Dissolved Oxygen Concentrations
4.0
6.0
8.0
10.0
12.0
14.0
16.0
18.0
Jan-
90
Jul-9
0
Jan-
91
Jul-9
1
Jan-
92
Jul-9
2
Jan-
93
Jul-9
3
Jan-
94
Jul-9
4
Jan-
95
Jul-9
5
Jan-
96
Jul-9
6
Jan-
97
Jul-9
7
Jan-
98
Jul-9
8
Jan-
99
Jul-9
9
Jan-
00
Jul-0
0
Jan-
01
Jul-0
1
Jan-
02
Jul-0
2
Jan-
03
Con
cent
ratio
n (m
g/L)
RJM-1RJM-2RJM-3DO Standard - 5.0 mg/L Minimum

Section 5 Cahokia Canal/Horseshoe Lake Watershed Characterization
THIS PAGE INTENTIONALLY LEFT BLANK
5-32 DRAFT
C:\Cahokia\Sec 5 Cahokia Cl - Horseshoe L.doc

Figure 5-9Cahokia Canal/Horseshoe Lake Watershed
NPDES Permits
DRAFT
!(
!(!(!(!(!(
!(!(
!(!(!(
!( !(!(
!(!(
!(
!(!(
!(!(
!(!(
£¤3
£¤203
£¤111
£¤162
£¤15
£¤3
£¤157
£¤163
£¤13
£¤159
£¤161
§̈¦I 270
§̈¦I 255
§̈¦I 64
§̈¦I 55
St. Clair Cnty
Monroe Cnty
Madison CntySt. Clair Cnty
Chai
n of
Roc
ks C
anal
Spar
row C
reek
Palmer Creek Hic
kman
Cre
ek
Dead Creek
Burdick Branch
Horseshoe LakeRJC
Cahokia Canal
JN 02Canteen Creek
JNA01
Harding Ditch
JMAC02
Frank Holten 1, 2, 3RJK, RJL, RJM
Prairie Du Pont Creek
Columbia
Judy's Branch
Pontoon Beach
Centreville
Belleville
Collinsville
Edwardsville
Granite City
Glen Carbon
Millstadt
Venice
Madison
Cahokia
East St. Louis
Fairview Heights
Caseyville
U.S. Steel
Holiday MHP
IDOT Dist. 8Bowman PS
Elementis Pigments, Inc.
General Chemical Corp.
Collinsville STP
Maryville WTP
Caseyville STP
Wheel Ranch MHP
Stone Meadows MH Community
Long Lake
0 5 102.5 Miles
/
WatershedMunicipality
Lake or ReservoirMajor Stream303(d) Listed WaterbodiesCounty Boundary
Legend
InterstateUS and State Highway
Point Source

Section 5 Cahokia Canal/Horseshoe Lake Watershed Characterization
THIS PAGE INTENTIONALLY LEFT BLANK
5-34 DRAFT
C:\Cahokia\Sec 5 Cahokia Cl - Horseshoe L.doc

Section 6 Approach to Developing TMDL and Identification of Data Needs Illinois EPA is currently developing TMDLs for pollutants that have numeric water quality standards. Of the pollutants impairing stream segments in the Cahokia Canal/ Horseshoe Lake Watershed, manganese, DO, and fecal coliform are the parameters with numeric water quality standards. For the impaired lakes in the watershed, phosphorus, DO, and pH are the parameters with numeric water quality standards. Illinois EPA believes that addressing these impairments should lead to an overall improvement in water quality due to the interrelated nature of the other listed pollutants. Recommended technical approaches for developing TMDLs for streams and lakes are presented in this section. Additional data needs are also discussed.
6.1 Simple and Detailed Approaches for Developing TMDLs The range of analyses used for developing TMDLs varies from simple to complex. Examples of a simple approach include mass-balance, load-duration, and simple watershed and receiving water models. Detailed approaches incorporate the use of complex watershed and receiving water models. Simple approaches typically require less data than detailed approaches and therefore these are the analyses recommended for the Cahokia Canal/Horseshoe Lake Watershed except for stream segments where major point sources whose NDPES permit may be affected by the TMDL's WLA. Establishing a link between pollutant loads and resulting water quality is one of the most important steps in developing a TMDL. As discussed above, this link can be established through a variety of techniques. The objective of the remainder of this section is to recommend approaches for establishing these links for the constituents of concern in the Cahokia Canal/Horseshoe Lake Watershed.
6.2 Approaches for Developing TMDLs for Stream Segments in the Cahokia Canal/Horseshoe Lake Watershed All of the impaired stream segments with the watershed have major point sources discharging to them. Approaches for developing TMDLs for parameters that are possibly affected by point sources as well as TMDLs for parameters not likely influenced by point sources are described below.
6.2.1 Recommended Approach for DO TMDLs for Segments with Major Point Sources Cahokia Canal Segment JN02 has point sources discharging directly to or upstream of it. For this segment a more complicated approach that would also incorporate the impacts of stream plant activity, and possibly sediment oxygen demand (SOD), and would require a more sophisticated numerical model and an adequate level of measured data to aide in model parameterization is recommended.
DRAFT 6-1
C:\Cahokia\Sec 6 Cahokia Cl - Horseshoe L.doc
Section 6 Approach to Developing TMDL and Identification of Data Needs
Available instream water quality data for the impaired stream segment is limited, particularly spatial data. Therefore additional data collection is recommended for this segment. Specific data requirements include a synoptic (snapshot in time) water quality survey of this reach with careful attention to the location of the point source dischargers. This survey should include measurements of flow, hydraulics, DO, temperature, nutrients, and CBOD. The collected data will be used to support the model development and parameterization and will lend significant confidence to the TMDL conclusions.
This newly collected data could then be used to support the development and parameterization of a more sophisticated DO model for this stream and therefore, the use of the QUAL2E model (Brown and Barnwell 1985) could be utilized to accomplish the TMDL analysis for Cahokia Canal. QUAL2E is well-known and USEPA-supported. It simulates DO dynamics as a function of nitrogenous and carbonaceous oxygen demand, atmospheric reaeration, SOD, and phytoplankton photosynthesis and respiration. The model also simulates the fate and transport of nutrients and BOD and the presence and abundance of phytoplankton (as chlorophyll-a). Stream hydrodynamics and temperature are important controlling parameters in the model. The model is essentially only suited to steady-state simulations.
In addition to the QUAL2E model, a simple watershed model such as PLOAD, Unit Area Loads or the Watershed Management Model is recommended to estimated BOD and nutrient loads from non-point sources in the watershed. This model will allow for allocation between point and nonpoint source loads and provide an understanding of percentage of loadings from point sources and nonpoint sources in the watershed.
6.2.2 Recommended Approach for Fecal Coliform TMDLs Segment JMAC02 of Harding Ditch is impaired for fecal coliform. The general use water quality standard for total fecal coliform is:
200 cfu/100 mL geometric mean based on a minimum of five samples taken over not more than a 30 day period during the months of May through October
400 cfu/100 mL shall not be exceeded by more than 10 percent of the samples collected during any 30 day period during the months of May through October
As discussed in Section 5.1.1.1, there have been no instances when five or more samples have been taken within a 30 day period. More data is required in order to properly assess compliance with the standard.
If it is confirmed that the segment is impaired for total fecal coliform, the recommended approach for developing a TMDL for the segment would be to use the load-duration curve method. The load-duration methodology uses the cumulative frequency distribution of streamflow and pollutant concentration data to estimate the allowable loads for a waterbody.
6-2 DRAFT
C:\Cahokia\Sec 6 Cahokia Cl - Horseshoe L.doc
Section 6 Approach to Developing TMDL and Identification of Data Needs
6.2.3 Recommended Approach for Manganese TMDL Segment JNA01 of Canteen Creek is impaired for manganese. No apparent source of manganese has been identified to date and therefore, an empirical loading and spreadsheet analysis will be utilized to calculate this TMDL.
6.3 Approaches for Developing TMDLs for Lakes and Reservoirs in the Cahokia Canal/Horseshoe Lake Watershed Recommended TMDL approaches for Horseshoe Lake and the Frank Holten Lakes will be discussed in this section. It is assumed that enough data exists to develop a simple model for use in TMDL development.
6.3.1 Recommended Approach for Total Phosphorus, DO and pH TMDLs Horseshoe Lake and each of the Frank Holten Lakes are impaired for total phosphorus. Horseshoe Lake is also impaired for pH while Frank Holten Lake #3 is additionally impaired for DO. The BATHTUB model is recommended for all lake phosphorus and DO assessments in this watershed. The BATHTUB model performs steady-state water and nutrient balance calculations in a spatially segmented hydraulic network that accounts for advective and diffusive transport, and nutrient sedimentation. The model relies on empirical relationships to predict lake trophic conditions and subsequent DO conditions as functions of total phosphorus and nitrogen loads, residence time, and mean depth (USEPA 1997). Oxygen conditions in the model are simulated as meta and hypolimnetic depletion rates, rather than explicit concentrations.
Watershed loadings to the lakes will be based on empirical data or tributary data available in the lake watersheds. In addition, pH will be addressed empirically. Most likely, control of phosphorus concentrations will address pH impairments within Horseshoe Lake.
DRAFT 6-3
C:\Cahokia\Sec 6 Cahokia Cl - Horseshoe L.doc

Section 6 Approach to Developing TMDL and Identification of Data Needs
THIS PAGE INTENTIONALLY LEFT BLANK
6-4 DRAFT
C:\Cahokia\Sec 6 Cahokia Cl - Horseshoe L.doc