image processing for improved eye-tracking accuracy · behavior research methods, instruments,...
TRANSCRIPT

Behavior Research Methods, Instruments, & Computers 1997, 29 (1), 54-65
Image processing for improved eye-tracking accuracy
JEFFREY B. MULUGAN NASA Ames Research Center, Moffett Field, California
Video cameras provide a simple, noninvasive method for monitoring a subject's eye movements. An important concept is that of the resolution of the system, which is the smallest eye movement that can be reliably detected. While hardware systems are available that estimate direction of gaze in real time from a video image of the pupil, such systems must limit image processing to attain real-time performance and are limited to a resolution of about 10arc minutes. Two ways to improve resolution are discussed. The first is to improve the image processing algorithms that are used to derive an estimate. Offline analysis of the data can improve resolution by at least one order of magnitude for images of the pupil. A second avenue by which to improve resolution is to increase the optical gain of the imaging setup (i.e., the amount of image motion produced by a given eye rotation). Ophthalmoscopic imaging of retinal blood vessels provides increased optical gain and improved immunity to small head movements but requires a highly sensitive camera. The large number of images involved in a typical experiment imposes great demands on the storage, handling, and processing of data. Amajor bottleneck had been the real-time digitization and storage oflarge amounts of video imagery, but recent developments in video compression hardware have made this problem tractable at a reasonable cost. Images of both the retina and the pupil can be analyzed successfully using a basic toolbox of image-processing routines (filtering, correlation, thresholding, etc.), which are, for the most part, well suited to implementation on vectorizing supercomputers.
Accurate knowledge ofeye position is often desired, not only in research on the oculomotor system itself but also in many experiments on visual perception, where eye movements can provide indirect evidence about what the subject sees. It has also proven quite useful in infant research, where the experimental subjects cannot understand instructions or make voluntary responses but, nevertheless, can reveal their perceptual processing through eye movements. For example, infant color vision has been assessed by observing the direction of eye movements in response to a dynamic color stimulus (e.g., TeIler & Palmer, 1996). In this and other situations, it is important that the measurement system be noninvasive to the subject. Recording of eye movements using video cameras satisfies this requirement, and the advent of new hardware for digitizing and storing video sequences on a normal computer disk aIlows the application ofpowerful software programs to the analysis of eye movements. In this paper, I wiIl discuss several algorithms that have been developed for this purpose. I will first review the advantages and disadvantages ofother competing methods and then consider in detail a commercially available videobased system. I will then describe algorithms developed for the analyses of two classes of eye images: (1) images of the pupil and other anterior structures that may be im-
This research was supported by NASA RTOPs 505-64-53 and 19906-12-39. Correspondence should be addressed to J. 8. Mulligan, NASA Ames Research Center, MS 262-2 Moffett Field, CA 94035 (email: [email protected]).
aged directly, and (2) images of the retina obtained from a video ophthalmoscope.
A Short Survey of Eye-Tracking Methods While a number of eye-movement recording methods
have been developed over the years (MuIler, Cavegn, d'Ydewalle, & Groner, 1993; Young & Sheena, 1975), all involve some compromises, and no method has been devised that is applicable to all situations. The search coil method (Robinson, 1963) is one of the few methods that offers both high accuracy (-1' ofarc) and large dynamic range. In this technique, a small magnetic sensing coil is affixed to the subject's eye, which is used to detect externally applied magnetic fields from large inducing coils surrounding the subject. In Robinson's original method, three mutually perpendicular inducing fields are modulated at different frequencies, and the orientation of the sensing coil (and the eye) is computed from the relative amplitudes of these frequencies in the sensor output. A number of significant improvements were introduced by Collewijn (1977), who produced a rotating external field, transforming the problem to one of temporal phase measurement.
While the search coil method does produce excellent data, it requires actually putting something in the eye, which can pose unacceptable risks when used in naive subjects without medical supervision. The dual-Purkinje image tracker (Crane & Steele, 1978) offers comparable accuracy (albeit over a smaller range of movement) and is noninvasive but is an expensive and complicated special
54

55 IMPROVED EYE TRACKING
purpose device, which may be beyond the means ofmany small laboratories. It also requires stabilization of the head and is therefore unsuitable for infant research. Devices that measure scleral reflectance (limbus trackers) are simple and inexpensive but have more limited accuracy (Carmody, Kundel, & Nodine, 1980; Eadie, Pugh, & Heron, 1994; Muller et al., 1993).
In recent years, a number ofsystems have appeared on the market that utilize video images ofthe anterior structures of the eye. Typically, the video signal is fed into special-purpose electronic circuits that segment and localize large structures in the image, such as the pupil and the corneal reflex or first Purkinje image. These systems offer the advantages of being noninvasive and relatively simple to set up and use. The resolution of such systems is typically a fixed fraction ofthe video image size; therefore, the ultimate resolution depends on the magnification with which the eye is imaged. Increasing the optical magnification increases both the resolution and the accuracy but, in turn, requires that the head be stabilized in order that the eye remain in the camera's field of view. Alternatively, small "lipstick" cameras can be mounted directly on the head using a headband or helmet. Either way, the amount of optical magnification is limited by the size of the pupil: The magnification cannot be increased beyond the point at which the pupil fills the entire image. This observation leads naturally to the concept of optical gain, which I define to be the number ofpixels of image motion per unit eye rotation. For a 6-mm pupil imaged with a standard video camera, this turns out to have a value ofapproximately 6 pixels per degree ofhorizontal eye rotation. (The value for vertical eye rotations will be half of this, due to video interlace; see section on video acquisition below.)
An Example Commercial System While the imaging configuration and optical magnifi
cation determine the raw images that the system has to work with, the ultimate resolution and accuracy depend on how the images are processed. As an example, I will describe a commercial system made by ISCAN (Cambridge, MA), simply because it is one with which I have had some direct experience. While the precise algorithms used by the device remain undisclosed proprietary trade secrets, the overall approach can be inferred from the behavior of the device under use. This device is capable of locating both the (dark) pupil and the corneal reflex (CR.). It takes a signal from a camera as input, and it outputs a video signal that is similar to the input but that may have additional information superimposed. The front panel controls consist of a "threshold" switch, a cross-hair enable switch, and two threshold level knobs. When the crosshair enable switch is set, the output video image is overlaid with a pair of vertical and horizontal lines (the "hairs"), which intersect at the estimated locations ofthe pupil and corneal reflex, thereby providing a simple visual check that the unit is functioning properly. The pupil threshold knob sets the gray level below which pixels are classified as part of the pupil, whereas the CR. thresh
old knob sets the gray level above which pixels are classified as part of the reflex. When the threshold switch is flipped, pixels that exceed threshold are displayed as white in the image output of the device. The experimenter slowly increases the pupil threshold level adjustment until all of the pixels in the pupil appear white. Often, other dark pixels outside of the pupil (caused by such things as eyelashes or shadows of the eyelids) will also exceed the threshold; I do not know whether or not these are included by the device, but the behavior ofthe crosshair suggests that they are (unfortunately). Setting the proper level for the CR. is somewhat more difficult; because the CR. is very bright to begin with, the pixels that exceed the threshold set by the knob (which are displayed as white) are often impossible to distinguish from their normal levels. Because of this difficulty in observing the thresholded pixels, I have found it easier to make this adjustment by observing the cross-hairs as the threshold level is varied and to stop when the cross-hairs are stable and centered on the reflex. As with the pupil, spurious bright pixels from other parts of the eye (most notably, specular reflections from the moist surface of the eyelid) are a problem. The device is equipped with a "CR. limit" switch on the rear panel, which supposedly restricts the area over which the CR. computation is performed, but the details are unavailable. At any rate, for each input field of video, the device selects pixels that it deems to belong to the pupil and the CR. and outputs a set of coordinates for each. No details are available concerning how the coordinates are computed from the sets of pixels, but a centroid calculation seems like an obvious choice. (For any set ofpixels from a raster, the coordinates of the centroid are easily computed as the means of the coordinates of the individual points.) The coordinates returned by the ISCAN tracker are quantized to an integer number of pixels. Because no subpixel estimation of position is done, the resolution of this device can be easily computed as the inverse of the optical gain described above: The optical gain of 6 pixels per degree of visual angle results in a resolution of 10' of arc.
Depending on the noise level of the camera, this may not represent the limiting resolution imposed by the imagery itself. Let us imagine that the pupil has a diameter of 200 pixels in a particular imaging configuration and that there is no camera noise. In this case, the pupil area will be made up of roughly 30,000 pixels, each ofwhich makes an equal contribution to the centroid calculation. Imagine that a tiny eye movement is made that causes a single pixel at the right-hand margin of the thresholded region to fall above threshold. Relative to the original centroid location, the new right-hand pixel has a coordinate of 100 (half the pupil diameter) and therefore contributes a term with value 100/30,000 to the centroid calculation. In the absence of camera noise, we might therefore expect to compute the centroid of this region with a resolution of approximately 0.003 pixels. Even though real cameras are not noise free, it seemed unlikely that camera noise alone could account for a decrease in resolution of more than two orders of magnitude, and this observa

56 MULLIGAN
tion prompted my first attempts to improve resolution and accuracy through software image processing.'
METHODS
Video Acquisition The biggest technical challenge in the construction of
a software-based video eye tracker was the real-time digitization and storage ofthe video stream from the eye camera(s). Frame-grabber boards have no problem digitizing video, but the number of frames that can be grabbed is limited by the amount of memory on the board; many boards only have enough memory for a single frame. It is therefore imperative that the video data be transferred to a mass-storage device, such as a disk. If the frame grabber has sufficient memory to buffer an entire trial, this may be done between trials; however, since this adds a delay that is likely to be greater than the duration ofthe trial itself, a much better solution is to store the data directly to disk as it comes in.
While specialized (and expensive) devices to do this have existed for some time (usually consisting of parallel disk arrays), the problem has become vastly more tractable with the recent advent of integrated circuits that perform real-time image and video compression. This is a rapidly changing field, and the "standards" are still evolving. This paper will focus on the approach I have followed, which is to treat the video stream as a sequence of still images, each of which is compressed using the still-image compression algorithm specified by the Joint Photographic Experts Group (JPEG) (Pennebaker & Mitchell, 1993). Although the JPEG still-image format has been fairly well standardized, the use ofJPEG for the encoding of dynamic video ("motion JPEG") is something that has been approached somewhat differently by each vendor. So, while most of the competing products offer the same sorts of features, compressed movie files cannot generally be exchanged, and, in most cases, the formats are proprietary and can only be decoded using the vendor's software. In the long term, it is likely that most video will be encoded using a method that exploits the redundancy between successive frames, such as that recommended by the Motion Picture Experts' Group (MPEG); currently, however, real-time MPEG encoders are substantially more expensive than motion JPEG systems. It is expected that the next few years will see continued rapid development in this area, and we can look forward to better and less expensive solutions.
There are two major benefits conferred by the application ofcompression technology to the problem ofvideo acquisition. First, the reduced data rate ofthe video stream is brought within the capabilities of standard disk drives and controllers; typically, a compression factor of 10 can be obtained without significantly degrading the performance of the eye-tracking algorithms described here (Mulligan & Beutter, 1995). Second, this same reduction in the size of the data means that the number of movies that can be stored on a disk of a given size is similarly increased.
In the present implementation,camera images are stored and subsequently retrieved using hardware JPEG compression (XVideo card with RTV software, Parallax Graphics, Santa Clara, CA). The camera signal is a standard NTSC television signal (see Hunt, 1987), each frame of which is made up of two "interlaced" fields. The first field consists of all the odd-numbered lines from the image (numbering starts at 1); the second field consists ofthe even-numbered lines. These two fields are acquired sequentially and compressed and stored independently by the hardware. To maximize temporal resolution, all analyses are performed on field images, and the final results are corrected for the fact that the two field rasters are spatially offset by half of the field line spacing.
Image-Processing Software All of the image-processing operations described in
this paper were implemented using an in-house interpretive system that has been dubbed "QuiP" (Quick Image Processing). This system consists of a set of C libraries containing functions that perform the basic imageprocessing functions, which are coupled to a text interpreter that allows fast prototyping of new algorithms. The system is highly portable and has been installed on Sun, Silicon Graphics, and Cray UNIX systems, as well as the Apple Macintosh. For purposes ofcomparison, the translational registration of 1,024 fundus images (described below)was computedon a SiliconGraphicsONYX computer and again on a Cray C90. This task required 63.8 sec of central processing unit (CPU) time on the Cray C90 (1:25 elapsed time) and 1,013 sec ofCPU time on the ONYX (19:00 elapsed time). In a previous benchmark test of QuiP (Mulligan, 1996), the performance of Cray C90 was approximately a factor of 60 better than the SGI machine; here, the improvement is only a quarter ofthat. This is most likely due to the fact that the previous benchmark was tailored to reflect the vector-processing performance, whereas the actual eye-tracking application involves additional script interpretation and resource management, which do not benefit from the Cray's special vector-processing hardware. On workstation computers, the interpreter overhead has always been insignificant relative to the time spent actually processing the image data. The current benchmark results suggest that this may no longer be true on the C90 and that some applications would benefit significantly from being compiled instead of interpreted.
Pupil-Tracking Algorithm The analysis ofpupil images consists of several steps.
The general approach is similar to that I have ascribed to the ISCAN device, but several additional processing steps have been incorporated to improve accuracy. The pupil is first crudely located, and the surrounding extraneous image regions are masked off. The image is blurred before thresholding to reduce the effects ofnoise. Centroids are computed using floating-point arithmetic in order to obtain subpixel resolution. The remainder of this section will describe the process in detail.

57 IMPROVED EYE TRACKING
The anterior structures ofthe eye are illuminated with a broad infrared beam derived from a quartz-halogen lamp and are imaged using a CCD camera (COHU Model 6500) equipped with a 75-mm lens that is mounted on a 30-mm extension tube to allow close focusing. (This armngement avoids the optical degradation of the image that occurs with teleconverters and close-up lenses.) The raw image data consist of video fields having 240 lines and 640 columns. Each image is first cropped to a width of 512 columns and padded at the bottom to a height of256 lines, using a value that approximates the gray level of the subject's iris. (This value must be hand-tuned for each new subject.) Because this field image contains only half the lines of a full frame, this picture appears squashed and is therefore subsampled in the horizontal dimension by a factor of 2. (This step might be omitted when maximum accuracy is desired, but it is convenient here both because it halves the amount of subsequent computation and it results in naturallooking intermediate images.) This subsampling is performed using a Fourier domain method that eliminates the possibility of aliasing (Watson, 1986).The pixel values are then divided by 256 to fall between 0 and I.
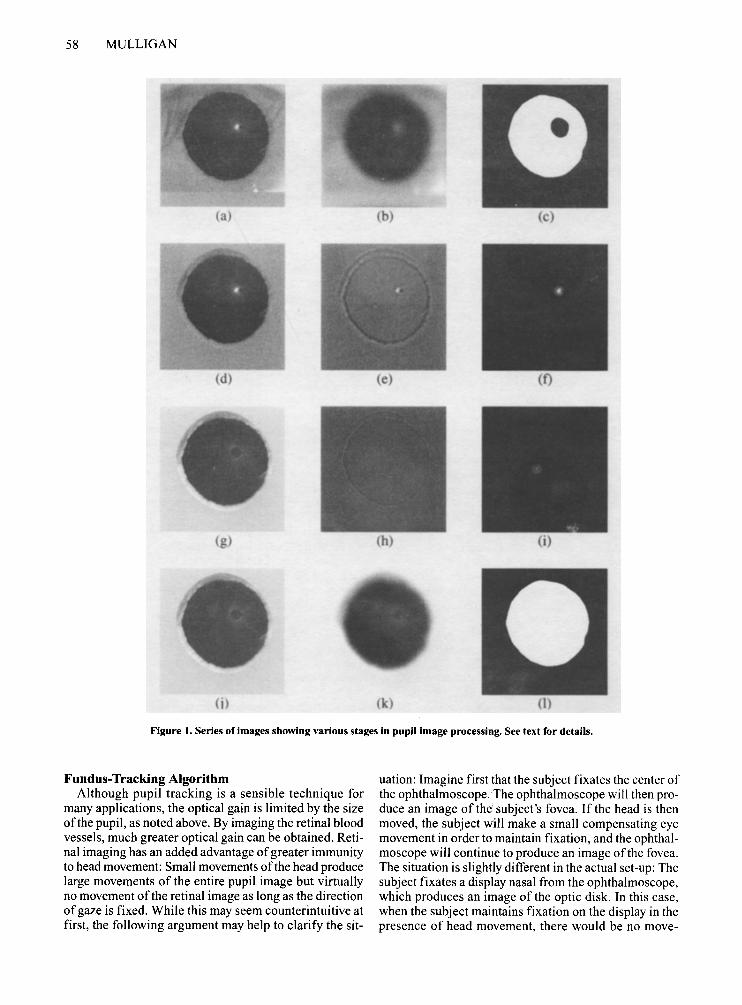
Figure Ia shows a typical input image of the front of the eye. To eliminate interference from features outside the pupil region, a crude localization of the pupil is first performed, and a region of interest slightly larger than the pupil is selected for further processing. This is done as follows: The input image is first blurred, using a Gaussian filter with a standard deviation of a = 6.4 pixels (Figure Ib). A threshold is then applied that selects the pixels in the blurred image whose value falls below 0 = 0.1 (Figure lc). (We arrived at these and many of the subsequently reported parameter values through trial-anderror testing.) The blurring ensures that small dark features, such as eyelashes, are not included in this selection. As can be seen from Figure lc, one problem with the image at this stage is the "hole" caused by the CR. This is eliminated by another coarse blur (o = 5 pixels); the blurred image is renormalized to the range 0 to I, and pixels with a value above a threshold of 0 = 0.3 are selected, resulting in a roughly circular mask slightly larger than the pupil. This mask is then used to select the pupil portion of the original image (Figure Id). Pixels that fall outside of the selected region are set to a level that approximates the level of the iris in order to minimize discontinuities at the mask border.
Next, the CR. is localized using a matched filter for coarse localization. This filter is constructed in the space domain as a light disk approximately the size of the reflex (5 pixel radius), with a dark surround (6 pixel radius) that attenuates the response to low spatial frequencies. (The surround is restricted to a narrow I pixel annulus in order to give a uniform response even when the reflex is near the margin of the pupil.) This filter is applied to the image (Figure Ie); the result is renormalized to the range 0-1 and is then thresholded to select pixels whose values exceed a threshold of 0 = 0.9. This process selects a small
number ofpixels at or near the center ofthe reflex. A small circular mask is grown about these pixels by applying another blur-threshold step (o = 13 pixels, 0 = 0.7), and this mask is then applied to the image (Figure I f).
The position of the masked reflex is computed with subpixel accuracy by computing an intensity-weighted centroid from this image. This is done in the followingstraightforward (ifsomewhat inefficient) way: An image is created in which the value at each pixel is its x-coordinate. This image is multiplied pixel-wise by the image whose centroid we wish to compute, and the sum over the resulting product image is then taken. This sum is then normalized by the sum of the input image, to yield the x-coordinate ofthe centroid. It should be noted that if the input image consists ofonly Is and Os (as in a thresholded image), then this procedure simply computes the mean x-coordinate. When the image is made up of varying gray levels (as in Figure If), it produces a weighted average, with the brightest pixels making proportionately larger contributions. The y-coordinate of the centroid is obtained in an analogous fashion.
Now that the C.R. has been localized, it is "erased" from the image of the pupil by resetting the pixels in the mask area to the mean pupil value.? This image is shown in Figure Ig. The tiny fourth Purkinje image is then localized using a procedure similar to that just described: A matched filter (center radius = I, surround radius = 3) is applied (Figure lh), and a small mask is grown about the maximum and then applied to the input exactly as was done for the CR. (Figure Ii). The position is again computed as the intensity-weighted centroid of this image. After the fourth Purkinje image has been localized, it is also "erased" from the input (Figure Ij).
Finally, the pupil is localized. Gaussian blur (o = 6.4) is applied to reduce the effects of noise (Figure lk), and the blurred image is thresholded (0 = 0.25). The resulting image is shown in Figure II. A centroid calculation is applied to this image to produce the final estimate of pupil position.
The accuracy ofthis procedure has been tested by running the algorithm on a series of synthetic images obtained by applying subpixel translations to a single source image (Mulligan & Beutter, 1995). These simulations showed an average error magnitude ofless than 0.05 pixels for localization of both the pupil and the CR., which was roughly constant for compression ratios ranging from I (no compression) to 20. This corresponds to an eye rotation of about I' of arc for the pupil and represents the limiting performance of the recovery algorithm. Other factors, such as uncompensated head movement and camera noise, may make the actual accuracy somewhat less than this. Current work is examining simultaneous measurements based on images ofboth the pupil and the retina (next section), in order to distinguish between the subjects' fixational errors (which should be correlated in the two measurements) and random error introduced by the method.
58 MULLIGAN
(a) (b) (c)
(d) (e) (t)
(g) (h) (i)
(j) (k) (l)
Figure 1. Series of images showing various stages in pupil image processing. See text for details.
Fundus-Tracking Algorithm Although pupil tracking is a sensible technique for
many applications, the optical gain is limited by the size ofthe pupil, as noted above. By imaging the retinal blood vessels, much greater optical gain can be obtained. Retinal imaging has an added advantage ofgreater immunity to head movement: Small movements ofthe head produce large movements of the entire pupil image but virtually no movement ofthe retinal image as long as the direction of gaze is fixed. While this may seem counterintuitive at first, the following argument may help to clarify the sit
uation: Imagine first that the subject fixates the center of the ophthalmoscope. The ophthalmoscope will then produce an image of the subject's fovea. If the head is then moved, the subject will make a small compensating eye movement in order to maintain fixation, and the ophthalmoscope will continue to produce an image ofthe fovea. The situation is slightly different in the actual set-up: The subject fixates a display nasal from the ophthalmoscope, which produces an image of the optic disk. In this case, when the subject maintains fixation on the display in the presence of head movement, there would be no move

59 IMPROVED EYE TRACKING
ment ofthe ophthalmoscope image if the display were at the same distance as the ophthalmoscope; a difference in the distances will introduce a small amount of parallax. Consider the case of a lateral head movement of 1 mm. For the pupil-imaging set-up described above, this will produce an image translation of approximately 33 pixels-a displacement of the pupil image such as would occur with a rotation in excess of50! For the retinal imaging set-up, the ophthalmoscope objective is located at a distance of 300 mm from the subject's eye, so the lateral shift of the eye generates a parallax of 1/300 radians, or approximately 12' of arc. This would be the induced shift if the eye were fixated at optical infinity. For closer display distances, the error will be the parallax between the display and the ophthalmoscope: There will be no induced shift for a display distance of300 mm, 6' ofarc for a display at 600 mm, 8' of arc for a display at 900 mm, and so on.
Images of the fundus were obtained using a table-top video ophthalmoscope (see Appendix A), which has a field of view of 10°; given the camera resolution of 240 lines per field, this corresponds to slightly more than 2' of arc of eye rotation per pixel of vertical image displacement, a factor of 5 better than the pupil-imaging set-up. Because only a small fraction of the retinal illumination is reflected back out ofthe eye, and because ofsafety considerations that constrain the amount of light that can be used to illuminate the fundus, a very sensitive camera is required. The camera chosen incorporates an image intensifier (COHU Model 5510). The intensifier adds its own
peculiar form of impulsive noise to the image. A typical image obtained from this apparatus is shown in Figure 2.
Previous investigators have obtained registration of fundus images by locating easily identifiable features, such as blood vessels (Womson, Hughes, & Webb, 1987). A different approach was adopted here-namely, to correlate the entire image with a reference template. The intuition behind this approach was that greater accuracy would be obtained by using the whole image, since local camera noise would have a smaller overall impact. Using a single fixed template, instead of registering each image to the previous one, avoids cumulative errors. The range of eye positions that can be tracked is relatively small, since large movements of the eye will displace the eye's natural pupil away from the system's artificial pupil. Nevertheless, the tracking range does exceed the field of view of the system, and so the template image must be made up as a mosaic of images captured during different fixations. The first step in using this instrument to measure eye position is therefore the construction of a template for each subject.
The same registration procedure is used in the construction of the template as in the analysis of experimental data, the only difference being that experimental data are registered against a fixed, precomputed template, whereas the template construction process is a "bootstrap" procedure in which the template is built up incrementally. In either case, the preprocessing steps and registration method are the same. The input video fields (248 X 640)
Figure 2. Typical image of the optic disk obtained from image-intensified camera after decompression. Under close inspection, JPEG block artifacts may be observed. Isolated small bright spots are most likely scintillation noise from the image intensifier.

60 MULLIGAN
are first cropped horizontally and zero-padded vertically to a size of 256 X 512. They are then reduced to a size of 128 X 128 after zeroing all frequency components above the Nyquist limit of the smaller size (Watson, 1986). This computation and all succeeding computations are performed using single precision (32 bit) floating-point arithmetic.
Before attempting to register the images, it is important to first remove features that do not move with the retina, which arise from nonuniformities ofthe retinal illumination as well as spatial variations in camera sensitivity. This is done by computing the mean image from a series encompassing a large number of fixations over the range to be tracked. This image is saved and subtracted from each input image. This ensures that areas not illuminated have a value of zero and that features are represented as positive and negative excursions from the mean. This also eliminates dc signals from the illuminated region and helps ensure that only the features of interest will be matched and not simply that the stationary illuminated region will match with itselffrom one frame to the next. The images are then embedded in the center of a 256 X 256 staging area. In addition to the image rows that were zero-padded prior to size reduction, there are a few lines at the bottom of the image that do not contain valid camera data (a peculiarity of the camera/digitizer); these lines are discarded, making the inset area a 116 X 128 rectangle.
A band-pass filter is then applied to the image. This filter is a compromise between two conflicting goals: On one hand, we would like to low-pass filter the image to reduce the high-frequency JPEG artifacts; on the other hand, we would like to high-pass filter the image to accentuate retinal features, such as the blood vessels, and eliminate residual effects of illumination variations' By trial and error, I have found that a difference-of-Gaussians filter having standard deviations of9 and 13 pixels works well. The filter is applied in the Fourier domain by computing the discrete Fourier transform (DFT) of the input and multiplying it by the DFT of the filter (which is precomputed and stored).
The filtered image is then registered to the template using cross-correlation. For computational efficiency, this is done in the frequency domain by multiplying the DFT of the input (obtained in the last step) by the complex conjugate of the DFT of the template. (Complex conjugation is imperative, or else one obtains the convolution.) Taking the inverse DFT of this product yields a space-domain representation of the correlation.
Because the input image is embedded in a surround of zeroes, only the corresponding region of the template is relevant for computing the cross-correlation at a given offset. The raw cross-correlation may obtain large values at nonmatch locations simply because the template has more energy there. We therefore normalize the raw correlation values by the local norm (square root of sumof-squares) ofthe template. This is done efficiently by first computing the square of the template, convolving this
image with the input window, and taking the square root. The raw correlation image can then be divided pixelwise by this image to yield the normalized correlation. The image coordinates at which the maximum value is found correspond to the optimal shift to bring the input into registration with the template.
Subpixel resolution is obtained by considering the 3 X 3 neighborhood ofpixels surrounding the maximum pixel in the cross-correlation image. A least squares fit of a quadratic surface is fit to these nine points, and the parameters of the resulting surface are used to calculate the position of the maximum of the surface. Complete details are given in Appendix B.
Before analyzing experimental data, this registration procedure is used to construct a template. A sequence of images suitable for "growing" the template is obtained by having the subject track a fixation point that moves in an expanding spiral from the center of the stimulus display.The first image is taken to be the initial template. The second image is then registered with respect to the first. After this registration has been accomplished, the new image is integrated into the current template. This is done by translating the new image by the computed offset and adding the translated image into an accumulation buffer. Noninteger pixel translations are accomplished by taking the Fourier transform and multiplying each coefficient by an appropriate complex phase factor (see Bracewell, 1965, for a discussion of the Fourier shift theorem). Because different input images cover different parts of the template, different parts ofthe template will be added to by different numbers of input images, and so each pixel of the template accumulator must be normalized appropriately. This is done by maintaining a separate "count" image: Each time an input image is translated, a "mask" image consisting of a rectangle of ones (representing the valid input data) is translated by the same amount and added to the "count" accumulator. The template is obtained by dividing (pixel-wise) the template accumulator by the count accumulator. Pixels in the count accumulator that have a value ofzero at this step are first changed to a value ofone, to avoid divide-by-zero errors; the template accumulator necessarily also has a value of zero at these locations. The template used for registration is constructed from translated versions of the bandpass filtered images, but the same translations are also used to construct an image from the unfiltered images, to produce a natural-looking image and perhaps reveal high-frequency details not visible in the individual images (Figure 3).
I have tested the accuracy of this procedure using an input sequence consisting ofa series of subimages taken from the template in Figure 3. Subimages of size 128 X 128 were cropped from the template at a series of locations taken from a 32 X 32 grid. The spacing between adjacent sampling grid locations was 3 pixels, and an 18pixel border at the edge of the template was skipped over. Each ofthese images was then registered to the precomputed template, as described above. The horizontal and

61 IMPROVED EYE TRACKING
Figure 3. Template image constructed from unfiltered input images using displacements computed from band-pass versions.
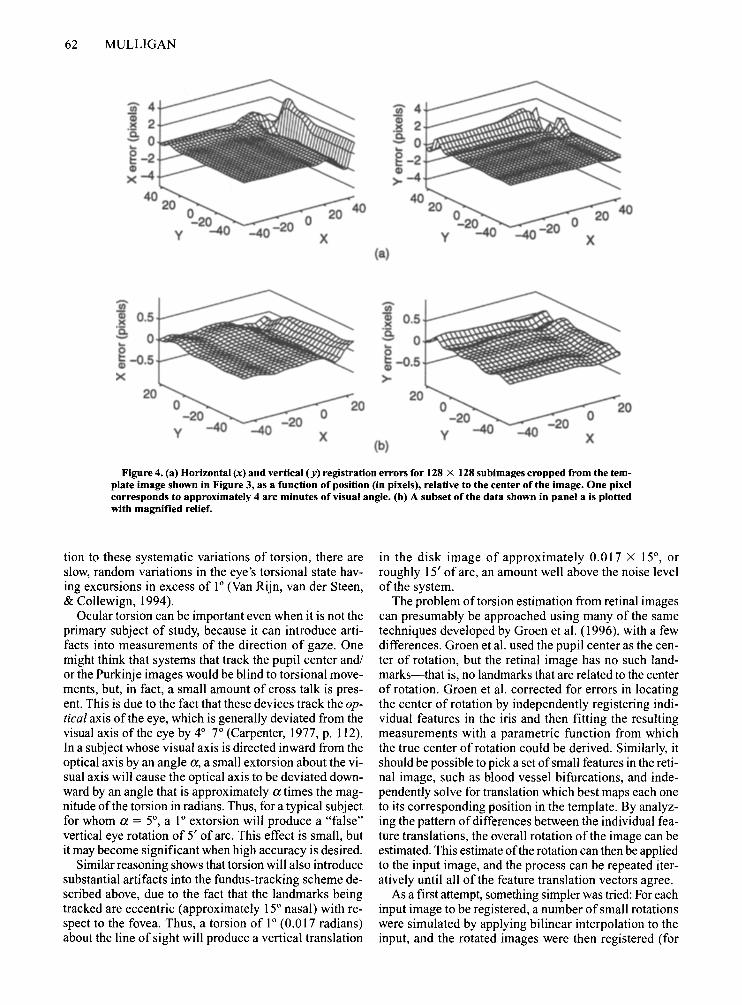
vertical registration errors were computed by subtracting the known offsets from the estimated values. These data are shown in Figure 4a.
Several features may be noted in Figure 4a. It should not be surprising that the worst performance occurs for subimages taken from the upper right-hand part of Figure 3, because that is the area of least detail; we cannot expect any procedure to do a good job ofregistration when there is scant input data. Second, for the subimages taken from the upper portion of Figure 3, we see that the vertical errors are larger than the horizontal errors. This fact is easily understood by noting that the principal feature in this region is the thick blood vessel that exits up and to the left from the disk. Similarly, the principal feature in the right-hand portion of Figure 3 is the smaller, nearly horizontal vessel that heads off toward the lower righthand corner; here, we see that the largest errors are in the horizontal dimension.
Figure 4b shows a more detailed view ofthe errors from subimages, including a substantial part of the disk, where registration accuracy is good. The main point to note here is that the errors are not independent from point to point (as might be expected ifthey arose from numerical round-off error) but vary smoothly and systematically across the image. The subpixel estimation procedure (Appendix B) uses the neighboring values of the correlation and interpolates to find the maximum; because only integer shifts were used for this test, any asymmetries in the flanking values will bias the estimate away from the true integer value. The subpixel estimation pro
cedure employed here would not be expected to work for a white-noise image, where the autocorrelation function is a single delta function at the origin and the flanking values carry no special information. It works here because of the low-pass component of the filter that we have applied to the images: For a single sine-wave grating, the autocorrelation is also a sinusoid, and we would expect the subpixel estimation procedure to work well. For the more complex template image, residual asymmetries in the autocorrelation after filtering are presumably responsible for the errors seen in the lower panels of Figure 4. Because ofthe systematic nature of these errors, the data in Figure 4 could, in principle, be used to construct a correction table.
Ocular Torsion Image-based methods for eye-movement tracking have
the advantage that the image data allow the recovery of ocular torsion (rotation of the eye about the line of sight). Methods to do this using images of the iris have been demonstrated that can have a resolution as small as 5' of arc (Curthoys et al., 1992; Bos & de Graaf, 1994; Groen, Nacken, Bos, & de Graaf, 1996). Measurement of torsion is particularly important in free-head situations, because there is a torsional component of the vestibuloocular reflex (Belcher, 1964;Merker & Held, 1981;Miller, 1962). Small torsional movements also result when a subject is stimulated by rotational movement in the image plane (Kertesz & Jones, 1969; Merker & Held, 1981; Wade, Swanston, Howard, Ono, & Shen, 1991). In addi
62 MULLIGAN
(a)
Ii) Ii)
~ 0.5 ~ 0.5 '5. '5. I .:s:~~':' 0 ':' O.,J,../l o o ~ -0.5 ~-0.5
>< >20
(b)
Figure 4. (a) Horizontal (x) and vertical (y) registration errors for 128 X 128 subimages cropped from the template image shown in Figure 3, as a function of position (in pixels), relative to the center ofthe image. One pixel corresponds to approximately 4 arc minutes of visual angle. (b) A subset of the data shown in panel a is plotted with magnified relief.
tion to these systematic variations of torsion, there are slow, random variations in the eye's torsional state having excursions in excess of 1° (Van Rijn, van der Steen, & Collewign, 1994).
Ocular torsion can be important even when it is not the primary subject of study, because it can introduce artifacts into measurements of the direction of gaze. One might think that systems that track the pupil center and! or the Purkinje images would be blind to torsional movements, but, in fact, a small amount of cross talk is present. This is due to the fact that these devices track the optical axis of the eye, which is generally deviated from the visual axis of the eye by 4°-r (Carpenter, 1977, p. 112). In a subject whose visual axis is directed inward from the optical axis by an angle a, a small extorsion about the visual axis will cause the optical axis to be deviated downward by an angle that is approximately a times the magnitude ofthe torsion in radians. Thus, for a typical subject for whom a = 5°, a 1° extorsion will produce a "false" vertical eye rotation of 5' of arc. This effect is small, but it may become significant when high accuracy is desired.
Similar reasoning shows that torsion will also introduce substantial artifacts into the fundus-tracking scheme described above, due to the fact that the landmarks being tracked are eccentric (approximately 15° nasal) with respect to the fovea. Thus, a torsion of 1° (0.017 radians) about the line of sight will produce a vertical translation
in the disk image of approximately 0.017 X 15°, or roughly 15' of arc, an amount well above the noise level of the system.
The problem of torsion estimation from retinal images can presumably be approached using many of the same techniques developed by Groen et al. (1996), with a few differences. Groen et al. used the pupil center as the center of rotation, but the retinal image has no such landmarks-that is, no landmarks that are related to the center of rotation. Groen et al. corrected for errors in locating the center of rotation by independently registering individual features in the iris and then fitting the resulting measurements with a parametric function from which the true center of rotation could be derived. Similarly, it should be possible to pick a set ofsmall features in the retinal image, such as blood vessel bifurcations, and independently solve for translation which best maps each one to its corresponding position in the template. By analyzing the pattern of differences between the individual feature translations, the overall rotation of the image can be estimated. This estimate ofthe rotation can then be applied to the input image, and the process can be repeated iteratively until all of the feature translation vectors agree.
As a first attempt, something simpler was tried: For each input image to be registered, a number of small rotations were simulated by applying bilinear interpolation to the input, and the rotated images were then registered (for

63 IMPROVED EYE TRACKING
translation only) with the template, as described above. For each trial rotation, the maximum value of the normalized correlation was retained. When plotted as a function of rotation angle, the resulting data are well fit by a quartic polynomial (although this author has been unable to divine a theoretical reason why they should). The initial tests that determined that a quartic polynomial provided a good fit were done with 33 samples of rotation angle; the fits were so good that the torsion estimates were not substantially changed when the number of samples was reduced to 5, and this is the number of samples that was used in the simulations described below. The parameters of the best-fitting (in the least squares sense) quartic were determined using the singular value decomposition in a manner analogous to the localization of the maximum described in Appendix B. The rotation angle corresponding to the maximum of the quartic is then found from the parameters using an iterative procedure.
This process was tested using a method similar to that used to assess the translation-only performance of the cross-correlation procedure: A series of images having known torsions and translations was created from the template. A 16 X 16 grid of displacements was used to bring different portions of the template to the center of the image. The grid was chosen to consist of translations that could be recovered with high accuracy (see Figure 4). After each translation was applied to the template, a series of rotations was applied using bilinear interpolation. The range of rotations was ±2°, sampled in steps of 0.25°. Thus, a total of 4,352 images were computed and stored and were subsequently passed to the modified tracking program that estimated torsion and both horizontal and vertical displacements for each image. The average error across position and applied rotation was computed to be -0.027°, with a standard deviation of 0.114°. This amount of error is on a par with the resolution of methods that use video images of the pupil (Bos & de Graaf, 1994; Curthoys et a!., 1992; Groen et aI., 1996).
For many ofthe positions sampled, the error in the estimate of torsion either was relatively constant or varied smoothly with applied rotation. This suggests that the errors are not random but arise from the particular features of the template in a systematic way, as was suggested in the previous section for the translational errors. Similarly, errors in the estimation of torsion vary smoothly and systematically with position, and it may therefore be possible to apply a systematic correction to produce a large increase in accuracy.
CONCLUSIONS
Eye-movement tracking using video images of either the pupil or the retina is a low-cost approach that is capable of high performance when off-line data analysis is acceptable. New video compression technology allows streams of video images to be acquired and stored on
normal computer system disks. At low compression rates, tracking accuracy is only slightly degraded and is significantly better than many more expensive real-time systems. Access to the raw image data makes possible the measurement of ocular torsion, in addition to gaze direction.
REFERENCES
BELCHER, S. J. (1964). Ocular torsion. British Journal ofPhysiological Optics, 21, 1-20.
Bos, J. E., & DEGRAAF, B. (1994). Ocular torsion quantification with video images. IEEE Transactions on Biomedical Engineering, 41, 351-357.
BRACEWELL, R. N. (1965). The Fourier transform and its applications. New York: McGraw-Hill.
CARMODY, D. P., KUNDEL, H. L., & NODINE, C. F. (1980). Performance of a computer system for recording eye fixations using limbus reflection. Behavior Research Methods & Instrumentation, 12, 63-66.
CARPENTER, R. H. S. (1977). Movements of the eyes. London: Pion Limited.
COLLEWIJN, H. (1977). Eye and head movements in freely moving rabbits. Journal ofPhysiology, 266, 471-498.
CRANE, H. D., & STEELE, C. S. (1978). Accurate three-dimensional eye tracker. Applied Optics, 17, 691-705.
CURTHOYS, 1. S., MOORE, S. T., McCoy, S. G., HALMAGYI, G. M., MARKHAM, C. H., DIAMOND, S. G., WADE, S. W., & SMITH, S. T. (1992). VTM-A new method of measuring ocular torsion using image-processing techniques. In B. Cohen, D. L. Tomko, & F.Guedry (Eds.), Sensing and controlling motion: Vestibular and sensorimotor function (Annals of the New York Academy ofSciences, Vol. 656, pp. 826-828). New York: New York Academy of Sciences.
EADIE, A. S., PuGH, J. R., & HERON, G. (1994). The measurement of small eye movements using an infra-red limbus reflection technique. In G. d'Ydewalie & 1. Van Rensbergen (Eds.), Visual and oculomotor functions: Advances in eye movement research. Studies in visual information processing (Vol. 5, pp. 409-421). Amsterdam: Elsevier, North-Holland.
GROEN, E., NACKEN, P. F. M., Bos, J. E., & DEGRAAF, B. (1996). Determination of ocular torsion by means of automatic pattern recognition.IEEE Transactions on Biomedical Engineering, 43, 471-479.
HUNT, R. W. G. (1987). The reproduction of colour in photography, printing and television. Tolworth, UK.: Fountain.
KERTESZ, A. E., & JONES, R. W. (1969). The effect of angular velocity of stimulus on human torsional eye movements. Vision Research, 9, 995-998.
MERKER, B. H., & HELD, R. (1981). Eye torsion and the apparent horizon under head tilt and visual field rotation. Vision Research, 21, 543-547.
MILLER, E. F. (1962). Counter-rolling of the human eyes produced by head tilt with respect to gravity. Acta Oto-Laryngologica, 54, 479-50 I.
MULLER, P. D., CAVEGN, D., D'YDEWALLE, G., & GRONER, R. (1993). A comparison of a new limbus tracker, corneal reflection technique, Purkinje eye tracking and electro-oculography. In G. d'Ydewalie & 1.Van Rensbergen (Eds.), Perception and cognition: Advances in eye movement research. Studies in visual information processing (Vol. 4, pp. 393-401). Amsterdam: Elsevier, North-Holland.
MULLIGAN, J. B. (1996). When are supercomputers worth the bother? Behavior Research Methods, Instruments, & Computers, 28, 239-240.
MULLIGAN, J. B., & BEUTTER, B. R. (1995). Eye-movement tracking using compressed video images. In Vision science and its applications (1995 OSA Technical Digest Series, Vol. I, pp. 163-166). Washington, DC: Optical Society of America.
PENNEBAKER, W. B., & MITCHELL, J. L. (1993). JPEC still image data compression standard. New York: Van Nostrand Reinhold.
PRESS, W. H., TEUKOLSKY, S. A, VETTERLING, W. T.,& FLANNERY, B. P. (1992). Numerical recipes in C. Cambridge: Cambridge University Press.

64 MULLIGAN
ROBINSON, D. A. (1963). A method of measuring eye movementusing a scleral search coil in a magnetic field. IEEE Transactions on Biomedical Electronics, BME-I0, 137-145.
TELLER, D. Y., & PALMER, 1. (1996). Infant color vision-Motion nulls for red green vs. luminance modulated stimuli in infants and adults. Vision Research, 36, 955-974.
VAN RUN, L.1., VAN DER STEEN,1., & COLLEWUN, H. (1994). Instability of ocular torsion during fixation: Cyclovergence is more stable than cycloversion. Vision Research, 34, 1077-1087.
WADE, N. 1., SWANSTON, M. T., HOWARD, I. P., ONO, H., & SHEN, X. (1991). Induced rotary motion and ocular torsion. Vision Research, 31, 1979-1983.
WATSON, A. B. (1986). Ideal shrinking and expansion ofdiscrete sequences (NASA Technical Memorandum88202). Springfield, VA: National TechnicalInformation Service.
WORNSON, D. P.,HUGHES, G. W.,& WEBB, R. H. (1987). Fundus tracking with the scanning laser ophthalmoscope, Applied Optics, 26, 1500-1504.
YOUNG, L. R.,& SHEENA, D. (1975). Surveyof eye movementrecording methods.Behavior Research Methods & Instrumentation, 7, 397-429.
NOTES
I. Since this work was begun, it has come to my attention that SensoMotoricInstrumentsGmbH (Teltow, Germany)offers a real-timesystem with subpixel image processing that claims a resolution of 15" of arc; due to the high price of these instruments, the methods described in this paper may still be of interest to many investigators.
2. While not as variable between subjectsas iris lightness, the mean pupil value is affected by imaging variables, such as illumination intensity, and is determined empiricallyfor each set of images.
3. The mean subtraction method of illumination compensation does not take into account the pattern of illumination changes that occurs with large eye movements due to partial occlusion of the illumination beamby the eye's natural pupil.
APPENDIX A Optical Design of Video Ophthalmoscope
The design of the prototype optical system is shown in Figure 5, which is a top view (not to scale). The primary illumination source is a quartz-halogen incandescent lamp IL, producing both visible and infrared radiation. The desired portion of the spectrum is selected by Filter Fl. This image is relayed by Lens L2 and Mirror MI and reformed on Mirror M2. Unlike the other plane mirrors in the system, Mirrors MI and M2 are
C
<: SE
Figure 5. Optical design of table-top video ophthalmoscope (not to scale). See text for details.
not in the vertical plane and therefore bend the beam out ofthe horizontal plane. Mirror M I bends the beam down onto the margin of Mirror M2, which redirects the beam back into the horizontal plane toward spherical Mirror M3. The subject's pupil is imaged by spherical Mirror M3 onto the edge of Mirror M2; Mirror M2 is positioned so its edge falls in the middle ofthe image ofthe pupil, effectively dividing the pupil into separate entrance and exit pupils. Mirror M3 is used instead of a lens as the final imaging element to eliminate the problem ofsecondary surface reflections degrading image quality. Light from the illumination beam enters through the upper halfof the subject's pupil and strikes the retina, illuminating a circular patch corresponding to the subject's view of Mirror M3. (When visible illumination is used, the subject sees Mirror M3 uniformly filled with light.) This light is reflected by the retina, some of which passes back out the pupil. Light from the lower half of the pupil is reflected by spherical Mirror M3 and passes over Mirror M2, striking Mirror M4, which directs the beam to Camera C 1. Thus, the light seen by Camera C 1 comes only from parts of the pupil not illuminated by the incoming beam, eliminating the problem of secondary reflections from the cornea. Mirror M3 is located approximately two focal lengths from the subject's eye (SE) and Mirror M2, with an aerial image ofthe retina being formed midway between Mirrors M2 and M3. This image is viewed by Camera CI.
APPENDIXB Subpixel Estimation of Correlation Maximum
Using the Singular Value Decomposition
Let {Xi,j} be the set of pixel values centered on the maximum for i,j E{-I,O,I}. We assume that the values can be well described by a quadratic surface Yi.j' where
Yi.j = ai 2 + bij + ej? + di + ej + f. (I)
Equation 1 implies the following matrix equation that relates the surface values Yi,j at the nine sample points to the parameters:
Y-l,-l
Y-l,O 1 1 1 -1 -1 1 1 0 0 -1 0
Y-l,l 1 -1 1 -1 1
YO,-l 0 0 1 0 -1 Yo,o =0 0 0 0 0 (2)
0 0 1 0 1 YO,l
1 -1 1 1 -1 i[~lYl,-l 1 0 0 1 0 Yl,O I 1 1 1 1
Yl,l
Now, we wish to obtain the parameters (a,b,c,d,e,f) for which the correspondingYi.j have the minimum sum-of-squared deviations from the data Xi,j' This is done using the pseudo-inverse ofthe matrix in Equation 2, which may be obtained using the singular value decomposition (SYD). The subroutine svdcmp() from the Numerical Recipes library (Press, Teukolsky, Yetterling, & Flannery, 1992) conveniently performs the SYD of the matrix. This is done once, and the results are saved for subsequent use with the companion routine svbksb(), which performs "back-substitution" to transform successive sets of input data into the desired six parameters.
The remaining step is to obtain the location of the peak ofthe parametric surface from the parameters. This is done by differentiating Equation 1 with respect to i andj:

65
oy = 2ai + b} + d, (3a)oi
Z= 2c}+bi+e. (3b)
We set both equal to zero, and solve each for i:
i = _---'-(b-=-'i_+_d'"-) (4a)2a
-(2c) + e)i= (4b)
b
We equate these two expressions for i, and solve for} to obtain:
IMPROVED EYE TRACKING
. (2ae - db) (5)) = (b 2 - 4ac) .
By symmetry, the corresponding solution for i is obtained by exchanging a with c, and d with e:
. (2cd - eb) 1= (6)
(b2 - 4ac) .
This computation results in fractional values i and} (L\y and L\x, respectively, ifthe normal conventions are followed), which are added to the integer coordinates ofthe correlation maximum to obtain a subpixel estimate.