imaging subsurface lithological and structural features...
TRANSCRIPT
Tassone et al.562
Imagingsubsurfacelithologicalandstructuralfeaturesbyresistivitytomography:NorthBeagleChannel(TierradelFuego,Argentina)
Alejandro Tassone1,*, Melina Santomauro1, Marco Menichetti2, María Elena Cerredo3, Marcela Beatriz Remesal3, Horacio Lippai1,
Emanuele Lodolo4, and Juan Francisco Vilas1
1 CONICET - Instituto de Geofísica “Daniel A. Valencio”. Departamento de Ciencias Geológicas, Facultad de Ciencias Exactas y Naturales. Universidad de Buenos Aires, Argentina.
2 Istituto di Scienze della Terra, Università di Urbino. I-61029 Urbino, Italy.3 CONICET - Departamento de Ciencias Geológicas. Facultad de Ciencias Exactas y Naturales,
Universidad de Buenos Aires, Argentina.4 Istituto Nazionale di Oceanografia e Geofisica Sperimentale – Borgo Grotta Gigante,
42/c. 34010 Sgonico. Trieste, Italy.* [email protected]
ABSTRACT
Worldwide, the study of fold and thrust belts and characterization of structures are mainly carried out through superficial geological observations and seismic reflection, as the main geophysical prospecting method. In this study we show how the resistivity method is a useful tool for identification of shallow structures (upper 80 m) when combined with the knowledge of the local geology. This is a relative low cost and easily applicable method, which can contribute to image both lithological boundaries and subsurface structures.
The Andes Fueguinos in the area of the Beagle Channel are characterized by a sequence of NNE-verging thrusts stacks of basement emplaced during the middle Cretaceous-Tertiary Andean orogenesis, combined with a strong left lateral strike-slip component. An electric resistivity survey to obtain a 2D electric resistive tomography (ERT) was carried out in the northern shore of the Beagle Channel, west of Ushuaia, in order to better understand the geometric relationships between the basement and cover units in this part of the thrust belt. The method employed, integrated with a field geological survey, allowed to differentiate the electrical signatures of different thin sheets of the thrust belt, where the major faults are recognized by a decrease in resistivity values and sharp lateral variations. Furthermore, the resistivity section shows a good spatial correspondence with a geological section of the study area, where the continuity of the tectonic boundary between the basement (Lapataia Formation) and synrift units (Lemaire Formation) could be followed at depth.
Key words: electrical resistivity tomography, Fuegian Andes, Argentina.
RESUMEN
En general, el estudio de fajas plegadas y corridas se realiza principalmente por medio de observaciones geológicas de superficie y sísmica de reflexión, como principal método geofísico de
Revista Mexicana de Ciencias Geológicas, v. 27, núm. 3, 2010, p. 562-572
Tassone,A.,Santomauro,M.,Menichetti,M.Cerredo,M.E.,Remesal,M.B.,Lippai,H.,Lodolo,E.,Vilas,J.F.,2010,Imagingsubsurfacelithologicalandstructuralfeaturesbyresistivitytomography:NorthBeagleChannel(TierradelFuego,Argentina)),v.27,núm.3,p.562-572.
Subsurface lithological and structural features by resistivity tomography: North Beagle Channel 563
prospección. El empleo del método resistivo, combinado con un conocimiento geológico local, resulta una herramienta útil para la identificación de estructuras someras (hasta alrededor de los 80 m de profundidad). Siendo su aplicación sencilla y de relativo bajo costo, permite detectar tanto contactos litológicos como estructuras subsuperficiales.
Los Andes Fueguinos, en el área del Canal de Beagle, se caracterizan por una secuencia de corrimientos con vergencia al NNE emplazados durante la orogenia Andina del Cretácico medio-Terciario, combinado con una importante componente de desplazamiento de rumbo izquierdo. Para una mejor comprensión de las relaciones geométricas entre el basamento y las unidades de la cobertura sedimentaria en esta parte de la faja plegada y corrida, se ha llevado a cabo un levantamiento eléctrico–resistivo de manera de obtener una tomografía eléctrico–resistiva en dos dimensiones (ERT) en la costa norte del Canal de Beagle, al oeste de la ciudad de Ushuaia. Dicho método fue acompañado por un levantamiento de geología de superficie que permitió diferenciar las respuestas eléctricas de diferentes fajas de corrimiento, donde las fallas principales se reconocen por una disminución en los valores de resistividad y bien definidas variaciones laterales. Asimismo, la tomografía resistiva muestra una buena correspondencia espacial con la sección geológica de superficie del área de estudio, donde la continuidad del contacto tectónico entre el basamento (Formación Lapataia) y las unidades de synrift (Formación Lemaire) puede seguirse en profundidad.
Palabras clave: tomografia de resistividad eléctrica. Andes Fueguinos. Argentina.
INTRODUCTION
InvestigationofthecomplexMesozoic-CenozoicevolutionofthesouthernmostAndeshasmostlyreliedonclassical field geology, often combined with geophysical surveys(seismic,magnetometric,gravimetricsurveys,Lodoloet al.,2003,2007;Tassoneet al.,2005;Peroniet al., 2009, among others), combination which proved to be a powerful tool to achieve closer insights into the geodynamic evolutionoftheFuegianregion.
Arelativelyrecentgeophysicalmethodistheelectricresistivity tomography (ERT) which has resulted successful indeterminingthegeometryandsomestructuralfeaturesand major lithological characteristics in the first tens to several hundred meters below surface (Caputo et al.,2003,2007;Demanetet al.,2001;Fazzitoet al.,2009;Gianoet al., 2000; Griffiths and Barker 1993; Nivièreet al.,2008;Nguyenet al., 2007; Spichak et al.,2002;Storzet al.,2000;Wiseet al.,2003)
In this contribution we present the results of a 2D ERTsurveyperformedalmostnormaltomajorstructuresin the Bahía Ensenada area, southwestern Tierra del Fuego (Argentina), which are further analyzed and interpreted within the geological context. The study area is mostly blanketed by Quaternary deposits and forests that make difficult and imprecise to define the continuity of litholo-giesandstructuresrecognizedinoutcrops.Compressiveand strike-slip faults characterize the structural grain in the studyarea;thesefaultsarethefocusofourinvestigationwith the objectives of defining their geometries and kine-matics.Althoughdepthlimitedtotheuppermosthundredmeters,theERTisausefultooltoshedsomelightintotheshallow anatomy of complexly deformed regions, especially for defining the most recent active structures affecting the Quaternary cover.
GEOLOGICAL AND TECTONIC OUTLINE
From a structural point of view, the region of the TierradelFuegoisland(Figure1)canberoughlysub-dividedintoseveralWNW-ESEtrendingphysiographicprovinces (Kranck, 1932; Winslow, 1982; Dalziel and Brown, 1989; Suárez et al.,2000;OliveroandMartinioni,2001;Menichettiet al.,2008andreferencestherein).Themost internal province lies between the forearc active ocean/continentconvergencemarginoftheChiletrenchandthelate Miocene accretionary wedge in the Pacific Ocean. It is attachedtothesouthernTierradelFuegoarchipelagoalongthe Beagle Channel area, where the Mesozoic-Cenozoic Fuegian calc-alkaline batholith crops out. The Andean CordilleracomprisesthenorthernshoreoftheBeagleChannelarea,theNavarinoIsland,theeasternpartoftheHosteIslandandthesouthernarchipelago;italsoincludesthe metamorphic core complex of the Darwin Cordillera. Here, the oldest rocks, which are the former metamorphic basementoftheFuegianchain,cropoutinpolydeformedmediumtohigh-grademetasedimentaryandmetavolcanicrocks of garnet and amphibolite facies (Dalziel and Brown, 1989). The continent-ward slope of the mountain belt con-stitutes the Fuegian Cordillera with the main NE verging thrusts complexes. The rocks that crop out here are mainly schistsandphyllitesofprehnite-pumpellytetogreenschistmetamorphicfacies(Kohnet al.,1995).Thestructuralstyleis typical of thick-skinned tectonics, involving the basement rocks with polyphase ductile deformation and post-tectonic intrusions.TheexternalprovincecomprisestheMagallanesfold-and-thrust belt, which is located north of the Seno Almirantazgo and Fagnano Lake, across the central-north partofTierradelFuegoIsland.CenozoicsedimentsoftheSWpartoftheMagallanesforelandbasinaretheproductof thin-skinned tectonics style, including shallow NNE

Tassone et al.564
Dalzielet al.,1974;Bruhn,1979;Dalziel,1981).Around100Ma,ageneralphaseofcompressionaltectonicsledtotheclosureoftheRocasVerdesbasinandthecontempo-raneousdevelopmentoftheCordilleraandtheMagallanesforeland basin, with deposition of clastic sediments sourced intheCordillera.FromlateMesozoicthroughTertiary,theTierra del Fuego region underwent continent-ward propa-gation of the Magallanes fold-and-thrust-belt (Winslow, 1982;Biddleet al.,1986;Menichettiet al.,2008).Thiscompressive tectonics may have been synchronous with lo-calized strike-slip regime which possibly accommodated the relative motions between South America and the Antarctic continentsinceEarlyCretaceous(Cunningham,1993,1995; Peroniet al.,2009).
BAHÍA ENSENADA AREA
BahíaEnsenadabelongstothemostinternalprovinceof the Fuegian Cordillera (Figure 2). Here, the oldest rocks, formallythebasementofthechain(LapataiaFormationinArgentineTierradelFuego),areexposedinthrustsheetsover Jurassic volcanic and sedimentary rocks of Lemaire Formation(Bruhn,1979;Oliveroet al.,1997).Thegeom-etry of the structures is related to at least two compressive phases, with folding and thrusting at different structural
verging thrust systems. Tight folds with shallow thrusts arestretchedinanE-WdirectionbytheNeogenesinistralstrike-slip faults, reaching the Atlantic coast. The Fuegian foothills,northoftheTierradelFuegoIsland,representthemostexternalprovinceandareformallyincludedaspartoftheMagallanesforelandbasin;thisprovinceisdominated by Neogene terrigenous sediments with slight deformation,involvedinlargeamplitudefolds(Menichettiet al.,2008).
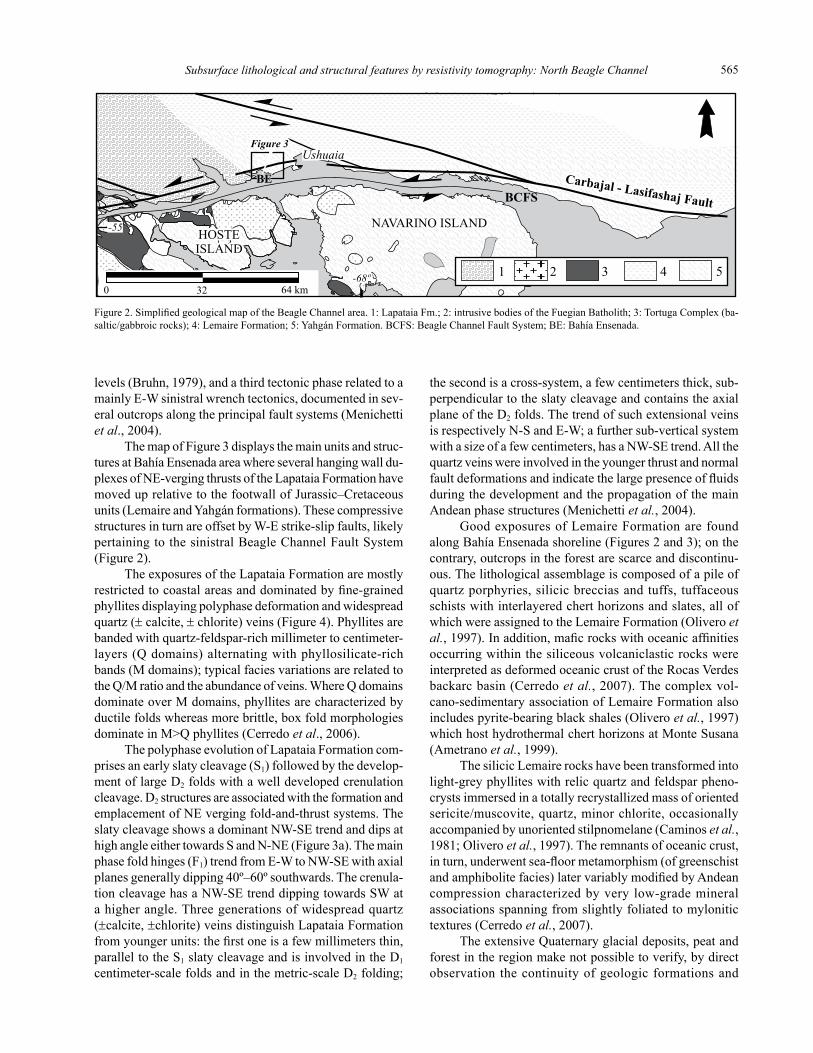
Thegeologic-tectonicarrangementof theTierradelFuegoislandistheproductofthelongandcomplexMesozoic-CenozoicevolutionofsouthernmostSouthAmerica, which started with an early Mesozoic active mar-gin of Gondwana stretching between the adjacent southern South America-Antarctic Peninsula and the Pacific margin (DalzielandElliot,1973;Dalziel,1982).SinceMiddleJurassic, the southern part of the continent underwent a widespread extensional phase associated with the breakup of Gondwana; the Jurassic was characterized by crustal melting which resulted in the silicic volcanism of the Large IgneousProvinceofPatagoniaandAntarcticPeninsula(Pankhurst et al.,2000)andtheproductionofoceaniccrustin the Rocas Verdes back-arc basin in the southernmost SouthAmerica(representedbytheTortugaandSarmientoophioliticcomplexes,Figure2),andsubsequentdepositionofquasi-marinesequences(RocasVerdesassemblages;
Figure 1. Major morphotectonic provinces in the region of Tierra del Fuego. Inset shows main plates and plate boundaries in the South Atlantic. TdF: Tierra del Fuego; NSR: North Scotia Ridge; SSR: South Scotia Ridge; SFZ: Shackleton Fracture Zone; CHT: Chile Trench.
Subsurface lithological and structural features by resistivity tomography: North Beagle Channel 565
levels(Bruhn,1979),andathirdtectonicphaserelatedtoamainly E-W sinistral wrench tectonics, documented in sev-eraloutcropsalongtheprincipalfaultsystems(Menichettiet al.,2004).
ThemapofFigure3displaysthemainunitsandstruc-tures at Bahía Ensenada area where several hanging wall du-plexesofNE-vergingthrustsoftheLapataiaFormationhavemoved up relative to the footwall of Jurassic–Cretaceous units (Lemaire and Yahgán formations). These compressive structures in turn are offset by W-E strike-slip faults, likely pertainingtothesinistralBeagleChannelFaultSystem(Figure2).
TheexposuresoftheLapataiaFormationaremostlyrestricted to coastal areas and dominated by fine-grained phyllites displaying polyphase deformation and widespread quartz(±calcite,±chlorite)veins(Figure4).Phyllitesarebanded with quartz-feldspar-rich millimeter to centimeter- layers (Q domains) alternating with phyllosilicate-rich bands(Mdomains);typicalfaciesvariationsarerelatedtothe Q/M ratio and the abundance of veins. Where Q domains dominateoverMdomains,phyllitesarecharacterizedbyductile folds whereas more brittle, box fold morphologies dominate in M>Q phyllites (Cerredo et al.,2006).
ThepolyphaseevolutionofLapataiaFormationcom-prisesanearlyslatycleavage(S1) followed by the develop-mentoflargeD2 folds with a well developed crenulation cleavage.D2 structures are associated with the formation and emplacementofNEvergingfold-and-thrustsystems.Theslaty cleavage shows a dominant NW-SE trend and dips at high angle either towards S and N-NE (Figure 3a). The main phasefoldhinges(F1) trend from E-W to NW-SE with axial planes generally dipping 40º–60º southwards. The crenula-tion cleavage has a NW-SE trend dipping towards SW at a higher angle. Three generations of widespread quartz (±calcite,±chlorite)veinsdistinguishLapataiaFormationfrom younger units: the first one is a few millimeters thin, paralleltotheS1slatycleavageandisinvolvedintheD1centimeter-scalefoldsandinthemetric-scaleD2folding;
the second is a cross-system, a few centimeters thick, sub-perpendiculartotheslatycleavageandcontainstheaxialplaneoftheD2folds.ThetrendofsuchextensionalveinsisrespectivelyN-SandE-W;afurthersub-verticalsystemwith a size of a few centimeters, has a NW-SE trend. All the quartz veins were involved in the younger thrust and normal fault deformations and indicate the large presence of fluids duringthedevelopmentandthepropagationofthemainAndeanphasestructures(Menichettiet al.,2004).
GoodexposuresofLemaireFormationarefoundalongBahíaEnsenadashoreline(Figures2and3);onthecontrary,outcropsintheforestarescarceanddiscontinu-ous.Thelithologicalassemblageiscomposedofapileofquartzporphyries,silicicbrecciasandtuffs,tuffaceousschists with interlayered chert horizons and slates, all of which were assigned to the Lemaire Formation (Olivero et al., 1997). In addition, mafic rocks with oceanic affinities occurring within the siliceous volcaniclastic rocks were interpretedasdeformedoceaniccrustoftheRocasVerdesbackarc basin (Cerredo et al.,2007).Thecomplexvol-cano-sedimentaryassociationofLemaireFormationalsoincludes pyrite-bearing black shales (Olivero et al.,1997)which host hydrothermal chert horizons at Monte Susana (Ametranoet al.,1999).
The silicic Lemaire rocks have been transformed into light-grey phyllites with relic quartz and feldspar pheno-crystsimmersedinatotallyrecrystallizedmassoforientedsericite/muscovite, quartz, minor chlorite, occasionally accompaniedbyunorientedstilpnomelane(Caminoset al.,1981;Oliveroet al.,1997).Theremnantsofoceaniccrust,in turn, underwent sea-floor metamorphism (of greenschist and amphibolite facies) later variably modified by Andean compression characterized by very low-grade mineral associationsspanningfromslightlyfoliatedtomylonitictextures(Cerredoet al.,2007).
The extensive Quaternary glacial deposits, peat and forest in the region make not possible to verify, by direct observationthecontinuityofgeologicformationsand
Figure 2. Simplified geological map of the Beagle Channel area. 1: Lapataia Fm.; 2: intrusive bodies of the Fuegian Batholith; 3: Tortuga Complex (ba-saltic/gabbroic rocks); 4: Lemaire Formation; 5: Yahgán Formation. BCFS: Beagle Channel Fault System; BE: Bahía Ensenada.
Tassone et al.566
x x
BahiaEnsenada
SW NE200
s.l.
200
400
600
m
400
300
200
100
100
200
500
100
200
54º 52.06’S
68º
29.8
8’W
Río Pipo
A
A
A
A'
A'
0 1 km
BEAGLE CHANNEL
BahiaEnsenada
I. Redonda
54º 49.68’S 68º 2
5.1
1’W
M.Susana
1
a b c
2 3 4 5 6 7 8 9 10 11
NN N
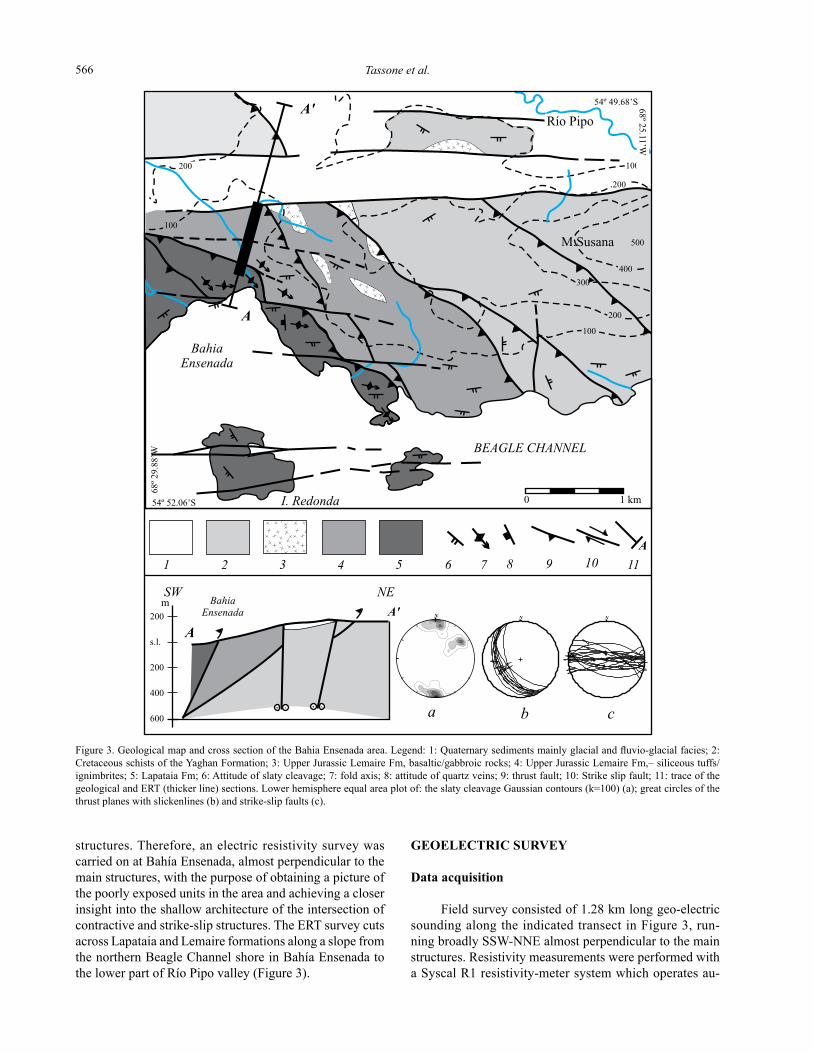
structures. Therefore, an electric resistivity survey was carriedonatBahíaEnsenada,almostperpendiculartothemain structures, with the purpose of obtaining a picture of thepoorlyexposedunitsintheareaandachievingacloserinsight into the shallow architecture of the intersection of contractive and strike-slip structures. The ERT survey cuts acrossLapataiaandLemaireformationsalongaslopefromthenorthernBeagleChannelshoreinBahíaEnsenadatothe lower part of Río Pipo valley (Figure 3).
GEOELECTRIC SURVEY
Data acquisition
Field survey consisted of 1.28 km long geo-electric soundingalongtheindicatedtransectinFigure3,run-ningbroadlySSW-NNEalmostperpendiculartothemainstructures. Resistivity measurements were performed with a Syscal R1 resistivity-meter system which operates au-
Figure 3. Geological map and cross section of the Bahia Ensenada area. Legend: 1: Quaternary sediments mainly glacial and fluvio-glacial facies; 2: Cretaceous schists of the Yaghan Formation; 3: Upper Jurassic Lemaire Fm, basaltic/gabbroic rocks; 4: Upper Jurassic Lemaire Fm,– siliceous tuffs/ignimbrites; 5: Lapataia Fm; 6: Attitude of slaty cleavage; 7: fold axis; 8: attitude of quartz veins; 9: thrust fault; 10: Strike slip fault; 11: trace of the geological and ERT (thicker line) sections. Lower hemisphere equal area plot of: the slaty cleavage Gaussian contours (k=100) (a); great circles of the thrust planes with slickenlines (b) and strike-slip faults (c).

Subsurface lithological and structural features by resistivity tomography: North Beagle Channel 567
tomaticallyoncethegeometricalparameters(arraytype,spacing between electrodes, depth level) are set. For each measurement,thesystemselectsonepairofpotentialelec-trodes and one pair of current electrodes with a determined spacing between each quadripole, and automatically records andsavestheapparentresistivityvaluecorrespondenttothelocationatpseudo-depthofsuchmeasurement.
The resistivity method was applied with a Wenner-Schlumbergerarrayusing48electrodesconnectedtoa470m-long multi-core cable, with four sections and 48 channels. A 470 m long survey was recorded with 48 electrodes, which producedatotalnumberof546quadripoles.Timeofcurrentinjection was 1 s, and a minimum of three and maximum of six repeated measurements at each point was designed in ordertoobtainastandarddeviation<3%foreachapparentresistivity value. The minimum spacing between electrodes was set at 10 m for levels 1-5, 20 m for levels 6-8, and 40 mfromlevel9,soastoensurebettercoverageatdeepestlevels.Aftercompletionofmeasurementsforthe470mlongdeployedarray,partialdisplacementoftheelectrodes(12 out of 48) along the profile permitted an extension of theoriginallength(120meters)andcontinuouscoverageofthesubsurface.Thisprocedure,thesocalled“roll-alongmethod”, was repeated several times until 1.28 km of the composite section was reached.
Two-dimensional resistivity tomography provides a resistivitydistributionsectionofasub-surfaceportionoftheearthfrompotentialmeasurementsmadeonsurface.Thebasis of a tomography is the pseudosection, which represents thedistributionofapparent resistivitymeasurementstaken from electrodes arranged along a line. As depths ofinvestigationarepseudo-depthsandresistivitiesareapparent,thepseudosectionoffersaqualitativescenarioofsubsurfaceresistivitydistribution.Thecharacteristicsofthisdistributiondependontheelectrodearrayapplied,aswell as the true subsurface resistivities. In this way, different electrodearrayscanresultinquitedifferentpseudosections.
There are many electrode configurations, where both potentialandcurrentelectrodesarearrangedalongaline with a constant space between adjacent electrodes. These arrays will depend on the geological structures thegeophysicalmethodisexpectedtoidentify.Theyarestronglycontrolledbydepthofinvestigationandtheirabilityto detect vertical and/or horizontal resistivity changes (Loke, 1996-2002). In our case, the Wenner-Shlumberger array was preferredtootherarraysasitissensitivetobothhorizontalandverticalresistivityvariations.Besidesbetterhorizontalcoverage,themaximumdepthofpenetrationofthisarrayis15 % larger than the Wenner array (Loke, 1996-2002).
Since the profiling was carried out along a non-hori-zontal surface, we used differential GPS (acquired by the AstronomicStationofRíoGrande,EARG)toaccountforthetopographyalongthegeoelectrictransect.
Data processing
Processing of the resistivity pseudosection was ac-complished with the RES2DINV program of Geotomo Software (Loke,1996-2002), and included a data filtering phase, and an inversion phase. The filtering phase consisted of the elimination of low quality points, which are character-ized by high Q values (>3), being Q the maximum standard deviation measurement. Few points (<5) were eliminated, as thepseudosectionpresentedgoodqualitymeasurements.
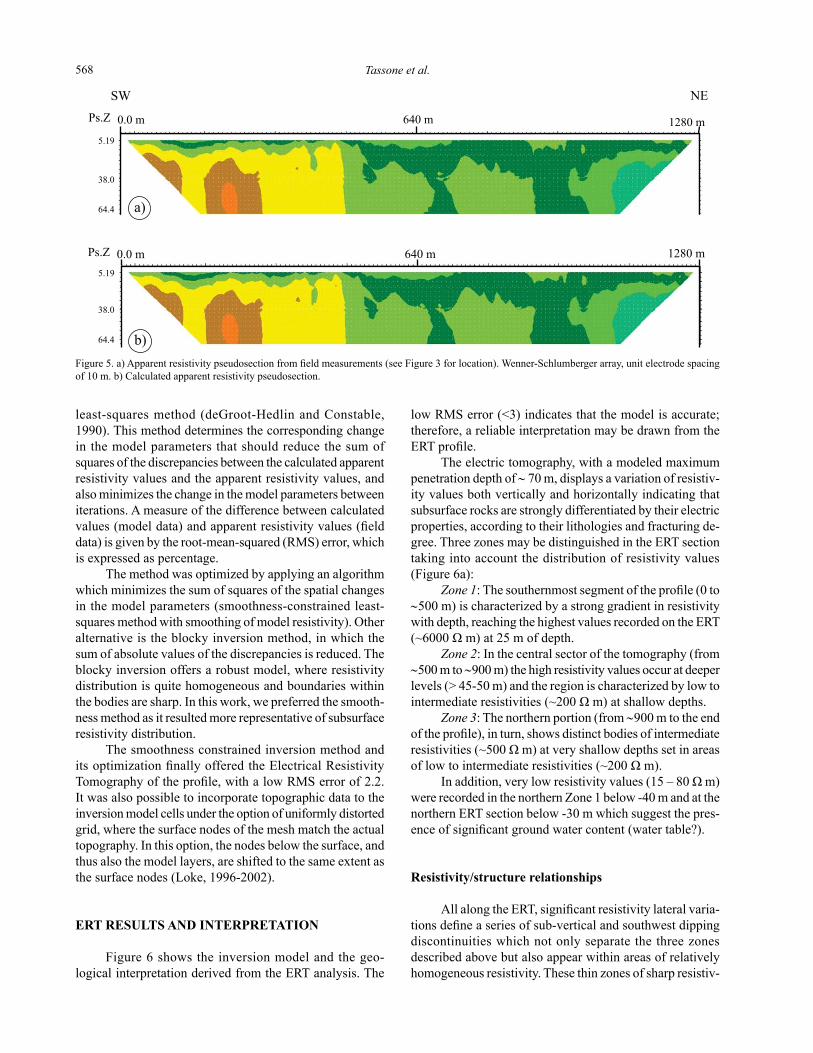
Theinversionphaseconsistedintheapplicationofthesmoothness inversion method. This method attempts to find amodel(anidealizedmathematicalrepresentation)oftheresistivitydistributionofasubsurfacesectionfromelectricpotentialmeasurementsmadeonsurface.The2Dmodelusedbytheinversionprogramconsistsofanumberofrectangularblocks (cells). The arrangement of the blocks is loosely tied tothedistributionofthedatapointsinthepseudosectionand each one of these has its own value of resistivity. The depth of the bottom row of blocks is set to be approximately equaltotheequivalentdepthofinvestigationofthedatapoints with the largest electrode spacing. The width of the cells was constrained by the minimum length of the dipoles (10 m) and the thickness of the cells reflects the fact that resolution decreases with depth (the thickness varied from 5mintheuppermostlayerto∼10mforthedeepestlayer). The software provides the model parameters, which are the resistivityofthecellsthatbetteradjuststhevaluesmeasuredatsurface.Fromapparentresistivitymeasurements(Figure5a, field pseudosection) the software offers an initial model which predicts a series of calculated apparent resistivity values(Figure5b, modelpseudosection).Thesevaluesarecompared with those obtained from measurements. The comparison of such values allows the model to be modified as many times as the difference between them is below a cutoff value (Loke, 1996-2002). The way the initial model parametersaremodifiedandimprovedisbysolvingaleast-squaresequation,throughthesmoothness-constrained
Figure4.TypicalschistofLapataiaFormationatBahíaEnsenadaarea.Profusionofquartzveinsdistinguishesthisunitfromtheoverlyingones.
Tassone et al.568
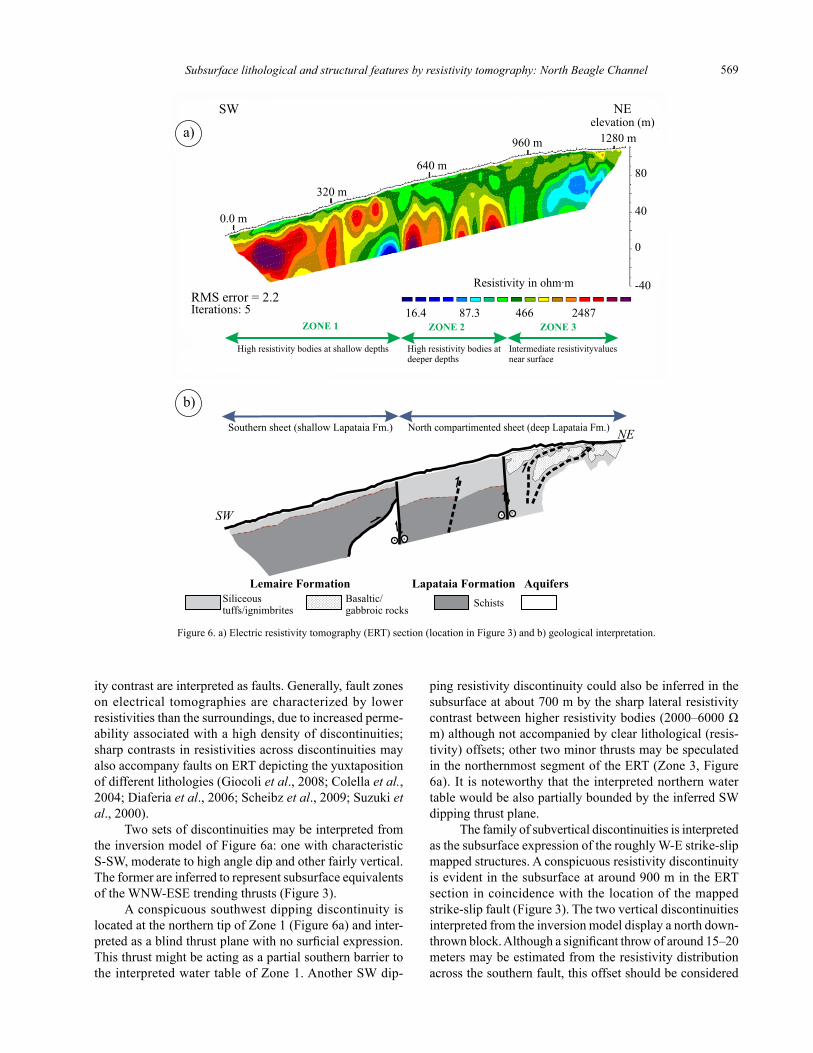
low RMS error (<3) indicates that the model is accurate; therefore, a reliable interpretation may be drawn from the ERT profile.
The electric tomography, with a modeled maximum penetrationdepthof∼70m,displaysavariationofresistiv-ityvaluesbothverticallyandhorizontallyindicatingthatsubsurface rocks are strongly differentiated by their electric properties,accordingtotheirlithologiesandfracturingde-gree.ThreezonesmaybedistinguishedintheERTsectiontaking into account the distribution of resistivity values (Figure6a):
Zone 1: The southernmost segment of the profile (0 to ∼500m)ischaracterizedbyastronggradientinresistivitywith depth, reaching the highest values recorded on the ERT (~6000 Ω m) at 25 m of depth.
Zone 2:Inthecentralsectorofthetomography(from∼500mto∼900m)thehighresistivityvaluesoccuratdeeperlevels (> 45-50 m) and the region is characterized by low to intermediate resistivities (~200 Ω m) at shallow depths.
Zone 3:Thenorthernportion(from∼900mtotheendof the profile), in turn, shows distinct bodies of intermediate resistivities (~500 Ω m) at very shallow depths set in areas of low to intermediate resistivities (~200 Ω m).
In addition, very low resistivity values (15 – 80 Ω m) were recorded in the northern Zone 1 below -40 m and at the northern ERT section below -30 m which suggest the pres-ence of significant ground water content (water table?).
Resistivity/structure relationships
All along the ERT, significant resistivity lateral varia-tions define a series of sub-vertical and southwest dipping discontinuities which not only separate the three zones described above but also appear within areas of relatively homogeneousresistivity.Thesethinzonesofsharpresistiv-
least-squaresmethod(deGroot-HedlinandConstable,1990).Thismethoddeterminesthecorrespondingchangeinthemodelparametersthatshouldreducethesumofsquares of the discrepancies between the calculated apparent resistivityvaluesandtheapparentresistivityvalues,andalso minimizes the change in the model parameters between iterations. A measure of the difference between calculated values (model data) and apparent resistivity values (field data) is given by the root-mean-squared (RMS) error, which isexpressedaspercentage.
The method was optimized by applying an algorithm which minimizes the sum of squares of the spatial changes inthemodelparameters(smoothness-constrainedleast-squares method with smoothing of model resistivity). Other alternative is the blocky inversion method, in which the sumofabsolutevaluesofthediscrepanciesisreduced.Theblocky inversion offers a robust model, where resistivity distribution is quite homogeneous and boundaries within the bodies are sharp. In this work, we preferred the smooth-nessmethodasitresultedmorerepresentativeofsubsurfaceresistivitydistribution.
Thesmoothnessconstrainedinversionmethodandits optimization finally offered the Electrical Resistivity Tomography of the profile, with a low RMS error of 2.2. It was also possible to incorporate topographic data to the inversionmodelcellsundertheoptionofuniformlydistortedgrid, where the surface nodes of the mesh match the actual topography. In this option, the nodes below the surface, and thusalsothemodellayers,areshiftedtothesameextentasthe surface nodes (Loke, 1996-2002).
ERT RESULTS AND INTERPRETATION
Figure 6 shows the inversion model and the geo-logicalinterpretationderivedfromtheERTanalysis.The
Figure 5. a) Apparent resistivity pseudosection from field measurements (see Figure 3 for location). Wenner-Schlumberger array, unit electrode spacing of10m.b)Calculatedapparentresistivitypseudosection.
Subsurface lithological and structural features by resistivity tomography: North Beagle Channel 569
itycontrastareinterpretedasfaults.Generally,faultzoneson electrical tomographies are characterized by lower resistivitiesthanthesurroundings,duetoincreasedperme-ability associated with a high density of discontinuities; sharpcontrastsinresistivitiesacrossdiscontinuitiesmayalsoaccompanyfaultsonERTdepictingtheyuxtapositionofdifferentlithologies(Giocoliet al.,2008;Colellaet al.,2004;Diaferiaet al.,2006;Scheibzet al., 2009; Suzuki et al.,2000).
Two sets of discontinuities may be interpreted from the inversion model of Figure 6a: one with characteristic S-SW,moderatetohighangledipandotherfairlyvertical.TheformerareinferredtorepresentsubsurfaceequivalentsoftheWNW-ESEtrendingthrusts(Figure3).
A conspicuous southwest dipping discontinuity is locatedatthenortherntipofZone1(Figure6a)andinter-preted as a blind thrust plane with no surficial expression. Thisthrustmightbeactingasapartialsouthernbarriertothe interpreted water table of Zone 1. Another SW dip-
pingresistivitydiscontinuitycouldalsobeinferredinthesubsurfaceatabout700mbythesharplateralresistivitycontrast between higher resistivity bodies (2000–6000 Ω m)althoughnotaccompaniedbyclearlithological(resis-tivity) offsets; other two minor thrusts may be speculated inthenorthernmostsegmentoftheERT(Zone3,Figure6a). It is noteworthy that the interpreted northern water table would be also partially bounded by the inferred SW dippingthrustplane.
Thefamilyofsubverticaldiscontinuitiesisinterpretedas the subsurface expression of the roughly W-E strike-slip mappedstructures.Aconspicuousresistivitydiscontinuityisevidentinthesubsurfaceataround900mintheERTsection in coincidence with the location of the mapped strike-slip fault (Figure 3). The two vertical discontinuities interpreted from the inversion model display a north down-thrown block. Although a significant throw of around 15–20 metersmaybeestimatedfromtheresistivitydistributionacrossthesouthernfault,thisoffsetshouldbeconsidered
Figure6.a)Electricresistivitytomography(ERT)section(locationinFigure3)andb)geologicalinterpretation.
Tassone et al.570
as the combined throws of the early thrusting and the later transtensiveevents.Thegeometriesofthesefaultsareob-servable in several outcrops where subvertical fault planes display left lateral kinematic indicators (i.e., quartz fibers, rock steps and Riedel fractures; Figure 3 b and c)
Thegeneralgeometricrelationshipsdepictedbytheinversion model between interpreted thrusts and strike-slip structures indicates that the two styles of deformation are superposed, with the compressive structures being over-printed by wrench tectonism.
Resistivity/lithology relationships
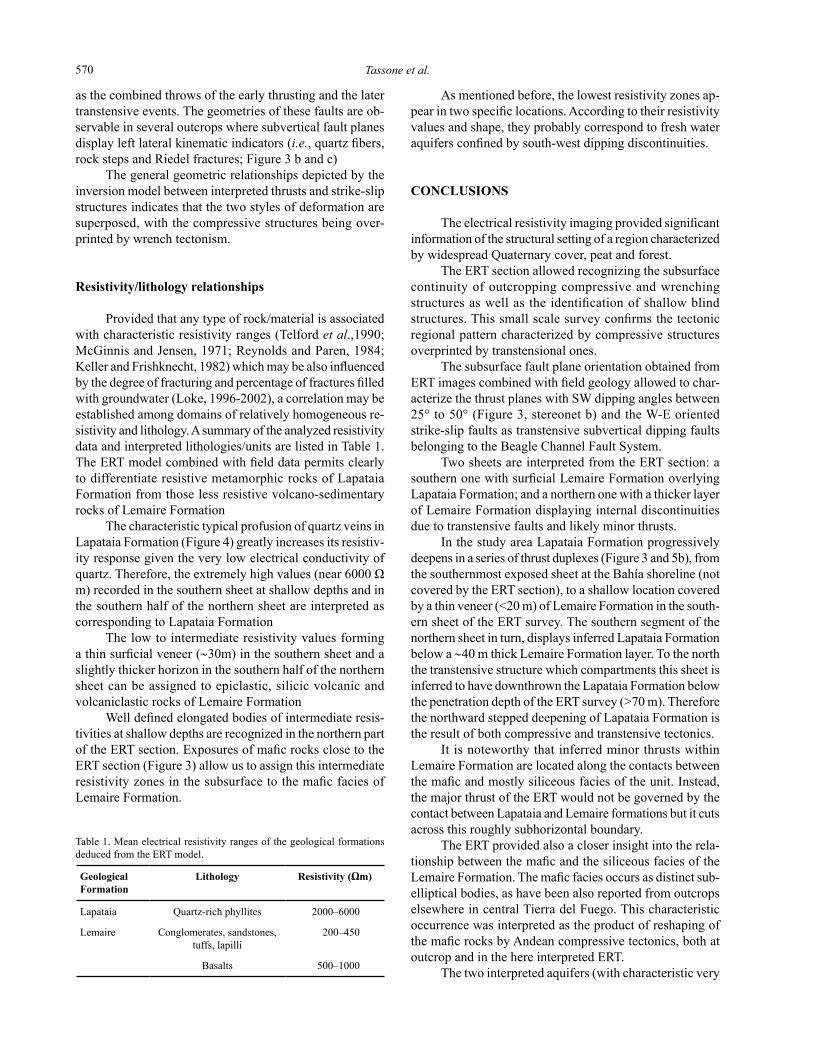
Provided that any type of rock/material is associated with characteristic resistivity ranges (Telford et al.,1990;McGinnisandJensen,1971;ReynoldsandParen,1984;Keller and Frishknecht, 1982) which may be also influenced by the degree of fracturing and percentage of fractures filled with groundwater (Loke, 1996-2002), a correlation may be establishedamongdomainsofrelativelyhomogeneousre-sistivityandlithology.Asummaryoftheanalyzedresistivitydata and interpreted lithologies/units are listed in Table 1. The ERT model combined with field data permits clearly to differentiate resistive metamorphic rocks of Lapataia Formationfromthoselessresistivevolcano-sedimentaryrocks of Lemaire Formation
ThecharacteristictypicalprofusionofquartzveinsinLapataiaFormation(Figure4)greatlyincreasesitsresistiv-ity response given the very low electrical conductivity of quartz. Therefore, the extremely high values (near 6000 Ω m) recorded in the southern sheet at shallow depths and in thesouthernhalfofthenorthernsheetareinterpretedascorrespondingtoLapataiaFormation
The low to intermediate resistivity values forming a thin surficial veneer (∼30m)inthesouthernsheetandaslightly thicker horizon in the southern half of the northern sheetcanbeassignedtoepiclastic,silicicvolcanicandvolcaniclastic rocks of Lemaire Formation
Well defined elongated bodies of intermediate resis-tivities at shallow depths are recognized in the northern part of the ERT section. Exposures of mafic rocks close to the ERT section (Figure 3) allow us to assign this intermediate resistivity zones in the subsurface to the mafic facies of LemaireFormation.
As mentioned before, the lowest resistivity zones ap-pear in two specific locations. According to their resistivity values and shape, they probably correspond to fresh water aquifers confined by south-west dipping discontinuities.
CONCLUSIONS
The electrical resistivity imaging provided significant informationofthestructuralsettingofaregioncharacterizedby widespread Quaternary cover, peat and forest.
The ERT section allowed recognizing the subsurface continuity of outcropping compressive and wrenching structures as well as the identification of shallow blind structures. This small scale survey confirms the tectonic regionalpatterncharacterizedbycompressivestructuresoverprintedbytranstensionalones.
ThesubsurfacefaultplaneorientationobtainedfromERT images combined with field geology allowed to char-acterize the thrust planes with SW dipping angles between 25°to50°(Figure3,stereonetb)andtheW-Eorientedstrike-slip faults as transtensive subvertical dipping faults belongingtotheBeagleChannelFaultSystem.
Two sheets are interpreted from the ERT section: a southern one with surficial Lemaire Formation overlying Lapataia Formation; and a northern one with a thicker layer ofLemaireFormationdisplayinginternaldiscontinuitiesdue to transtensive faults and likely minor thrusts.
InthestudyareaLapataiaFormationprogressivelydeepensinaseriesofthrustduplexes(Figure3and5b),fromthesouthernmostexposedsheetattheBahíashoreline(notcovered by the ERT section), to a shallow location covered byathinveneer(<20m)ofLemaireFormationinthesouth-ernsheetoftheERTsurvey.Thesouthernsegmentofthenorthernsheetinturn,displaysinferredLapataiaFormationbelow a ∼40 m thick Lemaire Formation layer. To the north the transtensive structure which compartments this sheet is inferred to have downthrown the Lapataia Formation below thepenetrationdepthoftheERTsurvey(>70m).Thereforethe northward stepped deepening of Lapataia Formation is theresultofbothcompressiveandtranstensivetectonics.
It is noteworthy that inferred minor thrusts within Lemaire Formation are located along the contacts between the mafic and mostly siliceous facies of the unit. Instead, the major thrust of the ERT would not be governed by the contact between Lapataia and Lemaire formations but it cuts acrossthisroughlysubhorizontalboundary.
TheERTprovidedalsoacloserinsightintotherela-tionship between the mafic and the siliceous facies of the Lemaire Formation. The mafic facies occurs as distinct sub-ellipticalbodies,ashavebeenalsoreportedfromoutcropselsewhere in central Tierra del Fuego. This characteristic occurrence was interpreted as the product of reshaping of the mafic rocks by Andean compressive tectonics, both at outcropandinthehereinterpretedERT.
The two interpreted aquifers (with characteristic very
Geological Formation
Lithology Resistivity (Ωm)
Lapataia Quartz-rich phyllites 2000–6000
Lemaire Conglomerates,sandstones,tuffs,lapilli
200–450
Basalts 500–1000
Table1.MeanelectricalresistivityrangesofthegeologicalformationsdeducedfromtheERTmodel.
Subsurface lithological and structural features by resistivity tomography: North Beagle Channel 571
low resistivities) are hosted in Lemaire Formation and stalled by faults as they occur confined and bounded by interpreted thrusts and transtensive faults which would be actingasbarriersforaquifers.
ACKNOWLEDGMENTS
TheauthorsareverygratefultoIanDalziel,VladConstantinManeaandananonymous reviewer whose constructivecommentsimprovedtheoriginalmanuscript;the careful editorial revision is also thanked.
We acknowledge those people who contributed to the field work in Tierra del Fuego: Gerardo Connon, Luís BarberoyCarlosFerreroftheEARGfortheirsupportduring data acquisition in the field, Parques Nacionales ofArgentinabyprovidingfacilitiesforthesurveyoftheNational Park of Tierra del Fuego. Augusto Rapalini is thanked for timely and constructive reviews which sig-nificantlyimprovedtheoriginalmanuscript.Fundsofthis study were partly provided by the CONICET and the Agencia Nacional de Promoción Científica, Tecnológica y deInnovaciónandtheUniversidaddeBuenosAires.
REFERENCES
Ametrano,S.,Etcheverry,R.,Echeveste,H.,Godeas,M.,Zubia,M.1999,Depósitos polimetálicos (tipo VMS) en la Cordillera Fueguina, TierradelFuego,enZappettini,E.O.(ed.),RecursosMineralesdelaRepúblicaArgentina:BuenosAires,Argentina,InstitutodeGeologíayRecursosMinerales,ServicioGeológicoMineroArgentino,35,1029-1038.
Biddle,K.T.,Uliana,M.A.,Mitchum,R.M.,Fitzgerald,M.G.,Wright,R.C.,1986,ThestratigraphicandstructuralevolutionofthecentralandeasternMagallanesBasin,southernSouthAmerica,in Allen, A., Homewood, P. (eds.), Foreland Basins, London, Blackwell Scientific Publications, International Association of Sedimentologists,SpecialPublication8,41-61.
Bruhn, R.L., 1979, Rock structures formed during back-arc basin deformationintheAndesofTierradelFuego: BulletinoftheGeologicalSocietyofAmerica, 90(11),998-1012.
Caminos,R.,Haller,M.,Lapido,J.,Lizuain,O.,Page,A.,Ramos,V.,1981,ReconocimientogeológicodelosAndesFueguinos,TerritorioNacionaldeTierradelFuego,enVIIICongresoGeológicoArgentino:SanLuis,Argentina,3,759-786.
Caputo,R.,Piscitelli,S.,Oliveto,A.,Rizzo,E.,Lapenna,V.,2003,Theuseofelectricalresistivitytomographiesinactivetectonics:examplesfromTyrnavosBasin,Greece:JournalofGeodynamics,36(1-2),19-35.
Caputo, R., Salviulo, L., Piscitelli, S., Loperte, A., 2007, Late Quaternary activityalongtheScorciabuoiFault(SouthernItaly)asinferredfromelectricalresistivitytomographies:AnnalsofGeophysics,50(2),213-223.
Cerredo,M.E.,Tassone,A.A.,Menichetti,M.,2006,ThebasementComplexoftheFuegianAndes:microstructuresandmineralassemblages, enXIIIReunióndeTectónica:SanLuis,Argentina,21.
Cerredo,M.E.,Remesal,M.B.,Tassone,A.,Menichetti,M.,2007,TheoceancrustofRocasVerdesBasininTierradelFuego,Argentina,en III Simposio Argentino del Jurásico: Mendoza, Argentina,33.
Colella,A.,Lapenna,V.,Rizzo,E.,2004,High-resolutionimagingofthe
high Agri valley basin (Southern Italy) with electrical resistivity tomography: Tectonophysics, 386(1-2), 29–40.
Cunningham, W.D., 1993, Strike-slip Faults in the Southernmost Andes andthedevelopmentofthePatagonianOrocline:Tectonics,12(1), 169–186.
Cunningham,W.D.,1995,OrogenesisatthesoutherntipoftheAmericas:the structural evolution of the Cordillera Darwin metamorphic complex, southernmost Chile: Tectonophysics, 244(4),197-229.
Dalziel I.W.D., 1981, Back-arc extension in the southern Andes: a review and a critical reappraisal: Phil. Trans. R. Soc., A., 300, 319-335.
Dalziel,I.W.D.,1982,Theearly(pre-middleJurassic)historyoftheScotia arc region: a review and progress report, in Craddock, C. (ed.),AntarcticGeoscience:Madison,UniversityofWisconsinPress,111-126.
Dalziel, I.W.D., Brown, R.L., 1989, Tectonic denudation of the Darwin metamorphiccorecomplexintheAndesofTierradelFuego,southernmostChile:implicationsforCordilleranorogenesis:Geology,17(8),699-703.
Dalziel,I.W.D.,Elliot,D.H.,1973,TheScotiaArcandAntarcticmargin,inNairn,A.E.M.,Stehli,F.G.(eds.),TheOceanBasinandMarginI: The South Atlantic: New York, Plenum Press, 171-245.
Dalziel,I.W.D.,DeWit,M.J.,Palmer,K.F.,1974,FossilmarginalbasininthesouthernAndes: Nature250(5464),291-294.
deGroot-Hedlin,C.,Constable,S.,1990,Occam´sinversiontogeneratesmooth, two dimensional models for magnetotelluric data: Geophysics,55(12),1613-1624.
Demanet, D., Renardy, F., Vanneste, K., Jongmas, D., Camelbeek, T., Megharaoui,M.,2001,TheuseofgeophysicalprospectingforimagingactivefaultsintheRoerGraben,Belgium:Geophysics,66(1),78-89.
Diaferia,I.,Barchi,M.,Loddo,M.,Schiavone,D.,Siniscalchi,A.,2006,Detailedimagingoftectonicstructuresbymultiscaleearthresistivitytomographies:TheColfioritonormalfaults(centralItaly):GeophysicalResearchLetters,33(9),L09305.1-L09305.4.
Fazzito,S.Y.,Rapalini,A.E.,Cortés,J.M.,Terrizzano,C.M.,2009,Characterization of Quaternary Faults by Electric Resistivity TomographyintheAndeanPrecordilleraofWesternArgentina:JournalofSouthAmericanEarthSciences,28(3),217-228.
Giano,S.I.,Lapenna,V.,Piscitelli,S.,Schiattarella,M.,2000,Electricalimagingandself-potencialsurveystostudythegeologicalsettingof the Quaternary slope deposits in the Agri high valley (Southern Italy): Annali di Geofisica, 43(2), 409-419.
Giocoli,A,Magrì,C.,Vannoli,P.,Piscitelli,S.,Rizzo,E.,Siniscalchi,A.,Burrato,P.,Basso,C.,DiNocera,C.,2008, Electricalresistivitytomography investigations in the Ufita Valley (southern Italy): AnnalsofGeophysics,51(1),213-223.
Griffiths, D.H., Barker, R.D., 1993, Two-dimensional resistivity imaging andmodellinginareasofcomplexgeology:JournalofAppliedGeophysics,29(3-4),211-226.
Keller, G.V., Frischknecht, F.C., 1982, Electrical methods in geophysical prospecting:Oxford,PergamonPress,519pp.
Kohn, M.J., Spear, F.S., Harrison, T.M., Dalziel, I.W.D., 1995, 40Ar/39Ar geochronology and P-T-t paths from the Cordillera Darwin metamorphiccomplex,TierradelFuego,Chile:JournalofMetamorphicGeology,13(2),251-270.
Kranck, E.H., 1932, Geological Investigations in the Cordillera of Tierra delFuego:ActaGeographica,4(2),1-231.
Lodolo,E.,Menichetti,M.,Bartole,R.,Ben-Avraham,Z.,Tassone,A.,Lippai,E.,2003,Magallanes-Fagnanocontinentaltransformfault(TierradelFuego,southernmostSouthAmerica):Tectonics,22(6), 1076, doi: 10.1029/2003TC001500.
Lodolo,E.,Lippai,H.,Tassone,A.,Zanolla,C.,Menichetti,M.,Hormaechea,J.L.,2007,MorphologicalandgravitymapoftheIslaGrandedeTierradelFuego:GeologicaActa,5(4), 307-314.
Loke, M.H., 1996-2002, Tutorial: 2-D and 3-D electrical imaging surveys, Geotomo Software.
McGinnis,L.D.,Jensen,T.E.,1971,Permafrost-hydrogeologicregimenin
Tassone et al.572
two ice-free valleys, Antarctica, from electrical depth sounding: Quaternary Research, 1(3), 389-409.
Menichetti, M., Acevedo, R., Bujalesky, G., Cenni, M., Cerredo., M.E., Coronato,A.,Hormaechea,J.L.,Lippai,H.,Lodolo,E.,Olivero,E.,Rabassa,J.,Russi.,M.,Tassone,A.,2004,Fieldtripguide,Geosur2004:Argentina,39pp.
MenichettiM.,Lodolo,E.,Tassone,A.,2008,StructuralgeologyoftheFuegianAndesandMagallanesfold-and-thrustbelt-TierradelFuegoIsland:GeologicaActa,6(1), 19-42.
Nivière,B.,Bruestle,A.,Bertrand,G.,Carretier,S.,Behrmann,J.,Gourry,J.C,2008,ActivetectonicsofthesoutheasternUpperRhineGraben, Freiburg area (Germany): Quaternary Science Reviews, 27,541-555.
Nguyen,F.,Garambois,S.,Chardon,D.,Hermitte,D.,Bellier,O.,JongmansD.,2007,Subsurfaceelectricalimagingofanisotropicformations affected by a slow active reverse fault, Provence, France:JournalofAppliedGeophysics,62(4),338-353.
Olivero, E.B., Martinioni, D.R., 2001, A review of the geology of ArgentinianFuegianAndes:JournalofSouthAmericanEarthSciences,14,175-188.
Olivero,E.B.,Acevedo,R.D.,Martinioni,D.R.,1997,GeologíadelMesozoicodeBahíaEnsenada,TierradelFuego:RevistadelaAsociaciónGeológicaArgentina,52(2),169-179.
Pankhurst, R.J., Riley, T.R., Fanning, C.M., Kelley, S.P., 2000, Episodic silicicvolcanisminPatagoniaandtheAntarcticPeninsula:chronology of magmatism associated with the break-up of Gondwana: Journal of Petrology, 41(5), 605–625.
Peroni, J.I.,Tassone,A.A.,Menichetti,M.,Cerredo,M.E.,2009,GeophysicalmodelingandstructureofUshuaiaPluton,FuegianAndes,Argentina:Tectonophysics,476(3-4),436-449.
Reynolds,J.M.,Paren,J.G.,1984,ElectricalresistivityoficefromtheAntarctic Peninsula: Journal of Glaciology, 30(106), 289–295.
Scheibz, J., Haeusler, H., Kardeis, G., Kohlbeck, F., Chwatal, W., Figdor, H.,Koenig,C.,2009,Geologicinterpretationofgeophysicalinvestigations in theOslipsection,RustRange,NorthernBurgenland,Austria,inEuropeanGeosciencesUnion:Vienna,Austria,GeophysicalResearchAbstracts,11,10559.
Spichak V., Fukuoka K.,Kobayashi,T.,Mogi,T.,Popova,I.,Shima,H.,2002,ANNreconstructionofgeoelectricalparametersoftheMinoufaultzonebyscalarCSAMTdata:JournalofAppliedGeophysics,49(1-2),75-90.
Storz,H.,Storz,W.,Jacobs,F.,2000,Electricalresistivitytomographytoinvestigategeologicalstructuresoftheearth’suppercrust:GeophysicalProspecting,48(3),455-471.
Suárez, M., De La Cruz, R., Bell, C.M., 2000, Timing and origin of deformationalongthePatagonianfoldandthrustbelt:GeologicalMagazine,137(4),345-353.
Suzuki, K., Toda, S., Kusunoki, K., Fujimitsu, Y., Mogi, T., Jomori, A., 2000,Casestudiesofelectricalandelectromagneticmethodsapplied to mapping active faults beneath the thick Quaternary: EngineeringGeology,56(1-2),29-45.
Tassone,A.,Lippai,H.,Lodolo,E.,Menichetti,M.,Comba,A.,Hormaechea,J.L.,Vilas,J.F.,2005,AgeologicalandgeophysicalcrustalsectionacrosstheMagallanes-FagnanofaultinTierradelFuegoandassociatedasymmetricbasinsformation:JournalofSouthAmericanEarthSciences,19(1),99-109.
Telford,W.M.,Geldart,L.P.,Sheriff,R.E.,1990,AppliedGeophysics,Cambridge,UnitedKingdom,CambridgeUniversityPress,SecondEdition,790pp.
Winslow, M.A., 1982, The structural evolution of the Magallanes Basin andneotectonicsinthesouthernmostAndes,in Craddock, C. (ed.),AntarcticGeoscience:Madison,UniversityofWisconsin,143-154.
Wise, D.J., Cassidy, J., Locke, C.A., 2003, Geophysical imaging of the Quaternary Wairoa North Fault, New Zealand: a case study: JournalofAppliedGeophysics,53(1),1-16.
Manuscriptrecieved:April27,2010Correctedmanuscriptreceived:August31,2010Manuscriptaccepted:September4,2010