imf country report no. 13/79 costa rica · ©2013 international monetary fund imf country report...
TRANSCRIPT

©2013 International Monetary Fund
IMF Country Report No. 13/79
COSTA RICA 2012 ARTICLE IV CONSULTATION
Under Article IV of the IMF’s Articles of Agreement, the IMF holds bilateral discussions with members, usually every year. In the context of the 2012 Article IV consultation with Costa Rica, the following documents have been released and are included in this package: Staff Report for the 2012 Article IV consultation, prepared by a staff team of the IMF, following discussions that ended on December 11, 2012, with the officials of Costa Rica on economic developments and policies. Based on information available at the time of these discussions, the staff report was completed on February 5, 2013. The views expressed in the staff report are those of the staff team and do not necessarily reflect the views of the Executive Board of the IMF..
Informational Annex dated February 5, 2013
Staff Statement of February 22, 2013
Public Information Notice (PIN) summarizing the views of the Executive Board as expressed during its February 22, 2013 discussion of the staff report that concluded the Article IV consultation.
Statement by the Executive Director for Costa Rica.
The document listed below has been or will be separately released. Selected Issues Paper
The policy of publication of staff reports and other documents allows for the deletion of market-sensitive information.
Copies of this report are available to the public from
International Monetary Fund Publication Services 700 19th Street, N.W. Washington, D.C. 20431
Telephone: (202) 623-7430 Telefax: (202) 623-7201 E-mail: [email protected] Internet: http://www.imf.org
International Monetary Fund Washington, D.C.
March 2013

COSTA RICA STAFF REPORT FOR THE 2012 ARTICLE IV CONSULTATION
KEY ISSUES Context. The economy recovered quickly from the global crisis of 2008-09, with low inflation, and healthy growth is expected to continue. However, risks to the outlook are tilted to the downside. Absent consolidation, large fiscal deficits would make public debt dynamics unsustainable in the long-run. Moreover, current policies could result in overheating, a risk that has been heightened by surging capital inflows. The short-term policy mix should be adjusted. A tighter fiscal stance would mitigate risks of rising inflation and external imbalances. The authorities should also stand ready to increase interest rates and allow greater exchange rate flexibility if signs of inflationary pressure emerge. In the absence of fiscal adjustment, bolder monetary policy action may be required to ensure price stability. Steady fiscal consolidation is required over the medium term. The threat of unsustainable public debt dynamics calls for corrective action. The authorities’ intention to renew tax reform efforts and implement other fiscal consolidation measures is a welcome first step. A moderately front-loaded adjustment would strike the appropriate balance between achieving fiscal sustainability and maintaining robust growth. Postponing fiscal consolidation further could endanger macroeconomic stability. It is important to strengthen the monetary policy framework, by increasing exchange rate flexibility and completing the transition to inflation targeting. This would permit consolidating gains in lowering inflation made in recent years. Further improvements in financial system regulation and supervision as well as structural reforms to stimulate potential growth are desirable. Deepening consolidated and risk-based supervision as well as gradually adopting Basel III capital and liquidity standards would further buttress financial system soundness. Efficiency-enhancing measures to fuel competition and eliminate red-tape would help boost growth and bolster external competitiveness.
February 5, 2013
COSTA RICA
2 INTERNATIONAL MONETARY FUND
Approved By Miguel Savastano (WHD) and Masato Miyazaki (SPR)
Discussions took place in San José during November 28-December 11. The mission comprised Lorenzo Figliuoli (Head), Pablo Morra, Yulia Ustyugova, M. Belén Sbrancia (all WHD), and Fernando Delgado (Regional Resident Representative). José Rojas and Luis Cosenza (OED) participated in the closing meeting.
OVERVIEW ________________________________________________________________________________________ 4
RECENT ECONOMIC DEVELOPMENTS AND OUTLOOK ________________________________________ 4
A. Recent Developments ____________________________________________________________________4
B. Macroeconomic Outlook and Risks ____________________________________________________ 12
POLICY DISCUSSIONS __________________________________________________________________________ 16
A. Near-term Policy Mix __________________________________________________________________ 16
B. Safeguarding Fiscal Sustainability ______________________________________________________ 17
C. Upgrading the Monetary and Exchange Rate Policy Framework _______________________ 20
D. Financial Stability ______________________________________________________________________ 20
E. Structural Reforms _____________________________________________________________________ 22
STAFF APPRAISAL ______________________________________________________________________________ 23
BOXES 1. External Stability Assessment __________________________________________________________________6 2. Financial Conditions ____________________________________________________________________________9 3. Cross-Border Spillovers ______________________________________________________________________ 11 FIGURES 1. Growth & Inflation ___________________________________________________________________________ 26 2. External Sector _______________________________________________________________________________ 27 3. Fiscal Developments _________________________________________________________________________ 28 4. Money and Credit ____________________________________________________________________________ 29 5. Central Government Debt Sustainability: Bound Tests _______________________________________ 42 6. Public Debt Sustainability: Bound Tests ______________________________________________________ 44 7. External Debt Sustainability: Bound Tests ____________________________________________________ 47 TABLES 1. Selected Social and Economic Indicators_____________________________________________________ 30 2. Balance of Payments _________________________________________________________________________ 31 3. Central Government Balance _________________________________________________________________ 32 4. Summary Operations of the Central Government, GFSM 2001 Classification ________________ 33 5. Consolidated Public Sector Operations ______________________________________________________ 34 6. Summary Operations of the Consolidated Public Sector, GFSM 2001 Classification _________ 35 7. Public Sector Debt ___________________________________________________________________________ 36 8. Monetary Survey _____________________________________________________________________________ 37

COSTA RICA
INTERNATIONAL MONETARY FUND 3
9. Medium-Term Framework ___________________________________________________________________ 38 10. Banking Sector Indicators ____________________________________________________________________ 39 11. Medium-Term Framework Under Fiscal Consolidation Scenario _____________________________ 40 12. Central Government Debt Sustainability Framework, 2010-2018 ____________________________ 41 13. Consolidated Public Sector Debt SustainabilityFramework, 2010-2018 ______________________ 43 14. Consolidated Public Sector Debt Sustainability Framework
(Under Fiscal Consolidation Scenario), 2010-2018 ___________________________________________ 45 15. External Debt Sustainability Framework, 2010-2018 _________________________________________ 46

COSTA RICA
4 INTERNATIONAL MONETARY FUND
OVERVIEW 1. Costa Rica was resilient to the 2008-09 financial crisis and recovered quickly. In response to the downturn, the authorities increased public expenditure and entered in a high-access precautionary Stand-By Arrangement with the Fund (that ended in mid-2010), while depreciation of the colón facilitated external adjustment. Macroeconomic and financial stability were maintained. After falling modestly in 2009, real GDP grew strongly in 2010-12, with low inflation. As global economic conditions improved, private capital inflows resumed and the nominal exchange rate returned to pre-crisis levels, reaching the floor of the exchange rate band by end-2010.
2. However, the fiscal situation deteriorated markedly and attempts to correct it have encountered strong headwinds. The budgetary stimulus imparted in 2009, mainly through a rise in wages and transfers, was not reversed when the economy improved and a new government took office. The increase in public expenditure combined with an endogenous fall in revenue (which was above trend in 2008) pushed the fiscal deficit above 5 percent of GDP by 2010—from near balance in 2008. While the authorities curbed expenditure growth in 2011-12, the budgetary position improved only moderately and public sector debt kept on climbing. A revenue-enhancing tax reform aimed at placing the public sector balance on a sustainable path was voided in 2012.
RECENT ECONOMIC DEVELOPMENTS AND OUTLOOK A. Recent Developments 3. Growth picked up in 2012, with inflation well within the policy limits. Real GDP grew by about 5 percent in 2012 (up from an average of 4½ percent during 2010-11), buoyed by strong investment and exports, especially in manufacturing. As a result, the negative output gap that arose during the downturn is estimated to have almost closed. By year-end, headline inflation stood at 4.6 percent, comfortably within the 4-6 percent official target range, and core and producer price inflation were also subdued. At a historical low of 5.7 percent in December, twelve-month inflation expectations were anchored within the target range.
8.4 8.55.7 6.2
3.8
-2.3-5.1
-2.5 -0.9
1.8
-10
-5
0
5
10
I-10
II-10 I-11
II-11
Jan/
Sep-
12
Net exportsDomestic demandGDP
Real GDP growth and contributions to growth(in percentage points)
Source: Central Bank.
02468
1012141618
Jan-07 Jan-08 Jan-09 Jan-10 Jan-11 Jan-12
Headline
Target band
Core
Headline and core inflation(percent y/y)
Source: Central Bank.

COSTA RICA
INTERNATIONAL MONETARY FUND 5
4. A significant rise in capital inflows more than offset a modest increase in the external current account deficit and placed strong appreciating pressure on the colón. Robust foreign direct investment (FDI), higher public and private external borrowing, and, since late August 2012, a rise in net portfolio inflows increased the financial and capital account surplus. The rise in private capital inflows kept the colón at the bottom of the exchange rate band, and prompted the central bank to step up its foreign exchange purchases. As a result, net international reserves (NIR) at end-2012 rose to US$6.9 billion, close to adequacy metrics (Box 1).
450
500
550
600
650
700
750
800
Dec
-07
Jun-
08
Dec
-08
Jun-
09
Dec
-09
Jun-
10
Dec
-10
Jun-
11
Dec
-11
Jun-
12
Dec
-12
Exchange rateBand
Exchange rate (colones per US$)
Source: Central Bank.
0
100
200
300
400
500
600
4,300
4,700
5,100
5,500
5,900
6,300
6,700
7,100
Sep-
10
Dec
-10
Mar
-11
Jun-
11
Sep-
11
Dec
-11
Mar
-12
Jun-
12
Sep-
12
Dec
-12
BCCR FX purchases (rhs)
NIR (lhs)
Net international reserves and central bank foreign exchange purchases (millions of US$)
Source: Central Bank.
5. Competitiveness has eroded and may not be adequate to ensure long-term external stability. Since 2005, the real effective exchange rate (REER) has appreciated by over 30 percent, largely due to high inflation differentials. Multilaterally consistent estimates under the EBA and CGER approaches suggest that the current account deficit is above medium-term fundamentals-based levels (Box 1) and point to moderate REER overvaluation. Productivity-enhancing reforms (¶ 27) and wage restraint would help restore competitiveness. Fiscal consolidation (¶ 19) would also support long-term external stability.
6. While public expenditure growth was contained, the fiscal deficit remained large and the public debt ratio kept rising. During 2011-2012, the authorities slammed the brakes on the rapid swelling of public expenditure of 2008-10 by freezing public sector vacancies, containing wage growth, rationalizing outlays on goods and services, and postponing non-priority public investment projects. These efforts helped reduce the fiscal deficit to an estimated 4½ percent of GDP in 2011 and 2012, from a peak of 5½ percent of GDP in 2010. However, they did not prevent a
0.01.1
2.61.4
0.0
-0.1
0.2
-8.0
-6.0
-4.0
-2.0
0.0
2.0
4.0
2007
2008
2009
2010
2011
2012
F
2013
F
Fiscal impulse
Cyclically-adjusted
Headline
Headline Fiscal Balance, Cyclically-adjusted Balance and Fiscal Stimulus (percent of GDP)
Source: IMF staff estimates.

COSTA RICA
6 INTERNATIONAL MONETARY FUND
Box 1. Costa Rica: External Stability Assessment
Costa Rica’s share in global merchandise trade fell in the last decade, but the export-oriented services sector is growing rapidly. Costa Rica’s share in total world trade has decreased mostly driven by a lower contribution of traditional exports. This decline and the significant widening observed in the merchandise trade deficit, however, were partly offset by a steady increase in the surplus of the real services balance.
0.05
0.10
0.15
0.20
0.25
0.30
0.35
0.00
0.02
0.04
0.06
0.08
0.10
2000 2002 2004 2006 2008 2010
Costa Rica: Export market shares (percent) 1/
WorldEuropean UnionUS (rhs)
Sources: International Financial Statistics and Fund staff calculations.1/ Computed as Costa Rica's exports to the World, the EU and the US in percent of total World, EU and US imports from the World respectively.
-18
-15
-12
-9
-6
-3
0
-10
-8
-6
-4
-2
0
2
4
6
8
10
2000 2002 2004 2006 2008 2010
Costa Rica: External current account (percent)
Current account balance
Services balanceTrade balance (rhs)
Sources: Central Bank , Fund staff calculations
Survey-based indicators of competitiveness highlight some key challenges. Costa Rica’s ranking in the 2012-2013 Global Competitiveness Index improved to the 57th position (out of 144 countries), from 61st in the previous survey. However, inadequate infrastructure and excessive government bureaucracy continue to weigh on the country’s competitiveness. The country also stands low in the Doing Business Index, ranking in the 110th position out of 185 countries.
The real effective exchange rate has appreciated significantly in recent years. Driven to a large extent by the inflation differential vis-à-vis trading partners, the real effective exchange rate (REER) has risen by more than 30 percent since 2005. Using unit labor costs, the REER measure rose by about the same magnitude, though at a much slower rate since 2009.
Multilaterally-consistent estimates suggest that Costa Rica’s REER is moderately overvalued, and that a narrower current account deficit would be warranted over the medium term.
External balance assessment (EBA) estimates rely on econometric analysis to gauge the values of key indicators of external sustainability implied by fundamentals and desirable policies:
-30
-20
-10
0
10
20
30
40
50
60
Jan-05 Jan-06 Jan-07 Jan-08 Jan-09 Jan-10
NEERRel PriceREERREER ULC
Costa Rica: Real effective exchange rate (changes in percent since January 2005) 1,2/
Source: National authorities and Fund staff calculations.
1/ Increase implies appreciation.
2/ The REER based on ULC was calculated with data for 73 percent of the trading partners.

COSTA RICA
INTERNATIONAL MONETARY FUND 7
Box 1. Costa Rica: External Stability Assessment (concluded)
• The current account regression-based approach points to a sustainable cyclically-adjusted current account deficit of about 2.7 percent of GDP, which is 2 percentage points below the current cyclically-adjusted level. The gap reflects in part the effect of the large fiscal deficit and generous social protection policies that reduce the need for precautionary saving.
• Preliminary estimates under the REER regression-based approach point to an overvaluation of about 25 percent. This result, however, should be interpreted with caution. While it is driven in part by identifiable factors—notably, again, by the country’s fiscal policies and high social spending— it is also characterized by a large regression residual.
• Under the external sustainability approach, the net foreign asset (NFA) position would stabilize at the benchmark level of 26 percent with a current account deficit of 1.9 percent. This suggests that the REER gap is about 23 percent. However, if alternative estimates for the NFA position are used,1 the NFA-stabilizing current account deficit widens to 3.5 percent and the estimated REER overvaluation drops to 12 percent.
Methodologies developed by the IMF’s Consultative Group on Exchange Rate Issues (CGER) also suggest that the real exchange rate is moderately overvalued: three different approaches produce a deviation from fundamentals-based values in the range of 7.9 to 14.6 percent.
While Costa Rica’s current account deficit appears elevated, its financing structure mitigates risks. The current account deficit is mostly financed by FDI inflows, which have hovered at about 5 percent of GDP per year since 2005. As a result, Costa Rica’s net international investment position is negative, with more than 60 percent of the external liabilities are comprised of FDI liabilities. Such financing structure makes the external accounts less vulnerable to sudden changes in global financial conditions. The level of net international reserves (NIR) is somewhat below the composite adequacy metric. According to staff’s estimates, Costa Rica’s NIR stand at about 95 percent of the reserve adequacy metric that captures countries’ vulnerabilities based on their exports and asset-liability structure, as well as the risk of related outflows.2
_______________
1 Philip R. Lane and Gian Maria Milesi-Ferretti, 2006, “The External Wealth of Nations Mark II: Revised and Extended
Estimates of Foreign Assets and Liabilities, 1970–2004”, IMF Working Paper 06/69. 2 See “Assessing reserve adequacy”, 2011, Policy Paper, International Monetary Fund.
Estimates of Competitiveness Using EBA Methodologies 1/ Estimates of Competitiveness Using CGER Methodologies 1/
(REER deviation from levels implied by medium-term fundamentals)
Methodology Methodology
CA regression-based approach: CA gap (percent of GDP) -2.0 Macroeconomic balance (MB) approach 7.9
-2.7 ES approach 8.5
ES approach: CA gap (percent of GDP) -3.6 Equilibrium REER approach 14.6
ES approach: CA norm (percent of GDP) -1.9 Source: IMF s taff es timates
REER regression-based approach: REER gap (percent) 25.2
Source: IMF s taff es timates
(Deviation from norms implied by fundamentals and desirable policies)
1/ EBA (External Balance Assessment). CA gaps : negative gap impl ies REER
overvaluation.
CA regression-based approach: CA norm (percent of GDP)
1/ CGER (Consul tative Group on Exchange Rate Issues). Plus indicates
overva luation. Internationa l Monetary Fund, 2008, "Exchange Rate
Assessments : CGER Methodologies" (avai lable at www.imf.org)

COSTA RICA
8 INTERNATIONAL MONETARY FUND
further rise in the public debt-to-GDP ratio, which is expected to have reached 38 percent of GDP at end-2012 (including external debt placed in late 2012 to pre-finance 2013 borrowing requirements, ¶ 7).
Costa Rica's GDP growth and fiscal deficit are higher than the CAPDR average, while inflation and the current account deficit are lower than the regional average
0.0
2.0
4.0
6.0
8.0
10.0
Co
sta
Ric
a
Do
min
ican
Re
p.
El S
alva
do
r
Gu
ate
mal
a
Ho
nd
ura
s
Nic
arag
ua
Pan
ama
GDP Growth
Inflation
CAPDR: GDP growth and inflation (2012F) (percent)
Source: National authorities.
-24.0
-20.0
-16.0
-12.0
-8.0
-4.0
0.0
4.0
Co
sta
Ric
a
Do
min
ican
Re
p.
El S
alva
do
r
Gu
ate
mal
a
Ho
nd
ura
s
Nic
arag
ua
Pan
ama
Current Account Balance
Overall Fiscal Balance
CAPDR: Current account and fiscal deficit (2012F) (percent of GDP)
Source: National authorities.
7. The Supreme Court voided a revenue-enhancing tax reform. As discussed in the staff report for the 2011 Article IV consultation, a tax reform aimed at increasing public revenues by 1½-2 percentage points of GDP (by broadening the tax base and turning the sales tax into a full-fledged value-added tax) was the cornerstone of the government’s fiscal consolidation strategy. In March 2012, Congress approved the bill but a month later the Supreme Court nullified it, citing procedural irregularities in its legislative approval. Since then, the authorities’ fiscal policy strategy focused on containing expenditure, strengthening tax administration, and reducing borrowing costs by tapping international capital markets. The government placed US$1 billion Eurobonds in late 2012 and is planning to place an additional US$3 billion in the coming years.
8. Domestic financial conditions tightened during 2012. Although the monetary policy rate has remained at 5 percent since mid-2011, other interest rates rose significantly, especially during the first half of the year, driven by large government borrowing and buoyant private sector credit demand. Interest rates declined somewhat late in the year, but remained above the previous year’s level. A broader-based index developed by staff (comprising variables such as interest rates, the REER, and house prices) also pointed to tighter financial conditions (Box 2). Despite this tightening, credit expansion to the private sector was slightly higher than nominal GDP growth.

COSTA RICA
INTERNATIONAL MONETARY FUND 9
Box 2. Costa Rica: Financial Conditions
A Financial Conditions Index (FCI) was developed for Costa Rica. Financial conditions can be defined as the current state of financial variables that influence economic activity. The FCI seeks to summarize the information contained in key financial variables and capture the link between them and economic activity. A VAR analysis was used to decompose the contribution of various financial indicators to real GDP growth. The FCI was built as the sum of the cumulative impulse responses of real GDP to each of the relevant financial variables. The financial variables used included a summary measure of interest rates (the basic passive rate or “tasa basica pasiva”), the real effective exchange rate, the stock market index, and a house price index (proxied by rental prices as measured in the consumer price index). The period of estimation was 1991-2012, and the frequency of the data was quarterly. The impulse responses were standardized so that a change in each FCI component by one unit can be interpreted as an (annualized) change in real GDP growth by 1 percentage point. Hence, a change in the value of the overall FCI reflects the total contribution of financial conditions to GDP growth.
The estimated FCI suggests that financial conditions tightened in 2012. The rise in the basic passive interest rate and a weaker stock market during the first half of the year were the main drivers of the tightening in the FCI. Financial conditions eased somewhat during the second half of the year, partly driven by a decline in the basic passive interest rate in the fourth quarter. However, considering the year as a whole, financial conditions in 2012 were on average tighter than in 2011. Tighter financial conditions may have been a drag on growth, which showed slowing signs in the second half of the year.
-3.0-2.5-2.0-1.5-1.0-0.50.00.51.01.52.02.5
2007Q1 2008Q1 2009Q1 2010Q1 2011Q1 2012Q1
Tasa Basica Pasiva REERStock index House pricesOverall FCI
Monetary and Financial Conditions Index(percentage points of y/y real GDP growth)
Source: Fund staff estimates.

COSTA RICA
10 INTERNATIONAL MONETARY FUND
9. The financial system remained sound, though dollarization continues to be a source of vulnerability. Capital adequacy stood well above regulatory requirements and liquidity remained robust. Profitability was stable, albeit somewhat below that of regional peers, and non-performing loans are at manageable levels. Reliance on foreign funding is small and exposure to foreign assets modest. Staff analysis suggests that a potential intensification of sovereign and banking strains in advanced countries would not have a large direct impact on credit or the financial system in Costa Rica (Box 3). Stress test exercises conducted by bank supervisors in 2012 yielded similar results. Although the banking sector has a long open foreign exchange position, a large depreciation of the colón may impact asset quality, given large unhedged liability dollarization of households and corporations.
Costa Rica
GuatemalaEl
SalvadorHonduras
Dominican Republic
Panama CAPDR 2/ LA6 3/
Regulatory Capital to Risk-Weighted Assets 17.4 14.6 17.4 14.9 15.7 16.0** 15.7 15.4
Capital to Assets Ratio 15.1 9.5* 13.9* 11.0 9.9 11.7** 11.2 10.1
Nonperforming Loans to Total Loans Ratio
1.8 1.5 3.3* 2.6 3.2 0.9** 2.3 2.6
Return on Assets 1.5 1.9* 1.6 2.5 2.3 1.8** 2.0 2.1
Return on Equity 10.3 19.6* 11.7* 25.2 23.2 7.3** 17.4 20.1
Source: FSI tables, October 2012, IMF, http://fsi.imf.org/fsitables.aspx. 1/ As of July, 2012 unless otherwise noted.* As of August, 2012; ** as of June, 2012.2/ Comprises Guatemala, El Salvador, Honduras, Panama, and the Dominican Republic.3/ Comprises Brazil, Chile, Colombia, Mexico, Peru, and Uruguay.
Financial Soundness Indicators (in percent) 1/
COSTA RICA
INTERNATIONAL MONETARY FUND 11
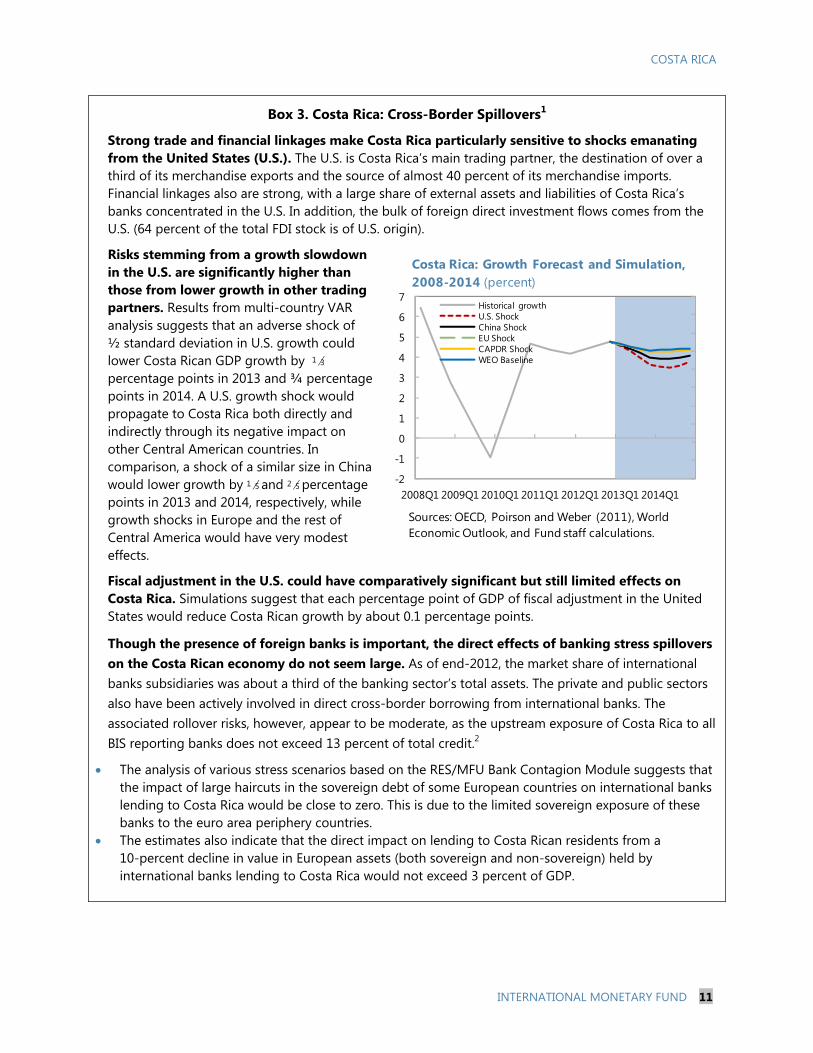
Box 3. Costa Rica: Cross-Border Spillovers1
Strong trade and financial linkages make Costa Rica particularly sensitive to shocks emanating from the United States (U.S.). The U.S. is Costa Rica’s main trading partner, the destination of over a third of its merchandise exports and the source of almost 40 percent of its merchandise imports. Financial linkages also are strong, with a large share of external assets and liabilities of Costa Rica’s banks concentrated in the U.S. In addition, the bulk of foreign direct investment flows comes from the U.S. (64 percent of the total FDI stock is of U.S. origin).
Risks stemming from a growth slowdown in the U.S. are significantly higher than those from lower growth in other trading partners. Results from multi-country VAR analysis suggests that an adverse shock of ½ standard deviation in U.S. growth could lower Costa Rican GDP growth by 1 3 percentage points in 2013 and ¾ percentage points in 2014. A U.S. growth shock would propagate to Costa Rica both directly and indirectly through its negative impact on other Central American countries. In comparison, a shock of a similar size in China would lower growth by 1 5 and 2 5 percentage points in 2013 and 2014, respectively, while growth shocks in Europe and the rest of Central America would have very modest effects.
Fiscal adjustment in the U.S. could have comparatively significant but still limited effects on Costa Rica. Simulations suggest that each percentage point of GDP of fiscal adjustment in the United States would reduce Costa Rican growth by about 0.1 percentage points.
Though the presence of foreign banks is important, the direct effects of banking stress spillovers on the Costa Rican economy do not seem large. As of end-2012, the market share of international banks subsidiaries was about a third of the banking sector’s total assets. The private and public sectors also have been actively involved in direct cross-border borrowing from international banks. The associated rollover risks, however, appear to be moderate, as the upstream exposure of Costa Rica to all BIS reporting banks does not exceed 13 percent of total credit.2
The analysis of various stress scenarios based on the RES/MFU Bank Contagion Module suggests that the impact of large haircuts in the sovereign debt of some European countries on international banks lending to Costa Rica would be close to zero. This is due to the limited sovereign exposure of these banks to the euro area periphery countries.
The estimates also indicate that the direct impact on lending to Costa Rican residents from a 10-percent decline in value in European assets (both sovereign and non-sovereign) held by international banks lending to Costa Rica would not exceed 3 percent of GDP.
-2
-1
0
1
2
3
4
5
6
7
2008Q1 2009Q1 2010Q1 2011Q1 2012Q1 2013Q1 2014Q1
Historical growthU.S. ShockChina ShockEU ShockCAPDR ShockWEO Baseline
Costa Rica: Growth Forecast and Simulation, 2008-2014 (percent)
Sources: OECD, Poirson and Weber (2011), World Economic Outlook, and Fund staff calculations.

COSTA RICA
12 INTERNATIONAL MONETARY FUND
Shock Originating From Magnitude 1/
Impact on claims on CRI borrowers (percent of GDP)
2/Greece 30 0.0Greece, Ireland, and Portugal 30 -0.1Italy 10 0.0Spain 10 -0.1France 10 -0.3Germany 10 -1.0Netherlands 10 -0.3Austria 10 0.0UK 10 -1.2Selected European Countries 3/ 10 -2.9Canada and US 10 -3.7
Source: RES/MFU Bank Contagion Module based on BIS, ECB, and IFS data.
3/ Austria, Greece, Ireland, Portugal, Italy, Spain, France, Germany, Netherlands, and UK.
Spillovers to Costa Rica from International Banks' Exposures as of March 2012
2/ Reduction in foreign banks credit to Costa Rica due to the impact of the analyzed shock on their balance sheets, assuming a uniform deleveraging across domestic and external claims.
1/ Magnitude denotes the percent of on-balance sheet claims (all borrowing sectors) that lose value.
Box 3. Costa Rica: Cross-Border Spillovers (concluded)
_____________ 1 See Analytical Note 1 (AN 1). 2 Total credit to the non-bank sectors in Costa Rica is calculated by adding IFS local (both domestic and foreign owned) banks’ claims on non-bank borrowers and BIS reporting banks’ direct cross-border claims on non-bank sectors (BIS Locational Banking Statistics Table 6B).
B. Macroeconomic Outlook and Risks
10. Both authorities and staff project growth to decelerate in 2013, with inflation and the current account deficit remaining broadly stable. Real GDP growth would ease to 4¼ percent largely on account of a lower contribution from net exports and a somewhat slower expansion in domestic demand. On the supply side, the bulk of the slowdown would come from manufacturing after an exceptionally strong performance in 2012. With output still slightly below potential, inflation is projected to stay within the target range and the current account deficit would not change materially. The overall balance of payments would remain strongly in surplus, amid continuing large FDI and portfolio inflows, leading to further substantial NIR rise.
11. Staff’s medium-term baseline scenario envisages continuing growth but a modest deterioration in fundamentals. This central setting contemplates no fiscal consolidation over the forecast period (given uncertainties surrounding passage of the tax reform, ¶ 21), and projects the output gap to close by 2014, after which growth would converge to a steady-state potential rate of

COSTA RICA
INTERNATIONAL MONETARY FUND 13
4½ percent. The overall fiscal deficit would increase to about 7½ percent of GDP by 2018, and the public debt ratio would rise steadily to about 50 percent of GDP. With prudent monetary policy, inflation is projected to hover around 5 percent, though the current account deficit increases to about 6 percent of GDP.
2008 2009 2010 2011 2012 2013 2014 2015 2016 2017 2018
Real GDP growth (percent) 2.7 -1.0 4.7 4.2 5.0 4.2 4.4 4.5 4.5 4.5 4.5Output gap (percent of potential GDP) 3.5 -1.6 -1.0 -1.0 -0.1 -0.1 0.1 0.2 0.2 0.2 0.2Consumer prices (percent) 13.9 4.0 5.8 4.7 4.6 5.0 5.0 5.0 5.0 5.0 5.0Current account balance -9.3 -2.0 -3.5 -5.3 -5.5 -5.4 -5.5 -5.7 -5.8 -6.0 -6.0Consolidated fiscal balance 0.2 -4.0 -5.5 -4.3 -4.4 -4.9 -5.9 -6.3 -6.6 -7.1 -7.4Structural primary balance 1/ 2/ 1.7 -0.9 -2.3 -2.3 -2.2 -2.3 -2.7 -2.7 -2.7 -2.7 -2.7Structural overall balance 1/ 2/ -0.9 -3.2 -4.7 -4.7 -4.5 -4.8 -5.7 -6.0 -6.4 -6.7 -7.0Consolidated public sector debt 27.3 29.2 30.6 33.2 38.1 39.5 41.2 43.6 45.8 47.9 50.1
Sources: National authorities, and IMF staff estimates1/ Central government.2/ The structural fiscal balance in 2010 and 2011 was adjusted taking into consideration the timing of a large public investment project.
Costa Rica. Baseline Scenario (in percent of GDP, unless otherwise stated)
12. An alternative scenario that incorporates the authorities’ fiscal consolidation intentions yields a stronger outlook. The authorities aim to start a process of adjustment as well as adopt monetary and exchange rate policies that would keep the economy on a robust growth path, while alleviating lingering vulnerabilities. This scenario would have inflation gradually declining to trade partners’ levels and would improve prospects for long-term external and fiscal sustainability (¶s 5 and 19). According to staff analysis, the authorities’ plans would have only moderate short-term output costs and help lower inflation and the current account deficit over the forecast period.
2012 2013 2014 2015 2016 2017 2018
Real GDP growth (percent) 5.0 4.2 4.0 3.8 4.2 4.5 4.5Output gap (percent of potential GDP) -0.1 -0.1 -0.3 -0.9 -0.6 -0.3 0.0Consumer prices (percent) 4.6 5.0 5.3 5.0 4.5 4.0 4.0Current account balance -5.5 -5.4 -4.8 -4.8 -4.9 -4.9 -4.9Consolidated fiscal balance -4.3 -4.4 -4.8 -5.0 -3.8 -3.6 -3.5Structural primary balance 1/ -2.2 -2.3 -1.8 -0.3 -0.2 0.0 0.1Structural overall balance 1/ -4.5 -4.8 -4.9 -3.6 -3.4 -3.3 -3.1Consolidated public sector debt 38.1 39.5 40.5 40.7 40.3 39.4 38.4
Sources: National authorities, and IMF staff estimates1/ Central government.
(in percent of GDP, unless otherwise stated)Costa Rica. Fiscal Consolidation Scenario

COSTA RICA
14 INTERNATIONAL MONETARY FUND
13. Risks to the outlook are tilted to the downside. Downside risks stem from both external and domestic sources. While deviations from the assumed baseline for each of the risk factors listed below could occur in either direction, the probability of downside occurrences is deemed prevalent.
• Weaker global growth would reduce the demand for Costa Rican exports and FDI flows, weakening domestic activity. Costa Rica would be particularly sensitive to a worsening in the U.S. growth outlook, given close trade and financial links.
• Higher global risk aversion would ease the pressures stemming from large capital inflows but, if extreme, could impair access to international capital markets and bank lending, with adverse implications for growth, the balance of payments, and the fiscal accounts.
• Inflation shocks could stem from an increase in commodity prices, stronger-than-expected price pressures from current policies, or inability to manage large private capital inflows.
• The persistence of a large fiscal deficit, and the ensuing rise in the public debt ratio, could render the economy vulnerable to sudden changes in financial market conditions, and reduce the authorities’ policy space to respond to adverse shocks. Also, large government financing requirements could raise domestic interest rates, and weigh on private investment and growth.
• A large depreciation of the colón (in the event of an adverse balance of payments shock) could weaken the balance-sheets of corporate and households, given their negative foreign exchange positions, raising credit risks for banks, hurting economic activity.

COSTA RICA
INTERNATIONAL MONETARY FUND 15
Costa Rica: Risk Assessment Matrix1 (Scale—high, medium, or low)
Source of Risks
Overall Level of Concern
Relative Likelihood2/ Impact if Realized
1. Weaker global growth, especially slowdown in the U.S.
Low Shocks affecting global economic growth, and in
particular U.S. growth, would lower growth in Costa Rica.
High Weaker-than-expected U.S. growth would lower
export demand and significantly weigh on activity and tax revenues. A shock could have a more severe impact than in 2008-09, as fiscal buffers have been drawn down.
2. Higher global risk aversion.
Medium Heightened financial stress in Europe could
increase global risk aversion and reduce global growth. It could also reduce capital flows to emerging markets.
Medium The direct trade impact would be modest. The
indirect impact would depend on how much the shock affects U.S. growth.
A decline in capital flows to emerging markets would ease pressure from large capital inflows but, if extreme, could disrupt foreign credit lines and reduce banking sector liquidity.
3. Higher inflation, including from adverse global oil and food price shock or larger capital inflows.
Low/Medium A supply shock could raise world food and oil
prices. With rising capital inflows, there is a risk that
domestic policies prove too loose to prevent a rise in inflation.
Medium Higher food and oil prices would increase inflation,
widen the current account deficit, and adversely affect growth.
4. Worse-than-anticipated impact from persistently high fiscal deficits, or higher deficits than projected in the baseline scenario.
Medium Lack of fiscal consolidation prospects may hurt
confidence. Continued expenditure pressure could increase the
fiscal deficit and public debt above the projections in the baseline scenario.
High Lower confidence or a higher government financing
requirement could raise domestic interest rates and lower investment and growth.
Lower growth or a higher fiscal deficit would exacerbate fiscal sustainability risks, increasing the economy’s vulnerability and reducing the government’s ability to respond to adverse shocks.
Alternatively, even if confidence remained strong and financing were available, a looser fiscal stance could result in overheating.
5. Sudden unraveling of balance-sheet foreign exchange imbalances.
Low Balance sheets of corporate and households are
exposed to a depreciation of the local currency, given their negative foreign exchange positions.
While the banking sector holds a large open position in foreign currencies, it is also exposed to foreign exchange risk through its loan portfolio.
Medium Bank loan availability would be curtailed, impacting
economic activity and worsening the fiscal position. Depending on the magnitude of the depreciation,
balance sheet deterioration may affect some financial institutions.
1 The Risk Assessment Matrix (RAM) shows events that could materially alter the baseline path discussed in this report (which is the scenario most likely to materialize in the view of the staff). The RAM reflects staff's views on the source of risks and overall level of concerns as of the time of discussions with the authorities. The relative likelihood of risks listed is the staff’s subjective assessment of the risks surrounding this baseline.
2 In case the baseline does not materialize.

COSTA RICA
16 INTERNATIONAL MONETARY FUND
POLICY DISCUSSIONS 14. Discussions centered on how to maintain macroeconomic stability and reduce vulnerabilities, while taking actions to spur potential growth and boost competitiveness. In the near term, tighter fiscal and monetary policies may be necessary to maintain macroeconomic stability. In addition, fiscal consolidation is necessary to place public finances on a long-term sustainable path, the monetary policy framework should be further improved to maintain low inflation, financial sector supervision and regulation should be further enhanced, and structural reforms are needed to boost the growth potential of the economy and bolster competitiveness.
A. Near-term Policy Mix
15. Staff cautioned about inflationary risks. Though inflation has stayed subdued since 2009, risks of an uptick stem from: (i) continued capital inflows in the context of a lax global financial environment and a rigid exchange rate system; (ii) potential second round effects from higher global food prices (deserving special attention in light of their elevated pass-through in the past); and (iii) the imminent closure of the output gap. While agreeing with this assessment, the authorities highlighted that inflation expectations have recently fallen and are well-anchored within the target range.
16. There was agreement that a tighter policy stance would help safeguard macro stability, but the authorities indicated that major fiscal adjustment was not possible in 2013.
• Staff argued that a tighter fiscal stance in 2013 would contribute to mitigate risks of inflation and a wider external imbalance. It would also represent a step towards ensuring long-term sustainability (¶ 19). In staff’s assessment, a fiscal correction of about 1-1½ percent of GDP in 2013 would be appropriate, taking into consideration inflation and fiscal sustainability concerns as well as the cyclical position of the economy (¶ 20 and AN 3). The authorities noted that, while administrative efforts to contain expenditure and improve tax collections would continue and result in some decline of the fiscal deficit, a correction of the magnitude recommended by staff would require passage of fiscal measures, notably tax reform, through Congress, which the authorities considered unlikely to be enacted before 2014 owing to the parliamentary calendar.
• The authorities indicated readiness to tighten monetary policy if signs of inflationary pressure emerge. Staff highlighted that, in the absence of fiscal adjustment, actions may be required to keep inflation within the target range. The central bank indicated that, to prevent a resurgence of inflation, it would consider raising the policy rate and allowing greater exchange rate flexibility, probably coupled with adoption of capital flows management measures.

COSTA RICA
INTERNATIONAL MONETARY FUND 17
B. Safeguarding Fiscal Sustainability
17. The authorities concurred that current fiscal trends are unsustainable in the long-term. While efforts made in 2011-12 to contain expenditure yielded important results (¶ 6), the fiscal deficit remains well above debt-stabilizing levels. Moreover, in the absence of measures, the consolidated public sector deficit would rise to about 7½ percent of GDP by 2018, driven by higher education and investment spending and a mounting interest bill. This would increase public sector debt to about 50 percent of GDP by 2018 (from 33 percent of GDP at end-2011). The authorities acknowledged that a rise in debt of that magnitude would raise vulnerabilities and erode the underpinnings of macroeconomic stability.
18. The authorities also acknowledged that the pension system’s financial position has to be strengthened. The Old Age, Disability and Survivor insurance plan run by the Social Security agency (Caja Costarricense de Seguro Social or CCSS) as well as the pension funds of the judicial system and teachers are actuarially imbalanced. They are projected to turn a cash deficit over the medium and long term due to system maturation and population aging (AN 3). Preliminary projections suggest that an adjustment equivalent to about 1½ percent of GDP would be required to ensure actuarial equilibrium of all pension systems for the next 100 years. The authorities indicated that a joint study (by the CCSS and the Superintendence of Pensions) would allow determining more precisely the size of the imbalance. Based on the results from the study, gradual corrective measures (in the form of higher contributions, lower replacement rates, an increase in the retirement age, or a combination of measures) would be considered.
19. The authorities agreed that substantial improvement in the primary balance was necessary to attain fiscal sustainability. Staff noted that a permanent improvement in the primary balance of 2½-3 percent of GDP was necessary to stabilize the public debt ratio, and that the improvement would have to be 1½ percentage points of GDP higher to remedy the actuarial imbalance of the pension system (¶ 18), with the long-term fiscal sustainability gap thus totaling 4-4½ percentage points of GDP. Staff also argued that, beyond stabilizing the public debt ratio, it might be prudent to rebuild the budgetary buffers heavily eroded during 2009-10, considering the high sensitivity of public debt dynamics to shocks and the substantial risks to the outlook. Attaining this goal would require an additional improvement in the primary balance of about 1 percent of GDP.

COSTA RICA
18 INTERNATIONAL MONETARY FUND
Costa Rica: Long-Term Fiscal Sustainability, 2011-2070(Percent of GDP)
-6
-5
-4
-3
-2
-1
0
1
2
3
4
2011 2016 2021 2026 2031 2036 2041 2046 2051 2056 2061 2066 2070
No measuresImmediate adjustmentGradual adjustment
Primary balance
-60
-50
-40
-30
-20
-10
0
10
2011 2016 2021 2026 2031 2036 2041 2046 2051 2056 2061 2066 2070
No measuresImmediate adjustmentGradual adjustment
Overall balance
-100
0
100
200
300
400
500
600
2011 2016 2021 2026 2031 2036 2041 2046 2051 2056 2061 2066 2070
No measuresImmediate adjustmentGradual adjustment
Consolidated public sector debt
Source: IMF staff estimates.

COSTA RICA
INTERNATIONAL MONETARY FUND 19
20
30
40
50
60
70
80
CRI NIC HND PAN SLV DOM GTM
Lower middle-income countries
Upper middle-income countries
Estimated dividends from Panama Canal
Source: Country authorities; and IMF staff estimates.
Tax Effort in the Region (Actual/Potential Tax Revenues), 2010 (percent)
20. It was recognized that the pace of fiscal consolidation had to strike a balance between lowering the sustainability gap and limiting the adverse impact on growth. While cyclical considerations (output is close to potential) and the rapid pace at which public debt is growing call for significant upfront fiscal tightening, the overall adjustment needed to achieve sustainability should be adopted gradually. Staff analysis suggests that a reasonable balance would be attained by undertaking about one third of the fiscal consolidation in 2013 (or at the latest in 2014) followed by smaller steps in subsequent years (AN 3). With a fiscal multiplier of about 0.3 (multipliers tend to be small when the output gap is virtually closed), consistent with the authorities’ own estimates, the proposed adjustment path would be expected to have a small output cost over the forecast period. At the same time, staff cautioned against further postponing fiscal adjustment, emphasizing that the longer the delay, the larger will be the improvement in the primary balance required to stabilize the public debt ratio. Postponing fiscal consolidation would also increase the risk that currently favorable financial conditions reverse, which would precipitate a disorderly adjustment.
21. The authorities favor a fiscal consolidation strategy with both revenue and expenditure components.
• Recognizing Costa Rica’s low tax effort, the authorities saw significant scope to increase public revenues. They remained convinced that a tax reform similar to the one they had proposed in 2011-12 had to be the cornerstone of the fiscal consolidation strategy. For this reason, the authorities considered that their plan to resubmit a tax reform proposal to Congress was an important step, as it would allow consensus to be built before a new administration takes office in May 2014. Staff agreed and welcomed new legislation approved in 2012 to strengthen revenue administration.
• Efforts to contain the growth of current expenditure, particularly wages and transfers, should continue. In this connection, staff welcomed the bill submitted by the government to make the rigid public wage adjustment system more flexible as well as decisions to freeze vacancies and prioritize operational spending.
Costa Rica. Main Elements of the Authorities Fiscal Consolidation Plan
Area Main MeasuresPossible yield
(percent of GDP)Revenue Submit new tax reform to Congress aimed at:
Increasing tax base Reducing exemptions Redesigning value-added tax systemStrengthen tax administration
Expenditure Reform public employees compensation regime Align wage adjustments with expected inflation and productivity growth Rationalize and streamline additional compensation schemesEnhance efficiency of spending, especially in health and education
Public Debt Management Increase use of external debt to reduce cost of public debtSource: IMF staff based on national authorities.
2½-3
½

COSTA RICA
20 INTERNATIONAL MONETARY FUND
C. Upgrading the Monetary and Exchange Rate Policy Framework
22. Staff commended the authorities for having lowered inflation to single digits. Having posted double-digit inflation for almost 30 years, Costa Rica has managed to lower it to 4-6 percent since 2009. This achievement has been underpinned by continued efforts by the central bank to improve monetary control and strengthen its monetary operations framework, notably through the establishment of a corridor for short-term interest rates and the launch of a policy interest rate in 2011. Inflation, nonetheless, remains above that of trading partners. The authorities reaffirmed their goal to reduce inflation to trading partners’ levels (about 3 percent) over the medium term.
23. However, the monetary policy framework still presents weaknesses. Staff argued that the continued adherence to the exchange rate band was undermining the hard-won gains in lowering inflation, and the central bank’s ability to anchor inflation expectations. With the exchange rate at the bottom of the band and persistent appreciating pressures, the central bank has thus far reconciled monetary and exchange rate policy objectives by sterilizing foreign exchange purchases. However, the risk is high that sterilization costs will increase, widening the central banks’ deficit, particularly if capital inflows rise further. Clinging to the rigidity of the current exchange rate band could then lead to higher inflation. The central bank recognized these risks and indicated that, should conflicts arise, the inflation target would take precedence over other objectives.
24. The authorities reiterated their commitment to adopt full inflation targeting, but are concerned that removal of the band would result in abrupt colón appreciation. To protect macroeconomic stability, staff repeated the advice given in past Article IV consultations of eliminating the exchange rate band and establishing the inflation target as the undisputed anchor of monetary policy. This would allow greater use of the exchange rate as a shock absorber. A more flexible exchange rate regime would also make market participants more cognizant of two-way risks in exchange markets, promoting the development and use of hedging facilities and the reduction of foreign currency mismatches. The authorities concurred in principle, but they saw a serious risk of a large appreciation of the colón at the present juncture. To mitigate the latter, the authorities noted that they may consider the adoption of capital flow management measures (CFMs). Staff noted that the elimination of the band would not preclude the central bank from engaging in foreign exchange market interventions to smooth out exchange rate fluctuations as long as these do not undermine the inflation target. At the same time, it stressed that CFMs cannot replace fiscal and monetary policies as the key levers for preventing excessive REER appreciation over the medium term.
D. Financial Stability
25. The authorities are working to implement pending recommendations from the 2008 FSAP update. Progress in implementation has been slow, largely due to a crowded legislative agenda. Key pending steps include empowering the Superintendence of Financial Institutions to conduct consolidated supervision, providing adequate protection to bank supervisors, strengthening bank resolution procedures, and broadening the supervisory perimeter to non-bank financial institutions, all of which require passage of new legislation. On the supervisory front, staff welcomed progress in establishing risk-based supervision, and advised the authorities to step up efforts for its full implementation.

COSTA RICA
INTERNATIONAL MONETARY FUND 21
Costa Rica. Financial System Assessment Program (FSAP) Main Recommendations (2008)
Recommendations Status 1/
Comments A. Prudential Supervision and Regulation
Amend the legal framework in order to provide protection for supervisors while performing their responsibilities in good faith.
NI Art. 28 of Insurance Law 8653 of August 7, 2008, provides legal protection to insurance supervisors. The draft bank resolution law contemplates protection for bank supervisors participating in the resolution process.
Introduce pertinent laws for the Superintendency of Banks (SUGEF) to be able to supervise banking groups (including offshore structures) on a consolidated basis. Upon the approval of such laws the SUGEF should issue without delay operational regulations to ensure its rapid implementation by the banking system.
PL
Apply higher risk weight ratios to unhedged borrowers for capital adequacy purposes.
NI Under consideration by the authorities.
Modify the funding arrangements for supervision, in line with international best practices.
NI A draft legislation to recapitalize the central bank also addresses the increase in the financing share of the industry.
B. Crisis Management and Bank Crisis Resolution Framework
Amend article 155 of the Central Bank law in order to grant the SUGEF an appropriate range of supervisory tools to require a bank to take prompt remedial action and to impose penalties in accordance with the gravity of a situation.
PL
Amend the rating system for prompt corrective actions, to include new directives that allow the SUGEF to take an appropriate range of remedial actions and supervisory decisions.
PI The authorities intend to amend the rating system once risk-based supervision is fully in place.
Improve the early warning system, to allow the adoption of remedial actions in a timely manner.
PI The authorities will review the possibility of taking a broader range of remedial actions within the scope of the existing law.
Eliminate the emergency loan window and improve the design and operational arrangements of the ordinary rediscount window, including by establishing prudential limits in terms of regulatory capital.
PI The emergency line introduced during the 2008-09 crisis was discontinued and two high-access rediscount windows were created in 2011: (i) using bonds already included in the money market collateral pool; and (ii) using commercial credit portfolio as collateral (with strict rules on quality and haircuts). Both lines are available in US dollars and in colones.

COSTA RICA
22 INTERNATIONAL MONETARY FUND
Costa Rica. Financial System Assessment Program (FSAP) Main Recommendations (2008) (concluded).
However, the rediscount windows are activated only when a central bank committee considers that there is a systemic risk; operational procedures need to be further streamlined; and repo operations are still to be linked to prudential limits in terms of regulatory capital
Establish a deposit insurance scheme, in line with international best practices.
PL
Amend the bank resolution legal framework to include purchase and assumption type techniques.
PL
Enable voluntary, extra-judicial corporate restructuring agreements.
NI Approval of the Law on Execution on October 2007 did not address the weaknesses of the current procedural rules.
1/ FI: fully implemented; PI: partially implemented; PL: pending legislation; NI: Not implemented. Source: Superintendence of Financial Institutions.
26. Staff supported the gradual adoption of Basel III standards to improve further the resilience of the financial system. It noted that implementation of Basel III standards should be tailored to the characteristics of the Costa Rican financial system. Staff argued that the regulatory and risk management frameworks would benefit from firming up capital quality and increasing liquidity and capital requirements in line with Basel III standards. In particular, it advised introducing Basel III definitions of capital, a capital conservation buffer, and a leverage ratio. Supervisors agreed and confirmed that a coverage ratio conforming to Basel III will be introduced shortly. Staff estimates that adopting Basel III capital requirements would have a negligible negative growth impact (AN 4).
E. Structural Reforms
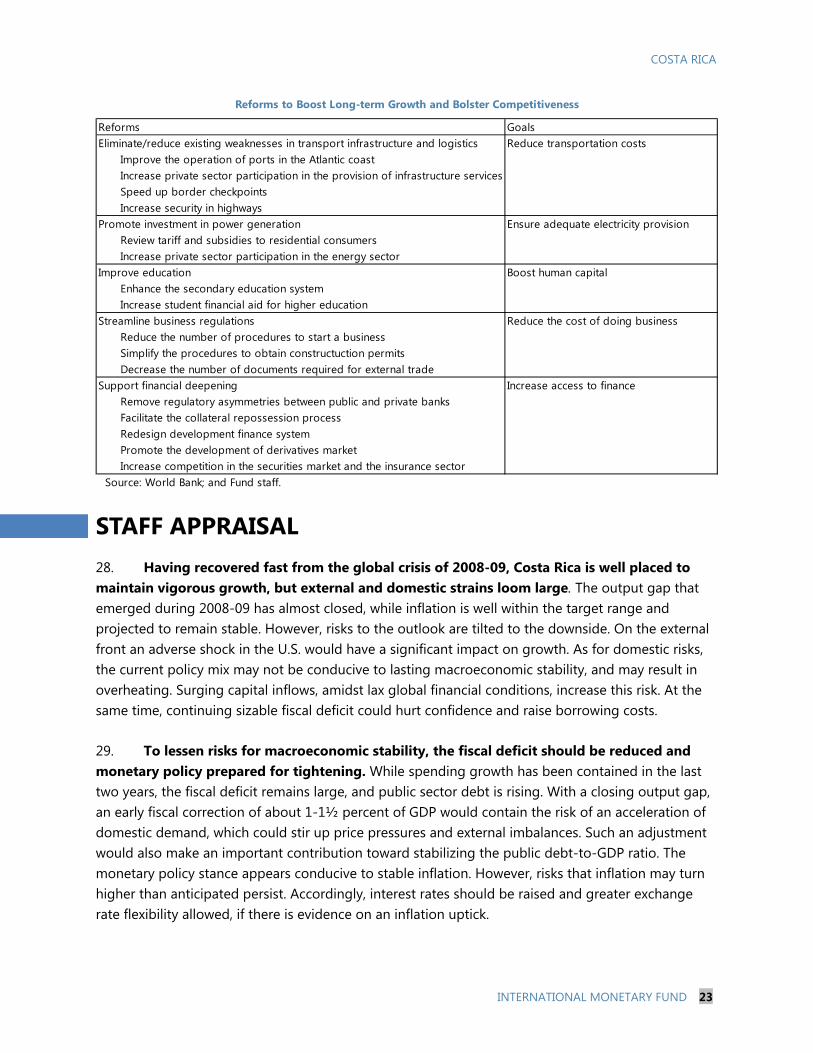
27. There was agreement that Costa Rica needs structural reforms to boost potential growth and buttress competitiveness. Staff recommended lifting competition in the banking sector (including by removing legal and regulatory differences between private and public banks), fostering the development of the domestic capital market, addressing infrastructure bottlenecks, and streamlining business regulations. According to staff estimates, efficiency gains from these measures could increase potential growth by up to 2 percentage points over the long run, although these are subject to a considerable degree of uncertainty. The authorities underlined the need to increase investment in infrastructure and noted ongoing projects in this area. They also pointed out progress in increasing competition in the insurance sector, which is expected to contribute to financial deepening.
COSTA RICA
INTERNATIONAL MONETARY FUND 23
Reforms GoalsEliminate/reduce existing weaknesses in transport infrastructure and logistics Reduce transportation costs
Improve the operation of ports in the Atlantic coastIncrease private sector participation in the provision of infrastructure servicesSpeed up border checkpointsIncrease security in highways
Promote investment in power generation Ensure adequate electricity provisionReview tariff and subsidies to residential consumersIncrease private sector participation in the energy sector
Improve education Boost human capitalEnhance the secondary education systemIncrease student financial aid for higher education
Streamline business regulations Reduce the cost of doing businessReduce the number of procedures to start a businessSimplify the procedures to obtain constructuction permitsDecrease the number of documents required for external trade
Support financial deepening Increase access to financeRemove regulatory asymmetries between public and private banksFacilitate the collateral repossession processRedesign development finance systemPromote the development of derivatives marketIncrease competition in the securities market and the insurance sector
Source: World Bank; and Fund staff.
Reforms to Boost Long-term Growth and Bolster Competitiveness
STAFF APPRAISAL 28. Having recovered fast from the global crisis of 2008-09, Costa Rica is well placed to maintain vigorous growth, but external and domestic strains loom large. The output gap that emerged during 2008-09 has almost closed, while inflation is well within the target range and projected to remain stable. However, risks to the outlook are tilted to the downside. On the external front an adverse shock in the U.S. would have a significant impact on growth. As for domestic risks, the current policy mix may not be conducive to lasting macroeconomic stability, and may result in overheating. Surging capital inflows, amidst lax global financial conditions, increase this risk. At the same time, continuing sizable fiscal deficit could hurt confidence and raise borrowing costs. 29. To lessen risks for macroeconomic stability, the fiscal deficit should be reduced and monetary policy prepared for tightening. While spending growth has been contained in the last two years, the fiscal deficit remains large, and public sector debt is rising. With a closing output gap, an early fiscal correction of about 1-1½ percent of GDP would contain the risk of an acceleration of domestic demand, which could stir up price pressures and external imbalances. Such an adjustment would also make an important contribution toward stabilizing the public debt-to-GDP ratio. The monetary policy stance appears conducive to stable inflation. However, risks that inflation may turn higher than anticipated persist. Accordingly, interest rates should be raised and greater exchange rate flexibility allowed, if there is evidence on an inflation uptick.

COSTA RICA
24 INTERNATIONAL MONETARY FUND
30. Ambitious fiscal consolidation should be sustained over the medium term. The current fiscal path, with continuously rising government debt, is untenable in the long-term and exacerbates macroeconomic fragilities. The authorities should thus seek to stabilize the public-debt-to-GDP ratio, which would require a permanent improvement in the primary balance of about 2½-3 percentage points of GDP. Additional adjustment (of about 1½ percentage points of GDP) would be necessary to bring the pension system to actuarial equilibrium. The pace of fiscal consolidation should balance the objectives of lowering the sustainability gap and limiting the adverse short-term impact on growth, which is quite feasible, since fiscal multipliers are low when the output gap is small. Reducing gradually the public debt ratio is also desirable to increase fiscal policy buffers. 31. Fiscal consolidation should include both revenue and expenditure measures. The size of the fiscal adjustment required to ensure sustainability calls for a multi-pronged strategy. There is significant scope to increase public revenues, since Costa Rica’s tax effort is low for an upper-middle-income country. In this connection, the intention of the government to seek parliamentary approval of a new version of the tax reform is welcome. In addition, revenue administration should be further strengthened. At the same time, current expenditure growth, which greatly outstripped nominal GDP growth during 2008-10, should be restrained, including through efficiency gains, as planned by the authorities. 32. The monetary policy framework should be strengthened by moving to inflation targeting and allowing greater exchange rate flexibility. Continued adherence to the exchange rate band system may imperil the low inflation achieved in recent years, in light of the strong appreciating pressures exacerbated by the large capital inflows. Sterilization of foreign exchange purchases will become increasingly costly and ultimately compel the central bank to allow higher inflation. To protect macroeconomic stability, the authorities should phase out the exchange rate band and establish the inflation target as the sole nominal anchor of the economy. Foreign exchange market interventions by the central bank to smooth out exchange rate fluctuations and strengthen the NIR position would still be possible insofar as these do not undermine the inflation target. If necessary, these policies, along with appropriate fiscal and monetary policies, could be complemented for a limited period by macro-prudential and other capital flow management measures. 33. Further improvements in regulation and supervision of the financial system are desirable. The risk of a sharp deterioration of the bank loan portfolio following a large depreciation of the colon (given that a sizable share of dollar-borrowers does not generate significant earnings in foreign currency) is of particular concern. To mitigate this and other vulnerabilities, measures recommended in the 2008 FSAP update but still not implemented should be adopted. On the supervisory front, full-fledged introduction of risk-based supervision should be a priority. In addition, the regulatory and risk management frameworks would benefit from firming up the existing capital quality and increasing liquidity and capital requirements in line with Basel III standards.

COSTA RICA
INTERNATIONAL MONETARY FUND 25
34. Structural reforms should be pursued to boost potential growth. Measures to lift competition in the banking sector (including by promoting higher private sector participation), foster the development of the domestic capital market, reduce infrastructure bottlenecks, and streamline business regulations are especially important. 35. It is recommended that the next Article IV consultation be held on the standard 12-month cycle.

COSTA RICA
26 INTERNATIONAL MONETARY FUND
Figure 1. Costa Rica: Growth & Inflation
Sources: Country authorities and IMF staff calculations.1/ CAPDR excluding Costa Rica comprises Dominican Rep, El Salvador, Guatemala, Honduras and Panama.2/ LA-6 comprises Brazil, Chile, Colombia, Mexico, Peru and Uruguay.
-6
-4
-2
0
2
4
6
8
10
Jan-08 Jan-09 Jan-10 Jan-11 Jan-12
IMAE (trend cycle)
12 per. Mov. Avg. (IMAE (trend cycle))
Monthly index of economic activity (percent y/y)
-15
-10
-5
0
5
10
15
20
I.08 I.09 I.10 I.11 I.12
Net exports
Domestic demand
Real GDP (y/y growth)
Real GDP growth (percent y/y) and contributions
-2
-1
0
1
2
3
4
5
6
7
2008 2009 2010 2011 2012F
Output gapPotential growthObserved growth
Growth (percent) and output gap (percent of potential GDP)
0
2
4
6
8
10
12
14
16
2005 2006 2007 2008 2009 2010 2011 2012F
Costa RicaCAPDR, excluding Costa Rica 1/LA-6 2/
Inflation (percent y/y)
0
2
4
6
8
10
12
14
16
18
Jan-08 Jan-09 Jan-10 Jan-11 Jan-12
Headline inflationCore inflationTarget band
Inflation (percent y/y)
0
2
4
6
8
10
12
14
Jan-08 Jan-09 Jan-10 Jan-11 Jan-12
Inflation expectations (12-months)
Target band
Inflation (percent y/y)
Output growth has remained robust ... ... driven by domestic demand.
Inflation has fallen below the regional average...The output gap is practically closed.
... and remains comfortably within the target band. Inflation expectations are now within the band.

COSTA RICA
INTERNATIONAL MONETARY FUND 27
Figure 2. Costa Rica: External Sector
-12
-10
-8
-6
-4
-2
0
2
4
6
2007 2008 2009 2010 2011 2012F
Income & transfersOil importsNon-oil trade balance
Current account and components (percent of GDP)
-6
-4
-2
0
2
4
6
8
10
12
2007 2008 2009 2010 2011 2012F
FDI
Public sector
Financial and capital account and components (percent of GDP)
-2
-1
0
1
2
3
4
2007 2008 2009 2010 2011 2012F
Balance of payments balance
Overall balance of payments (percent of GDP)
450475500525550575600625650675700725750775800
Dec-07 Dec-08 Dec-09 Dec-10 Dec-11
Exchange rate
Band
Daily exchange rate (colones per U.S. dollar)
0
100
200
300
400
500
600
4.0
4.4
4.8
5.2
5.6
6.0
6.4
6.8
7.2
Sep-
10
Dec
-10
Mar
-11
Jun-
11
Sep-
11
Dec
-11
Mar
-12
Jun-
12
Sep-
12
Dec
-12
BCCR FX purchases (rhs)NIR (lhs)
Net international reserves and BCCR foreign exchange purchases (billions of U.S. dollars)
90
100
110
120
130
140
150
Jan-07 Jan-08 Jan-09 Jan-10 Jan-11 Jan-12
Multilateral REER Bilateral REER vs. U.S. dollar
Real effective exchange rate indices (Jan 2000=100)(appreciation +)
The current account deficit has widened... ... but capital inflows also have increased...
... and the overall BoP is in surplus. Upward pressures on the colón have persisted...
... and the central bank has stepped up purchases,... ... but the REER has continued to appreciate.
Sources: Country authorities and IMF staff calculations.

COSTA RICA
28 INTERNATIONAL MONETARY FUND
Figure 3. Costa Rica: Fiscal Developments
Source: Country authorities and IMF staff calculations.
0.0
0.5
1.0
1.5
2.0
2.5
3.0
3.5
-8
-6
-4
-2
0
2
2007 2008 2009 2010 2011 2012 2013F
Fiscal impulse
Headline fiscal balance, cyclically-adjusted balance (lhs) and fiscal impulse (rhs) (percent of GDP)
0
5
10
15
20
25
30
35
40
2007 2008 2009 2010 2011 2012F
Nominal GDPNoninterest expenditure
Noninterest expenditure and nominal GDP growth (annual growth)
12.5
13.0
13.5
14.0
14.5
15.0
15.5
16.0
2006 2007 2008 2009 2010 2011 2012F
Observed Structural
Tax revenues, observed and structural level (percent of GDP)
-7
-6
-5
-4
-3
-2
-1
0
1
2
3
2007 2008 2009 2010 2011 2012F
Central BankRest of NFPSCentral governmentConsolidated balance
Public sector balance (percent of GDP)
33.6
27.3
29.230.6
33.2
38.1
25
27
29
31
33
35
37
39
41
2007 2008 2009 2010 2011 2012F
Consolidated public sector debt (percent of GDP)
Fiscal policy is not withdrawing stimulus.
Growth of government expenditure has moderated ...
... but the fiscal deficit remains large...
... and tax revenues have increased, ...
... and the public debt ratio continues to rise.
The public debt path is subject to significant risks.
0
10
20
30
40
50
60
70
80
90
100
2008 2010 2012 2014 2016
Public sector debt to GDP (Stochastic simulation)

COSTA RICA
INTERNATIONAL MONETARY FUND 29
Figure 4. Costa Rica: Money and Credit
Source: Country authorities and IMF staff calculations.
1
2
3
4
5
6
7
8
9
10
Jan-10 Jul-10 Jan-11 Jul-11 Jan-12 Jul-12
Interbank interest rateMonetary policy rate
Monetary policy rate and interbank interest rate (percent)
6.0
6.5
7.0
7.5
8.0
8.5
9.0
9.5
10.0
10.5
11.0
Jan-10 Jul-10 Jan-11 Jul-11 Jan-12 Jul-12
Basic passive interest rate (percent)
0
5
10
15
20
25
30
2007 2008 2009 2010 2011 2012F
Broad moneyTotal depositsNominal GDP
Monetary aggregates (nominal growth, percent y/y)
-5
0
5
10
15
20
25
30
35
40
45
Jan-07 Jan-08 Jan-09 Jan-10 Jan-11 Jan-12 Jan-13
Credit to the private sector (percent y/y)
35
40
45
50
55
60
65
Jan-07 Jan-08 Jan-09 Jan-10 Jan-11 Jan-12
Local currency
Foreign currrency
Deposits by currency denomination (share as a percent of total)
35
40
45
50
55
60
65
Jan-07 Dec-07 Nov-08 Oct-09 Sep-10 Aug-11 Jul-12
Local currency Foreign currency
Credit to the private sector by currency denomination(share as a percent of total )
The monetary policy rate has not changed since early 2011... ... but market interest rates have risen...
Monetary aggregates are growing at a healthy pace. ... partly owing to a pickup in credit demand.
Deposit dollarization is declining gradually... ... but credit dollarization is rising.

COSTA RICA
30 INTERNATIONAL MONETARY FUND
Population (2011, millions) 4.7 Human Development Index Rank (2011) 70 (out of 187)Per capita GDP (2011, U.S. dollars) 10,591 Life expectancy (2009, years) 79.1Unemployment (2011, percent of labor force) 7.7 Literacy rate (2009, percent of people ages > 15) 96.0Poverty (2010, percent of population) 24.2 Ratio of girls to boys in primary and 102.0Income share held by highest 10 percent of households 39.4 secondary education (2010, percent)Income share held by lowest 10 percent of households 1.7 Gini coefficient (2009) 51.0
Est.2008 2009 2010 2011 2012 2013 2014
Output and PricesReal GDP growth 2.7 -1.0 4.7 4.2 5.0 4.2 4.4Output gap (percent of potential GDP) 3.5 -1.6 -1.0 -1.0 -0.1 -0.1 0.1GDP deflator 12.4 8.4 8.0 4.1 4.5 5.1 5.2Consumer prices (end of period) 13.9 4.0 5.8 4.7 4.6 5.0 5.0
Money and CreditMonetary base 11.9 5.1 11.2 11.6 10.1 9.9 9.8Broad money 16.1 9.7 1.2 6.4 11.1 11.7 11.6Credit to private sector 31.8 4.5 4.4 13.7 12.7 12.6 11.3Monetary policy rate (percent; end of period) … … … 5.5 5.5 … …
Savings and InvestmentGross domestic investment 27.6 16.3 20.1 20.6 20.8 20.5 20.7Gross domestic savings 18.2 14.3 16.6 15.3 15.3 15.0 15.2
External SectorCurrent account balance -9.3 -2.0 -3.5 -5.3 -5.5 -5.5 -5.6 Of which: Trade balance -16.8 -6.9 -9.5 -12.6 -12.6 -12.6 -12.6Financial and capital account balance 8.3 1.7 5.5 6.3 10.1 8.5 7.4 Of which: Foreign direct investment 6.9 4.6 4.0 5.1 5.0 4.8 4.5Change in net international reserves (increase -) 348 -51 -561 -132 -2,101 -1,500 -1,000Net international reserves (millions of U.S. dollars) 3,799 4,066 4,627 4,756 6,857 8,357 9,357
Public FinancesCentral government primary balance 2.4 -1.3 -3.0 -1.9 -2.3 -2.4 -2.7Central government overall balance -0.3 -3.6 -5.4 -4.3 -4.6 -4.9 -5.7Central government debt 24.8 27.2 29.2 30.9 34.8 35.9 37.3
Consolidated public sector overall balance 1/ 0.2 -4.0 -5.5 -4.3 -4.4 -4.9 -5.9Consolidated public sector debt 2/ 27.3 29.2 30.6 33.2 38.1 39.5 41.2 Of which: External public debt 8.6 7.2 7.2 6.4 7.8 9.3 10.4
Memorandum Item:GDP (millions of U.S. dollars) 29,838 29,383 36,218 40,870 45,103 49,778 54,523
Sources: Central Bank of Costa Rica; Ministry of Finance; and Fund staff projections.
1/ The consolidated public sector balance comprises the central government, decentralized government entities, public enterprises, and the central bank, but excludes the Instituto Costarricense de Electricidad (ICE).2/ The consolidated public debt nets out central government and central bank debt held by the Caja Costarricense del Seguro Social (social security agency) and other entities of the nonfinancial public sector.
Proj.
(Annual percentage change, unless otherwise indicated)
(In percent of GDP, unless otherwise indicated)
Table 1. Costa Rica: Selected Social and Economic Indicators

COSTA RICA
INTERNATIONAL MONETARY FUND 31
Est.2008 2009 2010 2011 2012 2013 2014 2015 2016 2017 2018
Current Account -2,787 -576 -1,281 -2,185 -2,469 -2,738 -3,027 -3,429 -3,806 -4,222 -4,621Trade balance -5,013 -2,039 -3,440 -5,151 -5,684 -6,262 -6,879 -7,717 -8,426 -9,217 -10,074
Export of goods (f.o.b.) 9,555 8,838 9,516 10,383 11,111 11,638 12,379 13,290 14,454 15,712 16,966Import of goods (f.o.b.) 14,569 10,877 12,956 15,534 16,795 17,900 19,258 21,006 22,879 24,929 27,040
Services 2,201 2,188 2,537 3,210 3,719 4,171 4,624 5,167 5,679 6,235 6,841Of which: Travel 1,689 1,448 1,575 1,747 1,994 2,261 2,542 2,852 3,087 3,351 3,634
Income -417 -1,084 -745 -567 -847 -979 -1,148 -1,327 -1,529 -1,733 -1,907Current transfers 442 359 366 323 343 332 376 448 471 494 520
Financial and Capital Account 2,487 498 1,986 2,557 4,569 4,238 4,027 4,229 4,006 4,272 4,671Public sector 11 302 615 53 813 995 990 1,020 640 722 721Private sector 2,476 196 1,371 2,505 3,757 3,243 3,037 3,209 3,366 3,550 3,950
Foreign direct investment 2,072 1,339 1,441 2,099 2,251 2,371 2,464 2,561 2,727 2,982 3,263Other private sector flows 404 -1,143 -70 406 1,505 872 573 648 639 568 688
Errors and Omissions -48 129 -144 -239 0 0 0 0 0 0 0Change in International Reserves (increase -) 348 -51 -561 -132 -2,101 -1,500 -1,000 -800 -200 -50 -50
Current Account -9.3 -2.0 -3.5 -5.3 -5.5 -5.5 -5.6 -5.7 -5.8 -6.0 -6.0Trade balance -16.8 -6.9 -9.5 -12.6 -12.6 -12.6 -12.6 -12.9 -12.9 -13.1 -13.2
Export of goods (f.o.b.) 32.0 30.1 26.3 25.4 24.6 23.4 22.7 22.2 22.2 22.3 22.2Import of goods (f.o.b.) 48.8 37.0 35.8 38.0 37.2 36.0 35.3 35.1 35.1 35.3 35.3
Of which: Oil and fuels 7.0 4.2 4.4 5.3 5.0 4.6 4.3 4.2 4.0 4.0 4.0Services 7.4 7.4 7.0 7.9 8.2 8.4 8.5 8.6 8.7 8.8 8.9Income -1.4 -3.7 -2.1 -1.4 -1.9 -2.0 -2.1 -2.2 -2.3 -2.5 -2.5Current transfers 1.5 1.2 1.0 0.8 0.8 0.7 0.7 0.7 0.7 0.7 0.7
Financial and Capital account 8.3 1.7 5.5 6.3 10.1 8.5 7.4 7.1 6.1 6.0 6.1Of which: Foreign direct investment 6.9 4.6 4.0 5.1 5.0 4.8 4.5 4.3 4.2 4.2 4.3
Change in International Reserves (increase -) 1.2 -0.2 -1.5 -0.3 -4.7 -3.0 -1.8 -1.3 -0.3 -0.1 -0.1
Memorandum Items:Non-oil current account (percent of GDP) -2.3 2.3 0.9 -0.1 -0.5 -0.9 -1.3 -1.6 -1.8 -2.0 -2.0Terms of trade (annual percentage change) -1.1 4.9 -0.3 -3.1 -0.8 0.0 0.5 0.7 0.7 0.7 0.7Net international reserves (millions of U.S. dollars) 3,799 4,066 4,627 4,756 6,857 8,357 9,357 10,157 10,357 10,407 10,457 -in months of non-maquila imports 6.7 6.1 5.5 5.2 6.9 7.8 8.0 8.0 7.5 7.5 7.5 -in percent short-term debt 1/ 88.4 141.3 139.7 137.1 172.8 184.1 177.1 164.8 188.6 169.6 153.3External debt (percent of GDP) 2/ 30.5 27.8 25.2 25.2 27.8 29.8 32.4 34.6 35.8 36.6 37.2
Sources: Central Bank of Costa Rica; and Fund staff estimates.
1/ Public and private sector external debt on remaining maturity. Includes trade credit.2/ Includes public and private sector debt.
(In percent of GDP)
Table 2. Costa Rica: Balance of Payments
(In millions of U.S. dollars)
Projection

COSTA RICA
32 INTERNATIONAL MONETARY FUND
Est.2008 2009 2010 2011 2012 2013 2014 2015 2016 2017 2018
Revenue 2,490 2,363 2,617 2,869 3,147 3,510 3,890 4,264 4,684 5,156 5,670Tax revenue 2,409 2,262 2,492 2,767 3,028 3,380 3,747 4,107 4,512 4,967 5,462Nontax revenue 1/ 81 101 125 102 119 130 143 157 172 189 208
Expenditure 2,536 2,970 3,649 3,765 4,195 4,729 5,445 6,078 6,782 7,582 8,465Current noninterest 1,776 2,275 2,748 2,965 3,306 3,670 4,086 4,485 4,924 5,410 5,947
Wages 857 1,115 1,349 1,513 1,661 1,819 1,998 2,193 2,408 2,646 2,909Goods and services 88 106 121 136 159 199 218 240 263 289 318Transfers 832 1,054 1,278 1,316 1,486 1,652 1,869 2,052 2,253 2,475 2,721
Interest 2/ 415 393 452 497 527 628 814 994 1,202 1,456 1,721Capital 344 302 449 304 363 431 544 599 656 716 797
Primary balance 370 -213 -580 -400 -522 -590 -740 -820 -897 -970 -1,074Overall Balance -46 -606 -1,032 -896 -1,049 -1,218 -1,555 -1,814 -2,099 -2,426 -2,795
Total Financing 46 606 1,032 896 1,049 1,218 1,555 1,814 2,099 2,426 2,795External (net) -49 -186 247 -112 498 531 518 594 346 325 330Domestic (net) 95 793 785 1,008 551 687 1,037 1,220 1,753 2,101 2,465
Central government debt 3,891 4,587 5,562 6,382 7,904 8,923 10,180 11,995 14,140 16,619 19,472External 1,138 976 1,142 1,027 1,492 2,031 2,553 3,147 3,539 3,917 4,305Domestic 2,753 3,611 4,420 5,355 6,412 6,893 7,627 8,848 10,601 12,702 15,167
Revenue 15.9 14.0 13.7 13.9 13.9 14.1 14.3 14.2 14.2 14.3 14.3Tax revenue 15.3 13.4 13.1 13.4 13.3 13.6 13.7 13.7 13.7 13.7 13.8Nontax revenue 1/ 0.5 0.6 0.7 0.5 0.5 0.5 0.5 0.5 0.5 0.5 0.5
Expenditure 16.1 17.6 19.2 18.2 18.5 19.0 20.0 20.3 20.6 21.0 21.3Current noninterest 11.3 13.5 14.4 14.3 14.6 14.8 15.0 15.0 15.0 15.0 15.0
Wages 5.5 6.6 7.1 7.3 7.3 7.3 7.3 7.3 7.3 7.3 7.3Goods and services 0.6 0.6 0.6 0.7 0.7 0.8 0.8 0.8 0.8 0.8 0.8Transfers 5.3 6.3 6.7 6.4 6.6 6.7 6.9 6.9 6.9 6.9 6.9
Interest 2/ 2.6 2.3 2.4 2.4 2.3 2.5 3.0 3.3 3.7 4.0 4.3Capital 2.2 1.8 2.4 1.5 1.6 1.7 2.0 2.0 2.0 2.0 2.0
Primary balance 2.4 -1.3 -3.0 -1.9 -2.3 -2.4 -2.7 -2.7 -2.7 -2.7 -2.7Overall Balance -0.3 -3.6 -5.4 -4.3 -4.6 -4.9 -5.7 -6.1 -6.4 -6.7 -7.0
Total Financing 0.3 3.6 5.4 4.3 4.6 4.9 5.7 6.1 6.4 6.7 7.0External (net) -0.3 -1.1 1.3 -0.5 2.2 2.1 1.9 2.0 1.1 0.9 0.8Domestic (net) 0.6 4.7 4.1 4.9 2.4 2.8 3.8 4.1 5.3 5.8 6.2
Central government debt 24.8 27.2 29.2 30.9 34.8 35.9 37.3 40.0 43.0 46.0 49.0External 7.3 5.8 6.0 5.0 6.6 8.2 9.4 10.5 10.8 10.8 10.8Domestic 17.5 21.4 23.2 25.9 28.3 27.7 27.9 29.5 32.2 35.2 38.2
Memorandum items:Non-interest expenditure growth (percent) in nominal terms 31.9 21.5 24.1 2.2 12.3 11.8 12.9 9.8 9.8 9.8 10.1 in real terms 16.3 12.7 17.4 -2.5 7.4 6.8 7.5 4.6 4.5 4.6 4.8Cyclically-adjusted primary balance (percent of GDP) 1.7 -0.9 -2.3 -2.3 -2.2 -2.3 -2.7 -2.7 -2.7 -2.7 -2.7Fiscal impulse (percent of GDP) 1.1 2.6 1.4 0.0 -0.1 0.2 0.4 0.0 0.0 0.0 0.0
Sources: Ministry of Finance; and Fund staff estimates.1/ Transfers to the Social development and Family Transfers Fund (FODESAF) are recorded in net terms.2/ The inflation adjustment of the principal of TUDES (inflation indexed bonds) was recorded as interest expenditure.
Table 3. Costa Rica: Central Government Balance
(In billions of colones)
(In percent of GDP)
Projection

COSTA RICA
INTERNATIONAL MONETARY FUND 33
Est.2008 2009 2010 2011 2012 2013 2014 2015 2016 2017 2018
Revenue 2,490 2,363 2,617 2,869 3,147 3,510 3,890 4,264 4,684 5,156 5,670Taxes 2,409 2,262 2,492 2,767 3,028 3,380 3,747 4,107 4,512 4,967 5,462Other revenue 1/ 81 101 125 102 119 130 143 157 172 189 208
Expenditure 2,536 2,970 3,649 3,765 4,195 4,729 5,445 6,078 6,782 7,582 8,465 Expense 2,191 2,668 3,200 3,461 3,833 4,298 4,901 5,479 6,126 6,867 7,668
Compensation of employees 857 1,115 1,349 1,513 1,661 1,819 1,998 2,193 2,408 2,646 2,909Purchases of goods and services 88 106 121 136 159 199 218 240 263 289 318Interest 2/ 415 393 452 497 527 628 814 994 1,202 1,456 1,721 Of which: Adjustment for TUDES 75 33 50 47 58 64 69 76 88 106 127Social benefits 372 445 506 552 606 663 729 800 878 965 1,060Other expense 3/ 460 609 772 764 880 989 1,141 1,252 1,375 1,511 1,661
Net acquisition of nonfinancial assets 344 302 449 304 363 431 544 599 656 716 797
Gross operating balance 299 -305 -583 -593 -686 -788 -1,011 -1,215 -1,442 -1,711 -1,998Net lending/borrowing -46 -606 -1,032 -896 -1,049 -1,218 -1,555 -1,814 -2,099 -2,426 -2,795Net financial transactions 46 606 1,032 896 1,049 1,218 1,555 1,814 2,099 2,426 2,795
Revenue 15.9 14.0 13.7 13.9 13.9 14.1 14.3 14.2 14.2 14.3 14.3Tax revenue 15.3 13.4 13.1 13.4 13.3 13.6 13.7 13.7 13.7 13.7 13.8Nontax revenue 1/ 0.5 0.6 0.7 0.5 0.5 0.5 0.5 0.5 0.5 0.5 0.5
Expenditure 16.1 17.6 19.2 18.2 18.5 19.0 20.0 20.3 20.6 21.0 21.3 Expense 14.0 15.8 16.8 16.7 16.9 17.3 18.0 18.3 18.6 19.0 19.3
Compensation of employees 5.5 6.6 7.1 7.3 7.3 7.3 7.3 7.3 7.3 7.3 7.3Purchases of goods and services 0.6 0.6 0.6 0.7 0.7 0.8 0.8 0.8 0.8 0.8 0.8Interest 2/ 2.6 2.3 2.4 2.4 2.3 2.5 3.0 3.3 3.7 4.0 4.3 Of which: Adjustment for TUDES 0.5 0.2 0.3 0.2 0.3 0.3 0.3 0.3 0.3 0.3 0.3Social benefits 2.4 2.6 2.7 2.7 2.7 2.7 2.7 2.7 2.7 2.7 2.7Other expense 3/ 2.9 3.6 4.1 3.7 3.9 4.0 4.2 4.2 4.2 4.2 4.2
Net acquisition of nonfinancial assets 2.2 1.8 2.4 1.5 1.6 1.7 2.0 2.0 2.0 2.0 2.0
Gross operating balance 1.9 -1.8 -3.1 -2.9 -3.0 -3.2 -3.7 -4.1 -4.4 -4.7 -5.0Net lending/borrowing -0.3 -3.6 -5.4 -4.3 -4.6 -4.9 -5.7 -6.1 -6.4 -6.7 -7.0Net financial transactions 0.3 3.6 5.4 4.3 4.6 4.9 5.7 6.1 6.4 6.7 7.0
Memorandum items:Non-interest expenditure growth (percent) in nominal terms 31.9 21.5 24.1 2.2 12.3 11.8 12.9 9.8 9.8 9.8 10.1 in real terms 16.3 12.7 17.4 -2.5 7.4 6.8 7.5 4.6 4.5 4.6 4.8Primary balance in billions of colones 370 -213 -580 -400 -522 -590 -740 -820 -897 -970 -1,074 in percent of GDP 2.4 -1.3 -3.0 -1.9 -2.3 -2.4 -2.7 -2.7 -2.7 -2.7 -2.7Cyclically-adjusted primary balance (percent of GDP) 1.7 -0.9 -2.3 -2.3 -2.2 -2.3 -2.7 -2.7 -2.7 -2.7 -2.7Fiscal impulse (percent of GDP) 1.1 2.6 1.4 0.0 -0.1 0.2 0.4 0.0 0.0 0.0 0.0
Sources: Ministry of Finance; and Fund staff estimates.1/ Transfers to the Social development and Family Transfers Fund (FODESAF) are recorded in net terms.2/ The inflation adjustment of the principal of TUDES (inflation indexed bonds) was recorded as interest expenditure.3/ Includes subsidies, transfers and other expense.
Table 4. Costa Rica: Summary Operations of the Central Government, GFSM 2001 Classification
Projection
(In billions of colones)
(In percent of GDP)

COSTA RICA
34 INTERNATIONAL MONETARY FUND
Est.2008 2009 2010 2011 2012 2013 2014 2015 2016 2017 2018
Nonfinancial public sector:Revenue 3,700 3,808 4,258 4,640 5,084 5,632 6,221 6,822 7,492 8,242 9,043
Tax revenue 2,437 2,289 2,526 2,798 3,062 3,418 3,788 4,152 4,561 5,021 5,502Nontax revenue 161 218 185 269 295 323 355 389 428 470 516Social security contributions 1,057 1,227 1,412 1,532 1,682 1,842 2,023 2,221 2,438 2,679 2,945Operating balance of public enterprises 46 75 134 41 45 50 55 60 66 72 79
Expenditure 2/ 3,640 4,343 5,209 5,410 5,928 6,655 7,623 8,496 9,414 10,485 11,630Current noninterest 2,755 3,469 4,138 4,391 4,853 5,384 5,969 6,551 7,193 7,904 8,688
Wages 1,201 1,545 1,885 2,051 2,251 2,465 2,708 2,972 3,263 3,586 3,941Goods and services 355 387 414 446 499 571 628 689 756 831 914Transfers 1,199 1,537 1,840 1,894 2,103 2,348 2,634 2,890 3,174 3,487 3,833
Interest 3/ 383 381 432 509 563 662 861 1,050 1,261 1,517 1,778Of which: Adjustment for TUDES 3/ 41 18 28 26 32 35 38 42 49 58 70
Capital 503 493 638 510 513 608 792 895 959 1,065 1,164
Primary balance 443 -154 -519 -260 -281 -360 -541 -624 -660 -726 -809Overall Balance 60 -535 -951 -769 -844 -1,022 -1,402 -1,674 -1,921 -2,243 -2,587 Central government -46 -606 -1,032 -896 -1,049 -1,218 -1,555 -1,814 -2,099 -2,426 -2,795 Decentralized government entities 101 73 50 131 190 235 261 274 299 323 377 Public enterprises 4 -2 31 -4 14 -41 -109 -134 -120 -140 -170
Total Financing -60 535 951 769 844 1,022 1,402 1,674 1,921 2,243 2,587External -54 -188 243 4 477 533 532 608 360 342 347Domestic -6 723 708 765 367 490 870 1,066 1,561 1,901 2,241
Consolidated public sector:Central Bank balance -29 -138 -88 -126 -142 -182 -203 -225 -257 -308 -355Consolidated public sector balance 1/ 31 -673 -1,039 -896 -987 -1,205 -1,605 -1,899 -2,177 -2,551 -2,942
Consolidated public sector debt 1/ 4,292 4,925 5,824 6,862 8,650 9,822 11,237 13,064 15,060 17,320 19,903
Nonfinancial public sector:Revenue 23.6 22.6 22.4 22.5 22.4 22.7 22.8 22.8 22.8 22.8 22.8
Tax revenue 15.5 13.6 13.3 13.5 13.5 13.8 13.9 13.9 13.9 13.9 13.9Nontax revenue 1.0 1.3 1.0 1.3 1.3 1.3 1.3 1.3 1.3 1.3 1.3Social security contributions 6.7 7.3 7.4 7.4 7.4 7.4 7.4 7.4 7.4 7.4 7.4Operating balance of public enterprises 0.3 0.4 0.7 0.2 0.2 0.2 0.2 0.2 0.2 0.2 0.2
Expenditure 2/ 23.2 25.8 27.4 26.2 26.1 26.8 27.9 28.4 28.6 29.0 29.3Current noninterest 17.5 20.6 21.7 21.2 21.4 21.7 21.9 21.9 21.9 21.9 21.9
Wages 7.6 9.2 9.9 9.9 9.9 9.9 9.9 9.9 9.9 9.9 9.9Goods and services 2.3 2.3 2.2 2.2 2.2 2.3 2.3 2.3 2.3 2.3 2.3Transfers 7.6 9.1 9.7 9.2 9.3 9.5 9.7 9.7 9.7 9.7 9.7
Interest 3/ 2.4 2.3 2.3 2.5 2.5 2.7 3.2 3.5 3.8 4.2 4.5Of which: Adjustment for TUDES 3/ 0.3 0.1 0.1 0.1 0.1 0.1 0.1 0.1 0.1 0.2 0.2
Capital 3.2 2.9 3.4 2.5 2.3 2.4 2.9 3.0 2.9 2.9 2.9
Primary balance 2.8 -0.9 -2.7 -1.3 -1.2 -1.4 -2.0 -2.1 -2.0 -2.0 -2.0Overall Balance 0.4 -3.2 -5.0 -3.7 -3.7 -4.1 -5.1 -5.6 -5.8 -6.2 -6.5 Central government -0.3 -3.6 -5.4 -4.3 -4.6 -4.9 -5.7 -6.1 -6.4 -6.7 -7.0 Decentralized government entities 0.6 0.4 0.3 0.6 0.8 0.9 1.0 0.9 0.9 0.9 0.9 Public enterprises 0.0 0.0 0.2 0.0 0.1 -0.2 -0.4 -0.4 -0.4 -0.4 -0.4
Total Financing -0.4 3.2 5.0 3.7 3.7 4.1 5.1 5.6 5.8 6.2 6.5External -0.3 -1.1 1.3 0.0 2.1 2.1 1.9 2.0 1.1 0.9 0.9Domestic 0.0 4.3 3.7 3.7 1.6 2.0 3.2 3.6 4.7 5.3 5.6
Consolidated public sector:Central Bank balance -0.2 -0.8 -0.5 -0.6 -0.6 -0.7 -0.7 -0.8 -0.8 -0.9 -0.9Consolidated public sector balance 1/ 0.2 -4.0 -5.5 -4.3 -4.4 -4.9 -5.9 -6.3 -6.6 -7.1 -7.4
Consolidated public sector debt 1/ 27.3 29.2 30.6 33.2 38.1 39.5 41.2 43.6 45.8 47.9 50.1Consolidated public sector debt, including ICE 30.8 33.3 34.0 36.6 41.2 42.7 44.4 46.8 49.0 50.9 52.8
Sources: Ministry of Finance; and Fund staff estimates.1/ The consolidated public sector balance comprises the central government, decentralized government entities, public enterprises and the Central Bank, but excludes the Instituto Costarricense de Electricidad (ICE).2/ Expenditure was adjusted downward in 2010 and upward in 2011 by ½ percent of GDP to reflect a capital project recorded in 2010 but undertaken in 2011.3/ The inflation adjustment of the principal of TUDES (inflation indexed bonds) was recorded as interest expenditure.
(In billions of colones)
(In percent of GDP)
Projection
Table 5. Costa Rica: Consolidated Public Sector Operations 1/

COSTA RICA
INTERNATIONAL MONETARY FUND 35
Est.2008 2009 2010 2011 2012 2013 2014 2015 2016 2017 2018
Nonfinancial public sector:Revenue 3,700 3,808 4,258 4,640 5,084 5,632 6,221 6,822 7,492 8,242 9,043
Taxes 2,437 2,289 2,526 2,798 3,062 3,418 3,788 4,152 4,561 5,021 5,502Social contributions 1,057 1,227 1,412 1,532 1,682 1,842 2,023 2,221 2,438 2,679 2,945Operating balance of public enterprises 46 75 134 41 45 50 55 60 66 72 79Other revenue 161 218 185 269 295 323 355 389 428 470 516
Expenditure 3,640 4,343 5,209 5,410 5,928 6,655 7,623 8,496 9,414 10,485 11,630 Expense 3,138 3,850 4,571 4,899 5,415 6,046 6,830 7,601 8,454 9,420 10,466
Compensation of employees 1,201 1,545 1,885 2,051 2,251 2,465 2,708 2,972 3,263 3,586 3,941Purchases of goods and services 355 387 414 446 499 571 628 689 756 831 914Interest 2/ 383 381 432 509 563 662 861 1,050 1,261 1,517 1,778 Of which: Adjustment for TUDES 41 18 28 26 32 35 38 42 49 58 70Other expense 3/ 1,199 1,537 1,840 1,894 2,103 2,348 2,634 2,890 3,174 3,487 3,833
Net acquisition of nonfinancial assets 503 493 638 510 513 608 792 895 959 1,065 1,164
Gross operating balance 563 -42 -313 -259 -331 -414 -610 -779 -962 -1,178 -1,424Net lending/borrowing (NFPS) 60 -535 -951 -769 -844 -1,022 -1,402 -1,674 -1,921 -2,243 -2,587Net financial transactions (NFPS) -60 535 951 769 844 1,022 1,402 1,674 1,921 2,243 2,587
Consolidated public sector: 1/Central Bank balance -29 -138 -88 -126 -142 -182 -203 -225 -257 -308 -355Net lending/borrowing (consolidated public sector) 31 -673 -1,039 -896 -987 -1,205 -1,605 -1,899 -2,177 -2,551 -2,942
Nonfinancial public sector:Revenue 23.6 22.6 22.4 22.5 22.4 22.7 22.8 22.8 22.8 22.8 22.8
Taxes 15.5 13.6 13.3 13.5 13.5 13.8 13.9 13.9 13.9 13.9 13.9Social contributions 6.7 7.3 7.4 7.4 7.4 7.4 7.4 7.4 7.4 7.4 7.4Operating balance of public enterprises 0.3 0.4 0.7 0.2 0.2 0.2 0.2 0.2 0.2 0.2 0.2Other revenue 1.0 1.3 1.0 1.3 1.3 1.3 1.3 1.3 1.3 1.3 1.3
Expenditure 23.2 25.8 27.4 26.2 26.1 26.8 27.9 28.4 28.6 29.0 29.3 Expense 20.0 22.9 24.0 23.7 23.9 24.3 25.0 25.4 25.7 26.1 26.4
Compensation of employees 7.6 9.2 9.9 9.9 9.9 9.9 9.9 9.9 9.9 9.9 9.9Purchases of goods and services 2.3 2.3 2.2 2.2 2.2 2.3 2.3 2.3 2.3 2.3 2.3Interest 2/ 2.4 2.3 2.3 2.5 2.5 2.7 3.2 3.5 3.8 4.2 4.5Other expense 3/ 7.6 9.1 9.7 9.2 9.3 9.5 9.7 9.7 9.7 9.7 9.7
Net acquisition of nonfinancial assets 3.2 2.9 3.4 2.5 2.3 2.4 2.9 3.0 2.9 2.9 2.9
Gross operating balance 3.6 -0.2 -1.6 -1.3 -1.5 -1.7 -2.2 -2.6 -2.9 -3.3 -3.6Net lending/borrowing (NFPS) 0.4 -3.2 -5.0 -3.7 -3.7 -4.1 -5.1 -5.6 -5.8 -6.2 -6.5Net financial transactions (NFPS) -0.4 3.2 5.0 3.7 3.7 4.1 5.1 5.6 5.8 6.2 6.5
Consolidated public sector: 1/Central Bank balance -0.2 -0.8 -0.5 -0.6 -0.6 -0.7 -0.7 -0.8 -0.8 -0.9 -0.9Net lending/borrowing (consolidated public sector) 0.2 -4.0 -5.5 -4.3 -4.4 -4.9 -5.9 -6.3 -6.6 -7.1 -7.4
Memorandum items:NFPS non-interest expenditure growth (percent) in nominal terms 29.9 21.6 20.6 2.6 9.5 11.7 12.8 10.1 9.5 10.0 9.8 in real terms 14.6 12.8 14.1 -2.2 4.8 6.7 7.5 4.9 4.3 4.8 4.6NFPS primary balance in billions of colones 443 -154 -519 -260 -281 -360 -541 -624 -660 -726 -809 in percent of GDP 2.8 -0.9 -2.7 -1.3 -1.2 -1.4 -2.0 -2.1 -2.0 -2.0 -2.0
Sources: Ministry of Finance; and Fund staff estimates.1/ The consolidated public sector balance comprises the central government, decentralized government entities, public enterprises and the Central Bank, but excludes the Instituto Costarricense de Electricidad (ICE).2/ The inflation adjustment of the principal of TUDES (inflation indexed bonds) was recorded as interest expenditure.3/ Includes subsidies, transfers and other expense.
Table 6. Costa Rica: Summary Operations of the Consolidated Public Sector, GFSM 2001 Classification 1/
Projection
(In billions of colones)
(In percent of GDP)

COSTA RICA
36 INTERNATIONAL MONETARY FUND
Est.2008 2009 2010 2011 2012 2013 2014 2015 2016 2017 2018
Debt issued by:NFPS & Central Bank (I) 1/ 5,659 6,443 7,574 8,961 10,964 12,398 14,107 16,244 18,574 21,194 24,191 Nonfinancial public sector (NFPS) 1/ 4,137 5,018 6,168 7,248 8,792 9,864 11,185 13,063 15,277 17,827 20,752 Central government 3,891 4,587 5,562 6,382 7,904 8,923 10,180 11,995 14,140 16,619 19,472 Rest of nonfinancial public sector 1/ 246 431 605 866 888 940 1,005 1,069 1,137 1,208 1,280 Central Bank 1,522 1,425 1,406 1,713 2,173 2,534 2,922 3,180 3,298 3,368 3,439
Intra-public sector debt holdings (II) 1,367 1,519 1,750 2,099 2,315 2,576 2,870 3,179 3,515 3,875 4,288 CCSS 2/ 889 987 1,130 1,330 1,471 1,653 1,856 2,066 2,292 2,531 2,811 Other entities of the nonfinancial public sector 458 514 604 756 829 908 998 1,095 1,203 1,321 1,452 Central Bank 20 18 15 13 14 15 17 18 20 22 25
Consolidated public sector debt (I-II) 4,292 4,925 5,824 6,862 8,650 9,822 11,237 13,064 15,060 17,320 19,903 External 1,353 1,207 1,363 1,330 1,763 2,300 2,832 3,436 3,843 4,241 4,651 Domestic 2,939 3,717 4,461 5,532 6,887 7,522 8,405 9,628 11,217 13,079 15,252
Debt issued by:NFPS & Central Bank (I) 1/ 36.0 38.3 39.8 43.4 48.3 49.9 51.7 54.2 56.5 58.7 60.9 Nonfinancial public sector (NFPS) 1/ 26.3 29.8 32.4 35.1 38.8 39.7 41.0 43.6 46.5 49.3 52.2 Central government 24.8 27.2 29.2 30.9 34.8 35.9 37.3 40.0 43.0 46.0 49.0 Rest of nonfinancial public sector 1/ 1.6 2.6 3.2 4.2 3.9 3.8 3.7 3.6 3.5 3.3 3.2 Central Bank 9.7 8.5 7.4 8.3 9.6 10.2 10.7 10.6 10.0 9.3 8.7
Intra-public sector debt holdings (II) 8.7 9.0 9.2 10.2 10.2 10.4 10.5 10.6 10.7 10.7 10.8 CCSS 5.7 5.9 5.9 6.4 6.5 6.7 6.8 6.9 7.0 7.0 7.1 Other entities of the nonfinancial public sector 2.9 3.1 3.2 3.7 3.7 3.7 3.7 3.7 3.7 3.7 3.7 Central Bank 0.1 0.1 0.1 0.1 0.1 0.1 0.1 0.1 0.1 0.1 0.1
Consolidated public sector debt (I-II) 27.3 29.2 30.6 33.2 38.1 39.5 41.2 43.6 45.8 47.9 50.1 External 8.6 7.2 7.2 6.4 7.8 9.3 10.4 11.5 11.7 11.7 11.7 Domestic 18.7 22.1 23.4 26.8 30.4 30.3 30.8 32.1 34.1 36.2 38.4
Memorandum items:Debt issued by ICE 3.4 4.1 3.4 3.4 3.1 3.2 3.2 3.2 3.2 3.0 2.7Consolidated public sector debt including ICE 30.8 33.3 34.0 36.6 41.2 42.7 44.4 46.8 49.0 50.9 52.8
Sources: Ministry of Finance; and Fund staff estimates.1/ Excludes the debt issued by the Instituto Costarricense de Electricidad (ICE).2/ Caja Costarricense del Seguro Social (social security agency).
(In billions of colones)
(In percent of GDP)
Projection
Table 7. Costa Rica: Public Sector Debt

COSTA RICA
INTERNATIONAL MONETARY FUND 37
Est.2008 2009 2010 2011 2012 2013 2014
Central BankNet foreign assets 2,178 2,413 2,485 2,567 3,637 4,376 4,896
Net international reserves 2,090 2,272 2,350 2,403 3,469 4,198 4,715(In millions of U.S. dollars) 3,799 4,066 4,627 4,756 6,857 8,357 9,357
Net medium-term foreign assets 89 141 135 164 167 178 182
Net domestic assets -1,027 -1,203 -1,140 -1,067 -1,984 -2,560 -2,903Net domestic credit -547 -790 -926 -729 -1,275 -1,173 -1,368Monetary stabilization instruments (-) -1,513 -1,414 -1,407 -1,812 -2,155 -2,520 -2,912Other items (net) -186 -265 -153 -3 -174 -668 -627Capital account (-) 1,219 1,266 1,346 1,477 1,619 1,801 2,004
Monetary base 1,151 1,210 1,345 1,500 1,653 1,816 1,993Currency 575 613 665 743 812 887 966Required reserves 576 597 680 757 840 929 1,028
Other Depository InstitutionsNet foreign assets -420 -20 -87 -580 -920 -1,018 -1,119Net domestic assets 7,840 8,325 8,389 9,287 10,393 11,389 12,511
Net domestic credit 10,160 11,194 11,897 13,206 15,038 16,754 18,706Credit to nonfinancial public sector (net) 412 693 980 1,001 1,145 1,244 1,505Credit to nonfinancial private sector 7,925 8,281 8,645 9,832 11,079 12,471 13,883Credit to financial corporations (net) 1,823 2,221 2,273 2,373 2,813 3,039 3,319
Other items (net) -722 -1,039 -1,473 -1,625 -2,200 -2,608 -3,138Capital account 1,597 1,829 2,036 2,294 2,445 2,757 3,056
Liabilities to nonfinancial private sector 7,420 8,305 8,301 8,707 9,473 10,370 11,392In national currency 4,080 4,461 4,911 5,171 5,932 6,554 7,198In foreign currency 3,341 3,844 3,390 3,536 3,541 3,878 4,288
Of which: Deposits 7,255 8,111 8,096 8,470 9,239 10,115 11,138
Consolidated Financial SystemNet foreign assets 1,758 2,393 2,398 1,988 2,717 3,358 3,777
Net domestic assets 7,059 7,282 7,393 8,426 8,853 9,564 10,638Net domestic credit 8,317 8,923 9,336 10,746 11,706 13,873 15,679Other items (net) -879 -1,077 -1,253 -1,503 -2,027 -3,353 -3,989Capital account 378 564 690 817 826 956 1,052
Broad money 8,818 9,675 9,791 10,414 11,570 12,922 14,415
Memorandum Items:Monetary base 11.9 5.1 11.2 11.6 10.1 9.9 9.8Broad money 16.1 9.7 1.2 6.4 11.1 11.7 11.6 Adjusted by changes in the exchange rate 10.2 13.4 5.5 2.8 12.0 10.6 11.6Credit to the private sector 31.8 4.5 4.4 13.7 12.7 12.6 11.3 Adjusted by changes in the exchange rate 23.7 8.7 9.3 9.5 13.8 11.1 11.4
Monetary base 7.3 7.2 7.1 7.3 7.3 7.3 7.3Broad money 56.2 57.4 51.4 50.4 51.0 52.0 52.8 Of which: Deposits denominated in foreign currency 21.3 22.8 17.8 17.1 15.6 15.6 15.7Credit to the private sector 50.5 49.2 45.4 47.6 48.8 50.2 50.9 Of which: In foreign currency 22.4 20.9 17.5 18.7 19.6 20.5 20.7Central bank balance -0.2 -0.3 -0.4 -0.6 -0.6 -0.7 -0.7
Sources: Central bank of Costa Rica; and Fund staff estimates.
(In billions of colones, unless otherwise indicated)
Table 8. Costa Rica: Monetary Survey
Projection
(Annual percentage change)
(In percent of GDP)

COSTA RICA
38 INTERNATIONAL MONETARY FUND
Est.2008 2009 2010 2011 2012 2013 2014 2015 2016 2017 2018
Real GDP 2.7 -1.0 4.7 4.2 5.0 4.2 4.4 4.5 4.5 4.5 4.5Domestic demand 7.7 -8.1 9.1 6.1 5.5 4.5 5.0 5.0 5.0 4.9 4.9 Consumption 3.5 2.3 4.6 4.2 4.4 4.1 4.1 4.2 4.2 4.3 4.3 Gross fixed capital formation 11.0 -11.1 4.1 8.3 7.1 6.7 10.1 7.6 6.5 7.0 6.7Exports of goods and nonfactor services -2.0 -6.0 4.9 6.7 8.8 5.3 6.3 5.8 5.8 5.7 4.7Imports of goods and nonfactor services 6.5 -18.9 14.0 10.6 9.9 5.8 7.4 6.6 6.7 6.4 5.3
Domestic demand 7.4 -8.1 8.4 5.9 5.4 4.4 5.0 5.0 5.0 4.9 4.9 Consumption 2.5 1.6 3.4 3.1 3.3 3.0 3.0 3.1 3.1 3.1 3.1 Gross fixed capital formation 2.5 -2.7 0.9 1.8 1.6 1.5 2.4 1.9 1.7 1.8 1.8 Inventory changes 2.3 -7.0 4.1 0.9 0.6 -0.1 -0.4 0.0 0.2 0.0 0.0Net exports -4.6 7.1 -3.7 -1.7 -0.4 -0.2 -0.6 -0.5 -0.5 -0.4 -0.4
Savings and InvestmentSavings 27.6 16.3 20.1 20.6 20.8 20.5 20.7 20.9 21.1 21.3 21.5
Domestic savings 18.2 14.3 16.6 15.3 15.3 15.1 15.2 15.3 15.3 15.3 15.6External savings 1/ 9.3 2.0 3.5 5.3 5.5 5.4 5.5 5.7 5.8 6.0 6.0
Gross domestic investment 27.6 16.3 20.1 20.6 20.8 20.5 20.7 20.9 21.1 21.3 21.5Private sector 19.6 18.4 16.4 16.3 16.5 16.4 16.4 16.5 16.7 17.0 17.2Public sector 4.0 3.6 3.5 3.4 3.1 3.0 3.6 3.7 3.6 3.6 3.6Inventory changes 4.0 -5.8 0.2 1.0 1.2 1.1 0.8 0.7 0.8 0.7 0.7
Balance of payments Current account balance -9.3 -2.0 -3.5 -5.3 -5.5 -5.4 -5.5 -5.7 -5.8 -6.0 -6.0
Trade balance -16.8 -6.9 -9.5 -12.6 -12.6 -12.3 -12.3 -12.3 -12.2 -12.1 -11.9Services 7.4 7.4 7.0 7.9 8.2 8.3 8.2 8.1 8.0 7.8 7.7Income -1.4 -3.7 -2.1 -1.4 -1.9 -2.0 -2.1 -2.2 -2.3 -2.4 -2.3Current transfers 1.5 1.2 1.0 0.8 0.8 0.7 0.7 0.7 0.8 0.7 0.6
Financial and capital account 8.3 1.7 5.5 6.3 10.1 8.4 7.4 7.0 6.1 6.1 6.0Public sector 0.0 1.0 1.7 0.1 1.8 2.0 1.8 1.7 1.0 1.0 0.9Private sector 8.3 0.7 3.8 6.1 8.3 6.4 5.5 5.3 5.1 5.1 5.1 Foreign direct investment 6.9 4.6 4.0 5.1 5.0 4.8 4.5 4.3 4.2 4.2 4.3 Other net private flows 1.4 -3.9 -0.2 1.0 3.3 1.6 1.0 1.0 1.0 0.8 0.8
Errors and omissions -0.2 0.4 -0.4 -0.6 0.0 0.0 0.0 0.0 0.0 0.0 0.0Change in net international reserves (increase -) 1.2 -0.2 -1.5 -0.3 -4.7 -3.0 -1.8 -1.3 -0.3 -0.1 -0.1
Memorandum items:Nominal GDP (billions of colones) 15,702 16,845 19,044 20,666 22,683 24,841 27,290 29,952 32,885 36,134 39,719GDP deflator (percent change) 12.4 8.4 8.0 4.1 4.5 5.1 5.2 5.0 5.1 5.1 5.2Consumer prices (percent change; period average) 13.4 7.8 5.7 4.9 4.5 4.7 5.0 5.0 5.0 5.0 5.0Consumer prices (percent change; end of period) 13.9 4.0 5.8 4.7 4.6 5.0 5.0 5.0 5.0 5.0 5.0Net international reserves (millions of U.S. dollars) 3,799 4,066 4,627 4,756 6,857 8,357 9,357 10,157 10,357 10,407 10,457
Sources: Central Bank of Costa Rica; and Fund staff estimates.1/ External current account deficit.
(In percent of GDP)
Projection
(Annual percentage change)
Table 9. Costa Rica: Medium-Term Framework
(Contributions to real GDP growth)

COSTA RICA
INTERNATIONAL MONETARY FUND 39
Dec Dec Dec Dec Nov
CapitalizationRisk-adjusted capital ratio 15.1 16.0 17.3 17.3 17.2Capital-to-assets ratio 13.3 13.9 14.8 15.0 15.1
Asset qualityNonperforming loans to total loans 1.5 2.0 1.8 1.7 1.7Non-income generating assets to total assets 18.2 18.6 17.4 17.7 17.2Foreclosed assets to total assets 0.3 0.6 0.8 0.8 1.0Loan loss provisions to total loans 1.8 1.9 1.8 1.8 1.7
ManagementAdministrative expenses to total assets 4.4 4.1 4.3 4.2 4.2Noninterest expenses to gross income 79.3 76.8 85.0 76.5 68.9Total expenses to total revenues 92.5 95.2 96.2 93.1 91.0
ProfitabilityReturn on assets (ROA) 1.8 1.1 1.2 1.3 1.5Return on equity (ROE) 14.3 8.7 8.3 9.1 10.3Interest margin to gross income 20.8 20.7 16.6 27.2 31.3
LiquidityLiquid assets to total short-term liabilities 83.0 93.4 90.1 85.1 92.4Liquid assets to total assets 27.7 30.6 30.7 28.8 28.9Loans to deposits 109.7 98.9 97.8 105.2 106.4Liquid assets to deposits 42.1 43.9 43.8 42.7 43.4
Sensitivity to market riskNet open FX position to capital 20.4 25.4 18.8 18.8 19.1
OtherFinancial margin 1/ 7.9 7.7 8.2 8.1 7.8
Source: Superintendency of Banks (SUGEF).1/ Difference between implicit loan and deposit rates.
2012
Table 10. Costa Rica: Banking Sector Indicators
(In percent)
2008 2009 2010 2011

COSTA RICA
40 INTERNATIONAL MONETARY FUND
Est.2008 2009 2010 2011 2012 2013 2014 2015 2016 2017 2018
Real GDP 2.7 -1.0 4.7 4.2 5.0 4.2 4.0 3.8 4.2 4.5 4.5
Savings and InvestmentSavings 27.6 16.3 20.1 20.6 20.8 20.5 20.2 20.3 20.6 20.7 20.9
Domestic savings 18.2 14.3 16.6 15.3 15.3 15.0 15.4 15.5 15.6 15.8 16.0External savings 1/ 9.3 2.0 3.5 5.3 5.5 5.5 4.9 4.8 4.9 4.9 4.8
Gross domestic investment 27.6 16.3 20.1 20.6 20.8 20.5 20.2 20.3 20.6 20.7 20.9Private sector 19.6 18.4 16.4 16.3 16.5 16.4 16.4 16.5 16.7 16.9 17.1Public sector 4.0 3.6 3.5 3.4 3.1 3.0 3.6 3.7 3.6 3.7 3.7Inventory changes 4.0 -5.8 0.2 1.0 1.2 1.1 0.3 0.1 0.2 0.1 0.1
Public FinancesCentral government primary balance 2.4 -1.3 -3.0 -1.9 -2.3 -2.3 -1.8 -0.2 -0.1 0.0 0.1Central government overall balance -0.3 -3.6 -5.4 -4.3 -4.6 -4.8 -4.8 -3.5 -3.4 -3.3 -3.1Central government debt 24.8 27.2 29.2 30.9 34.8 35.9 36.6 37.2 37.6 37.7 37.6
Consolidated public sector overall balance 0.2 -4.0 -5.5 -4.3 -4.4 -4.8 -5.0 -3.8 -3.6 -3.5 -3.3Consolidated public sector debt 27.3 29.2 30.6 33.2 38.1 39.5 40.5 40.7 40.3 39.4 38.4
Balance of payments Current account balance -9.3 -2.0 -3.5 -5.3 -5.5 -5.5 -4.9 -4.8 -4.9 -4.9 -4.8
Trade balance -16.8 -6.9 -9.5 -12.6 -12.6 -12.6 -12.0 -12.1 -12.4 -12.5 -12.5Services 7.4 7.4 7.0 7.9 8.2 8.4 8.6 8.8 9.0 9.1 9.2Income -1.4 -3.7 -2.1 -1.4 -1.9 -2.0 -2.1 -2.3 -2.3 -2.4 -2.4Current transfers 1.5 1.2 1.0 0.8 0.8 0.7 0.7 0.8 0.9 0.8 0.8
Financial and capital account 8.3 1.7 5.5 6.3 10.1 8.5 6.3 5.8 5.2 5.0 4.9Public sector 0.0 1.0 1.7 0.1 1.8 2.0 1.7 1.3 0.7 0.3 0.2Private sector 8.3 0.7 3.8 6.1 8.3 6.5 4.6 4.5 4.5 4.7 4.7 Foreign direct investment 6.9 4.6 4.0 5.1 5.0 4.8 4.5 4.5 4.5 4.6 4.7 Other net private flows 1.4 -3.9 -0.2 1.0 3.3 1.8 0.2 0.1 0.1 0.1 0.0
Errors and omissions -0.2 0.4 -0.4 -0.6 0.0 0.0 0.0 0.0 0.0 0.0 0.0Change in net international reserves (increase -) 1.2 -0.2 -1.5 -0.3 -4.7 -3.0 -1.5 -1.0 -0.3 -0.1 -0.1
Memorandum items:Nominal GDP (billions of colones) 15,702 16,845 19,044 20,666 22,683 24,818 27,126 29,510 32,213 35,239 38,537GDP deflator (percent change) 12.4 8.4 8.0 4.1 4.5 5.0 5.1 4.8 4.8 4.7 4.7Consumer prices (percent change; period average) 13.4 7.8 5.7 4.9 4.5 4.7 5.1 5.1 4.7 4.2 4.0Consumer prices (percent change; end of period) 13.9 4.0 5.8 4.7 4.6 5.0 5.3 5.0 4.5 4.0 4.0Net international reserves (millions of U.S. dollars) 3,799 4,066 4,627 4,756 6,857 8,357 9,157 9,757 9,957 10,007 10,057
Sources: Central Bank of Costa Rica; and Fund staff estimates.1/ External current account deficit.
(In percent of GDP)
Projection
(Annual percentage change)
Table 11. Costa Rica: Medium-Term Framework Under Fiscal Consolidation Scenario

COSTA RICA
INTERNATIONAL MONETARY FUND 41
Est. Projections2010 2011 2012 2013 2014 2015 2016 2017 2018
Debt-stabilizingprimary
balance 7/Public sector debt 1/ 29.2 30.9 34.8 35.9 37.3 40.0 43.0 46.0 49.0 0.4
o/w foreign-currency denominated 9.9 9.2 11.1 12.6 13.8 15.2 15.9 16.5 16.9
Change in public sector debt 2.0 1.7 4.0 1.1 1.4 2.7 3.0 3.0 3.0Identified debt-creating flows (4+7+12) 2.7 1.0 4.0 1.1 1.4 2.7 2.9 3.0 3.0
Primary deficit 3.0 1.9 2.3 2.4 2.7 2.7 2.7 2.7 2.7Revenue and grants 13.7 13.9 13.9 14.1 14.3 14.2 14.2 14.3 14.3Primary (noninterest) expenditure 16.8 15.8 16.2 16.5 17.0 17.0 17.0 17.0 17.0
Automatic debt dynamics 2/ -1.6 0.1 -0.6 -0.5 -0.2 0.0 0.2 0.3 0.3Contribution from interest rate/growth differential 3/ -0.8 0.1 -0.4 -0.5 -0.2 0.0 0.1 0.2 0.2
Of which contribution from real interest rate 0.4 1.2 1.0 0.8 1.2 1.5 1.7 1.9 2.1Of which contribution from real GDP growth -1.1 -1.1 -1.4 -1.3 -1.4 -1.5 -1.6 -1.8 -1.9
Contribution from exchange rate depreciation 4/ -0.8 0.0 -0.1 … … … … … …Other identified debt-creating flows 1.2 -1.1 2.2 -0.8 -1.1 0.0 0.0 0.0 0.0
Privatization receipts (negative) 0.0 0.0 0.0 0.0 0.0 0.0 0.0 0.0 0.0Recognition of implicit or contingent liabilities 0.0 0.0 0.0 0.0 0.0 0.0 0.0 0.0 0.0Change in government deposits 1.2 -1.1 2.2 -0.8 -1.1 0.0 0.0 0.0 0.0
Residual, including asset changes (2-3) -0.7 0.7 0.0 0.0 0.0 0.0 0.0 0.0 0.0
Public sector debt-to-revenue ratio 1/ 212.6 222.5 251.2 254.2 261.7 281.3 301.9 322.3 343.4
Gross financing need 5/ 16.0 16.0 10.2 7.5 8.1 8.6 8.7 7.5 7.8in billions of U.S. dollars 5.8 6.5 4.6 3.7 4.4 5.2 5.7 5.3 6.0
ProjectedKey Macroeconomic and Fiscal Assumptions Average
Real GDP growth (in percent) 4.7 4.2 5.0 4.2 4.4 4.5 4.5 4.5 4.5 4.5Average nominal interest rate on public debt (in percent) 6/ 9.9 8.9 8.3 7.9 9.1 9.8 10.0 10.3 10.4 9.9Average real interest rate (nominal rate minus change in GDP deflator, in percent) 1.8 4.8 3.7 2.9 3.9 4.7 5.0 5.2 5.2 4.8Nominal appreciation (increase in US dollar value of local currency, in percent) 10.2 0.2 2.8 -0.4 -0.2 0.0 -1.4 -1.4 -1.4 -0.9Inflation rate (GDP deflator, in percent) 8.0 4.1 4.5 5.1 5.2 5.0 5.1 5.1 5.2 5.1Growth of real primary spending (deflated by GDP deflator, in percent) 14.9 -1.8 7.4 6.3 7.3 4.5 4.5 4.4 4.7 5.1Primary deficit 3.0 1.9 2.3 2.4 2.7 2.7 2.7 2.7 2.7 2.7
Source:1/ Central government debt.2/ Derived as [(r - p(1+g) - g + ae(1+r)]/(1+g+p+gp)) times previous period debt ratio, with r = interest rate; p = growth rate of GDP deflator; g = real GDP growth rate;
a = share of foreign-currency denominated debt; and e = nominal exchange rate depreciation (measured by increase in local currency value of U.S. dollar).3/ The real interest rate contribution is derived from the denominator in footnote 2/ as r - π (1+g) and the real growth contribution as -g.4/ The exchange rate contribution is derived from the numerator in footnote 2/ as ae(1+r). 5/ Defined as public sector deficit, plus amortization of medium and long-term public sector debt, plus short-term debt at end of previous period. 6/ Derived as nominal interest expenditure divided by previous period debt stock.7/ Assumes that key variables (real GDP growth, real interest rate, and other identified debt-creating flows) remain at the level of the last projection year.
I. Baseline Projections
Table 12. Costa Rica: Central Government Debt Sustainability Framework, 2010-2018
Actual
(In percent of GDP, unless otherwise indicated)

COSTA RICA
42 INTERNATIONAL MONETARY FUND
Growth shock
58
Baseline
49
20
25
30
35
40
45
50
55
60
65
2008 2010 2012 2014 2016 2018
Growth shock (in percent per year)
PB shock 57
Baseline4947
20
25
30
35
40
45
50
55
60
65
2008 2010 2012 2014 2016 2018
i-rate shock 51
Baseline49
20253035404550556065
2008 2010 2012 2014 2016 2018
Interest rate shock (in percent)
Figure 5. Costa Rica: Central Government Debt Sustainability: Bound Tests 1/ (debt in percent of GDP)
Sources: International Monetary Fund, country desk data, and Fund staff estimates.1/ Shaded areas represent actual data. Individual shocks are permanent one-half standard deviation shocks. Figures in the boxes represent average projections for the respective variables in the baseline and scenario being presented. Ten-year historical average for the variable is also shown.2/ Permanent 1/4 standard deviation shocks applied to real interest rate, growth rate, and primary balance.3/ Ten percent of GDP shock to contingent liabilities occurs in 2009.
Historical 26
Baseline
49
2
3
4
5
6
7
8
9
10
20253035404550556065
2008 2010 2012 2014 2016 2018
Baseline and historical scenarios
Combined shock
55
Baseline
49
20253035404550556065
2008 2010 2012 2014 2016 2018
Combined shock 2/
Baseline
49
60
20253035404550556065
2008 2010 2012 2014 2016 2018
Contingent
Contingent liabilities shock 3/
Gross financing need under baseline (rhs)
Primary balance shock (in percent of GDP) andno policy change scenario (constant primary balance)
No policy change
Baseline: -2.7
Scenario: -3.9
Historical: 0.5
Baseline: 4.5
Scenario: 3.1
Historical: 4.9
Baseline: 4.8
Scenario: 5.7
Historical: 2.6

COSTA RICA
INTERNATIONAL MONETARY FUND 43
Est. Projections2010 2011 2012 2013 2014 2015 2016 2017 2018
Debt-stabilizingprimary
balance 7/Public sector debt 1/ 30.6 33.2 38.1 39.5 41.2 43.6 45.8 47.9 50.1 -0.7
o/w foreign-currency denominated 11.3 10.9 12.5 13.9 15.0 16.3 16.9 17.4 17.8
Change in public sector debt 1.3 2.6 4.9 1.4 1.6 2.4 2.2 2.1 2.2Identified debt-creating flows (4+7+12) 2.1 3.0 4.9 1.4 1.6 2.4 2.2 2.1 2.2
Primary deficit 3.2 1.9 1.9 2.2 2.7 2.8 2.8 2.9 2.9Revenue and grants 22.4 22.5 22.4 22.7 22.8 22.8 22.8 22.8 22.8Primary (noninterest) expenditure 25.5 24.3 24.3 24.9 25.5 25.6 25.6 25.7 25.7
Automatic debt dynamics 2/ -2.1 0.0 -0.6 -0.6 -0.4 -0.2 0.1 0.2 0.3Contribution from interest rate/growth differential 3/ -1.1 0.1 -0.5 -0.6 -0.4 -0.2 -0.1 0.1 0.2
Of which: contribution from real interest rate 0.1 1.2 1.0 0.8 1.2 1.5 1.7 2.0 2.1Of which: contribution from real GDP growth -1.2 -1.2 -1.5 -1.5 -1.6 -1.7 -1.8 -1.9 -2.0
Contribution from exchange rate depreciation 4/ -1.0 0.0 -0.2 … … … … … …Contribution from exchange rate depreciation 4/ -1.0 0.0 -0.2 0.1 0.0 0.0 0.1 0.1 0.1
Denominator = 1+g+p+gp 1.1 1.1 1.1 1.1 1.1 1.1 1.1 1.1 1.1Other identified debt-creating flows 1.0 1.1 3.7 -0.2 -0.7 -0.2 -0.7 -1.0 -1.1
Privatization receipts (negative) 0.0 0.0 0.0 0.0 0.0 0.0 0.0 0.0 0.0Recognition of implicit or contingent liabilities 0.0 0.0 0.0 0.0 0.0 0.0 0.0 0.0 0.0Net public sector asset changes 5/ 1.0 1.1 3.7 -0.2 -0.7 -0.2 -0.7 -1.0 -1.1
Residual, including asset changes (2-3) -0.8 -0.3 0.0 0.0 0.0 0.0 0.0 0.0 0.0
Public sector debt-to-revenue ratio 136.8 147.9 170.1 174.4 180.6 191.5 201.0 210.1 220.1
Gross financing need 6/ 16.2 16.2 10.1 7.5 8.3 9.0 9.0 7.9 8.2in billions of U.S. dollars 5.9 6.6 4.5 3.7 4.5 5.4 5.8 5.6 6.3
ProjectedKey Macroeconomic and Fiscal Assumptions Average
Real GDP growth (in percent) 4.7 4.2 5.0 4.2 4.4 4.5 4.5 4.5 4.5 4.5Average nominal interest rate on public debt (in percent) 7/ 8.8 8.7 8.2 7.7 8.8 9.3 9.7 10.1 10.3 9.6Average real interest rate (nominal rate minus change in GDP deflator, in percent) 0.8 4.6 3.7 2.6 3.5 4.3 4.6 4.9 5.1 4.5Nominal appreciation (increase in US dollar value of local currency, in percent) 10.2 0.2 2.8 -0.4 -0.2 0.0 -1.4 -1.4 -1.4 -0.9Inflation rate (GDP deflator, in percent) 8.0 4.1 4.5 5.1 5.2 5.0 5.1 5.1 5.2 5.1Growth of real primary spending (deflated by GDP deflator, in percent) 9.8 -0.8 4.8 6.7 7.2 4.9 4.3 4.9 4.6 5.2Primary deficit 3.2 1.9 1.9 2.2 2.7 2.8 2.8 2.9 2.9 2.8
Source:1/ Consolidated public sector debt.2/ Derived as [(r - p(1+g) - g + ae(1+r)]/(1+g+p+gp)) times previous period debt ratio, with r = interest rate; p = growth rate of GDP deflator; g = real GDP growth rate;
a = share of foreign-currency denominated debt; and e = nominal exchange rate depreciation (measured by increase in local currency value of U.S. dollar).3/ The real interest rate contribution is derived from the denominator in footnote 2/ as r - π (1+g) and the real growth contribution as -g.4/ The exchange rate contribution is derived from the numerator in footnote 2/ as ae(1+r). 5/ Comprises pre-financing, net purchases of private sector assets by the social security agency and issuance of monetary sterilization bonds.6/ Defined as public sector deficit, plus amortization of medium and long-term public sector debt, plus short-term debt at end of previous period. 7/ Derived as nominal interest expenditure divided by previous period debt stock.
I. Baseline Projections
Table 13. Costa Rica: Consolidated Public Sector Debt Sustainability Framework, 2010-2018
Actual
(In percent of GDP, unless otherwise indicated)

COSTA RICA
44 INTERNATIONAL MONETARY FUND
Growth shock
61
Baseline50
20
25
30
35
40
45
50
55
60
65
2008 2010 2012 2014 2016 2018
Growth shock (in percent per year)
PB shock 58
Baseline 50
47
20
25
30
35
40
45
50
55
60
65
2008 2010 2012 2014 2016 2018
i-rate shock 53
Baseline
50
20
25
30
35
40
45
50
55
60
65
2008 2010 2012 2014 2016 2018
Interest rate shock (in percent)
Figure 6. Costa Rica: Public Debt Sustainability: Bound Tests 1/ (Public debt in percent of GDP)
Sources: International Monetary Fund, country desk data, and Fund staff estimates.1/ Shaded areas represent actual data. Individual shocks are permanent one-half standard deviation shocks. Figures in the boxes represent average projections for the respective variables in the baseline and scenario being presented. Ten-year historical average for the variable is also shown.2/ Permanent 1/4 standard deviation shocks applied to real interest rate, growth rate, and primary balance.3/ Ten percent of GDP shock to contingent liabilities occurs in 2009.
Historical24
Baseline
50
2
3
4
5
6
7
8
9
10
20
25
30
35
40
45
50
55
60
65
2008 2010 2012 2014 2016 2018
Baseline and historical scenarios
Combined shock
57
Baseline
50
20
25
30
35
40
45
50
55
60
65
2008 2010 2012 2014 2016 2018
Combined shock 2/
Baseline
50
60
20
25
30
35
40
45
50
55
60
65
2008 2010 2012 2014 2016 2018
Contingent liabilities shock
Contingent liabilities shock 3/
Gross financing need under baseline
Primary balance shock (in percent of GDP) andno policy change scenario (constant primary
No policy
Baseline: -2.8
Scenario: -4.1
Historical: 0.5
Baseline: 4.5
Scenario: 3.1
Historical: 4.9
Baseline: 4.5
Scenario: 5.7
Historical: 0.6

COSTA RICA
INTERNATIONAL MONETARY FUND 45
Est. Projections2010 2011 2012 2013 2014 2015 2016 2017 2018
Debt-stabilizingprimary
balance 7/Public sector debt 1/ 30.6 33.2 38.1 39.5 40.5 40.7 40.3 39.4 38.4 -0.9
o/w foreign-currency denominated 11.3 10.9 12.5 13.9 15.0 16.0 16.2 16.2 16.1
Change in public sector debt 1.3 2.6 4.9 1.4 1.0 0.1 -0.4 -0.9 -1.0Identified debt-creating flows (4+7+12) 2.1 3.0 4.9 1.4 1.0 0.2 -0.4 -0.8 -1.0
Primary deficit 3.2 1.9 1.9 2.1 1.8 0.3 0.1 0.0 0.0Revenue and grants 22.4 22.5 22.4 22.7 23.5 25.0 25.0 25.1 25.0Primary (noninterest) expenditure 25.5 24.3 24.3 24.8 25.3 25.3 25.2 25.1 25.0
Automatic debt dynamics 2/ -2.1 0.0 -0.6 -0.6 -0.1 0.2 0.1 0.1 0.1Contribution from interest rate/growth differential 3/ -1.1 0.1 -0.5 -0.6 -0.1 0.2 0.1 0.0 0.0
Of which: contribution from real interest rate 0.1 1.2 1.0 0.9 1.3 1.6 1.6 1.6 1.6Of which: contribution from real GDP growth -1.2 -1.2 -1.5 -1.5 -1.4 -1.4 -1.6 -1.7 -1.6
Contribution from exchange rate depreciation 4/ -1.0 0.0 -0.2 … … … … … …Other identified debt-creating flows 1.0 1.1 3.7 -0.2 -0.7 -0.4 -0.7 -0.9 -1.0
Privatization receipts (negative) 0.0 0.0 0.0 0.0 0.0 0.0 0.0 0.0 0.0Recognition of implicit or contingent liabilities 0.0 0.0 0.0 0.0 0.0 0.0 0.0 0.0 0.0Net public sector asset changes 5/ 1.0 1.1 3.7 -0.2 -0.7 -0.4 -0.7 -0.9 -1.0
Residual, including asset changes (2-3) -0.8 -0.3 0.0 0.0 0.0 0.0 0.0 0.0 0.0
Public sector debt-to-revenue ratio 136.8 147.9 170.1 174.2 172.2 162.7 160.9 157.2 153.3
Gross financing need 6/ 16.2 16.2 10.1 7.4 7.5 6.5 6.0 4.4 4.2in billions of U.S. dollars 5.9 6.6 4.5 3.7 4.1 3.8 3.8 3.0 3.2
ProjectedKey Macroeconomic and Fiscal Assumptions Average
Real GDP growth (in percent) 4.7 4.2 5.0 4.2 4.0 3.8 4.2 4.5 4.5 4.2Average nominal interest rate on public debt (in percent) 7/ 8.8 8.7 8.2 7.7 8.9 9.4 9.4 9.3 9.4 9.3Average real interest rate (nominal rate minus change in GDP deflator, in percent) 0.8 4.6 3.7 2.7 3.8 4.6 4.6 4.7 4.7 4.5Nominal appreciation (increase in US dollar value of local currency, in percent) 10.2 0.2 2.8 -0.4 -0.4 0.0 -0.9 -0.5 -0.5 -0.4Inflation rate (GDP deflator, in percent) 8.0 4.1 4.5 5.0 5.1 4.8 4.8 4.7 4.7 4.8Growth of real primary spending (deflated by GDP deflator, in percent) 9.8 -0.8 4.8 6.3 6.4 3.7 3.6 4.3 4.1 4.4Primary deficit 3.2 1.9 1.9 2.1 1.8 0.3 0.1 0.0 0.0 0.5
Source:1/ Consolidated public sector debt.2/ Derived as [(r - p(1+g) - g + ae(1+r)]/(1+g+p+gp)) times previous period debt ratio, with r = interest rate; p = growth rate of GDP deflator; g = real GDP growth rate;
a = share of foreign-currency denominated debt; and e = nominal exchange rate depreciation (measured by increase in local currency value of U.S. dollar).3/ The real interest rate contribution is derived from the denominator in footnote 2/ as r - π (1+g) and the real growth contribution as -g.4/ The exchange rate contribution is derived from the numerator in footnote 2/ as ae(1+r). 5/ Comprises pre-financing, net purchases of private sector assets by the social security agency and issuance of monetary sterilization bonds.6/ Defined as public sector deficit, plus amortization of medium and long-term public sector debt, plus short-term debt at end of previous period. 7/ Derived as nominal interest expenditure divided by previous period debt stock.
I. Baseline Projections
Table 14. Costa Rica: Consolidated Public Sector Debt Sustainability Framework (Under Fiscal Consolidation Scenario), 2010-2018
Actual
(In percent of GDP, unless otherwise indicated)

COSTA RICA
46 INTERNATIONAL MONETARY FUND
Est. Projections2010 2011 2012 2013 2014 2015 2016 2017 2018 Debt-stabilizing
non-interest current account 6/
Baseline: External debt 25.2 25.2 27.9 29.8 32.4 34.6 35.9 36.6 37.2 -4.7
Change in external debt -2.6 0.0 2.6 2.0 2.5 2.3 1.2 0.8 0.6Identified external debt-creating flows (4+8+9) -5.8 -2.8 -2.0 -2.0 -1.7 -1.5 -1.3 -1.1 -1.1
Current account deficit, excluding interest payments 2.7 4.7 4.8 4.8 4.8 4.9 4.9 4.9 4.9Deficit in balance of goods and services 2.5 4.7 4.4 4.2 4.1 4.3 4.2 4.2 4.2
Exports 38.2 37.6 37.1 35.9 35.3 35.0 35.0 35.2 35.2Imports 40.7 42.4 41.5 40.1 39.4 39.2 39.2 39.4 39.4
Net non-debt creating capital inflows (negative) -4.0 -5.3 -5.1 -4.9 -4.6 -4.4 -4.3 -4.3 -4.3Automatic debt dynamics 1/ -4.4 -2.2 -1.7 -2.0 -1.8 -2.0 -1.9 -1.7 -1.7
Contribution from nominal interest rate 0.8 0.6 0.6 0.7 0.8 0.8 1.0 1.1 1.1Contribution from real GDP growth -1.1 -0.9 -1.1 -1.1 -1.2 -1.3 -1.4 -1.5 -1.5Contribution from price and exchange rate changes 2/ -4.2 -1.9 -1.2 … … … … … …
Residual, incl. change in gross foreign assets (2-3) 3/ 3.1 2.8 4.6 4.0 4.2 3.8 2.5 1.9 1.7
External debt-to-exports ratio (in percent) 65.9 67.1 75.0 83.1 91.7 99.1 102.5 104.2 105.8
Gross external financing need (in billions of US dollars) 4/ 0.0 5.5 5.9 6.7 7.6 8.6 9.8 11.0 12.2in percent of GDP 0.0 13.5 13.2 13.5 13.9 14.4 15.0 15.5 15.9
Scenario with key variables at their historical averages 5/ 29.8 31.0 31.7 31.1 29.8 28.5 -6.8
Key Macroeconomic Assumptions Underlying Baseline
Real GDP growth (in percent) 4.7 4.2 5.0 4.2 4.4 4.5 4.5 4.5 4.5GDP deflator in US dollars (change in percent) 17.8 8.3 5.1 5.9 4.9 4.9 4.3 3.7 3.7Nominal external interest rate (in percent) 3.7 2.9 2.7 2.6 2.8 2.9 3.0 3.2 3.4Growth of exports (US dollar terms, in percent) 11.3 11.1 9.0 6.7 7.7 8.6 9.0 9.0 8.5Growth of imports (US dollar terms, in percent) 20.0 17.5 8.1 6.7 7.7 9.1 8.9 8.9 8.5Current account balance, excluding interest payments -2.7 -4.7 -4.8 -4.8 -4.8 -4.9 -4.9 -4.9 -4.9Net non-debt creating capital inflows 4.0 5.3 5.1 4.9 4.6 4.4 4.3 4.3 4.3
Source:1/ Derived as [r - g - r(1+g) + ea(1+r)]/(1+g+r+gr) times previous period debt stock, with r = nominal effective interest rate on external debt; r = change in domestic GDP deflator in US dollar terms, g = real GDP growth rate, e = nominal appreciation (increase in dollar value of domestic currency), and a = share of domestic-currency denominated debt in total external debt.2/ The contribution from price and exchange rate changes is defined as [-r(1+g) + ea(1+r)]/(1+g+r+gr) times previous period debt stock. r increases with an appreciating domestic currency (e > 0) and rising inflation (based on GDP deflator). 3/ For projection, line includes the impact of price and exchange rate changes.4/ Defined as current account deficit, plus amortization on medium- and long-term debt, plus short-term debt at end of previous period. 5/ The key variables include real GDP growth; nominal interest rate; dollar deflator growth; and both non-interest current account and non-debt inflows in percent of GDP.6/ Long-run, constant balance that stabilizes the debt ratio assuming that key variables (real GDP growth, nominal interest rate, dollar deflator growth, and non-debt inflows in percent of GDP) remain at their levels of the last projection year.
Table 15. Costa Rica: External Debt Sustainability Framework, 2010-2018(In percent of GDP, unless otherwise indicated)
Actual

COSTA RICA
INTERNATIONAL MONETARY FUND 47
i-rate shock
38
Baseline37
15
20
25
30
35
40
45
2008 2010 2012 2014 2016 2018
Interest rate shock (in percent)
Figure 7. Costa Rica: External Debt Sustainability: Bound Tests 1/ 2/(External debt in percent of GDP)
Sources: International Monetary Fund, Country desk data, and staff estimates.1/ Shaded areas represent actual data. Individual shocks are permanent one-half standard deviation shocks. Figures in the boxes represent average projections for the respective variables in the baseline and scenario being presented. Ten-year historical average for the variable is also shown. 2/ For historical scenarios, the historical averages are calculated over the ten-year period, and the information is used to project debt dynamics five years ahead.3/ Permanent 1/4 standard deviation shocks applied to real interest rate, growth rate, and current account balance.
Historical
28
Baseline 37
0
5
10
15
20
25
30
05
10152025303540455055
2008 2010 2012 2014 2016 2018
Baseline and historical scenarios
CA shock
41
Baseline
37
15
20
25
30
35
40
45
2008 2010 2012 2014 2016 2018
Combined shock
41
Baseline
37
15
20
25
30
35
40
45
2008 2010 2012 2014 2016 2018
Combined shock 3/
30 % depreciati
on
Baseline 37
15
20
25
30
35
40
45
50
55
2008 2010 2012 2014 2016 2018
Real depreciation shock 4/
Gross financing need under baseline
(right scale)
Non-interest current account shock (in percent of GDP)
Growth shock
39
Baseline37
15
20
25
30
35
40
45
2008 2010 2012 2014 2016 2018
Growth shock (in percent per year)
Baseline:
Scenario:
Historical:
3.1
3.5
4.0
Baseline:
Scenario:
Historical:
4.5
3.1
4.9
Baseline:
Scenario:
Historical:
-4.9
-5.8
-4.0

i
COSTA RICA STAFF REPORT FOR THE 2012 ARTICLE IV CONSULTATION—INFORMATIONAL ANNEX
Prepared By: The Western Hemisphere Department
FUND RELATIONS __________________________________________________________________________ 2
PAST FUND STAFF RECOMMENDATIONS AND IMPLEMENTATION _____________________ 5
RELATIONS WITH THE WORLD BANK AND BANK-FUND COLLABORATION UNDER
THE JOINT MANAGEMENT ACTION PLAN (JMAP) _______________________________________ 6
RELATIONS WITH THE INTER-AMERICAN DEVELOPMENT BANK _______________________ 9
STATISTICAL ISSUES ______________________________________________________________________ 11
CONTENTS
February 5, 2013

COSTA RICA
2 INTERNATIONAL MONETARY FUND
FUND RELATIONS(As of November 30, 2012)
Membership Status: Joined: January 08, 1946
General Resources Account: SDR Million % Quota
Quota 164.10 100.00
Fund holdings of currency 144.09 87.81
Reserve Tranche Position 20.02 12.20 SDR Department: SDR Million % Allocation
Net cumulative allocation 156.53 100.00
Holdings 132.58 84.70
Outstanding Purchases and Loans:
None
Latest Financial Arrangements:
Date of Expiration Amount Approved Amount Drawn
Type Arrangement Date (SDR Million) (SDR Million)
Stand-By 04/11/2009 07/10/2010 492.30 0.00
Stand-By 11/29/1995 02/28/1997 52.00 0.00
Stand-By 04/19/1993 02/18/1994 21.04 0.00
Projected Payments to Fund
(SDR Million; based on existing use of resources and present holdings of SDRs): Overdue Forthcoming 2012 2013 2014 2015
Principal 0.00 0.00 0.00 0.00 0.00
Charges/Interest 0.00 0.11 0.11 0.11 0.11
Total 0.00 0.11 0.11 0.11 0.11 Exchange Rate Arrangement. Costa Rica’s de jure exchange rate arrangement is classified as a
“crawling band,” while the de facto exchange rate arrangement is classified as a “stabilized
arrangement.” Since October 2006, the de jure exchange rate arrangement has been a crawling
band with an increasing width. The ceiling and floor of the band have been adjusted several times,
most recently in January 2009, when the crawl rate of the band’s ceiling has been set at 0.20 colones
(previously 0.06 colones) a business day. The floor of the band has been flat since July 2008. As of
January 23, 2013, the intervention buying and selling exchange rates were 500 and 765.25 colones

COSTA RICA
INTERNATIONAL MONETARY FUND 3
per U.S. dollar respectively. Costa Rica maintains an exchange system free of restrictions on the
making of payments and transfers for current international transactions.
Article IV Consultation. The last Article IV consultation was concluded on May 25, 2011 (Country
Report No. 11/161).
FSAP participation and ROSCs. The FSAP took place in 2001, and was updated in 2008. A data
ROSC took place in 2001 with a reassessment in 2009. A fiscal ROSC took place in 2006.
Technical Assistance.
Department Time of Delivery Purpose
STA, CAPTAC-DR August 2011
November 2011
2011 and 2012
2011 and 2012
January/May 2012
April 2012
Producer price index
Export-import price indices
National accounts statistics
Regional project for harmonization of external sector statistics
Regional project for harmonization of monetary and financial statistics
Government finance statistics
MCM, CAPTAC-DR August 2011
November 2011
March 2012
April 2012
August 2012
September 2012
September 2012
December 2012
December 2012
Liquidity management
Construction of a general equilibrium model for the Costa Rican economy
Adoption of International Financial Reporting Standards
Measuring the equilibrium exchange rate
Macro-prudential policy and modeling
Stress tests of the banking system
Formulation of rules to facilitate liquidity risk management and supervision
Methodology and information system for cross-border and consolidated supervision
Modernizing internal audit, risk management and the accounting framework at the
central bank
FAD, CAPTAC-DR 2011 and 2012
February 2012
June 2012
November 2012
December 2012
Internal revenue and customs administration
Measurement of non-compliance and tax expenditure
Plan to strengthen tax and custom administration
Implementation of International Public Sector Accounting Standards
Implementing a medium-term expenditure framework

COSTA RICA
4 INTERNATIONAL MONETARY FUND
Resident Representative: Fernando Delgado (based in Guatemala) is the regional resident
representative for Central America, Panama and the Dominican Republic.

COSTA RICA
INTERNATIONAL MONETARY FUND 5
PAST FUND STAFF RECOMMENDATIONS AND IMPLEMENTATION
2011 Article IV Staff Recommendation Implementation
Fiscal Policy Rebuild fiscal buffers that were used to contain the
impact of the global crisis. Moreover, fiscal consolidation is needed to safeguard fiscal sustainability over the medium and long term. More ambitious fiscal consolidation targets than those envisioned by the authorities would be advisable.
The consolidation strategy should center on both revenue enhancing measures and expenditure restraint. Planned efforts to strengthen tax administration are also appropriate.
The fiscal deficit has remained high, although the authorities have contained somewhat expenditure growth since 2011
The tax reform proposed by the authorities in 2011 was void by the Supreme Court in early 2012 due to procedural irregularities. Since then, the authorities have shifted their fiscal adjustment efforts to containing expenditure pressures, strengthening tax administration, and reducing borrowing costs by tapping international markets. The authorities intend to resubmit a tax reform to congress.
Monetary Policy
The near-term risks to the inflation outlook stem from possible second-round effects from higher commodity prices and sustained capital inflows. The authorities should stand ready to increase interest rates if signs of inflationary pressures emerge.
Upgrading the monetary policy framework should receive higher priority. Exchange rate flexibility should be raised and the interest rate corridor narrowed to enhance monetary control.
Speed up the transition toward inflation targeting. Too long a transition may compromise the central bank’s credibility.
Inflation has fallen to historically lows, partially in response to the authorities’ continued efforts to strengthen the monetary operations framework, notably through establishment of a corridor for short-term interest rates and the launch of a policy interest rate in 2011.
The authorities have reiterated their intentions to move to a more flexible exchange rate system, although the band system is still in place and the exchange rate remains at the appreciated end of the band.
Financial Sector Implementation of the 2008 FSAP recommendations
should be accelerated.
Congressional approval should be sought for legislation to enhance consolidated supervision, establish a deposit insurance system and strengthen the bank resolution framework.
The authorities should continue working to introduce risk-based supervision.
Progress on introducing FSAP recommendations has been mixed.
Critical legislation to enhance consolidated supervision and strengthen bank resolution remains to be approved.
By end-2012, implementation of a risk-based supervision methodology had been largely completed, but more work needs to be done to make it fully operational.

COSTA RICA
6 INTERNATIONAL MONETARY FUND
RELATIONS WITH THE WORLD BANK AND BANK-FUND COLLABORATION UNDER THE JOINT MANAGEMENT ACTION PLAN (JMAP) 1. In November 2012, the IMF’s Costa Rica team led by Mr. Figliuoli (mission chief) met
with the World Bank’s Costa Rica team led by Mr. Calvo-Gonzalez (lead economist and PREM
sector leader) to discuss macroeconomic challenges, identify macrocritical structural reforms,
and coordinate the two teams’ work.
2. The teams agreed that Costa Rica’s main macroeconomic challenges are to safeguard
fiscal sustainability, increase the effectiveness of monetary policy, maintain financial sector
stability and enhance competitiveness.
3. The teams also discussed the risks to Costa Rica’s inflation outlook stemming from
large capital inflows, high commodity prices and closing of the output gap.
4. Based on the shared assessment of macroeconomic challenges, the teams identified
four structural reform areas as macrocritical:
Fiscal consolidation. The fiscal consolidation strategy should comprise both revenue and
expenditure components. On the revenue side, consensus should be sought to enact a tax
reform along the lines of the 2011-12 proposal. On the expenditure side, the focus should
be to contain the pace of growth of current expenditure, including wages and transfers. In
addition, the authorities should continue working on strengthening revenue administration.
Monetary policy framework. The transition to inflation targeting and greater exchange rate
flexibility should be accelerated in order to lock in low inflation achieved in recently years.
Financial sector stability. Progress has been made in adopting risk-based financial
supervision. Looking ahead, approval of legislation on consolidated supervision, deposit
insurance and banking resolution will be critical to bring the regulatory framework up to
international best practices.
Competitiveness. The country is making progress in addressing issues of universal coverage
and quality in secondary education, and is seeking to develop its scientific and technological

COSTA RICA
INTERNATIONAL MONETARY FUND 7
capabilities, which would help position Costa Rica as a knowledge economy. There is also
strong commitment to improving the business environment and removing burdensome red
tape. Given the sizable investments required to upgrade infrastructure and the tight fiscal
situation, the government is seeking to create the institutional conditions to engage the
private sector in financing, construction and management of infrastructure projects (public-
private partnerships). The government has already begun to open the insurance, electricity
and telecommunication sectors to private investment.
5. The teams agreed the following division of labor:
Fiscal consolidation. The IMF (the Fund) will continue to provide policy recommendations on
macro-fiscal issues, including the overall strategy of fiscal consolidation and the tax reform.
The World Bank (the Bank) will provide technical assistance to support the use of public-
private partnerships as a vehicle to finance key infrastructure projects. The government also
requested assistance to improve financial management, service delivery, and sustainability of
its social security system.
Monetary policy framework. The Fund will continue to provide policy recommendations
regarding the transition to inflation targeting and a more flexible exchange rate regime.
Financial sector stability. The Bank and the Fund will cooperate as necessary in assisting the
country in implementing the FSAP recommendations.
Competitiveness. The Bank will continue to provide policy recommendations in key areas. In
terms of lending, the government is being supported by a project in higher education
(approved in September 2012). The government has also requested technical assistance
from IFC Advisory services to improve the investment climate.
6. The teams have the following requests for information from their counterparts:
The Fund team requests to be kept informed of progress in the above macro-critical
structural reform areas. Timing: when milestones are reached (and at least semi-annually).
The Bank team requests to be kept informed of the Fund’s assessments of macroeconomic
policies and prospects.

COSTA RICA
8 INTERNATIONAL MONETARY FUND
7. The attached table lists the teams’ separate and joint work programs for 2013.
Table 1. World Bank and IMF Planned Activities in Macro-Critical Structural Reform Areas
Title Products Provisional Timing
of Missions
Expected Delivery
Date World Bank Work Program
Conference: Logistics in Central America a Way to Competitiveness
February 8, 2013 February 8, 2013
Costa Rica: Development of capital markets (technical assistance)
TBC Final delivery April 2013
Financial crisis simulation program (technical assistance)
TBC Final delivery April 2013
Costa Rica health (technical assistance)
February, 2013 Final delivery January 2014
IMF Work Program Regional Conference July 2013 July 2013
Staff visit September 2013 September 2013
Technical assistance:
Internal revenue and customs administration
Liquidity management, macro forecasting models
Macro-prudential legal framework
Central bank accounting
Improvement in monetary and financial statistics as part of regional project
Improvement in external sector statistics as part of regional project
2013

COSTA RICA
INTERNATIONAL MONETARY FUND 9
RELATIONS WITH THE INTER-AMERICAN DEVELOPMENT BANK
8. Recent activities. The IBD´s loan portfolio in Costa Rica has 11 sovereign guaranteed
operations in execution, with an approved amount of US$1,360.7 million. The available amount for
disbursements is US$1,069.8 million (80.1% of the approved), and is concentrated in the areas of
Energy (32.5%), Transportation (26.3%), Education (15.6%) and Reform and Modernization of the
State (12.9 %). The average age of the operations is 4 years. The IDB still has three operations
pending legislative ratification: Water and Sanitation Program, an Innovation and Human Capital for
Competitiveness Program and an Education Infrastructure Construction and Equipment Program.
Disbursements of sovereign guaranteed operations during 2012 are expected to reach around
US$94.2 million, concentrated in the areas of Energy (69.7%), Reform and Modernization of the State
(15.0%) and Transportation (12.8%).
9. Future plans. During the 2013 the IDB expects to continue the implementation of its 2011-
2014 Country Strategy for Costa Rica, focused on the areas of Transportation, Energy, Citizen
Security, Early Childhood Development, Health and Innovation. In 2013 the IDB expects to approve
two Sovereign Guarantee loans for a total amount of US$338.0 million on Transportation and
Logistics/Regional Integration.
Loan Disbursements (Sovereign Guaranteed Operations) (In millions of U.S. dollars)
2007 2008 2009 2010 2011 2012*Disbursements 12.9 18 40.6 55.7 121.0 94.2Amortization 81.4 289.3** 46.0 45.3 47.0 61.4Interest and charges 23.6 24.1 13.8 11.4 10.4 17.1Net cash flow -92.1 -295.4 -19.2 -1.0 61.5 14.3* Projections (December 2012). **Includes an anticipated repayment of US$200 million
Lending Program for 2013 (tentative)
(In millions of U.S. dollars)
Projects Amount
Border Crossing 40.0
Second Road Infrastructure Program 298.0
Total 338.0

COSTA RICA
10 INTERNATIONAL MONETARY FUND
Sovereign Guaranteed Operations (as of December 03, 2012) (In millions of U.S. dollars)
Approved Disbursed Obligated Available
Loans in execution 1360.7 270.1 20.7 1069.8
Cadaster and Registry Regularization 65.0 59.1 0.0 5.9
Sustainable Development of the Binational Watershed Rio Sixaola
9.2 0.9 0.0 8.3
Tourism Program in Protected Areas 19.0 0.0 0.0 19.0
First Electric Power Sector Development Program 2008-2011
250.0 131.6 20.7 97.7
First Road Infraestructure Program 300.0 66.6 0.0 233.4
Cantonal Road Network Program 60.0 12.0 0.0 48.0
Water and Sanitation Program 73.0 0.0 0.0 73.0
Violence Prevention and Social Inclusion Promotion Program
132.4 0.0 0.0 132.4
Innovation and Human Capital for Competitiveness Program
35.0 0.0 0.0 35.0
Power Sector Development Program 2012-16 (Reventazon Hydroelectric Project)
250.0 0.0 0.0 250.0
Education Infrastructure Construction and Equipment Program
167.0 0.0 0.0 167.0
Nonreimbursable Technical Cooperations 15.5 6.5 0.5 8.6
Total 1376.2 276.6 21.2 1078.4

COSTA RICA
INTERNATIONAL MONETARY FUND 11
STATISTICAL ISSUES (As of January 2013)
General: Data provision is broadly adequate for surveillance. The quality of macroeconomic data
has continued to improve in recent years. This was confirmed by a reassessment of the Data Module
Report on the Observance of Standards and Codes (ROSC) that was published in February 2010.
Further statistical improvements are being pursued, including in the real, monetary, fiscal and
balance of payments sectors. The Central Bank, the Ministry of Finance, and the National Institute of
Statistics and Census make data available to the public through regular official publications on their
websites (www.bccr.fi.cr, www.hacienda.go.cr, and www.inec.go.cr).
National accounts: National accounts are compiled generally in accordance with the System of
National Accounts 1993 (SNA 1993). However, the reference year 1991 for the series at constant
prices is outdated. Estimation of rentals for owner occupied dwellings should be improved.
Accounting depreciation is used instead of estimating consumption of fixed capital. Double
deflation method is not applied. Changes in inventories are obtained as residuals and the Chow Lin
(without indicator) method is applied for benchmarking quarterly value added of activities,
comprising a third of GDP. Non-observed/informal activities are not properly covered. The Central
Bank started a project for changing the base year to 2012 and implementing the recommendations
of the System of National Accounts 2008 (2008 SNA) that are relevant for the Costa Rican economy.
Price statistics: The compilation of the consumer price index (CPI), in general, employs concepts
and definitions from the 1993 SNA and the international CPI manual. However, the CPI lacks a
market basket component to measure the cost of owner-occupied housing. Also, the index only
covers urban households located in greater San Jose, which comprise approximately 46 percent of
the total population and 72 percent of the urban population of Costa Rica. Individual price index
data are not generally verified against similar data from other databases such as the producer price
index (PPI) and agricultural price indices. Nevertheless, atypical movements in the data are
investigated and corrected when necessary.
Except for being compiled only by product aggregations and not by economic activity as well, the
PPI is compiled based on concepts and definitions from the 1993 SNA and the international PPI
Manual. However, the weights, the establishment sample, and the product sample for the PPI that
were introduced in 2000 are based on 1997 sales data. Therefore, the index needs updating. A
comprehensive assessment of the source data is being carried out, and this is guiding the
production of new source data to update the PPI and the national accounts. The export and import
and import price indices as well as the PPI are currently being updated.

COSTA RICA
12 INTERNATIONAL MONETARY FUND
Government finance statistics: The concepts and definitions used in compiling GFS generally
follow the guidelines of the GFSM 1986. However, financing data and government debt, which use
national concepts that combine instruments and holders, are not in accordance with international
standards. A migration path to the GFSM 2001 has been adopted in the context of the GFS
harmonization project for Central America, Panama, and the Dominican Republic. Monthly fiscal
statistics are only compiled and disseminated for budgetary central government, while annual
statistics are compiled and disseminated for the entire public sector and its subsectors. The place of
issue (Costa Rica or abroad) criterion is followed to classify domestic and foreign debt, instead of
the internationally recommended residency criterion. Fiscal data discrepancies among national
compilers on particular items are not regularly reconciled, although large fluctuations or
discrepancies are investigated. Fiscal statistics are not regularly reconciled with monetary statistics,
or other macroeconomic statistics.
Monetary Statistics: Costa Rica’s monetary statistics are broadly in line with the methodology of
the MFSM. Classification/sectorization follows the MFSM with some exceptions. The social security
system accounts are not presented within the central government, but aggregated with other public
sector accounts. Some financial assets and liabilities are not disaggregated by economic sector.
Accrued interest is not classified together with its underlying instrument.
Balance of Payments: The balance of payments statistics broadly follow the concepts and
definitions in the BPM5. While generally adequate and derived from sound collection programs,
source data are incomplete to compile some services in the current account, financial transactions of
the nonfinancial private sector, and remuneration of employees. Foreign direct investment
transactions and positions are valued on a cash basis instead of the recommended accrual basis.
Services are recorded at the time the service is provided. While other income transactions are
recorded on an accrual basis, interest on public external debt is recorded on the due date; no
adjustment is made to convert interest to accrued values. Transfer prices in some cases are not
converted to market prices.
Data Standards and Quality: Costa Rica is in observance with the Special Data Dissemination
Standards (SDDS). Data Module Report on the Observance of Standards and Codes (ROSC) was
published in February 2010.

CO
ST
A R
ICA
INT
ER
NA
TIO
NA
L M
ON
ET
AR
Y F
UN
D 13
Costa Rica: Table of Common Indicators Required for Surveillance
(As of January 10, 2013)
Date of latest
observation Date received
Frequency of
Data5
Frequency of
Reporting5
Frequency
of
Publication
Memo Items:
Data Quality –
Methodological
soundness6
Data Quality –
Accuracy and
reliability7
Exchange Rates Jan 13 Jan 13 D D D
International Reserve Assets and Reserve Liabilities of the
Monetary Authorities1 Jan 13 Jan 13 D D D
Reserve/Base Money Dec 12 Jan 13 D D D O, LO, LO, LO O, O, O, LO, O
Broad Money Dec 12 Jan 13 M M M
Central Bank Balance Sheet Sep 12 Jan 13 M M M
Consolidated Balance Sheet of the Banking System Nov 12 Jan 13 M M M
Interest Rates2 Jan 13 Jan 13 D D D
Consumer Price Index Dec 12 Jan 13 M M M O, LO, O, O LO, O, LO, LO,O
Revenue, Expenditure, Balance, and Composition of
Financing3– Central Government Dec 12 Jan 13 M M M LO, LNO, LO, LO LO, O, O, LO, O
Stocks of Central Government and Central Government-
Guaranteed Debt4 Dec 12 Jan 13 M M M
External Current Account Balance Sep 12 Jan 13 Q Q Q O, LO, O, LO LO, O, LO, O, LNO
Exports and Imports of Goods and Services Nov 12 Jan 13 Q Q Q
GDP/GNP Oct 12 Jan 13 Q Q Q O, LO, LNO, O LO, O, LNO, O, LO
Gross External Debt Sep 12 Jan 13 Q Q Q
International Investment Position Sep 12 Jan 13 Q Q Q
1 Includes reserve assets pledged or otherwise encumbered as well as net derivative positions. 2 Both market-based and officially-determined, including discounts rates, money market rates, rates on treasury bills, notes, and bonds. 3 Foreign, domestic bank, and domestic nonbank financing. 4 Including currency and maturity composition. 5 Daily (D); weekly (W); monthly (M); quarterly (Q); annually (A); irregular (I); and not available (NA). 6 Reflects the assessment provided in the data ROSC, published in February, 2010 and based on the findings of the mission that took place in April, 2009, for the dataset corresponding to the variable in each row. The assessment indicates whether international standards concerning concepts and definitions, scope, classification/sectorization, and basis for recording are fully observed (O); largely observed (LO); largely not observed (LNO); not observed (NO); and not available (NA). 7 Same as footnote 7, except referring to international standards concerning source data, assessment of source data, statistical techniques, assessment and validation of intermediate data and statistical outputs, and revision studies.


Staff Statement by the Staff Representative on Costa Rica
February 22, 2013
1. This statement provides additional information that has become available since the staff
report was issued. It does not alter the thrust of the staff appraisal.
2. Headline inflation has risen and interest rates have fallen.
Annual headline inflation climbed to 5.7 percent in January, from 4.6 percent in
December, owing to important increases in the education, entertainment, and alcohol and
tobacco components of the consumer price index. Nevertheless, headline inflation
remained within the 4-6 percent official target range. Core inflation stayed at 3.3 percent
(y/y), the same as in December.
A key interest rate, the basic passive rate (BPR), declined to 7.8 percent as of February
14. The BPR has declined steadily since October, reflecting the increased liquidity
brought about by large capital inflows and more reliance on external financing by the
government. The sharp increase in the BPR observed in the first half of 2012 has almost
fully reversed.
3. The authorities announced their intention to adopt macro-prudential and capital
flow management measures (CFMs) to stem the increase in private capital inflows. They
submitted to congress a bill proposing: (i) a surtax—of up to 30 percentage points over the
regular income tax rate—for interest, dividends, and capital gains from investment by non-
residents (excluding foreign direct investments); and (ii) the application of a reserve requirement
on the same investments. At the same time, the central bank introduced temporary limits on
credit growth by banks.
4. As noted in the staff report (SM/13/36), staff thinks that CFMs are not a substitute
for the adjustments in macro policies that Costa Rica needs. Those adjustments include
reducing the fiscal deficit, standing ready to tighten monetary policy, if needed, and allowing
greater exchange rate flexibility by removing the band. CFMs may be a useful transitory
complement to these measures, which are needed to alter the “pull factors” behind the recent
surge in capital inflows.


Public Information Notice (PIN) No. 13/25
FOR IMMEDIATE RELEASE
March 1, 2013
International Monetary Fund
700 19th Street, NW
Washington, D. C. 20431 USA
IMF Executive Board Concludes 2012 Article IV Consultation with Costa Rica
On February 22, 2013, the Executive Board of the International Monetary Fund (IMF)
concluded the Article IV consultation with Costa Rica.1
Background
Costa Rica’s economy has proven resilient to the adverse shocks of recent years. A proactive
policy response, supported by a high-access precautionary Stand-By arrangement with the
Fund (that expired in mid-2010), allowed to maintain macroeconomic and financial stability and
mitigate the effects of the global financial crisis of 2008-09. After falling by 1 percent in 2009,
output recovered quickly. Real GDP grew at an average pace of 4½ percent per annum in
2010-12, while inflation stood within the 4-6 percent official target range.
1 Under Article IV of the IMF's Articles of Agreement, the IMF holds bilateral discussions with
members, usually every year. A staff team visits the country, collects economic and financial
information, and discusses with officials the country's economic developments and policies. On
return to headquarters, the staff prepares a report, which forms the basis for discussion by the
Executive Board. At the conclusion of the discussion, the Managing Director, as Chairman of the
Board, summarizes the views of Executive Directors, and this summary is transmitted to the
country's authorities. An explanation of any qualifiers used in summing ups can be found here:
http://www.imf.org/external/np/sec/misc/qualifiers.htm.

2
A sizable rise in capital inflows more than offset a modest increase in the current account
deficit (estimated at about 5½ percent of GDP in 2012). The resulting balance of payments
surplus placed strong appreciating pressure on the local currency. Net international reserves
rose to US$6.9 billion at end-2012 (from US$4.8 billion at end-2011), reflecting large foreign
exchange purchases by the central bank and the government’s placement of a US$1 billion
bond in international capital markets in late 2012. This notwithstanding, competitiveness,
which eroded significantly in recent years, may pose a risk to external stability in the long term.
The reversion of this tendency requires enhancing productivity while improving fiscal
sustainability and maintaining prudent monetary and exchange rate policies.
The overall public sector deficit stayed broadly unchanged at about 4½ percent of GDP in
2012. Efforts to contain expenditure growth and strengthen tax administration continued, while
enactment of an ambitious tax reform approved by Congress was voided by the Constitutional
Court owing to procedural problems. The consolidated public sector debt rose to 38 percent of
GDP at end-2012, up from 27 percent of GDP at end-2008. The authorities are preparing a
fiscal consolidation plan that will be discussed with all sectors of society. Once consensus is
reached, the plan would be submitted to Congress aiming for approval before the next
administration takes office in May 2014.
Financial sector indicators remained healthy, with adequate levels of liquidity and
capitalization. Although the authorities maintained the policy rate unchanged, other interest
rates rose significantly, particularly during the first half of 2012. Financial conditions began to
ease toward the end of year. Credit to the private sector increased by about 13 percent (y/y) in
nominal terms, with stronger growth in the foreign-currency denominated segment.
Real GDP growth is expected to slow from about 5 percent in 2012 to about 4¼ percent in
2013 and hover at around its estimated potential rate of 4½ percent over the medium term. In
the absence of significant fiscal consolidation, inflation is projected to remain above that of
trading partners, at about 5 percent, while the external current account deficit is anticipated to
rise to about 6 percent of GDP through 2018.
The economic outlook is generally positive, but the balance of risks is tilted to the downside
amid external uncertainties and domestic policy challenges. Weaker-than-expected growth in
the United States, a global financial shock, or a rise in world oil prices are the main sources of

3
external risk. Risks also arise from an eventual resumption of large private capital inflows,
which would call for a combination of tighter fiscal and monetary policies and greater exchange
rate flexibility to avoid overheating. Finally, lack of fiscal consolidation would lead to a steady
rise in public debt, which would increase vulnerabilities and may erode the underpinnings of
macroeconomic stability.
Executive Board Assessment
Directors welcomed Costa Rica’s strong economic recovery since the global financial crisis
and the continued favorable outlook for growth. In light of the risks posed by the external and
internal challenges, Directors emphasized that policies should be geared towards maintaining
macroeconomic stability, reducing vulnerabilities, and boosting growth potential and
competitiveness.
Directors underscored the importance of preserving fiscal and debt sustainability and
commended the authorities’ efforts to enhance revenues and contain expenditures. However,
additional measures will be necessary to reduce the large deficits and the public debt-to-GDP
ratio. In this context, Directors welcomed the authorities’ intention to resubmit to congress a
tax reform proposal which aims at broadening the tax base, reducing tax exemptions, and
strengthening revenue administration, with a view to have it approved by May 2014 when the
new administration takes office. Directors also highlighted the importance of keeping current
expenditure growth in check, especially on public sector wages and transfers, while improving
its quality in the social sectors. Strengthening the pension system should be a priority as well.
Directors recognized that the current fiscal trend is unsustainable in the long run and therefore
welcomed the authorities’ commitment to fiscal consolidation. Most Directors agreed that a
moderately front-loaded adjustment would strike an appropriate balance between addressing
Costa Rica’s fiscal challenges and maintaining robust growth. Some Directors were of the view
that adjustment efforts should be considered in light of the political economy situation and
should also not jeopardize the success of the Costa Rican social-economic model.
Directors commended the authorities for strengthening the monetary framework and bringing
inflation down to single digits. However, given the risks posed by the rigid exchange rate
regime and continued capital inflows, they called for further action to upgrade the monetary

4
and exchange rate policy framework. Directors noted the authorities’ concern about exchange
rate flexibility, but generally recommended increasing exchange rate flexibility as it would allow
greater use of exchange rate as a shock absorber. In general, Directors also saw merit in
establishing an inflation target as the anchor of monetary policy to protect macroeconomic
stability. Directors were generally of the view that appropriate fiscal and monetary policies
could be complemented, for a limited period, by capital flow management measures and that
these should not be a substitute for needed macroeconomic adjustment.
Directors recommended further strengthening of the supervision and prudential regulations of
the financial system, and stressed the importance of implementing pending recommendations
of the 2008 Financial System Assessment Program’s update. They also underlined that full
implementation of risk-based supervision and gradual adoption of Basel III capital and liquidity
standards would further buttress financial sector stability.
Directors encouraged the authorities to continue advancing their structural reform agenda to
raise potential growth and bolster competitiveness. In this regard, addressing infrastructure
bottlenecks and streamlining business regulation should be key priorities.
Public Information Notices (PINs) form part of the IMF's efforts to promote transparency of the IMF's views and analysis of economic developments and policies. With the consent of the country (or countries) concerned, PINs are issued after Executive Board discussions of Article IV consultations with member countries, of its surveillance of developments at the regional level, of post-program monitoring, and of ex post assessments of member countries with longer-term program engagements. PINs are also issued after Executive Board discussions of general policy matters, unless otherwise decided by the Executive Board in a particular case.

5
Costa Rica: Selected Economic Indicators
Population (2011, millions) 4.7 Poverty (2010, percent of population) 24.2 Per capita GDP (2011, U.S. dollars) 9,596 Life expectancy (2009, years) 79.1 Unemployment (2011, percent of labor force) 7.7 Literacy rate (2009, percent of people ages > 15) 96.0 Est. Proj.
2008 2009 2010 2011 2012 2013 (Annual percentage change, unless otherwise indicated)Output and Prices Real GDP growth 2.7 -1.0 4.7 4.2 5.0 4.2 GDP deflator 12.4 8.4 8.0 4.1 4.5 5.1 Consumer prices (end of period) 13.9 4.0 5.8 4.7 4.6 5.0 Money and Credit Monetary base 11.9 5.1 11.2 11.6 10.1 9.9 Broad money 16.1 9.7 1.2 6.4 11.1 11.7 Credit to private sector 31.8 4.5 4.4 13.7 12.7 12.6 (In percent of GDP, unless otherwise indicated)Savings and Investment Gross domestic investment 27.6 16.3 20.1 20.6 20.8 20.5 Gross domestic savings 18.2 14.3 16.6 15.3 15.3 15.0 External Sector Current account balance -9.3 -2.0 -3.5 -5.3 -5.5 -5.5 Of which: Trade balance -16.8 -6.9 -9.5 -12.6 -12.6 -12.6 Financial and capital account balance 8.3 1.7 5.5 6.3 10.1 8.5 Of which: Foreign direct investment 6.9 4.6 4.0 5.1 5.0 4.8 Change in net international reserves (increase -) 348 -51 -561 -132 -2,101 -1,500 Net international reserves (millions of U.S. dollars) 3,799 4,066 4,627 4,756 6,857 8,357 Public Finances Central government overall balance -0.3 -3.6 -5.4 -4.3 -4.6 -4.9 Consolidated public sector overall balance 1/ 0.2 -4.0 -5.5 -4.3 -4.4 -4.9 Central government debt 24.8 27.2 29.2 30.9 34.8 35.9 Consolidated public sector debt 2/ 27.3 29.2 30.6 33.2 38.1 39.5 Sources: Central Bank of Costa Rica; Ministry of Finance; and IMF staff projections.
1/ The consolidated public sector balance comprises the central government, decentralized government entities, public enterprises, and the central bank, but excludes the Instituto Costarricense de Electricidad (ICE). 2/ The consolidated public debt nets out central government and central bank debt held by the Caja Costarricense del Seguro Social (social security agency) and other entities of the nonfinancial public sector.


Statement by Mr. Rojas and Mr. Cosenza Jimenez on Costa Rica February 22, 2013
On behalf of our Costa Rican authorities, we would like to thank staff for a well-written set of papers on the Costa Rican economy. The Article IV report adequately reflects the constructive dialogue between our authorities and staff during the consultation process in December, and is a good indication of the collaborative relationship between Costa Rica and the Fund. As a small and highly integrated economy, Costa Rica has a significant stake on an environment that promotes a well-functioning global economy. My authorities see their productive engagement with the Fund as part of their contribution to that environment.
Background
In 2012 Costa Rica grew 5.1 percent (yoy), compared to an average growth of 4.7 percent in 2010-11. Most industries were more dynamic in 2012 compared to 2011, including manufacturing, services, commerce, construction and agriculture. The expansion in economic activity was also supported by buoyant credit, which grew at 14.4 percent, though dollar-denominated credit grew at a much higher rate of 19 percent.
Costa Rica has managed to lower its inflation rate to 4-6 percent since 2009, after posting double-digit inflation for almost 30 years. This achievement was underpinned by the strengthening of the Central Bank’s operational framework. The authorities are committed to adopt a full inflation targeting framework once economic conditions are appropriate. Concerns remain that the removal of the exchange rate band may result in abrupt appreciation of the colón as long as international interest rates in developed countries remain at historic lows and keep appreciation pressures on an already overvalued exchange rate.
Owing to a dynamic private sector and strong public sector financing requirements, pressure on domestic interest rates increased steeply during the first quarter of 2012 and persisted through the third quarter. Net external public financing was negative during this period as external debt amortization surpassed new external borrowing, adding to pressures on the domestic credit market. In this context, the Costa Rican Congress approved a new international bond issuance program for up to US$4 billion over a 10-year period with a maximum amount of US$1 billion per year. The Government placed $1 billion (2.2 percent of GDP) in November 2012 after nearly eight years of absence in the international bond markets. This bond placement, together with significant private capital inflows and coordinated action by Treasury and Central Bank to reduce public sector competition for funds in the credit market, contributed to a sizable decline in domestic interest rates (400 basis points on 10-year local currency Government bonds), compared to 2011.
The Central Government deficit in 2012 was 4.4 percent of GDP, lower than originally envisaged at the beginning of the year, due to the combination of current expenditure contention

2
policies and the strong effort by domestic tax and customs administrations to curb evasion and smuggling. Additionally, the 10-year US$1 billion international bond placement at 4.25 percent interest, the lowest rate ever for a Costa Rica sovereign, has allowed the authorities to improve the profile of Costa Rica’s debt.
Monetary Policy
Along with the international bond placement in November 2012, private portfolio inflows surged from September 2012 to January 2013, putting appreciation pressure on the exchange rate and complicating the conduction of monetary policy. The Central Bank made significant purchases of foreign exchange to defend the exchange rate band, well exceeding foreign exchange purchases scheduled for 2012. Aside from the impact of these operations on monetary aggregates and associated sterilization costs, the authorities were particularly concerned over the volatile nature of such inflows and their potentially destabilizing impact on prices and on the financial sector. Furthermore, the current monetary imbalance coupled with a high interest rate differential posed a significant challenge for monetary authorities.
As a result, the authorities decided to seek approval from Congress for expanded powers in order to impose temporary measures (six months, but renewable if conditions so require) and only in the context of an external disequilibrium produced by portfolio inflows. Such powers would allow authorities to increase the tax rate on bond interest paid to non-residents and to impose non-remunerated deposits on foreign capital inflows directed toward the purchase of bonds placed in the Costa Rican market. Since the draft law was submitted to Congress four weeks ago, portfolio inflows have receded and Central Bank foreign exchange purchases have practically ceased. The draft law will not impact international bond placements by non-financial public institutions and will preserve the rules of the game for investors that made domestic bond purchases before changes in such tax rates or non-remunerated deposits take place.
Fast growth in private sector credit during 2012 increased inflationary risks and its dollar-denominated component heightened the risks faced by unhedged borrowers, whose capacity to pay may be impacted by exchange rate depreciation. As a result, the Central Bank has imposed a temporary ceiling on dollar-denominated and total credit growth. These ceilings are consistent with 9 percent and 12.2 percent annualized growth rates in dollar-denominated and total credit, respectively, and with the economy’s projected nominal growth of about 11 percent in 2013.
The Central Bank is prepared to tighten monetary policy in the event that inflationary pressures arise, as long as this does not trigger a new surge in capital inflows. Through successful negotiations with state banks and weekly open market operations, in February the Central Bank withdrew a large fraction of the excess liquidity that resulted from foreign exchange purchases over the past three months.

3
3
Fiscal Policy
Despite efforts to enhance revenue and contain expenditures, ongoing since 2010, the authorities recognize the need for additional efforts to reduce the fiscal deficit, now over 4 percent of GDP, to levels that are sustainable over the medium term. The Government considers that a fiscal consolidation effort of about 2.5 percent of GDP is required over the period 2014-18, and should include measures on both the revenue and expenditure sides.
A key element of this strategy is tackling the public sector’s structural challenges in expenditure and financing. The government is already analyzing how to improve the compensation system for public employees in order to make it more equitable and efficient, as well as how to optimize resource management in the entire state apparatus and contain interest payments. By accessing the international market and extending maturities of new debt in the domestic market, the Government is improving its liquidity management and debt structure.
The fiscal consolidation program will be developed in three stages. The starting point will be the tax reform agreements reached over the past two years in the context of the tax reform that was voided by the Constitutional Tribunal in 2012. This will need to be supplemented with additional initiatives arising from meetings with think tanks, social sectors, the media and political parties in the first stage, which will conclude by June 2013 with the publication of a proposal that will be the centerpiece of a National Dialogue in a second stage. The document will include policy actions both on structural spending, improvements to minimize tax evasion and fraud, and tax reform.
During the second stage, the Government will engage all sectors of society to improve the proposal. At this point, the participation of the presidential candidates of the major political parties would be sought. Once a consensus is reached on the fiscal proposal, the Government will present it to Congress in the form of one or several draft laws aiming for Congress approval before the new government takes office in May 2014.
As in many other developing and developed countries, demographic changes are likely to strain the public pension system in the long term and will require parametric adjustments either in pension contributions, pension benefits or retirement age. The Costa Rican authorities are already looking into the issue and are in the process of undertaking an actuarial study that may determine the real size of the actuarial deficit over the long term, the effectiveness of alternative measures and adequate timing to deal with the issue.
Our authorities strongly believe that guaranteeing Public Sector solvency is an issue of national interest that goes beyond any particular government. They see the 2013-14 electoral process as an opportunity for the government, political parties, and all sectors of the economy to seek and agree on a comprehensive and balanced solution safeguarding the sustainability of Costa Rica’s public policies in the long run.

4
Financial Sector Issues
The Superintendence of Financial Institutions (SUGEF) has set as a strategic goal the implementation of risk-based supervision, which would start operating in 2014. The authorities will proceed, in line with the recommendations of the 2008 FSAP update, with the modification of existing prudential legal framework for the effective implementation of this approach, together with the final drive for the approval of two projects already submitted to Congress and which seek to strengthen the financial framework and disciplinary penalties.
The authorities are committed to a gradual transition to Basel III, centered on the issues of liquidity and prudential regulations. Given the current situation in terms of capital inflows to the country, SUGEF proposed to the National Supervisory Council of the Financial System, CONASIF, stricter rules on currency matching and maturity, as well as strengthening criteria on risk evaluation for dollar-denominated credits. The CONASIF is expected to approve the measures in the following weeks.
Finally, in November 2011 CONASSIF created the Macroprudential Surveillance Committee in order to strengthen the financial system's ability to identify and mitigate potential systemic risks. In 2012, the committee held, in coordination with the other regulators, a stress exercise of the financial system that was conceived as a pilot for both regulatory bodies and supervised entities, and which will be repeated periodically. This test identified weaknesses in terms of conceptual, methodological consistency, communication and coordination issues that will be shared with the financial entities shortly.