imf country report no. 14/93 islamic republic of iran · ©2014 international monetary fund imf...
TRANSCRIPT

©2014 International Monetary Fund
IMF Country Report No. 14/93
ISLAMIC REPUBLIC OF IRAN 2014 ARTICLE IV CONSULTATION—STAFF REPORT; PRESS RELEASE; AND STATEMENT BY THE EXECUTIVE DIRECTOR FOR THE ISLAMIC REPUBLIC OF IRAN
Under Article IV of the IMF’s Articles of Agreement, the IMF holds bilateral discussions with members, usually every year. In the context of the 2014 Article IV consultation with Iran, the following documents have been released and are included in this package: The Staff Report prepared by a staff team of the IMF for the Executive Board’s
consideration on March 28, 2014, following discussions that ended on February 8, 2014, with the officials of Iran on economic developments and policies. Based on information available at the time of these discussions, the staff report was completed on March 13, 2014.
An Informational Annex prepared by the IMF.
A Press Release summarizing the views of the Executive Board as expressed during its March 28, 2014 consideration of the staff report that concluded the Article IV consultation with Iran.
A Statement by the Executive Director for Iran.
The following document has been or will be separately released. Selected Issues Paper
The publication policy for staff reports and other documents allows for the deletion of market-sensitive information.
Copies of this report are available to the public from
International Monetary Fund Publication Services PO Box 92780 Washington, D.C. 20090
Telephone: (202) 623-7430 Fax: (202) 623-7201 E-mail: [email protected] Web: http://www.imf.org
Price: $18.00 per printed copy
International Monetary Fund Washington, D.C.
April 2014

ISLAMIC REPUBLIC OF IRAN STAFF REPORT FOR THE 2014 ARTICLE IV CONSULTATION
KEY ISSUES Context. Iran had achieved considerable progress in raising per capita income and living standards in previous decades. But in recent years, such progress stalled as both domestic policies and the external environment deteriorated. Inflation has increased sharply and non-oil growth is well below potential. Corporate and financial-sector vulnerabilities have emerged, and unemployment rates are high. A difficult external environment and domestic vulnerabilities raise the risk of entrenching the economy in a low-growth high-inflation scenario. The authorities are well aware of the challenges and the reforms needed, but face a highly-complex institutional set-up and socio-political context. Advancing reforms will require broad political commitment and needs to be supported by strong coordination and cooperation among key policymakers.
A highly uncertain outlook. Facing continued constraints on oil revenues and to carry out international transactions, the economy is expected to continue to contract in 2013/14. With some positive tailwinds from the external side and modest incipient signs that the pace of contraction in domestic demand is slowing, economic activity would begin to stabilize in 2014/15. While the current outlook is subject to downside risks, the interim agreement with the P5+1 also brings upside risks. Were this progress to derail, the economy could be subject to new adverse shocks.
Dealing with stagflation. The policy mix should support the economy while also gradually reducing inflation. Fiscal deficits should be contained at around 2–3 percent of GDP, by broadening the revenue base away from oil and by keeping a tight lid on spending. This should be complemented by reforms that boost the supply side (product, labor, and credit markets) as well as the demand side (to restore monetary policy credibility, reduce uncertainty, and better coordinate fiscal management).
March 13, 2014

ISLAMIC REPUBLIC OF IRAN
2 INTERNATIONAL MONETARY FUND
Subsidy Reform. Iran’s design of the subsidy reform has been exemplary and the reform remains a priority. Plans to increase domestic energy prices gradually are prudent but should be underpinned by an automatic price adjustment mechanism to ensure full implementation, by consistent macroeconomic policies, and by reforms to foster the adoption of new technologies and tighter budget constraints, particularly in energy-intensive sectors.
Strengthening the Policy Framework. Fiscal reforms should empower the scope for countercyclical fiscal policy, better support macroeconomic stability, and be framed within a medium-term expenditure planning to limit fiscal risks. Priority needs to be given to price stability, by improving the mandate and operational autonomy of the Central Bank of Iran and by reviewing government-mandated credit policies. Work to unify the exchange rate should be initiated, while preserving flexibility ahead to ensure competitiveness.
Reforms to Promote Growth and Jobs. There is a need to improve business regulations, advance effective privatizations, and reduce nonwage labor costs. Addressing weaknesses in the banking system is important, including by improving the supervisory and crisis preparedness frameworks.

ISLAMIC REPUBLIC OF IRAN
INTERNATIONAL MONETARY FUND 3
Approved By Alfred Kammer and Taline Koranchelian
Discussions took place in Tehran during January 25–February 8, 2014. Staff representatives comprised R. Blotevogel, M. Cerisola (head), O. Demirkol, R. Zytek (all MCD), and G. Esposito (LEG) and were assisted by Mr. Monajemi (OED). Messrs. Kammer (MCD) and Mojarrad (OED) participated in the concluding discussions. The team met with Central Bank of Iran (CBI) Governor Seif, Minister of Economy and Finance Taiebnia, Vice President of Management and Planning Office Noubakht, the President’s Chief of Staff Nahavandian, and other senior public officials, as well as representatives from the private sector and academia.
CONTENTS
CONTEXT _________________________________________________________________________________________ 5
A BRIEF LOOK AT ECONOMIC DEVELOPMENTS OVER THE PAST THREE YEARS _____________ 6
NEAR-TERM RISKS AND THE MEDIUM-TERM OUTLOOK ____________________________________ 11
POLICY DISCUSSIONS __________________________________________________________________________ 12
OTHER ISSUES ___________________________________________________________________________________ 27
STAFF APPRAISAL ______________________________________________________________________________ 28 BOXES 1. Chronology of Some Significant Economic and Political Events 2011–13 _______________________9 2. The Mehr Housing Project and Its Macroeconomic Implications ______________________________ 13 3. A Brief Look at the Implementaton of the Subsidy Reform and the Next Steps _______________ 17 4. Labor Market Issues and Unemployment in Iran ________________________________________________ 25 FIGURES
1. A Look Back at Economic Performance ________________________________________________________ 31 2. Macroeconomic Indicators, 2000/01–2013/14 _________________________________________________ 32 3. Macroeconomic and Price Developments, 2007/08–2012/13 _________________________________ 33 4. Stock Market Indicators, 2010–13 _____________________________________________________________ 34 5. Business Environment Indicators, 2005–13 ____________________________________________________ 35

ISLAMIC REPUBLIC OF IRAN
4 INTERNATIONAL MONETARY FUND
TABLES
1. Selected Macroeconomic Indicators, 2011/12–2015/16 _______________________________________ 36 2. Balance of Payments, 2011/12–2015/16 _______________________________________________________ 37 3. Statement of Government Operations, 2011/12–2015/16 (In billions of Rials) ________________ 38 4. Statement of Government Operations, 2011/12–2015/16 (In percent of GDP) ________________ 39 5. Central Bank Balance Sheet, 2011/12–2015/16 ________________________________________________ 40 6. Monetary Survey, 2011/12–2015/16 ___________________________________________________________ 41 7. Vulnerability Indicators, 2010/11–2013/14 ____________________________________________________ 42 8. Medium-Term Scenario, 2011/12–2019/20 ____________________________________________________ 43 APPENDICES
I. Risk Assessment Matrix _______________________________________________________________________ 44 II. Illustrative Medium-Term Scenarios___________________________________________________________ 45 III. External Sustainability and Exchange Rate Assessment _______________________________________ 47 IV. Debt Sustainability Analysis ___________________________________________________________________ 51

ISLAMIC REPUBLIC OF IRAN
INTERNATIONAL MONETARY FUND 5
CONTEXT 1. Over the past two decades, Iran had achieved considerable progress in raising per capita income and living standards. This progress was largely underpinned by investment, rising employment-to-population and productivity since the early 1990s, and by high terms of trade since the early 2000s (Figure 1). To a large extent, Iran has continued to benefit from its vast hydrocarbon wealth, as well as from being a relatively diversified resource-intensive economy. Social indicators show declining poverty and income inequality, supporting a relatively high level of human development. Notwithstanding this progress, per capita income and living standards were still below other resource-intensive economies.
2. Such progress stalled during the past several years. Large shocks and weak macroeconomic management have had a significant impact on macroeconomic stability and growth. With a long history of high inflation and facing large relative price changes, macroeconomic policies leading to and following the subsidy reform in 2010, remained accommodative to ease corporate adjustment and support household transfers, while also exhibiting high volatility and some procyclical trends. At the same time, the implementation of certain ambitious social programs, such as for housing, significantly compounded these problems. The intensification of international trade and financial sanctions since 2012 brought renewed shockwaves to the economy, further undermining macroeconomic conditions significantly.
3. The policy response to these shocks prioritized output over inflation stabilization, and exposed the limitations of and the need to rethink the policy framework. The large relative price change associated with the subsidy reform led to a significant increase in inflation and a deceleration in non-oil growth in 2011, which were exacerbated by the deterioration in the external environment in 2012. The policy response aimed to prioritize output over inflation stabilization by continuing to accommodate the financing demands of the corporate and government sectors. Following the intensification of economic sanctions, greater exchange rate flexibility helped to buffer output to some extent but, as monetary policy remained accommodative, such flexibility resulted in a sharp rise in inflation. All in all, macroeconomic policies contributed to a significant rise in the level and volatility of inflation and output since the mid-2000s, and corporate and financial sector vulnerabilities have now emerged, with unemployment at high levels. And while it would have been difficult for the authorities to have fully buffered the economy from the recent shocks, the policy framework did not provide sufficient resilience and the policy response did not appear sufficiently timely, well-implemented, and coordinated.
4. Iran now stands at a crossroad. The external environment remains uncertain and delaying domestic reforms raise the risk of entrenching the economy in a low-growth and high-inflation scenario, underscoring the need to address long-standing weaknesses in the policy framework and the economy. The new administration that took office in August 2013 earned a strong mandate and has already made significant progress in improving the external environment and confidence in the outlook. The administration’s 100-day report confirmed how well aware the authorities are of the

ISLAMIC REPUBLIC OF IRAN
6 INTERNATIONAL MONETARY FUND
economic challenges ahead and many of the reforms needed. But the task of advancing reforms ahead will be difficult, not least due to a highly complex institutional set-up and a difficult socio-political context. This will require broad political commitment, supported by strong coordination and cooperation among key policymakers. The 2014 Article IV Consultation provided a timely opportunity to discuss and assess these issues.
A BRIEF LOOK AT ECONOMIC DEVELOPMENTS OVER THE PAST THREE YEARS 5. Macroeconomic performance worsened markedly following the subsidy reform in late 2010 and the intensification of sanctions in 2012.
The economy slowed down markedly following the subsidy reform launch in December 2010. A large relative price change brought a significant deceleration in economic activity, particularly in the industrial sector. Real non-oil GDP growth decelerated from about 7½ percent in the quarter prior to the reform to about 2 percent a year later. From the demand side, the sources of growth also narrowed, with growth exclusively led by private consumption, as investment declined sharply (Table 1 and Figure 2).
Twelve-month inflation doubled in 2011. It accelerated from about 13 percent on the eve of the subsidy reform to about 22 percent by December 2011. This owed much to the pass-through from the adjustment in subsidized prices for food and energy, as producer price inflation rose from 12 percent to 39 percent (y/y) during the same period. This relative price change also took place against a backdrop of administrative measures, such as price monitoring and the use of strategic inventories of key staples, as well as some tightening of macroeconomic policies, which helped limit the pass-through.
1980
1981 1982
1983
1984 1985
19861987
1988
1989
1990
1991
1992
1993
1994
1995
1996
19971998
1999
20002001
200320022004
20052006
2007
2008
2009
2010
2011
2012/13
2013/14
0
10
20
30
40
50
-15 -10 -5 0 5 10 15
Infla
tion
Real GDP Growth
Growth and Inflation, 1980–2013(In y-o-y percent change)
Source: Iranian authorities.

ISLAMIC REPUBLIC OF IRAN
INTERNATIONAL MONETARY FUND 7
Since early 2012, international trade and financial sanctions brought renewed shockwaves and pushed the economy into a deep contraction. A series of sanctions restricting oil exports, the supply chain of some key sectors (like automobiles), and transactions of international and domestic banks, impaired Iran’s ability to conduct international current and capital transactions and brought a sharp decline in income (Box 1). Oil production fell to a 20-year low, oil-export proceeds declined by more than half (by about 15 percent of GDP), and the rial lost about 80 percent of its value in the bureau/parallel market. Key sectors, such as automobiles, experienced severe disruptions in production, including from administered-price policies. These shocks imparted significant contractionary effects on the economy, with real GDP declining by almost 6 percent in 2012/13. During the first half of 2013/14, real GDP is estimated to have declined by about 2½ percent, compared with the same period in the previous year.
The authorities abandoned their managed exchange rate regime. Following a sharp depreciation in the bureau/parallel market in September 2012, the Central Bank of Iran (CBI) introduced a new Foreign Exchange center (FX center), mostly supplied with hydrocarbon export receipts. The CBI initially offered foreign exchange for most current transactions at an official rate of 2 percent below the rate offered in the bureau/parallel market, while maintaining the previous official exchange rate for basic necessities. With the bureau/parallel market rate continuing to depreciate, the 2 percent target was eventually abandoned, with three exchange rates (an official for basic necessities, one for other current transactions (FX center), and a bureau/parallel market rates) available for transactions. With the premium in the foreign exchange market (between the bureau/parallel and the FX center rates) still high, at around 50 percent, loose monetary conditions, and new sanctions being introduced in early 2013, the authorities eventually unified official exchange rates in June 2013. Market conditions have stabilized since the Presidential elections in mid-June, with the rial appreciating by about 20 percent in the bureau/parallel market and the premium declining to about 20 percent in recent months (Figure 3).
-10
-5
0
5
10
15
20
-1.0
-0.5
0.0
0.5
1.0
1.5
2.0
2005 2006 2007 2008 2009 2010 2011 2012
Automobiles (in millions)
Production of large manufacturing establishments (Index in y-o-y percent change, RHS)
Sources: International Organization of Motor Vehicle Manufacturers (OICA); and Central Bank of Iran.
Manufacturing and Automobile Production

ISLAMIC REPUBLIC OF IRAN
8 INTERNATIONAL MONETARY FUND
Throughout these shocks, monetary conditions were relatively accommodative and inflation continued to accelerate. In the wake of the subsidy reform, the CBI tightened base money but did not succeed in reducing money growth significantly, as specialized and other banks continued to expand credit to the private sector at rates exceeding 30 percent in 2011. Domestic interest rates became increasingly negative, the exchange rate premium began to widen, and domestic asset prices continued to rise rapidly (Figure 4). In January 2012, the CBI decided to increase its rate for participation papers and for other short-term rates. But lending and deposit rates were subsequently kept fixed as part of the government and Money and Credit Council’s (MCC) credit policies.1 M2 growth accelerated toward 30 percent, with M1 declining markedly in real terms by end-2012/13. Twelve-month inflation rose to 45 percent due to loose monetary conditions and the unification of the official exchange rates, reflecting a trend visible during the last decade, when macroeconomic policies contributed to keep tradable and nontradable inflation at high levels. More recently, the CBI has kept a lid on base money growth thanks to tighter credit to the banking system and some fiscal consolidation, the exchange rate in the bureau/parallel market has appreciated, and 12-month inflation has declined to about 29 percent in January 2014 (Figure 3).2
1 In early 2012, the MCC allowed banks to determine deposit rates. But this failed to translate into greater flexibility and link with inflation, as lending rates for transactional contracts remained subject to officially-mandated caps. 2 In March 2013, the CPI basket was updated to reflect 2011 household spending patterns and entailed a 4½ percentage point higher weight for services (housing, health, and communications) relative to goods (food, clothing, and furniture).
0
10
20
30
40
50
60
0
10
20
30
40
50
60
Dec-10 Jun-11 Dec-11 Jun-12 Dec-12 Jun-13 Dec-13
Private-sector credit
M1
M2
Source: Iranian authorities.
Money and Credit Growth(In y-o-y percent change)
0
5
10
15
20
25
30
0
10
20
30
40
50
Jan-
00
Jan-
01
Jan-
02
Jan-
03
Jan-
04
Jan-
05
Jan-
06
Jan-
07
Jan-
08
Jan-
09
Jan-
10
Jan-
11
Jan-
12
Jan-
13
Jan-
14
Inflation
Exchange rate (in thousands of Rial/USD; RHS)
Source: Iranian authorities.
Inflation and the Exchange Rate(In percent)
0
10
20
30
40
50
60
70
Jan-
00
Jan-
01
Jan-
02
Jan-
03
Jan-
04
Jan-
05
Jan-
06
Jan-
07
Jan-
08
Jan-
09
Jan-
10
Jan-
11
Jan-
12
Jan-
13
Jan-
14
Goods (tradables)
Services (nontradables)
CPI Inflation(In y-o-y percent change)
Source: Iranian authorities.

ISLAMIC REPUBLIC OF IRAN
INTERNATIONAL MONETARY FUND 9
Box 1. A Chronology of Significant Economic and Political Events, 2011–13
A series of significant external and domestic events took place since the last Article IV Consultation in 2011. These events have shaped the course of economic policy making.
1 November 2011 U.S. identifies Iran as a jurisdiction of primary money laundering concern and determines that Iran’s financial system, including the central bank, constitutes a threat to governments or financial institutions that do business with these banks. Britain and Canada stopped doing business with Iranian financial institutions as well as the central bank.
2 December 2011 The U.S. adopts legislation to sanction foreign banks that deal with Iran’s central bank unless the parent country of the bank significantly reduces its oil purchases from Iran, which is to be reviewed every six months. The new sanctions start to apply to non-oil transactions with the central bank by end February 2012 and to oil related transactions by end June 2012.
3 January 2012 The EU decides to freeze new contracts to purchase Iranian oil and to wind down existing contracts by July 1, 2012. Also, the EU decision bans insurance for shipping oil or petrochemical products, stops all trade with Iran in petrochemicals and precious metals and stones and freezes the assets of the central bank.
4 January 2012 The parallel market exchange rate depreciates by 25 percent. In response, the central bank depreciates the official exchange rate by 8.5 percent and increases profit rates for deposits by 5 percentage points.
5 March 2012 Society of Worldwide Interbank Financial Telecommunications (SWIFT) cuts off sanctioned Iranian banks from its network.
6 May 2012 A new U.S. Executive Order gives the U.S. Treasury Department the ability to identify and sanction foreign persons who help Iran evade U.S. and other multilateral sanctions.
7 June 2012 U.S. regulators fine a large financial institution in violations of the sanctions regime.
8 July 2012 The EU oil embargo and accompanying insurance ban on shipping of oil or petrochemical products, and the U.S. legislation requiring reductions in oil imports from Iran and banning purchase of Iranian petrochemical products take effect.
9 August 2012 U.S. regulators fine another large financial institution in violations of the sanctions regime.
10 September 2012 Parallel market exchange rate depreciates by about 30 percent and the central bank introduces a Foreign Exchange Center for foreign exchange transactions.
11 October 2012 The rial depreciates sharply in the parallel market. The EU bans transactions between European and all Iranian banks unless specifically authorized, prohibits provision of short term export credits, guarantees, and insurance to Iran and forbids provision of flagging and classification services for Iranian tankers and cargo vessels.
12 November 2012 The U.S. Treasury Department announces that financial transactions with National Iranian Oil Company would be sanctioned.
13 February 2013 New U.S. measures take effect preventing Iran from bringing its hard currency back to Iran and barring transfer of those proceeds to a third country for payments, thereby compelling Iran to buy the products of the oil importing country. U.S. legislation also bans supplying or transferring precious metals, in particular gold, to Iran.
14 February 2013 The EU General Court rules that the EU should lift the sanctions imposed on one of Iran's largest banks.
15 June 2013 Presidential elections take place in Iran. The parallel exchange rate appreciates by about 10 percent.
16 July 2013 The U.S. adopts new measures sanctioning companies that supply goods or services to Iran’s automotive sector or finance transactions with this sector. Also, the U.S. measures banning provision of underwriting, insurance and reinsurance services for broad range of activities in Iran including shipping of oil and shipbuilding take effect.
17 July 2013 Central Bank of Iran unifies its two official exchange rates at the more depreciated official rate.
18 August 2013 President Rouhani’s government takes office. The parallel market exchange rate appreciates by an additional 10 percent after the Presidential elections.
19 September 2013 The EU General Court rules that measures against Iran’s largest shipping company should be lifted.
20 November 2013 Iran reaches an interim agreement with P5+1 over its nuclear program.
5,000
10,000
15,000
20,000
25,000
30,000
35,000
40,000
45,000
5,000
10,000
15,000
20,000
25,000
30,000
35,000
40,000
45,000
Jun-11 Nov-11 Apr-12 Sep-12 Feb-13 Jul-13 Dec-13
Official Rate
Parallel Rate
FX Center Official Rate
Iran: FX Rates, June 2011–December 2013(In rials per dollar)
12
3,45 6 7
89
10
11
12
13,1415
16,17
2018 19
Source: Central Bank of Iran.

ISLAMIC REPUBLIC OF IRAN
10 INTERNATIONAL MONETARY FUND
The fiscal position deteriorated significantly. Facing about 10 percentage point of GDP decline in total revenues since 2010/11, the authorities cut spending by close to 6 percentage points of GDP (with capital spending comprising about two-thirds of the cut). As a result, the overall fiscal balance shifted from a surplus of 3 percent of GDP in 2010/11 to an estimated deficit of 1 percent of GDP in 2013/14 (Tables 3 and 4). The cash deficit of the Targeted Subsidies Organization (TSO) remained high, at an estimated 1–2 percent of GDP in the same period, bringing the expanded overall deficit to about 2¼ percent of GDP in 2013/14 (Figure 2).
The financial system was also adversely affected. Banks’ asset quality and profitability have been significantly affected by the combination of sanctions and rigid government credit policies (Tables 5, 6, and 7). Reported nonperforming loans (NPLs) peaked at 17 percent of total loans in 2012/13 (almost 10 percent of non-oil GDP), largely mirroring external trade and cash flow problems in the corporate sector, particularly state-owned enterprises (SOEs).3 Credit to the private sector grew by 21 percent (year-on-year) in December 2013, implying a decline of about 6 percent in real terms. Lending activity of state-owned banks was the most sluggish, as these banks were heavily exposed to weak corporate borrowers. Despite these challenges, private-sector deposit growth (year-on-year) outpaced credit growth by 6 percentage points as of December 2013.
The balance of payments remained in surplus, but external arrears emerged as international sanctions impaired access to foreign exchange. Iran’s current account surplus declined to 6½ percent of GDP in 2012/13, almost halving from the year before (Table 2). The sharp fall in oil exports was the main factor, partly offset by import compression. The deficit of the capital account remained contained, leaving the overall balance of payments in a surplus of 3½ percent of GDP in 2012/13. Gross foreign assets of the CBI rose to about $104 billion by end-2012/13. The liquidity of official reserve assets remained tight, and some external creditors have reported rising public and private external arrears, mostly related to lack of access to hard currencies for repayment.
There was a limited and temporary easing of economic sanctions in November 2013. Under the interim agreement with the P5+1 in November 2013, Iran’s crude oil sales would be allowed to stabilize at the level of around 1 million bpd and Iran could access US$4.2 billion of its own funds held abroad in the six months, following the agreement taking effect on January 20, 2014. Sanctions on Iran’s petrochemical exports, the automobile industry, and on the trading of gold and precious metals, were also waived temporarily, potentially providing US$1.5 billion in revenue. The United States and the European Union have also committed to establish a financial channel to facilitate humanitarian trade with Iran, including for civil aviation needs and to enable payment of tuition fees for Iranian students abroad. All in all, Iran would be able to dispense about US$6–7 billion (2 percent of GDP) during the six months following its implementation on January 20, 2014. The interim agreement maintained the sanctions against the Central Bank of Iran and other domestic financial institutions.
3 NPLs could be underreported given past supervisory forbearance and weak loan classification standards.
ISLAMIC REPUBLIC OF IRAN
INTERNATIONAL MONETARY FUND 11
NEAR-TERM RISKS AND THE MEDIUM-TERM OUTLOOK 6. The near-term outlook remains highly uncertain, with the distribution of risks becoming more balanced but still tilted to the downside. Facing continued constrained prospects for oil revenues and to conduct international trade and financial transactions, staff expects the economy to continue to contract in 2013/14, with real GDP estimated to decline by 1¾ percent. With some positive tailwinds from the external side and some incipient signs that the pace of contraction in domestic demand is slowing, it is projected that economic activity would begin to stabilize in 2014/15, with real GDP projected to increase by 1–2 percent. The real exchange rate depreciation has continued to provide impetus to sectors such as agriculture, parts of manufacturing, and non-oil exports, and prospects for hydrocarbons and manufacturing have also improved. But the current outlook remains highly uncertain and subject to several downside risks, most notably from a difficult external environment and from failure to address high unemployment (Appendix I). In the meantime, the authorities are taking steps to make the regulatory framework for foreign investment in the oil sector more attractive, while the interim agreement with the P5+1 brings upside risks. Nonetheless, were this progress to derail, the economy could be subject to new adverse shocks. In any event, staff’s baseline scenario—which is based on sustained constraints for oil revenues and to conduct international transactions—shows that growth would remain below potential and inflation would remain high (Table 8).
7. Even with a sustained improvement in the external environment, medium-term prospects hinge on strengthening the overall policy framework and on boosting overall investment and productivity (Alternative scenario in Appendix II). Comprehensive structural reforms would be required to improve the business environment, enforce budget constraints and restructure the corporate sector (to reduce its dependence on subsidies and energy intensity in production), promote private sector investment, allow the financial sector to better allocate savings and handle risks, and address high unemployment. At the same time, the hydrocarbon sector faces large investment needs at a time when the call on OPEC is on a downward path. Being an already well-diversified economy with a large domestic market provides a good starting point to advance reforms. Nonetheless, the overall institutional policy and regulatory frameworks for product and labor markets lag in global competitiveness. Reforms are needed to improve the business environment to attract investment to boost productivity, and help restore sustainable growth and employment.

ISLAMIC REPUBLIC OF IRAN
12 INTERNATIONAL MONETARY FUND
POLICY DISCUSSIONS 8. The policy discussions focused on how to restore macroeconomic stability and address long-standing challenges in the policy framework and the structure of the economy to achieve sustainable growth. The Fund’s past policy advice and technical assistance has had some important impact on fiscal policy and statistics. The authorities made progress in implementing a VAT, enhancing tax administration, adopting the Government Financial Statistics Manual (GFSM, 2001), and becoming a Global Data Dissemination Standard (GDDS) member. Nonetheless, many of the past recommendations—on monetary, interest and exchange rates policies and on the policies to support the subsidy reform have been difficult to implement and remain relevant, especially in light of the constraints posed by the external environment. Against this backdrop, the discussions focused on:
Dealing with Stagflation: A Three-Pronged Strategy Centered on Tighter Monetary Policy, Some Fiscal Consolidation, and Supply-Side Reforms
9. The authorities emphasized that focusing on disinflation was the best means to address stagflation. CBI senior officials stressed that they have taken important steps to reduce inflation. A tight control of base money over the past seven months has been underpinned by a government-supported agreement to remove the financing of the Mehr Housing Program from the CBI’s balance sheet. The authorities saw this agreement as a significant achievement and signal to the economy of the commitment to reduce inflation (Box 2). The tight control of base money, along with the appreciation of the currency and a decline in global prices for some key staples helped to bring down inflation quickly. Looking ahead, CBI authorities remained confident that inflation prospects would continue to improve, as they saw the amendments to the 2013/14 budget and the new 2014/15 budget as critical in helping to strengthen the overall consistency of macroeconomic policies. CBI senior officials also stressed their commitment to contain money growth by placing participation papers at higher profit (interest) rates.4 It was agreed that a gradual tightening of monetary policy would have limited output costs, help anchor expectations and entrench disinflation, and also help contain the second-round impact from the planned increase in domestic energy prices. 4 There are two types of lending contracts: transactional and participatory. Transactional contracts involve the financing of working capital, and the CBI fixes their interest rates by industry. Participatory ones involve the financing of some longer-term investment activity. The bank, and the depositor financing the loan, is entitled to a share of the profit from these investments. As the amount of profits is not known at the time when banks collect the deposit and make the loan, they indicate provisional profit rates. Economically, these profit rates are similar to interest rates.
0
10
20
30
40
50
0
10
20
30
40
50
Dec-09 Dec-10 Dec-11 Dec-12 Dec-13
Base Money M2
Source: Fund staff estimates based on data from Iranian authorities.
Money and Credit Growth(In y-o-y percent change)

ISLAMIC REPUBLIC OF IRAN
INTERNATIONAL MONETARY FUND 13
Box 2. The Mehr Housing Project and Its Macroeconomic Implications
Iran started an ambitious affordable housing project in 2007 to bring some two million homes to the
housing market over a five year period. The Mehr Housing Project targeted low-income families and was
triggered by growing demand for new housing by Iran’s young population, with 0.8 million additional housing
units needed every year on top of a deficit of 1.5 million housing unit estimated in 2006. Under the scheme, the
authorities provide land to private developers free of charge and new homeowners get a 99-year lease on the
publicly owned land. The housing bank (Bank Maskan) extends, among other facilities, subsidized mortgage loans
to new homeowners to finance their home purchases.
The financing of this project was placed upon the Central Bank of Iran (CBI), significantly complicating the
conduct of monetary policy. Bank Maskan relied on credit lines and other financing facilities from the CBI. In fact,
CBI financing to Bank Maskan tripled in 2010, in the run up to the subsidy reform, and doubled during the
implementation of the first phase of the reform. By end-2011, CBI financing to Bank Maskan represented about
40 percent of base money. This trend undermined the CBI’s efforts to ensure that second round effects from the
change in domestic energy prices were minimized, while also forcing the CBI to tighten credit to the rest of the
economy, with adverse implications for economic activity.
The government has stopped the CBI financing of the Mehr Housing Project but its future financing
remains uncertain. Outstanding commitments under the project and the rise in the demand for affordable
housing would require a permanent solution. To avoid any future pressure on the CBI for further financing and
increase transparency of the fiscal accounts, the authorities should consider including the project in the annual
budget and finance it through budgetary resources.
-20
-10
0
10
20
30
40
50
60
2007 2008 2009 2010 2011 2012
CBI Facilities to Maskan Bank
Other contributors
Growth in base money
Contributors to Base Money Growth(In percent of base money growth)
Sources: Central Bank of Iran; and IMF staff calculations.
0
50
100
150
200
250
300
350
400
450
500
2007 2008 2009 2010 2011 2012
CBI Facilities to Maskan Bank(In trillions of Rials)
Source: Central Bank of Iran.

ISLAMIC REPUBLIC OF IRAN
14 INTERNATIONAL MONETARY FUND
10. The authorities and staff agreed that the 2014/15 budget provided a good balance between disinflation and supporting the economy. The authorities emphasized that the approved budget continued with their task of advancing fiscal consolidation initiated with the amendment to the 2013/14 budget in late 2013. The new budget advances important tax and expenditure reforms while also maintaining a tight lid on current spending. Several ministries will participate in a pilot performance budgeting next year that will be extended to all in 2015/16 and better entrench savings on current spending. While capital spending has been prioritized and is envisaged to rebound, it would still remain well below pre-2012/13 levels. While the specifics on how to proceed with increasing domestic energy prices were still being discussed, the authorities indicated that such plans would help bring the deficit of the TSO from 1⅓ percent of GDP in 2013/14 to balance in 2014/15. These measures, along with several others on the revenue side, would help keep the overall deficit at around 2½ percent of GDP in 2014/15.
11. The authorities have also begun to broaden the revenue base away from oil. They explained their intention to broaden the base for non-oil tax revenues from 6 percent of GDP to 10 percent of GDP over the next several years. This would increasingly allow the financing of current spending through the tax system rather than oil revenues, which would be mostly allocated to capital spending.
Several reforms were being implemented to strengthen tax administration: (i) the implementation of an integrated tax system; (ii) a new framework to limit and reform tax incentives for certain activities (exports, properties, and employment taxes) and for large nontaxpayers (such as in manufacturing and large statutory bodies), and through a new structure (accelerated depreciations); and (iii) the completion of the implementation of the VAT—to reduce exemptions and strengthen the link of its collection information with direct taxation.
The authorities also explained that the scheduled increase in the VAT rate was brought forward by one year. They noted that the VAT rate could be gradually raised to around 10 percent once the trial implementation period of the VAT law expired in the next two years. They agreed that this would help bring the VAT rate more in line with other resource-intensive country levels.5
5 The VAT was introduced in 2008 and its current rate of 6 percent will be increased to 8 percent in 2014/15 instead of 2015/16. A recent FAD TA mission has continued to support reforms related to compliance and risk-management. The authorities have requested TA on the possible design and implementation of a capital gains tax.
0%
10%
20%
30%
40%
50%
60%
70%
80%
90%
100%
2000 2001 2002 2003 2004 2005 2006 2007 2008 2009 2010 2011 2012
Share of Tax Revenues in Current Expenditures(In percent of total current expenditures)
Source: Iranian authorities.
0
5
10
15
20
25
30
0
5
10
15
20
25
30
Iran
Nig
eria
Aust
ralia
Mon
golia
Papu
a N
ew G
uine
a
Bots
wan
a
Kaza
khst
an
Kyrg
yz R
epub
lic
Vene
zuel
a
Boliv
ia
Mau
ritan
ia
Sout
h Af
rica
Trin
idad
and
Tob
ago
Turk
men
ista
n
Zam
bia
Alge
ria
Azer
baija
n
Russ
ia
Chile
Uzb
ekis
tan
Nor
way
Current standard rate
Source: International Bureau of Fiscal Documentation, IBFD, www.ibfd.org (2013). Introduction data from earlier TP publications.
VAT Rates across Resource-Intensive Countries, 2013(In percent)

ISLAMIC REPUBLIC OF IRAN
INTERNATIONAL MONETARY FUND 15
The authorities underscored ongoing efforts to strengthen tax compliance. These included large taxpayers and other indirect taxes (such as on professions), and they agreed on the potential to tax activities that have experienced large gains in recent years, such as on capital gains on equity investment and real estate. It was agreed that these efforts should help limit deficits and risks, improve the quality of the envisaged fiscal adjustment, and help lay the ground for a more sustainable fiscal policy ahead. Staff noted that these efforts were critical to entrench fiscal consolidation, as the results from the PIH on the illustrative medium-term scenarios confirmed the need for further fiscal adjustment of about 1–4 percent of non-oil GDP.6
12. With the economy vulnerable at this juncture, staff stressed that the timing for advancing the subsidy reform had to be carefully considered. The subsidy reform aimed to be budget-neutral and to align domestic energy prices gradually to international ones, by shifting large implicit subsidies to explicit cash transfers to households. While its design was particularly innovative—especially for a hydrocarbon-intensive economy, its implementation was not as effective and transparent as originally planned (Box 3).7
6 The PIH calculates the net-present value of fiscal oil revenue from 2012/13 to 2050 for baseline and alternative scenarios. For the period post 2019, both scenarios assume that oil revenues stabilize at the 2019 level, and gas revenue grows by 3 percent per year. Given forecasts of non-oil revenue, the PIH calculates a level of public spending that is consistent with the net-present value of oil wealth. The PIH annuity assumes that oil wealth is spent up to 2050, while the PIH perpetuity assumes that expenditures are at a level that leaves the real value of wealth unchanged. 7 The subsidy reform law stipulated the preparation by the TSO and the Supreme Audit Court of semi-annual reports to Parliament on the status and assessment of its implementation. These reports have not been made public. A Selected Issues paper reviews the macroeconomic impact of the first phase of the reform and draws lessons for its future implementation.
50
100
150
200
250
300
350
400
8,000
9,000
10,000
11,000
12,000
13,000
14,000
15,000
16,000
17,000
18,000
Dec
-09
Jan-
10Fe
b-10
Mar
-10
Apr-
10M
ay-1
0Ju
n-10
Jul-1
0Au
g-10
Sep-
10O
ct-1
0N
ov-1
0D
ec-1
0Ja
n-11
Feb-
11M
ar-1
1Ap
r-11
May
-11
Jun-
11Ju
l-11
Aug-
11Se
p-11
Oct
-11
Nov
-11
Dec
-11
CBI exchange rate (Rials per U.S. Dollar)
Parallel market exchange rate (Rials per U.S. Dollar)
CBI credit to specialized banks (in trillions of Rials, RHS)
Source: Central Bank of Iran.
CBI Credit to Specialized Banks and the FX Market
0
2
4
6
8
10
12
14
16
18
20
0
2
4
6
8
10
12
14
16
18
20
2012 2013 2014 2015 2016 2017 2018
Baseline
PIH annuity
PIH perpetuity
Source: IMF staff calculations.
PIH Benchmarks in the Baseline Scenario—Primary Expenditures(Percent of non-oil GDP)
0
2
4
6
8
10
12
14
16
18
20
0
5
10
15
20
25
2012 2013 2014 2015 2016 2017 2018
Alternative
PIH annuity
PIH perpetuity
Source: IMF staff calculations.
PIH Benchmarks in the Alternative Scenario—Primary Expenditures(Percent of non-oil GDP)

ISLAMIC REPUBLIC OF IRAN
16 INTERNATIONAL MONETARY FUND
The authorities and staff agreed that increasing domestic energy prices was an important step to reduce energy consumption, pollution, improve the efficiency of the economy, and bring domestic prices toward international levels. The authorities acknowledged staff concerns on placing the economy through another large adverse supply shock at the current juncture and explained that the contemplated price increases were needed to address serious imbalances. Therefore, the price increases would be significantly lower than during the first phase of the reform and done gradually to minimize the impact on the economy and inflation. They agreed that such a gradual increase should be underpinned by a medium-term plan (about five years) to anchor the price increases and by an automatic price adjustment mechanism. Staff emphasized that the experience of the first phase of the subsidy reform showed that shocks could significantly undermine the stability of the exchange rate and the envisaged relative price adjustment. Consistent macroeconomic policies and reforms to tighten budget constraints in the corporate sector are crucial to make this reform sustainable.
13. The authorities agreed that reforms to boost the supply-side and productivity would also help in dealing with stagflation. While the difficult external environment limited the scope for reforms and potential benefits, they stressed that restoring policy credibility and advancing reforms to entrench disinflation were essential. First and foremost, the authorities emphasized promoting macroeconomic stability, deepening domestic capital markets to further promote long-term financing, and easing the administrative burden on the private sector. Addressing cash-flow constraints and arrears in the corporate and banking sectors were also seen as important. Senior CBI officials noted that the cash-flow constraints and interlinkages in the corporate, government, and banking sectors were complex and difficult to solve immediately. They viewed sustained disinflation and higher profit rates as means for banks to better support credit needs of the economy.
Strengthening the Policy Framework for Macroeconomic Stability
Fiscal Policy: Improving Macroeconomic Coordination and Enhancing Resilience and Efficiency
14. Staff suggested that reforms to the fiscal policy framework would strengthen the scope for countercyclical fiscal policy, limit fiscal risks, and better support macro-stability. While Iran’s fiscal framework has helped save part of the oil-price boom, the conduct of fiscal policy has exhibited some pro-cyclicality and excessive volatility. In particular, growth in public spending in real terms has tended to exceed potential non-oil GDP growth and the structural fiscal balance has been relatively volatile, especially when compared to other resource-intensive economies with fiscal rules (text table). The authorities could consider advancing several reforms that would facilitate the formulation and anchoring of fiscal policy on a rule, such as on the structural balance:
3%
4%
5%
6%
7%
3%
4%
5%
6%
7%
1995
1996
1997
1998
1999
2000
2001
2002
2003
2004
2005
2006
2007
2008
2009
2010
Potential non-oil real GDP growth (1990-2018)Annual average real spending growthAverage real non-oil GDP growth
Sources: Iranian authorities; and IMF staff estimates.
Fiscal Policy Indicators, 1995–2010(Annual growth rates, in percent)

ISLAMIC REPUBLIC OF IRAN
INTERNATIONAL MONETARY FUND 17
Box 3. A Brief Look at the Implementation of the Subsidy Reform and the Next Steps
The Targeted Subsidies Reform (TSR) is one of the most courageous moves to reform subsidies in an energy
exporting country, but has yet to fulfill its potential. Despite initial successful roll out of the TSR, its implementation
did not go as planned. Both domestic policies and external factors played a role in undermining the reform. Relatively
accommodative macroeconomic policies, deficits in the household cash transfer program, failure to impose tight budget
constraints on enterprises, and a lack of open communications and coordination problems within the government during
the implementation adversely affected the implementation of the TSR. Subsequently, the intensification of sanctions and
the large depreciation led to a reversal of the gains achieved and eventual postponement of the reform.
The initial success of the reform in driving down the consumption of subsidized products and improving income
distribution waned with the sharp increase in inflation.
After a steep reduction following the launch of the TSR,
domestic energy consumption picked up later with the real
decline in energy prices as inflation and nominal incomes
rose. Improvements in income distribution, with the poverty
rate declining by about 5 percentage points in the first three
months of the TSR and Gini coefficient by 0.04 points for the
whole year, were partially reversed by the rapid increase in
inflation and decline in real value of wages and cash transfers.
The TSR implementation faced several macro and
microeconomic problems. First, the authorities did not put
in place a supportive and coherent macroeconomic policy
package after the reform was launched to support
macroeconomic stability. The central bank continued to
finance the government’s large housing program when there
were already signs that the monetary financing was putting
pressure in the foreign exchange and asset markets, and
endangering macroeconomic stability. Also, administrative
price controls put further strain on monetary policy as
enterprises, facing administered-price measures and rising
input costs, continued to rely on subsidized credit. Furthermore, the TSR budget became a source of fiscal deficit in the
order of an estimated 1½ percent of GDP, adding to macroeconomic pressures. Second, despite being one key premise
of the TSR, there was no progress in reforming the production structure of enterprises and their energy efficiency. In the
event, the reform was also challenged by the lack of hard budget constraints at the corporate level, which thwarted price-
stabilization attempts.
0
500
1,000
1,500
2,000
2,500
3,000
2000 2001 2002 2003 2004 2005 2006 2007 2008 2009 2010 2011 2012
Oil Natural gas
Developments in Oil and Natural Gas Consumption, 2000–12(In thousand barrels per day)
Subsidy reform
starts
Source: BP Statistical Review of World Energy 2013.
0
5
10
15
20
25
30
35
2010 2011 2012 2013
Quota Above quota
Gasoline Prices 1/
(In percent of international prices)
Sources: Iranian authorities; and IMF staff calculations.
1/ Prices converted to cents per liter using the parallel market exchange rate, then taken as a share of Singapore retail gasoline prices.

ISLAMIC REPUBLIC OF IRAN
18 INTERNATIONAL MONETARY FUND
Rethink the framework that allocates oil-wealth/savings among the goals of macroeconomic stability, intergenerational equity, and development. In recent years, the Oil Stabilization Fund (OSF) has been “de facto” not operational, while the National Development Fund (NDFI) is not allowed to finance the budget.8 With NDFI receiving a fixed and increasing share of oil and gas export proceeds and no ability to finance government deficits, recent large adverse shocks have forced large public spending cuts and resort to inflationary budgetary financing. The mechanism for allocating oil revenues seems too rigid and detached from changing macroeconomic conditions. OSF resources need to be replenished to support countercyclical fiscal policy. Also, the decisions on how to distribute hydrocarbon revenues among budget financing, lending to the non-oil economy through NDFI, needs to be better coordinated to assess the fiscal impulse, limit procyclicality and enhance macroeconomic stability.
Take steps toward annual multi-year expenditure and budget planning. Iran has in place
a one-year budgeting framework, with limited requirements for formulating a fiscal policy consistent with a longer horizon. Within the annual budget bill, the authorities are not required under the law to submit a medium-term projection. A medium-term approach should help insulate the economy from oil-revenue shocks, strengthen expenditure planning, and thus reduce the volatility of expenditure.
8 The OSF was established in 2000 to insulate the budget from fluctuations in oil prices (revenues) and to generate savings to be used when prices fell, as well as to support development of the private sector. However, in 2010, the NDFI was established as a nongovernment public entity to promote development and savings, while forbidden from lending to the government.
2006 2007 2008 2009 2010 2011 2012 Std. Dev.
Structural Balance Iran (non-oil) -23.2 -18.1 -21.2 -16.1 -19.1 -17.6 -10.4 4.1 Chile 1.4 1.1 -1.0 -3.1 -2.1 -1.0 -0.4 1.6 Norway (mainland GDP) -3.0 -2.9 -3.4 -5.4 -5.5 -5.3 -5.6 1.3 Saudi Arabia 0.6 1.6 4.2 4.9 1.0 -4.0 -3.3 3.4
Source: Fund staff estimates; structural balance defined as per national authorities.
A Comparison of Fiscal Policy(In percent of GDP, unless otherwise noted)

ISLAMIC REPUBLIC OF IRAN
INTERNATIONAL MONETARY FUND 19
Broaden the coverage of fiscal accounts, their transparency and accountability. In recent years, the authorities have shifted part of their public sector accounts presentation to the Government Financial Statistics Manual 2001. However, the coverage remains limited to mostly the central government and excludes other parts of the general government such as provinces and SOEs. Also, their supervisory framework remains unclear, especially for ex-post performance and pre-emptive corrective actions.
Review quasi-fiscal activities (QFAs). NDFI senior officials emphasized that with the establishment of the NDFI, important steps have been taken in only three years to strengthen the management of oil wealth. A framework for saving a significant part of oil-revenues is now well established, which ensures its independence from the government and also strengthened its transparency.9 They noted that the financing of private non-oil projects is now done through the agency of domestic banks, which limits credit risks and reassures the quality of these domestic investments. In response to staff concerns, they explained that their financial statements and balance sheets were in the process of being finalized with the assistance of a local private firm, while the criteria for selecting commercial banks were now placing more emphasis on economic and risk management factors. In addition, based on the past experience with the OSF, they had recently finished reviewing contracts and projected cash flows and returns on loans with commercial banks. They agreed with staff that there was significant scope to enhance NDFI’s investment targets, risk-management policy, transparency, and accountability along the lines of the Santiago principles and the vast international experience. 10 Staff noted that other QFAs (such as the Mehr Housing Program) and their respective interest rate subsidies should be made more transparent and gradually incorporated into the central government budget.
9 As of the third-quarter of 2013, the Sovereign Wealth Fund Institute’s Linaburg-Maduell transparency rating for the NDFI was 5 (out of 10), similar to those of China, Russia, and Qatar, and below the minimum rating of 8 recommended to claim adequate transparency. 10 A Selected Issues paper discusses the framework supporting the NDFI and potential reforms to improve its effectiveness in light of international best practice.
0
10
20
30
40
50
60
70
2010 2011 2012 2013 /1
Inflows Disbursements (including earmarked amounts)
National Development Fund(In billions of U.S. Dollars)
Source: National Development Fund.
1/ As of December 2013.

ISLAMIC REPUBLIC OF IRAN
20 INTERNATIONAL MONETARY FUND
The Next Steps of the Subsidy Reform: A Robust Supporting Framework
15. The authorities agreed that it was essential to ensure an adequate framework for advancing the subsidy reform. It was agreed that the current deficit associated with the subsidy reform stemmed from shortcomings in its implementation, mostly related to the failure to impose budget discipline on high-energy users, as well as a higher number of households receiving cash transfers than originally planned. Specifically:
The authorities noted that future energy price increases would have to better balance competing social needs rather than increasing cash transfers to all households. The authorities explained that while they intended to maintain the framework associated with the first phase of the reform, the political support to maintain the same design going forward had waned. As a result, efforts had been mostly focused on identifying and means testing recipients with a view to only including in future phases those households deemed most vulnerable to higher domestic energy prices. But the identification of high- and middle-income groups has proved difficult and the authorities continued to work on establishing a comprehensive and reliable database of potential recipients. In the meantime, they were considering a proposal that would be implemented based on criteria using a broad range of indicators (such as the number of trips abroad per year, of luxury cars owned, professional occupation, or even re-registering beneficiaries) to exclude less vulnerable groups. The proceeds from higher energy prices would be used to support household spending on health insurance (as two-thirds of health care costs are out-of-pocket), several high-energy intensive sectors, and also increase cash transfers only to some of the most vulnerable households.
The authorities saw the reforms to tighten budget constraints at the corporate level as one of the most difficult challenges. They agreed that the experience with the first phase of the subsidy reform underscored the need to ensure that energy-intensive corporations were able to optimize their energy use and adopt new technologies, as domestic prices were gradually aligned with international ones. In this regard, they explained that diesel prices would be adjusted more gradually than other fuels to facilitate such a process, while several options were being considered to support such an adjustment and proper incentives, including the options to link financial support to concrete energy savings. The authorities also indicated their desire to announce future price increases within a medium-term horizon to increase the transparency for investors.
16. While supporting the need to advance with the reform, staff highlighted several risks. The criteria for identifying and excluding less vulnerable groups had to be simple, transparent, and perceived as fair. In addition, the distribution of resources for supporting energy-intensive sectors should effectively foster the adoption of new technologies and tighter budget constraints. The extent of the difficulties facing energy-intensive sectors likely exceeds the contemplated resources, making the criteria for accessing such support critical. In subsequent stages of the reform, staff noted the scope to make direct cash transfers more conditional on social goals and also tilted toward savings for the broader population. Consideration could also be given to phasing out the cash transfers to the population and potentially replacing them with a consolidated public

ISLAMIC REPUBLIC OF IRAN
INTERNATIONAL MONETARY FUND 21
framework that distributes oil wealth or with a scheme to promote private savings. The authorities could also make the lessons from the first phase of the reform well known to the public, to muster support to future phases of the reform and to assist other countries in their reform efforts.
Monetary Policy and the Exchange Rate: Reforms to Strengthen Price Stability
17. The authorities and staff agreed that the monetary policy framework needs to be strengthened. Staff noted that the shocks and policy response in recent years showed that the CBI had to deal with competing demands without a mandate focused on price stability. In addition, staff stressed that the CBI’s operational effectiveness had been undermined by the institutional decision-making process. The Money and Credit Council (MCC) remains responsible for most decisions and is dominated by government and private-sector representatives, with competing and oftentimes contradictory goals. As a result of these constraints, the exchange rate—the traditional nominal anchor—has been a key instrument of adjustment to shocks, and with fixed profit (interest) rates, real profit (interest) rates have declined sharply. This response has compounded difficulties in stabilizing inflation expectations and constrained the use of some of the traditional sterilization instruments.
18. The authorities and staff agreed that several measures would help to reduce and stabilize inflation at low levels:
Interest rates will need to be more reflective of inflation, with more scope for being market-determined. CBI senior officials explained that bringing profit (interest) rates for government-mandated credit and participation papers more in line with inflation would help address some difficulties in credit markets and enable the CBI to better manage liquidity. At the same time, the CBI would also signal its commitment to lower inflation, bolster the demand for the rial, and thus help better anchor the needed exchange rate flexibility and money. While they acknowledged difficulties in gradually increasing interest rates at this juncture, given the state of the economy and concerns on renewed shocks, CBI senior officials saw limited output costs from higher profit (interest) rates and a need to contain money growth to support disinflation. To do
0
10
20
30
40
50
60
60
70
80
90
100
110
120
2005/06 2006/07 2007/08 2008/09 2009/10 2010/11 2011/12 2012/13
Total Specialized banks (RHS)
Sources: Iranian authorities; and IMF staff estimates.
Private Sector Credit(In percent of non-oil GDP)
-200
-100
0
100
200
300
400
-100
-50
0
50
100
150
200
Dec-09 Jun-10 Dec-10 Jun-11 Dec-11 Jun-12 Dec-12 Jun-13
Lending to government
Lending to banks
Lending to NFPEs (RHS)
Source: Iranian authorities.
CBI Asset Growth(In y-o-y percent change)
ISLAMIC REPUBLIC OF IRAN
22 INTERNATIONAL MONETARY FUND
so, they were determined to issue participation papers with higher profit (interest) rates than before.11
Strengthen the mandate and operational effectiveness of the CBI. With less scope to use foreign exchange reserves for sterilization purposes and risks from large and persistent fiscal deficits, staff emphasized that reforms were needed to ensure that monetary policy can stabilize inflation successfully. The authorities noted that there was growing consensus at the MCC to strengthen the CBI’s mandate on price stability and its operational effectiveness. These reforms would help entrench the benefits for disinflation stemming from the landmark decision on the Mehr Housing Program. It was agreed that simplifying the CBI’s mandate and strengthening its operational autonomy would significantly enhance the effectiveness of monetary policy, in line with the experience of other chronic inflation countries that have successfully achieved price stability.
19. The authorities stressed their commitment to return to a unified exchange rate regime. They recognized that the current external environment imposed several constraints on their ability to unify the official and bureau/parallel exchange rates, and also underscored the significant preparatory work that a unification would entail. Nonetheless, they were committed to unify both markets by mid-2015. They also recognized that arrears on external payments by public- and private-sector entities had emerged, but attributed these to technical difficulties in accessing foreign exchange. CBI senior officials explained that they were prepared to clear public-sector arrears with foreign assets held abroad and to eliminate foreign exchange restrictions and any arrears arising from these restrictions. They also agreed with staff on the need to preserve some exchange rate flexibility, given the relatively rapid exchange rate appreciation in real terms in recent months and the lingering risks to the outlook. They also noted that the 2014/15 budget contemplated steps to depreciate the official rate and bring it closer to the bureau/parallel rate.
20. The official exchange rate appears somewhat overvalued, but uncertainties over Iran’s external environment cloud its assessment. The authorities noted that the bureau/parallel exchange rate—which is 15–20 percent more depreciated than the official rate—seemed to be more in line with fundamentals. They stressed that the exchange rate has regained stability and that Iran’s external buffers were comfortable, although they recognized some difficulties with accessibility. Based on conventional CGER-methodologies, the official exchange rate seems moderately overvalued (see Appendix III). However, these approaches are based on staff’s baseline macroeconomic scenario, which shows Iran’s oil exports well below historical averages. Were Iran’s external environment to improve, oil exports could revert back to about 2½ million barrels per day (roughly the average of the years 2007–11), and the exchange rate would appear to be more in line with fundamentals.
11 A Selected Issues Paper explores the tradeoff between inflation and output stabilization in Iran and the scope for reforms to the monetary policy framework, in line with international experiences.

ISLAMIC REPUBLIC OF IRAN
INTERNATIONAL MONETARY FUND 23
21. The current exchange rate regime gives rise to exchange restrictions and multiple currency practices. The authorities explained that a significant part of current account transactions were conducted at the official exchange rate. However, they recognized that several import categories were being prioritized (basic necessities over other categories of authorized imports) and that, given some delays in the process of granting of foreign exchange some importers were effectively conducting their transactions through the bureau market. They emphasized that the effective premium was in fact small due to the high transaction costs in the official market. They emphasized the many difficulties in accessing foreign exchange, in transferring assets from countries where they had trade surpluses to those with deficits, and in finding correspondent banks. In addition, they explained that limits of US$300 and US$15,000 were effectively in place for travel and for studies abroad, respectively, and that amounts in excess of these limits were accessed through the bureau/parallel market at a more depreciated rate. These foreign exchange limitations, including as a result of import priority categories, give rise to exchange restrictions subject to Fund approval under Article VIII, Section 2(a). Furthermore, the establishment of an official exchange rate for use in all exchange transactions which in practice differs by more than 2 percent from the rate used by licensed foreign exchange bureaus gives rise to a multiple currency practice and an exchange restriction subject to Fund approval under Article VIII, Sections 2(a) and (3). The authorities also confirmed that no changes had been made regarding the transferability of profits under the Foreign Investment Promotion and Protection Act and to the making of other investment-related current payments under this act, but noted that they intend to examine possible modifications to the regulations to remove the restriction. In addition, the authorities confirmed that the letters of credit opened before March 21, 2002 that benefited from subsidies were still outstanding.12
The Business Environment and Financial Stability: Reforms to Promote Jobs and Growth
22. The authorities viewed as critical the need to advance reforms to improve the business environment and address high unemployment. Staff noted that comprehensive steps would be needed to enhance the efficiency of product, financial, and labor markets, as well as to strengthen the institutional framework and effectiveness of the government (Figure 5). Discussions with a broad group of representatives from different economic sectors highlighted the need to enhance the enforcement of the rule of law and property rights, maintain policy and macroeconomic stability, and enhance the transparency of policy making. In particular:
The authorities recognized that the corporate sector was facing difficult conditions. The authorities explained that several reforms to simplify administrative procedures under the Law for Continued Improvement of the Business Environment were now being implemented. They also explained that past privatizations failed to effectively transfer ownership to the private sector and tighten budget constraints, and therefore, have taken steps to improve the privatization process. In addition, senior government officials stressed the administration’s commitment to
12 The multiple currency practice arising from foreign exchange subsidies in connection with the payment of certain letters of credit, opened before 2002, is temporary as it relates to a limited number of letters of credit expected to expire by 2016. Please refer to the Informational Annex for further details.

ISLAMIC REPUBLIC OF IRAN
24 INTERNATIONAL MONETARY FUND
promote foreign and private sector investment, which they saw as beneficial not only for Iran but also the region. The authorities recognized that efforts to improve the business environment would require significant coordination with other state-agencies and the private sector. These efforts would help improve the standards of corporate governance and support the deepening of domestic capital markets, which they viewed as critical to entrench macroeconomic stability and higher productivity. The authorities noted that the tight liquidity conditions reigning in some sectors of the economy and their linkages, was a complex and difficult issue to solve in the near term.
There was broad recognition that dealing with high unemployment will require reforms to the labor market. The administration has placed unemployment (at 24 percent for youth and 20 percent for women by December 2013, respectively) as the most pressing problem. In addition, the extent of underemployment is high.13 Labor force participation remains high (mainly for men) but has been declining and prospective new entrants bring considerable risks to social conditions over the medium term. As highlighted in several development plans, staff noted that labor regulations should be reviewed to ease the rigidity of contracts (in terms of hiring, firing, and special employment conditions such as study leave and force majeure) and lower costs of labor (severance payments, social security contributions, and labor insurance) which have led to high redundancy costs and low flexibility in employment and wage determination (Box 5).
13 Official employment statistics consider all persons aged 10 or over working one hour per week as effectively employed, consistent with ILO standards. The rate of underemployment is about 9 percent of the employed population (roughly equivalent to 80 percent of those unemployed).
2001/02 2005/06 2009/10 2010/11 2011/12 2012/13 2013/14 2/
Unemployment 14.2 11.5 11.9 13.5 12.3 12.2 10.3Youth unemployment 33.6 22.4 24.1 26.7 26.3 25.8 24.3Urban 14.8 13.8 13.5 15.3 13.7 13.8 11.7Rural 13.5 7.1 8.3 9.1 8.9 8.2 6.9Male 13.2 10 10.8 11.9 10.5 10.5 8.5Female 19.9 17.1 16.8 20.5 20.9 19.9 20.3
Labor force participation 37.2 41.0 38.9 38.3 36.9 37.7 36.7Urban 35.8 39.4 37.7 37.3 35.8 36.7 36Rural 39.1 44.7 41.9 40.8 39.8 40.3 38.6Male 62.1 64.7 62.8 62.1 60.7 61.1 62.1Female 11.8 17.0 14.5 14.1 12.6 13.8 11.3
Source: Statistical Center of Iran.
1/ The Iranian fiscal year ends March 20.2/ Corresponds to September 23–December 21, 2013.
Labor Market Indicators, 2000/01–2013/14 1/(In percent of labor force)
ISLAMIC REPUBLIC OF IRAN
INTERNATIONAL MONETARY FUND 25
7%
9%
11%
13%
15%
17%
19%
21%
7%
9%
11%
13%
15%
17%
19%
21%
2012 2013 2014 2015 2016 2017 2018
Scenario 1: growth = 2.5%; ε = 0.35; LF = 2%
Scenario 2: growth = 6%; ε = 0.35; LF = 2%
Scenario 3: growth = 2.5%; ε = 0.6; LF = 2%
Scenario 4: growth = 6%; ε = 0.6; LF = 3%
Unemployment Rate Projections 1/(In percent of total labor force)
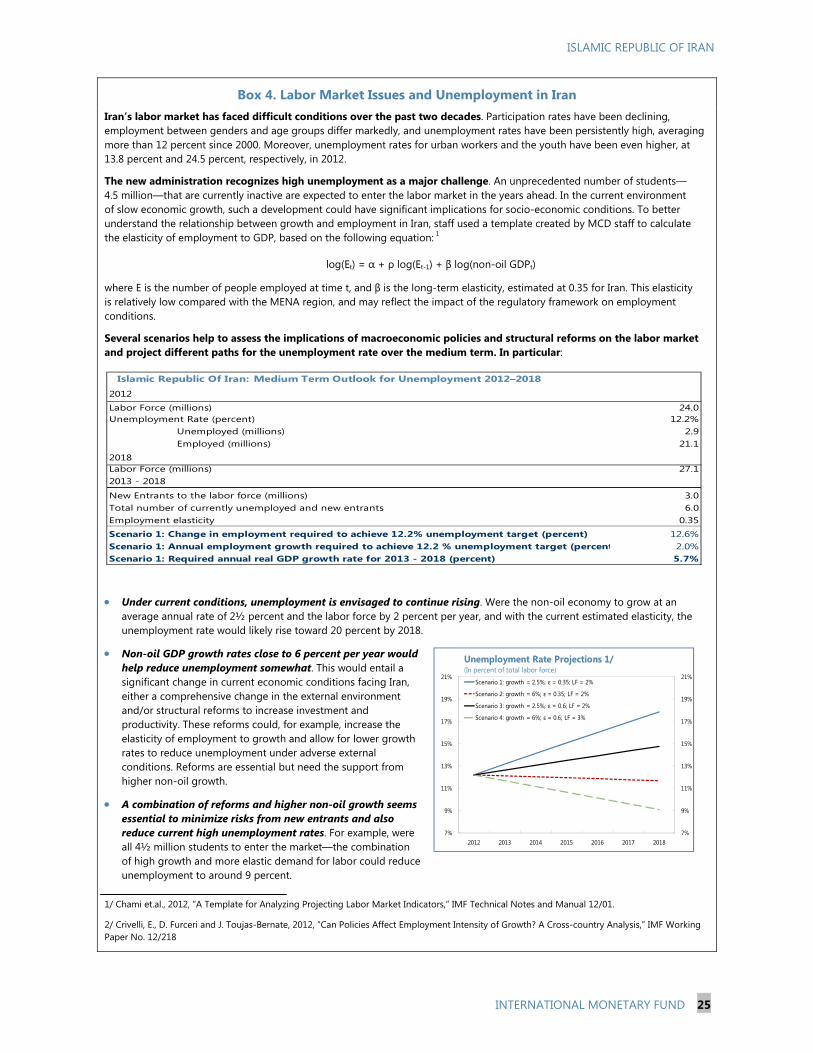
Box 4. Labor Market Issues and Unemployment in Iran Iran’s labor market has faced difficult conditions over the past two decades. Participation rates have been declining, employment between genders and age groups differ markedly, and unemployment rates have been persistently high, averaging more than 12 percent since 2000. Moreover, unemployment rates for urban workers and the youth have been even higher, at 13.8 percent and 24.5 percent, respectively, in 2012.
The new administration recognizes high unemployment as a major challenge. An unprecedented number of students—4.5 million—that are currently inactive are expected to enter the labor market in the years ahead. In the current environment of slow economic growth, such a development could have significant implications for socio-economic conditions. To better understand the relationship between growth and employment in Iran, staff used a template created by MCD staff to calculate the elasticity of employment to GDP, based on the following equation: 1
log(Et) = α + ρ log(Et-1) + β log(non-oil GDPt)
where E is the number of people employed at time t, and β is the long-term elasticity, estimated at 0.35 for Iran. This elasticity is relatively low compared with the MENA region, and may reflect the impact of the regulatory framework on employment conditions.
Several scenarios help to assess the implications of macroeconomic policies and structural reforms on the labor market and project different paths for the unemployment rate over the medium term. In particular:
Under current conditions, unemployment is envisaged to continue rising. Were the non-oil economy to grow at an average annual rate of 2½ percent and the labor force by 2 percent per year, and with the current estimated elasticity, the unemployment rate would likely rise toward 20 percent by 2018.
Non-oil GDP growth rates close to 6 percent per year would help reduce unemployment somewhat. This would entail a significant change in current economic conditions facing Iran, either a comprehensive change in the external environment and/or structural reforms to increase investment and productivity. These reforms could, for example, increase the elasticity of employment to growth and allow for lower growth rates to reduce unemployment under adverse external conditions. Reforms are essential but need the support from higher non-oil growth.
A combination of reforms and higher non-oil growth seems essential to minimize risks from new entrants and also reduce current high unemployment rates. For example, were all 4½ million students to enter the market—the combination of high growth and more elastic demand for labor could reduce unemployment to around 9 percent.
1/ Chami et.al., 2012, “A Template for Analyzing Projecting Labor Market Indicators,” IMF Technical Notes and Manual 12/01.
2/ Crivelli, E., D. Furceri and J. Toujas-Bernate, 2012, “Can Policies Affect Employment Intensity of Growth? A Cross-country Analysis,” IMF Working Paper No. 12/218
Islamic Republic Of Iran:
2012
Labor Force (millions) 24.0Unemployment Rate (percent) 12.2%
Unemployed (millions) 2.9Employed (millions) 21.1
2018Labor Force (millions) 27.12013 - 2018
New Entrants to the labor force (millions) 3.0Total number of currently unemployed and new entrants 6.0Employment elasticity 0.35
Scenario 1: Change in employment required to achieve 12.2% unemployment target (percent) 12.6%Scenario 1: Annual employment growth required to achieve 12.2 % unemployment target (percent 2.0%Scenario 1: Required annual real GDP growth rate for 2013 - 2018 (percent) 5.7%
Medium Term Outlook for Unemployment 2012–2018

ISLAMIC REPUBLIC OF IRAN
26 INTERNATIONAL MONETARY FUND
23. The authorities underscored the need to improve the consistency of financial sector policies. They explained that the banking system had faced a difficult environment over the past several years. A combination of government directives, including through government-mandated credit policies, had weakened risk management, particularly in state-owned banks, and incentives for supervision. As a result, regulatory forbearance on prudential limits had become more widespread and difficult to solve, due to the severity of past shocks and to the lack of proper enforcement capacity and supervisory powers by the CBI, including bank supervisors not enjoying full legal immunity. Banks’ loan classification procedures have been reportedly weak, resulting in under provisioning and overstated capital adequacy ratios, particularly for state-owned banks. While market participants expressed overall satisfaction with the direction the CBI was imparting to financial sector policies, the authorities stressed that advancing many of the needed reforms would require continued efforts to muster political support. In particular:
The authorities were considering different options to resolve NPLs and recapitalize banks. They stressed and staff agreed that their main goal was to strengthen risk management and compliance with prudential limits. Senior management at state-owned banks had already been replaced and consideration was being given to make those banks subject to better accounting and provisioning standards, so as to make them more robust financially, including through recapitalization and consolidation. The authorities were broadly satisfied with private banks, which had already begun to recapitalize themselves.
The authorities saw a good opportunity to gradually dismantle government-mandated credit policies, to promote competition and better risk management. They noted that there were major differences between private and state-owned bank practices, with many banks having increasingly moved away from government-mandated credit policies. Staff encouraged the authorities to begin reviewing and dismantling directed-lending policies promptly. This step could also involve closing the gap between domestic and international best practices in risk management, internal controls, and governance. In addition, staff saw merit in the view of some market participants that privatizing state-owned banks and managing them on a more commercial basis would help level the field of competition in the system.
The authorities saw a need to enhance supervision. While there has been increased coordination between off-site risk assessments and on-site supervision, the authorities acknowledged that enforcing supervision was still difficult. They explained that off-site supervision remained constrained in swiftly penalizing banks that fail to abide by regulatory standards, including the dissemination of prudential information to the CBI. Steps were being taken for on-site inspections to be more risk-based, prioritizing weakest banks. Despite enforcement challenges, the authorities were drawing up remedial action plans for banks that fail to meet regulatory standards. Staff noted the urgent need to strengthen the CBI’s supervisory powers and enforcement capacity.
There is a need to strengthen the crisis preparedness framework. Staff noted that risk-based supervision should be supported by frequent stress testing of the banking sector, which would also provide a useful warning signal and cross-check to on-site reviews. The authorities also

ISLAMIC REPUBLIC OF IRAN
INTERNATIONAL MONETARY FUND 27
explained that the bank resolution framework needed improvement, particularly regarding the recently implemented deposit guarantee fund, which remained too comprehensive and onerous to banks.
Some steps should be taken toward expanding the supervision of bank-affiliates, business conglomerates, and nonbank credit institutions. With many of the private banks part of large business conglomerates, staff noted that it would be important to improve the information coverage to better map individual bank exposures into a system-wide network to assess linkages and risks. Nonbank credit institutions, primarily credit unions and microfinance charities, can collect deposits that are exempt from some elements of the regulatory framework.14 The banking supervision department has encouraged consolidation among nonbank institutions and asked the larger merged entities to apply for a banking license.
24. Staff noted that the recent progress on the external environment provided a good chance to advance on the AML/CFT legislation. Some progress has been made in strengthening the AML regulatory framework, most notably the adoption by the AML High Council of fourteen new AML instructions, the establishment of an economic crime prosecutor office, and a defined roadmap for improving the AML system.15 The authorities noted that all financial institutions have been subjected to an AML supervisory inspection over the past two years. However, while a bill on countering the financing of terrorism (CFT) had been prepared and approved by Parliament in 2012, the authorities reported that it is currently pending before the judiciary for an opinion. Staff noted that there was scope to move towards risk-based AML/CFT supervision and encouraged the authorities to adopt a CFT law that is improved regarding the criminalization of terrorism financing and related activities, the freezing and confiscation of assets, the reporting and analysis of suspicious transactions, and international cooperation.
OTHER ISSUES 25. The authorities underscored that official statistics, particularly for prices and unemployment, were underpinned by sound methodologies. Traditionally, Iran has had adequate statistics for surveillance, notwithstanding some methodological shortcomings in some areas, but delays in publication became more pronounced amid the intensification of international sanctions in 2012. Staff noted that official statistics, particularly for consumer prices and unemployment, had come under increased scrutiny. The authorities emphasized that the methodologies for consumer prices and unemployment followed best international practice and that they have taken steps since taking office to publish information on a more timely basis. Staff agreed and offered the authorities technical assistance to help reaffirm the underlying methodologies.
14 An important share of these institutions deposits are being included in the monetary survey. 15 The instructions include among others the identification of Iranian and foreign customers, the identification of suspicious transactions and the method of reporting, and the monitoring and control of Politically Exposed Persons.

ISLAMIC REPUBLIC OF IRAN
28 INTERNATIONAL MONETARY FUND
STAFF APPRAISAL 26. Iran had achieved considerable progress in raising per capita income in previous decades, but large shocks and weak macroeconomic management in recent years have had a significant impact on macroeconomic stability and growth. A combination of shocks, associated with the implementation of the first phase of the subsidy reform, social-programs inadequately funded, and a marked deterioration in the external environment have weakened the economy. Inflation and unemployment are high, while the corporate and banking sectors are weak. The experience over the past several years has exposed structural weaknesses in the economy and in the policy framework.
27. The economic outlook remains highly uncertain. Facing continued constrained prospects for oil revenues and international transactions, the economy is expected to have continued to contract in 2013/14. With some positive tailwinds from the external side and incipient signs that the pace of contraction in domestic demand is slowing, economic activity would begin to stabilize in 2014/15. But the current outlook remains highly uncertain and subject to downside risks. The authorities are taking steps to make the regulatory framework for foreign investment in the oil sector more attractive, while the interim agreement with the P5+1 brings upside risks.
28. The opportunity to advance comprehensive reforms should not be missed. There is a need to advance reforms to the product, labor, and credit markets to promote stability, investment, and productivity. The authorities should avoid postponing reforms and “muddling-through” in the hope of an improved external environment. Advancing reforms would lay the basis for sustained high growth and employment, especially should the external environment continue to improve.
29. Dealing with stagflation requires several measures, careful sequencing and coordination. A three-pronged strategy should be centered on tightening monetary policy, some balanced fiscal consolidation, and structural reforms to boost the supply side. Staff welcomes the steps taken to remove the financing of the Mehr program from the Central Bank of Iran’s balance sheet, which bode well for stabilizing inflation in the future. The authorities are encouraged to find an alternative noninflationary source of financing for this program to minimize macro-stability risks ahead. Increasing profit rates gradually would help to firmly anchor expectations and contain second-round effects from the planned increases in domestic energy prices. The 2014/15 budget continues with the government’s decision to consolidate fiscal policy and would help balance the support for disinflation and needs of the economy. Staff welcomes the proposed measures to begin broadening the revenue base away from oil, most notably, the decision to bring forward and increase the scheduled VAT rate, as well as the reforms to strengthen tax administration and reduce exemptions. Staff sees scope to further increase the VAT rate in the years ahead—as it remains well below those of other resource-intensive countries—as well as to expand the taxation to specific activities that have experienced large gains. These measures would help to improve the quality of the fiscal adjustment and help lay the ground for a sustainable fiscal policy ahead.

ISLAMIC REPUBLIC OF IRAN
INTERNATIONAL MONETARY FUND 29
30. Reforms to the monetary and fiscal policy frameworks are also essential to entrench macroeconomic stability. The Central Bank of Iran’s mandate needs to be simplified and refocused toward price stability. To build a solid foundation for the future, it is essential to bring the institutional decision-making setup at the Money and Credit Council in line with those of countries that have successfully resolved high chronic inflation. Reforms to the fiscal policy framework should strengthen its countercyclical role, limit fiscal risks, and enhance macroeconomic coordination. The current framework supported by the Oil Stabilization Fund (OSF) and the National Development Fund of Iran (NDFI) could better balance the goals of macroeconomic stability, intergenerational equity, and development. For this, OSF resources need to be replenished soon to support noninflationary budget financing and build buffers for future shocks. Decisions on how to save and invest NDFI resources should be better coordinated explicitly with macro policies and underpinned by more explicit safeguards and transparency. Adopting a multi-year budget planning and expanding the coverage of the general government should enhance the operational conduct, monitoring, and accountability of fiscal policy, and thus limit fiscal risks. Staff encourages the authorities to review how best to bring quasi-fiscal activities into the budget to make them explicit so as to reform or discontinue them.
31. The authorities’ intention to unify the foreign exchange market by mid-2015 is welcome. In the transition, the authorities should manage the exchange rate flexibly in light of external risks and still high inflation. The assessment of the official exchange rate is subject to an unusual degree of uncertainty. In the current circumstances, the official exchange rate would be moderately overvalued, with the bureau/parallel market rate closer to equilibrium. Staff recommends Executive Board approval of the retention of the exchange restrictions and multiple currency practices referred to in paragraph 20 since these are maintained for balance of payments reasons, are nondiscriminatory, and are temporary in light of the authorities’ commitment to unify the exchange rate regime and to remove the restrictions by mid-2015.
32. The subsidy reform needs to proceed with the right supporting framework and macroeconomic policies. Iran’s design of the subsidy reform has been exemplary and the reform remains a priority. The implementation of the first phase has faced significant and varied difficulties and there is a need to make the lessons known to the public. Plans to increase domestic prices gradually are prudent but should be underpinned by an adjustment mechanism with strong political backing to support full implementation. The proposed distribution of resources among households and specific sectors presents a departure from the original design. The process for identifying and excluding less vulnerable groups requires criteria that are simple, transparent, and perceived as fair. In addition, the distribution of resources for supporting energy-intensive sectors needs to ensure a framework that fosters the adoption of new technologies and tighter budget constraints. In subsequent stages of the reform, transfers could be made more conditional on social goals and tilted toward private savings for the broader population.
ISLAMIC REPUBLIC OF IRAN
30 INTERNATIONAL MONETARY FUND
33. There is an urgent need to strengthen the Central Bank of Iran’s supervisory powers and enforcement capacity. The CBI should be able to swiftly take action in case banks fail to abide by regulatory standards. Staff welcomes the CBI’s initial steps toward a risk-based approach to supervision. Staff shares the view of some market participants about the scope for leveling the field of competition in the system through further privatization and reforms to government-mandated credit policies. Current proposals to deal with nonperforming loans and recapitalize public banks need to be supported by restructuring plans and reforms to enhance their risk management and accountability. In terms of crisis preparedness, it would be important to strengthen the bank resolution framework and putting the deposit guarantee fund on a sustainable financial footing.
34. Reforms to improve the business environment and the labor market are complementary and essential to restore stability and boost employment and growth. The scope to improve the business environment is large and can provide a significant boost to productivity and growth in the years ahead. Enhancing the enforcement of the rule of law and property rights, maintaining policy and macroeconomic stability, and enhancing the transparency of policy making are fundamental pillars that would also pave the way for taking advantage of the growing foreign investor interest. Advancing reforms on AML/CFT would also help reinsert the domestic financial system into the global economy, lower transaction costs, and provide an important impetus to productivity. With large potential entrants to the labor force in the years ahead, reforms are needed to facilitate the reallocation of labor across sectors and lower nonwage labor costs. Staff encourages the authorities to review labor regulations to ease the rigidity of contracts and nonwage costs.
35. There is a good opportunity to improve the timeliness of official statistics publication and to reaffirm the underlying methodology behind consumer price and unemployment data. In recent years, the quality and timeliness of price and unemployment statistics have come under increased scrutiny. The authorities have taken some steps under difficult circumstances, but there is scope for further improvement in the reporting and timeliness of official statistics. Technical assistance in these areas would help address these issues.
36. It is recommended that the next Article IV consultation takes place on the standard 12-month cycle.

ISLAMIC REPUBLIC OF IRAN
INTERNATIONAL MONETARY FUND 31
Figure 1. Islamic Republic of Iran: A Look Back at Economic Performance
Sources: Feenstra, Robert C., Robert Inklaar and Marcel P. Timmer (2013), "The Next Generation of the Penn World Table" available for download at www.ggdc.net/pwt; UNDP Human Development Report; and IMF WEO.
0
20
40
60
80
100
120
140
160
180
1990 1994 1998 2002 2006 2010
GDP per Capita (In percent of USA GDP per Capita)
IranNorwaySaudi ArabiaTurkeyChina
0
20
40
60
80
100
120
140
160
1990 1994 1998 2002 2006 2010
Capital Stock per Worker(In percent of USA capital stock per worker)
IranNorwaySaudi ArabiaTurkeyChina
0.0
0.5
1.0
1.5
2.0
1990 1994 1998 2002 2006 2010
Total Factor ProductivityIranNorwaySaudi ArabiaTurkeyChina
0
20
40
60
80
100
120
140
160
1990 1994 1998 2002 2006 2010
Employment to Population Ratio (In percent of USA employment-population ratio)
IranNorwaySaudi ArabiaTurkeyChina
There has been significant convergence over the past couple of decades...
...led by strong productivity growth through the mid-2000s...
...and improved employment through the mid-2000s....early gains in capital per worker...
0
50
100
150
200
250
300
Bahr
ain
Azer
baija
n
Om
an
Alge
ria
Yem
en
Kaza
khst
an
Saud
i Ara
bia
UAE
Kuwa
it
Liby
a
Iraq
Qat
ar
Iran
Turk
men
istan
Ratio of Proven Reserves to Total Oil and Natural Gas Production, 2012
IRQ
UZB
TKM
DZA OMNAZE Iran
KAZLBY
SAU
KWTBHRUAE
BOL
BRAECU
RUSPER
CHL
TTOVEN
USA
TUR
ARG
SWEFRA
CAN
NOR
0.55
0.60
0.65
0.70
0.75
0.80
0.85
0.90
0.95
1.00
0 5 10 15 20 25 30 35 40 45 50 55
HDI I
ndex
PPP dollars per capita (Thousands)
Human Development Index and Per Capita PPP GDP
And its vast hydrocarbon resources continues to provide a solid foundation.
Iran's human development compares relatively well for similar income levels.

ISLAMIC REPUBLIC OF IRAN
32 INTERNATIONAL MONETARY FUND
Figure 2. Islamic Republic of Iran: Macroeconomic Indicators, 2000/01–2013/14
Sources: Iranian authorities; OPEC, secondary sources; and IMF staff estimates.
1/ The 2013 values are semi-annual; the first six months of the year are compared to the first six months of 2012.
-6
-3
0
3
6
9
12
15
18
-4
-2
0
2
4
6
8
10
12
2003/04 2005/06 2007/08 2009/10 2011/12 2013/14 (est.)
Unemployment and Non-Oil Growth(In percent)
Nonhydrocarbon GDP
Unemployment rate
-45
-35
-25
-15
-5
5
15
25
35
-45
-35
-25
-15
-5
5
15
25
35
2003/04 2005/06 2007/08 2009/10 2011/12 2013/14 (est.)
Fiscal Balance (In percent of GDP)
Oil Revenue Non-oil Revenue
Total Expenditure
Overall balance
0
2
4
6
8
10
12
14
16
18
0
20
40
60
80
100
120
140
160
180
2003/04 2005/06 2007/08 2009/10 2011/12 2013/14 (est.)
Current Account Balance and Gross Official Reserves
Current account balance (in percent of GDP, RHS)
Gross official reserves (in billions of U.S. dollars)
-25
-20
-15
-10
-5
0
5
10
15
20
25
-25
-20
-15
-10
-5
0
5
10
15
20
25
2000
2001
2002
2003
2004
2005
2006
2007
2008
2009
2010
2011
2012
2013
Demand Components 1/
(In y-o-y percent growth)
Private Final Consumption Expenditure
Government Final Consumption Expenditure
Gross Fixed Capital Formation
0
1
2
3
4
5
Jan-11 Jun-11 Nov-11 Apr-12 Sep-12 Feb-13 Jul-13 Dec-13
Crude Oil Trends (In millions of barrels per day)
Exports
Production
-15
-10
-5
0
5
10
15
20
25
30
2005
Q1
2005
Q3
2006
Q1
2006
Q3
2007
Q1
2007
Q3
2008
Q1
2008
Q3
2009
Q1
2009
Q3
2010
Q1
2010
Q3
2011
Q1
2011
Q3
2012
Q1
2012
Q3
2013
Q1
Real GDP Growth (qsaar, in percent) Tightening of
sanctions:
Subsidy reform:
The economy decelerated sharply since the subsidy reform and tightening of sanctions...
...and continued to shrink in the first half of 2013/14, but there are incipient signs of domestic demand reviving.
Oil production and exports have declined sharply... ...with significant spillovers to the nonoil economy.
The overall fiscal balance is now in deficit... ... and the surplus of the current account has declined.

ISLAMIC REPUBLIC OF IRAN
INTERNATIONAL MONETARY FUND 33
Figure 3. Islamic Republic of Iran: Macroeconomic and Price Developments, 2007/08–2012/13
Sources: Iranian authorities; and Fund staff estimates.
-20
-15
-10
-5
0
5
10
15
20
25
-25
-20
-15
-10
-5
0
5
10
15
20
25
Jun-09 Apr-10 Mar-11 Feb-12 Jan-13 Dec-13
Nominal and Real Deposit Rates (In percent)
Real deposit rate
Nominal deposit rate
5,000
10,000
15,000
20,000
25,000
30,000
35,000
40,000
5,000
10,000
15,000
20,000
25,000
30,000
35,000
40,000
Jun-09 Apr-10 Mar-11 Feb-12 Jan-13 Dec-13
Exchange Rates(In Rials per USD)
Parallel Exchange Rate
CBI (Official)
CBI Foreign Exchange Trading Center Rate
0
10
20
30
40
50
60
0
10
20
30
40
50
60
Jun-09 Mar-10 Dec-10 Sep-11 Jun-12 Mar-13 Dec-13
Inflation (In percent; year-on-year)
CPI (Overall)
Housing, Water, Electricity, Gas & FuelsFood and Beverages
Services
-5
0
5
10
15
20
25
30
35
40
45
-5
0
5
10
15
20
25
30
35
40
45
2007
Q1
2007
Q4
2008
Q3
2009
Q2
2010
Q1
2010
Q4
2011
Q3
2012
Q2
2013
Q1
2013
Q4
Growth in Monetary Aggregates(In percent; y-o-y)
M1
M2
High inflationary pressures have begun to ease more recently...
...following the unification of the official exchange rate and appreciation of the parallel rate.
...helping to bring down LTD ratios of commercial and private banks.
Banks have been rebalancing their credit portfoliostowards the government...
Money growth is beginning to slow......while real interest rates are bouncing back gradually from negative territory.
-10
0
10
20
30
40
50
60
-10
0
10
20
30
40
50
60
2007
Q1
2007
Q4
2008
Q3
2009
Q2
2010
Q1
2010
Q4
2011
Q3
2012
Q2
2013
Q1
2013
Q4
Bank Credit Growth 1/(In percent; y-o-y )
Claims on Non-public Sector
Claims on Public Sector
1/ Excludes Central Bank of Iran.
0.0
0.5
1.0
1.5
2.0
2.5
3.0
0.0
0.5
1.0
1.5
2.0
2.5
3.0
Commercial banks Specialized banks Private banks
Private-sector Loan-to-Deposit Ratios
March 2009
March 2010
March 2011
March 2012
March 2013

ISLAMIC REPUBLIC OF IRAN
34 INTERNATIONAL MONETARY FUND
Figure 4. Islamic Republic of Iran: Stock Market Indicators, 2010–13
-20
0
20
40
60
80
100
120
140
160
180
Jul-10 Jan-11 Jul-11 Jan-12 Jul-12 Jan-13 Jul-13 Jan-14
Main Stock Market Indices (Y-Y % change)
TEPIX
Industrial Index
Financial Index
0
50
100
150
200
250
Jul-10 Jan-11 Jul-11 Jan-12 Jul-12 Jan-13 Jul-13 Jan-14
Total Market Capitalization (Billions of US Dollars)
Using official exchange rate
Using parallel exchange rate
1
2
3
4
56
7
8
9
1011
1213 14
1516
17
18
19
20
21
22
23
24
25
26
2728
29 30
31
32
33
34
35
-80
-60
-40
-20
0
20
40
60
80
100
-60 -20 20 60 100
TSE Sector Indeces 1/ 2/
Aver
age
% g
row
th o
f sec
tor,
July
201
2 -D
ecem
ber 2
012
Average % growth of sector, July 2011 - December 2011
Sources: Tehran Stock Exchange; and IMF staff calculations.
1/ In counterclockwise order, the four quadrants represent the following scenarios: (i)positive growth for both periods.; (ii)positive growth for recent period, negative growth for past period.;(iii) negative growth for both periods.; and (iv) negative growth for recent period, positive growth for past period.
2/ Growth rates are computed using the parallel market exchange rate. We then take the geometric average of the y-o-y growth rates for the given period .
1 - Chemicals & By-products (22.9%) 2 - Basic Metals (14.7%)3 - Monetary Intermediation (11.3%)4 - Refined Petrol. Products (10.8%) 5 - Metal Ores Mining (9.0%)6 - Diversified Industrials (7.8%)7 - Post and Telecomm. (4.2%)8 - Cement, Lime & Plaster (3.1%)9 - Investment Companies (2.4%) 10 - Motor Vehicles (2.3%)11 - Technical & Engineering Services (2.0%)12 - Pharmaceuticals (1.9%)
25 - Financial Leasing (0.2%)26 - Ceramic and Tiles (0.2%)27 - Medical and Precision Instruments (0.1%)28 - Paper and Byproducts (<0.1%)29 - Radio, TV and Comm. Equipment (<0.1%)30 - Tanning and Dressing of Leather (<0.1%)31 - Agriculture (<0.1%)32 - Textiles (<0.1%)33 - Coal and Lignite Mining (<0.1%)34 - Publishing and Printing of Media (<0.1%)35 - Wood and Byproducts (<0.1%)36 - Other Mining (<0.1%)
13 - Food Products (1.6%)14 - Computer and Related Activities (1.0%)15 - Real Estate and Construction (0.8%)16 - Transportation and Storage (0.6%)17 - Oil and Gas Extraction (0.5%)18 - Insurance and Pension (0.5%)19 - Electric Machinery (0.4%)20 - Rubber and Plastic Products (0.4%)21 - Sugar and Byproducts (0.4%)22 - Machinery and Equipment (0.4%)23 - Other Non-metal Mineral Products (0.3%)24 - Fabricated Metal Products (0.3%)
The data labels in the bubble charts represent the rank of each sector in terms of market capitalization. Below see the corresponding sectors and percent market share (July 2013). The dimensions of the bubbles are relative (approximately) to their market share.
1
2
3
4
5
6
7
8
910
11
12
13
1415
16
17
18
19
20
2122
2324
25
26
27
28
29
30
3132
3334
35
-100
-50
0
50
100
150
200
250
300
350
-80 -60 -40 -20 0 20 40 60
TSE Sector Indeces 1/ 2/
Average % growth of sector, January 2012 - May 2013
Aver
age
% g
row
th o
f sec
tor,
June
201
3 -J
uly
2013
After a sharp decline during 2012, equity prices have recovered markedly since early 2013.... ...with capitalization now above pre-sanctions levels.
Most sectors that had been negatively affected by the intensification of sanctions...
... have been recovering strongly, especially since the election of the new government.

ISLAMIC REPUBLIC OF IRAN
INTERNATIONAL MONETARY FUND 35
Figure 5. Islamic Republic of Iran: Business Environment Indicators, 2005–13
Sources: World Bank's Doing Business 2014; and the World Economic Forum's Global Competitiveness Report 2013–14.
1/ Includes South Korea, Mexico, Turkey, Russia, and China.2/ Each bar shows the percent of survey respondents who feel the particular issue in question is the most problematic for doing business in Iran.
40
44
48
52
56
60
80
82
84
86
88
90
2010-11 2011-12 2012-13 2013-14
DB - Ease of Doing Business (distance to frontier)
Global Competitiveness Index (rescaled to 100, RHS)
Evolution of the Business Environment(Higher = better)
0
10
20
30
40
50
60
70
80
90
100
Doing Business (2014, distance to frontier)
Global Competitiveness Index (2013, rescaled to 100)
MENA Oil Exporters (average)
Emerging Markets Top 5 (average) 1/
Iran
Business Environment in International Perspective(Higher = better)
0
10
20
30
40
50
60
70
80
90
100
Starting business
Dealing with construction
permits
Registering property
Getting credit
Protecting investors
Enforcing contracts
Resolving insolvency
2005
2009
2013
Doing Business - Criteria(Distance to frontier, percentage points; higher = better)
0
10
20
30
40
50
60
70
80
90
100
Macroeconomic environment
Goods market efficiency Labor market efficiency
2012/13 2013/14
Deterioration in Competitiveness (GCI)(Index out of 7, rescaled to 100)
Polic
y in
stab
ility
Fore
ign
curr
ency
reg
ulat
ions
Acc
ess
to fi
nanc
ing
Infla
tion
I nef
ficie
nt b
urea
ucra
cy
Inad
equa
te in
fra
0
5
10
15
20
25
2012/13 2013/14
Main Constraints to Growth 2/(GCI 2013/14 report; Lower = better)
0
10
20
30
40
50
60
70
80
Burden of government regulation
Transparency of government
policymaking
Strength of auditing &
reporting standards
Efficiency of corporate boards
MENA Oil Exporters (average)
EM Top 5 (average)
Iran
GCI - First Pillar Basic Requirements(Ranking, scaled to 100; higher = better)
The business environment has deteriorated in recent years...
...and compares unfavorably regionally and with other emerging markets.
Doing business remains difficult in many key areas... ...as key "efficiency enhancers" continue to deteriorate.
There are key priorities on the policy side.......that need to be supported by reforms to enhance the government's and corporate effectiveness.

ISLAMIC REPUBLIC OF IRAN
36 INTERNATIONAL MONETARY FUND
Est.2011/12
National accountsNominal GDP at market prices (in billions of Iranian rials) 6,121,004 6,793,170 9,068,975 11,057,015 13,612,678Real GDP at factor cost 3.0 -5.8 -1.7 1.5 2.3
Real oil and gas GDP 1.3 -34.1 -5.7 -0.5 -0.3Real nonoil GDP 3.2 -3.1 -1.4 1.6 2.5
CPI inflation (average) 21.5 30.5 35.2 23.0 22.0CPI inflation (end of period) 20.5 41.2 22.0 24.0 20.0GDP deflator at factor cost 37.6 17.6 35.8 20.1 20.3Unemployment rate (in percent of labor force) 12.3 12.2 12.9 14.0 14.6
Investment and savingsInvestment 41.3 41.9 37.9 37.2 36.5
Total fixed capital investment 24.9 23.7 25.7 25.3 24.8Public 6.7 3.7 2.7 3.6 3.4Private 18.2 20.0 23.0 21.7 21.4
Gross national savings 52.3 48.5 45.9 42.3 39.1Public 5.3 1.8 0.5 1.1 0.8Private 47.0 46.8 45.4 41.2 38.3
Savings/investment balance 11.0 6.6 8.0 5.0 2.7Public -1.4 -2.0 -2.2 -2.5 -2.5Private 12.4 8.6 10.2 7.5 5.2
Budgetary operationsRevenue 19.7 15.0 13.9 12.4 11.8
Taxes 5.9 5.8 5.2 5.7 6.0Other revenue 13.8 9.1 8.7 6.7 5.8
Of which : oil revenue 10.8 6.6 6.2 4.5 3.7Expenditure 19.5 15.3 14.8 14.9 14.3
Expense 14.8 13.1 13.6 12.9 12.5Net acquisition of nonfinancial assets 4.7 2.2 1.2 2.0 1.8
Net lending/borrowing (overall balance) -1.4 -2.0 -2.2 -2.5 -2.5Net lending/borrowing (budget) 0.2 -0.3 -0.9 -2.5 -2.5Balance of Targeted Subsidy Organization -1.6 -1.6 -1.3 0.0 0.0
Financial assets -2.6 -0.4 -1.2 -0.2 0.1Liabilities -1.2 1.6 1.1 2.2 2.7
Monetary sectorNet foreign assets 36.8 5.6 106.5 25.0 20.5Net domestic assets 4.1 52.6 -16.1 21.4 27.0Credit to the private sector in rials 20.1 17.7 24.6 19.6 22.9Narrow money (M1) 15.8 29.1 20.5 19.4 21.9Broad money (M2) 19.6 30.6 24.9 24.1 24.5
External sectorCurrent account balance 59.4 26.3 29.2 20.4 11.3
In percent of GDP at market prices 11.0 6.6 8.0 5.0 2.7Exports of goods and services 153.9 105.0 100.2 98.9 95.1Imports of goods and services -95.5 -80.4 -72.9 -79.2 -84.5
External and publicly guaranteed debt 17.3 7.7 7.6 7.3 7.0Of which: short-term debt 8.3 0.9 1.6 2.2 2.9
Gross official reserves 92.2 104.4 107.7 110.1 110.0
Oil and gas sectorTotal oil and gas exports (billions) 118.2 62.9 56.3 52.8 46.5Liquid fuels production (in millions of barrels/day) 4.0 3.2 2.8 2.7 2.6
Memorandum items:Average exchange rate (Iranian rials per U.S. dollar) 11,312 12,260 24,770 … …End-of-period exchange rate (Iranian rials per U.S. dollar) 12,260 12,260 24,770 … …
Sources: Iranian authorities; and Fund staff estimates and projections.
1/ The Iranian fiscal year ends March 20.
(In U.S. dollars, unless otherwise indicated)
(In percent of GDP)
(Annual change in percent, unless otherwise indicated)
(In billions of U.S. dollars, unless otherwise indicated)
Table 1. Islamic Republic of Iran: Selected Macroeconomic Indicators, 2011/12–2015/16 1/
2012/13 2013/14 2014/15 2015/16Staff Proj.
(Annual change, in percent, unless otherwise indicated)

ISLAMIC REPUBLIC OF IRAN
INTERNATIONAL MONETARY FUND 37
Est.2011/12 2012/13 2013/14 2014/15 2015/16
Current account balance 59,382 26,272 29,247 20,442 11,298(in percent of GDP at market prices) 11.0 6.6 8.0 5.0 2.7
Trade balance 67,068 30,975 32,761 26,192 18,000Exports 144,873 98,033 93,560 92,226 88,524
Oil and gas 118,231 62,916 56,328 52,754 46,472Crude oil 93,725 44,345 37,837 34,555 29,482Petroleum products and natural gas 24,506 18,571 18,491 18,199 16,990
Non-oil and gas 26,642 35,117 37,231 39,472 42,052Imports -77,805 -67,058 -60,799 -66,034 -70,524
Services (net) -8,110 -5,255 -4,122 -6,418 -7,444
Credits 10,792 9,155 8,457 7,140 6,991Debits -18,902 -14,410 -12,578 -13,558 -14,435
Transfers (net) 424 552 608 668 742
Capital and financial account balance -17,465 -12,155 -25,969 -17,999 -11,466Foreign direct investment and portfolio equity -515 180 0 0 0Medium- and long-term debt -2,382 -3,018 -667 -1,029 -988Trade credit -3,202 -3,362 -8,851 1,481 1,974Other capital 2/ -11,366 -5,955 -16,451 -18,451 -12,451
Errors and omissions -20,481 -1,904 0 0 0
Overall balance 21,436 12,213 3,277 2,443 -168
Change in gross official reserves (increase -) -21,436 -12,213 -3,277 -2,443 168
Memorandum items:Gross official reserves (in millions of U.S. dollars) 92,215 104,428 107,705 110,148 109,980
(in months of the following year’s imports) 13.8 17.2 16.3 15.6 15.0External debt (in percent of GDP) 3.2 1.9 2.1 1.8 1.7
Sources: Iranian authorities; and Fund staff estimates and projections.1/ The Iranian fiscal year ends March 20.2/ Includes Asian Clearence Union (ACU) and commercial banks
Table 2. Islamic Republic of Iran: Balance of Payments, 2011/12–2015/16 1/(In millions of U.S. dollars, unless otherwise indicated)
Staff proj.

ISLAMIC REPUBLIC OF IRAN
38 INTERNATIONAL MONETARY FUND
Est.2011/12 2012/13 2013/14 2014/15 2015/16
Revenues (a) 1,203,714 1,015,803 1,257,962 1,374,488 1,603,441Taxes 359,451 395,169 469,745 633,384 819,579
Taxes on income, profits and capital gains 207,505 232,385 271,296 339,113 424,094Taxes on property 12,913 15,894 21,156 26,444 33,071Taxes on goods and services 60,104 70,487 123,829 203,965 281,438
Of which : value added tax 32,702 54,129 101,175 175,647 246,024Taxes on international trade and transactions 78,930 76,403 53,463 63,863 80,976
Other revenue 844,263 620,634 788,217 741,104 783,861Property income 731,636 545,284 674,651 614,945 626,086
Of which : Rents (oil revenue) 659,244 447,597 558,763 499,059 510,145
Expenditure (b) 1,191,784 1,039,256 1,339,780 1,647,922 1,950,473
Expense (b.1) 904,225 889,974 1,232,400 1,424,542 1,702,248Net acquisition of nonfinancial assets (b.2) 287,560 149,282 107,380 223,380 248,225
Gross operating balance (a-b.1) 299,490 125,829 25,562 -50,054 -98,808Net lending/borrowing (overall balance) -85,820 -133,830 -203,736 -273,434 -347,033
Net lending/borrowing (a-b) (budget) 11,930 -23,453 -81,818 -273,434 -347,033Balance of Targeted Subsidy Organization -97,750 -110,377 -121,918 0 0
Financial assets -158,806 -25,893 -107,195 -26,964 19,426Liabilities -72,986 107,937 96,541 246,470 366,459
Memorandum items:Nonoil net lending/borrowing -745,064 -581,427 -762,499 -772,493 -857,178Nonoil net lending/borrowing incl. NDFI loans -797,099 -716,287 -923,504 … …
Sources: Iranian authorities; and Fund staff estimates and projections.
1/ The statement of government operations covers budgetary central government and balance of the Targeted Subsidies Organization but excludes the NDFI.
Table 3. Islamic Republic of Iran: Statement of Government Operations, 2011/12–2015/16 1/(In billions of rials)
Staff proj.

ISLAMIC REPUBLIC OF IRAN
INTERNATIONAL MONETARY FUND 39
Est.2011/12 2012/13 2013/14 2014/15 2015/16
Revenues (a) 19.7 15.0 13.9 12.4 11.8Taxes 5.9 5.8 5.2 5.7 6.0
Taxes on income, profits and capital gains 3.4 3.4 3.0 3.1 3.1Taxes on property 0.2 0.2 0.2 0.2 0.2Taxes on goods and services, of which 1.0 1.0 1.4 1.8 2.1
Value added tax 0.5 0.8 1.1 1.6 1.8Taxes on international trade and transactions 1.3 1.1 0.6 0.6 0.6
Other revenue, of which 13.8 9.1 8.7 6.7 5.8Property Income, of which 12.0 8.0 7.4 5.6 4.6
Rents (Oil Revenue) 10.8 6.6 6.2 4.5 3.7
Expenditure (b) 19.5 15.3 14.8 14.9 14.3
Expense (b.1) 14.8 13.1 13.6 12.9 12.5Net acquisition of nonfinancial assets (b.2) 4.7 2.2 1.2 2.0 1.8
Gross operating balance (a-b.1) 4.9 1.9 0.3 -0.5 -0.7Net lending/borrowing (overall balance) -1.4 -2.0 -2.2 -2.5 -2.5
Net lending/borrowing (a-b) (budget) 0.2 -0.3 -0.9 -2.5 -2.5Balance of Targeted Subsidy Organization -1.6 -1.6 -1.3 0.0 0.0
Financial assets -2.6 -0.4 -1.2 -0.2 0.1Liabilities -1.2 1.6 1.1 2.2 2.7
Memorandum items:Non-oil net lending/borrowing 2/ -16.8 -10.5 -10.3 -8.3 -7.4Non-oil net lending/borrowing including NDFI loans 2/ -17.9 -12.9 -12.5 … …
Sources: Iranian authorities; and Fund staff estimates and projections.
2/ Non-oil overall balance, as a percentage of non-oil GDP.
1/ The statement of government operations covers budgetary central government and balance of the Targeted Subsidies Organization but excludes the NDFI.
Table 4. Islamic Republic of Iran: Statement of Government Operations, 2011/12–2015/16 1/(In percent of GDP)
Staff proj.

ISLAMIC REPUBLIC OF IRAN
40 INTERNATIONAL MONETARY FUND
Est.2011/12 2012/13 2013/14 2014/15 2015/16
Net foreign assets (NFA) 1,126,501 1,203,020 2,511,753 3,085,784 3,625,809 In millions of U.S. dollars 91,884 98,126 101,403 103,846 103,678
Foreign assets 1,170,557 1,280,287 2,667,864 3,273,061 3,846,216 In millions of U.S. dollars 95,478 104,428 107,705 110,148 109,980
Foreign liabilities 1/ 44,056 77,268 156,111 187,277 220,407 In millions of U.S. dollars 3,593 6,302 6,302 6,302 6,302
Net domestic assets (NDA) -333,584 -143,741 -1,251,044 -1,533,855 -1,755,577 Net domestic credit -12,061 127,444 -164,469 39,811 308,346 Central government, net -555,528 -543,527 -1,046,253 -1,048,612 -1,093,406 Claims 65,455 103,202 103,202 103,202 103,202 Deposits 620,983 646,729 1,149,455 1,151,814 1,196,608 Claims on banks 418,303 488,314 699,126 905,765 1,246,493 Claims on nonfinancial public enterprises (NFPEs) 125,163 182,657 182,657 182,657 155,259 Other items net, excluding central bank participation papers (CPPs) -321,522 -271,185 -1,086,574 -1,573,666 -2,063,922
Base money 784,819 993,939 1,178,524 1,462,719 1,820,555 Currency 310,956 371,610 388,913 438,816 546,166 Currency in circulation 263,826 330,164 350,022 394,934 491,550 Cash in vaults 47,130 41,446 38,891 43,882 54,617 Reserves 453,613 604,185 765,081 993,731 1,237,577 Required reserves 357,327 491,535 591,226 738,101 918,668 Excess reserves 96,285 112,651 173,855 255,630 318,909 Deposits of NFPE and municipalities 20,251 18,144 24,530 30,172 36,811
Other liabilities 8,097 64,415 82,186 89,210 49,677CPPs 0 47,000 47,000 47,000 0Foreign currency deposits of NFPEs and municipalities 8,097 17,415 35,186 42,210 49,677
Memorandum items:End-period change (in percent of base money)
Base money 12.5 26.6 18.6 24.1 24.5NFA 52.0 9.7 131.7 48.7 36.9NDA (net of other liabilities) -43.6 17.0 -113.2 -24.6 -12.5
Sources: Central Bank of Iran; and Fund staff estimates and projections.
1/ Includes liabilities in foreign currency to residents.
Table 5. Islamic Republic of Iran: Central Bank Balance Sheet, 2011/12–2015/16(In billions of rials, unless otherwise indicated)
Staff proj.

ISLAMIC REPUBLIC OF IRAN
INTERNATIONAL MONETARY FUND 41
Est.2011/12 2012/13 2013/14 2014/15 2015/16
Net foreign assets (NFA) 1,733,047 1,830,458 3,779,424 4,725,393 5,695,361In millions of U.S. dollars 141,358 149,303 152,581 159,023 162,856
Foreign assets 1,981,667 2,106,715 4,337,571 5,394,968 6,483,388In millions of U.S. dollars 161,637 171,836 175,114 181,557 185,389
Foreign liabilities 2/ 248,620 276,257 558,147 669,575 788,027In millions of U.S. dollars 20,279 22,533 22,533 22,533 22,533
Net domestic assets (NDA) 2,052,057 3,131,430 2,627,871 3,191,352 4,052,044Net domestic credit 3,746,543 4,528,648 5,425,174 6,785,226 8,551,675
Net credit to government -268,439 -115,657 -584,207 -385,510 -115,794Claims on nonfinancial public enterprises (NFPEs) 150,132 211,365 256,635 286,226 241,127Claims on the private sector 3,864,849 4,432,940 5,752,746 6,884,510 8,426,342
Of which: domestic currency claims 3,516,846 4,138,975 5,158,821 6,172,014 7,587,801Other items, net, excluding CPPs -1,694,486 -1,397,217 -2,797,302 -3,593,874 -4,499,631
Broad money (M3) 3,830,578 4,961,890 6,407,295 7,916,745 9,747,405M2 3,542,455 4,625,080 5,774,767 7,167,322 8,920,719
Cash 263,826 330,164 350,022 394,934 491,550Deposits 3,278,629 4,294,916 5,424,745 6,772,388 8,429,169
Demand deposits 630,584 824,698 1,041,645 1,266,553 1,534,254Time deposits 2,648,045 3,470,218 4,383,101 5,505,835 6,894,915
CPPs held by nonbanks 0 47,000 47,000 47,000 0Foreign currency deposits 288,123 289,809 585,529 702,423 826,686
Memorandum items:Net credit to government (without valuation effect) -268,439 -115,657 -57,330 227,142 579,280Base money 784,819 993,939 1,178,524 1,462,719 1,820,555M1 894,410 1,154,862 1,391,666 1,661,487 2,025,804Multiplier (M2/base money) 4.5 4.7 4.9 4.9 4.9Velocity of M2 1.7 1.6 1.4 1.5 1.5GDP 6,121,004 6,793,170 9,068,975 11,057,015 13,612,678
NFA 36.8 5.6 106.5 25.0 20.5NDA 4.1 52.6 -16.1 21.4 27.0Base money 12.5 26.6 18.6 24.1 24.5M1 15.8 29.1 20.5 19.4 21.9M2 19.6 30.6 24.9 24.1 24.5Credit to private sector in rials 20.1 17.7 24.6 19.6 22.9
Sources: Central Bank of Iran; and Fund staff estimates and projections.
1/ The Iranian fiscal year ends March 20.2/ Includes liabilities in foreign currency to residents.
Table 6. Islamic Republic of Iran: Monetary Survey, 2011/12–2015/16 1/(In billions of rials, unless otherwise indicated)
Staff proj.
(Annual change, in percent)

ISLAMIC REPUBLIC OF IRAN
42 INTERNATIONAL MONETARY FUND
Est.2010/11 2011/12 2012/13 2013/14
External solvency indicatorsReal effective exchange rate (REER) (end of period; percent change) 8.3 2.9 -30.1 …Total public and publicly guaranteed external debt (in billions of U.S. dollars) 22.6 17.3 7.7 7.6
(In percent of GDP) 5.4 3.2 1.9 2.1Short-term external debt (in billions of U.S. dollars) 11.5 8.3 0.9 1.6
(In percent of GDP) 2.7 1.5 0.2 0.4
(In percent of exports of goods and services) 2/ 9.5 5.4 0.9 1.6External debt service (in percent of exports of goods and services) 2/ 3/ 1.4 2.0 3.6 1.7
External liquidity indicatorsTotal official reserves (in billions of U.S. dollars) 70.8 92.2 104.4 107.7
(In months of the following year's imports of goods and services) 2/ 8.9 13.8 17.2 16.3(In percent of short-term external debt) 617 1,116 11,074 6,944
Commercial banks net foreign assets (in billions of U.S. dollars) 48.5 49.5 51.2 51.2Foreign assets 65.8 66.2 67.4 67.4Foreign liabilities 4/ 17.2 16.7 16.2 16.2
Oil and oil-related exports (in percent of exports of goods) 80.0 81.6 64.2 60.2
Financial sector indicatorsRisk-weighted capital adequacy of banks (in percent) 5/ 6/ 8.4 7.9 8.6 6.8Ratio of nonperforming loans of banks (in percent of total loans) 5/ 6/ 13.7 15.1 13.7 14.4Loan provisions as a percentage of nonperforming loans 35.1 37.5 39.4 36.1Return on assets (in percent) 1.0 0.9 1.0 …Net domestic credit (percent change) 31.6 12.1 20.9 19.8Net domestic credit (in percent of GDP) 77.1 61.2 66.7 59.8Private sector credit in local currency (percent change) 37.1 20.1 17.7 24.6
Market assessment/financial market indicators
Stock market price index (percent change; end-of-period) 7/ 89.2 8.5 50.5 126.5
Stock market capitalization (in percent of GDP) 7/ 26.9 19.8 36.8 44.6
Sources: Iranian authorities; and Fund staff estimates.
1/ The Iranian fiscal year ends March 20.2/ Excluding interest receipts and payments. 3/ Excluding service of short-term external debt.4/ Including contingent liabilities under letters of credit.
5/ Islamic banks exhibit important differences in their risk profile and asset classification, which limit international comparability.6/ As of September 2014.7/ As of January 2014.
Table 7. Islamic Republic of Iran: Vulnerability Indicators, 2010/11–2013/14 1/

Est.2011/12 2016/17 2017/18 2018/19 2019/20
National accountsNominal GDP at market prices (in billions of Iranian rials) 6,121,004 6,793,170 9,068,975 11,057,015 13,612,678 16,523,461 20,098,692 24,463,745 29,841,784Real GDP at factor cost 3.0 -5.8 -1.7 1.5 2.3 2.3 2.3 2.3 2.3
Real oil and gas GDP 1.3 -34.1 -5.7 -0.5 -0.3 -0.1 0.0 0.0 0.0Real nonoil GDP 3.2 -3.1 -1.4 1.6 2.5 2.4 2.5 2.5 2.5
CPI inflation (average) 21.5 30.5 35.2 23.0 22.0 20.0 20.0 20.0 20.0CPI inflation (end of period) 20.5 41.2 22.0 24.0 20.0 20.0 20.0 20.0 20.0Unemployment rate (in percent of labor force) 12.3 12.2 12.9 14.0 14.6 15.3 15.6 15.9 16.2
Investment and savingsSavings/investment balance 11.0 6.6 8.0 5.0 2.7 1.8 1.1 0.6 0.4
Public -1.4 -2.0 -2.2 -2.5 -2.5 -2.9 -3.2 -3.5 -3.7Private 12.4 8.6 10.2 7.5 5.2 4.7 4.3 4.2 4.1
Budgetary operationsRevenue 19.7 15.0 13.9 12.4 11.8 11.1 10.4 9.9 9.4
Of which : oil revenue 10.8 6.6 6.2 4.5 3.7 3.1 2.5 2.1 1.6Expenditure 19.5 15.3 14.8 14.9 14.3 13.9 13.6 13.4 13.2
Expense 14.8 13.1 13.6 12.9 12.5 12.3 12.1 12.1 12.0Net acquisition of nonfinancial assets 4.7 2.2 1.2 2.0 1.8 1.6 1.5 1.3 1.2
Net lending/borrowing (overall balance) -1.4 -2.0 -2.2 -2.5 -2.5 -2.9 -3.2 -3.5 -3.7Net lending/borrowing (budget) 0.2 -0.3 -0.9 -2.5 -2.5 -2.9 -3.2 -3.5 -3.7Balance of Targeted Subsidy Organization -1.6 -1.6 -1.3 0.0 0.0 0.0 0.0 0.0 0.0
Monetary sectorCredit to the private sector in rials 20.1 17.7 24.6 19.6 22.9 18.6 16.8 15.9 15.6Broad money (M2) 19.6 30.6 24.9 24.1 24.5 20.1 19.3 18.9 18.9
External sectorCurrent account balance 59.4 26.3 29.2 20.4 11.3 7.7 5.2 3.0 1.9
In percent of GDP at market prices 11.0 6.6 8.0 5.0 2.7 1.8 1.1 0.6 0.4Gross official reserves 92.2 104.4 107.7 110.1 110.0 106.9 104.3 99.6 93.7
Oil and gas sectorTotal oil and gas exports (billions) 118.2 62.9 56.3 52.8 46.5 41.1 36.5 32.4 28.7Crude oil production (in millions of barrels/day) 4.0 3.2 2.8 2.7 2.6 2.6 2.5 2.4 2.3
Memorandum items:Average exchange rate (Iranian rials per U.S. dollar) 11,312 12,260 24,770 … … … … … …
Sources: Iranian authorities; and Fund staff estimates and projections.
1/ The Iranian fiscal year ends March 20.
Table 8. Islamic Republic of Iran: Medium-term Scenario, 2011/12–2019/20 1/
2012/13 2013/14 2014/15 2015/16Staff proj.
(In U.S. dollars, unless otherwise indicated)
(Annual change, in percent, unless otherwise indicated)
(In percent of GDP)
(Annual change in percent, unless otherwise indicated)
(In billions of U.S. dollars, unless otherwise indicated)
INTERN
ATION
AL MO
NETARY FU
ND
43
ISLAMIC
REPUBLIC
OF
IRAN

ISLAMIC REPUBLIC OF IRAN
44 INTERNATIONAL MONETARY FUND
Appendix I. Risk Assessment Matrix1 Nature/source of main threats
Likelihood of realization in the next three years
Expected impact on the economy if risk is realized
Failure to address high unemployment. Youth unemployment is high and could rise significantly ahead, when school graduates enter the labor force. Social conditions could deteriorate markedly.
High
Medium-High The new administration has identified unemployment as Iran’s biggest challenge. If the economy does not generate a sufficient number of jobs, social conditions would worsen and risk political support for reforms. In turn, preserving the economic status quo would exacerbate weaknesses in the corporate and financial sectors, undermining future growth prospects. Hysteresis effects could become significant.
CBI financing for the Mehr housing program. The decision to discontinue CBI financing could be reversed if no alternative source of funding is found.
Medium Medium-High If the CBI were to be called upon to resume supporting the program, it would undermine its efforts to stabilize money growth and the exchange rate, contain aggregate demand, and reduce inflation to low levels.
A further deterioration of Iran’s external environment. There is a risk of further intensifications of trade and financial sanctions, including FATF countermeasures.
Medium
Medium–High An intensification of sanctions on trade and financial transactions would negatively affect oil production, reduce external surpluses, and put downward pressure on the exchange rate. Fiscal revenue would decline, triggering cuts in capital spending with adverse consequences for growth. Confidence in the private and financial sector may also fall, and reliance on the informal sector might increase.
A large and prolonged decline in global oil prices. New energy sources may come online sooner than expected, or the global economy may enter a new synchronized downturn, depressing demand.
Low Medium–High Oil export revenue has already about halved from its 2011 peak following the tightening of economic sanctions. It is likely to continue declining due to the current sanctions. Lower oil prices would depress oil revenues further, which may require a new round of import and expenditure cuts. To minimize the social impact of the adjustment, fiscal and monetary policy may not tighten sufficiently, fuelling inflation.
Sharp slowdown in growth in China. The buildup of excess capacity may eventually lead in large financial and fiscal losses.
Medium
Low–Medium China accounts for about 40 percent of all Iranian oil exports since mid-2012. Given the constraints on exports, it would be difficult to replace weaker demand from China with exports to other destinations.
1 The Risk Assessment Matrix (RAM) shows events that could materially alter the baseline path (the scenario most likely to materialize in the view of IMF staff). The relative likelihood of risks listed is the staff’s subjective assessment of the risks surrounding the baseline. The RAM reflects staff views on the source of risks and overall level of concern as of the time of discussions with the authorities. Nonmutually exclusive risks may interact and materialize jointly.

ISLAMIC REPUBLIC OF IRAN
INTERNATIONAL MONETARY FUND 45
Appendix II. Illustrative Medium-Term Scenarios
These scenarios show that, in the absence of a sharp increase in oil prices or production and structural reforms that fundamentally boost potential non-oil growth, Iran will continue to face significant constraints in achieving sustainable growth and lower inflation.
1. Baseline scenario: With sustained restrictions on oil exports and international financial transactions, the external and fiscal accounts will continue to deteriorate over the medium term. In response, the authorities will reduce expenditure to levels that yield manageable deficits and stabilize inflation at relatively high levels. The exchange rate will depreciate in line with inflation, with risks of periodic volatility and sharp real depreciation, while credit to the private sector will be crowded out by credit to government linked to fiscal deficits. Non-oil growth stabilizes well below potential. Relatively soft budget constraints in the corporate sector help to hoard labor, but unemployment still rises, as low growth impedes job creation needed to absorb new entrants.
2. Alternative scenario: Sanctions continue to ease in 2014/15. Oil production and exports recover by about 1 million barrels per day by 2015/16, with oil output back to 2007 levels by 2017/18. Policies are adjusted to lessen the inflationary impact of the fiscal deficit. The exchange rate is unified in 2015/16, around the current bureau/parallel market rate, supported by profit (interest) rates that are aligned more closely with inflation. Non-oil tax revenues grow somewhat faster than GDP, mostly benefiting from improved tax administration. However, there are no new tax policy measures, which along with the continued net savings in the NDFI, constrain public expenditures. These expenditures remain broadly in line with the path derived from a PIH rule. Structural reforms, along with the use of NDFI resources, support private investment, a recovery in non-oil growth and lower unemployment.
2011/12 2012/13 2013/14 2014/15 2015/16 2016/17 2017/18 2018/19 2019/20
Real GDP at market prices 2.7 -5.6 -1.7 1.5 2.3 2.3 2.3 2.3 2.4CPI inflation (average) 21.5 30.5 35.2 23.0 22.0 20.0 20.0 20.0 20.0
Overall general government balance -1.4 -2.0 -2.2 -2.5 -2.5 -2.9 -3.2 -3.5 -3.7Non-oil balance in percent of non-oil GDP -16.8 -10.5 -10.3 -8.3 -7.4 -6.9 -6.6 -6.3 -6.0
External current account balance 11.0 6.6 8.0 5.0 2.7 1.8 1.1 0.6 0.4
Gross official reserves (in billions of U.S. dollars) 92.2 104.4 107.7 110.1 110.0 106.9 104.3 99.6 93.7
M2 growth (in percent) 19.6 30.6 24.9 24.1 24.5 20.1 19.3 18.9 18.9Private sector credit growth (in percent) 20.1 17.7 24.6 19.6 22.9 18.6 16.8 15.9 15.6
Memorandum items:Oil and gas sector
Total oil and gas exports (in billions of U.S. dollars) 118.2 62.9 56.3 52.8 46.5 41.1 36.5 32.4 28.7Crude oil production (in millions of barrels/day) 4.0 3.2 2.8 2.7 2.6 2.6 2.5 2.4 2.3
Sources: Iranian authorities; and Fund staff estimates and projections.
1/ The Iranian fiscal year ends March 20.
Projection
(In percent of GDP; unless otherwise indicated)
(Annual percentage change)
Medium-Term Baseline Scenario, 2011/12–2019/20 1/

ISLAMIC REPUBLIC OF IRAN
46 INTERNATIONAL MONETARY FUND
2011/12 2012/13 2013/14 2014/15 2015/16 2016/17 2017/18 2018/19 2019/20
Real GDP at market prices 2.7 -5.6 -1.7 2.2 4.2 4.3 5.4 5.7 5.7CPI inflation (average) 21.5 30.5 35.2 21.5 18.0 12.5 8.7 6.3 5.0
Overall general government balance -1.4 -2.0 -2.2 -0.5 0.5 0.8 1.0 1.3 1.3Non-oil balance in percent of non-oil GDP -16.8 -10.5 -10.3 -8.8 -9.3 -7.9 -6.8 -5.5 -4.7
External current account balance 11.0 6.6 8.0 4.2 5.2 3.2 2.4 1.3 1.0
Gross official reserves (in billions of U.S. dollars) 92.2 104.4 107.7 111.1 121.7 139.5 158.5 174.0 195.8In months of imports of goods and services 13.8 17.2 12.8 11.5 11.3 12.1 12.8 13.4 12.1
M2 growth (in percent) 19.6 30.6 24.9 24.2 21.1 19.1 19.4 19.9 19.6Private sector credit growth (in percent) 20.1 17.7 24.6 24.0 24.3 20.0 20.1 20.7 19.8
Memorandum items:Oil and gas sector
Total oil and gas exports (in billions of U.S. dollars) 118.2 62.9 56.3 69.8 86.5 87.4 88.8 85.0 82.3Crude oil production (in millions of barrels/day) 4.0 3.2 2.8 3.2 3.8 4.0 4.2 4.3 4.3
Sources: Iranian authorities; and Fund staff estimates and projections.
1/ The Iranian fiscal year ends March 20.
Islamic Republic of Iran: Medium-Term Alternative Scenario, 2011/12–2019/20 1/
Projection
(In percent of GDP; unless otherwise indicated)
(Annual percentage change)

ISLAMIC REPUBLIC OF IRAN
INTERNATIONAL MONETARY FUND 47
Appendix III. External Sustainability and Exchange Rate Assessment
Models based on high-frequency data suggest that the rial remains above its estimated equilibrium on a real effective basis, despite the significant depreciation in 2012. Likewise, the macroeconomic balance approach for estimating current account norms of oil exporters also suggest that Iran’s medium-term current account is slightly below its equilibrium level. In contrast, the external sustainability approach indicates the opposite conclusion, finding that the medium-term current account is above the norm. Staff believes that the worsened external environment in recent years and the uncertainty about Iran’s external conditions in the future complicate estimates of current account norms, clouding the assessment of the exchange rate.
1. Iran’s current account surplus has declined markedly in recent years amid a deteriorating external environment. Oil export receipts have declined by over 50 percent since mid-2012, mostly reflecting a decline in oil export volume. Non-oil exports have remained broadly unchanged. Imports have also decline markedly as a result of the real exchange rate depreciation and higher costs of conducting international business. As a result, the current account surplus declined from 11 percent of GDP in 2011/12 to 6.6 percent of GDP in 2012/13.
2. External buffers still appear comfortable. Gross foreign exchange reserves stood at about $110 billion, equivalent to 17 months of imports and 49 percent of broad money, at end-December 2013. However, difficulties in accessing the international payment system and making payments in convertible currencies following the intensification of international sanctions in 2012 have affected the liquidity and currency composition of foreign assets. External debt has declined to $7 billion (6 percent of gross reserves), given difficulties in securing foreign credit for imports.
3. Iran’s real effective exchange rate depreciated significantly in 2012, but accelerating domestic inflation has since reversed some of the decline. The Iranian authorities introduced a three-tiered exchange rate system in September 2012. Imports of a few basic necessities such as medicine remained at the unchanged official exchange rate, while importers of most other priority imports received their foreign exchange at the newly established Foreign Exchange Center at a rate that more depreciated than the official rate but preferential compared to the bureau/parallel rate. As a result, the real effective exchange rate based on the bureau/parallel exchange rate started to depreciate earlier in 2012 and depreciated significantly more than the real effective exchange on the official rate, but the trajectories have been similar. Both rates fell steeply in the second half of 2012 amid the coming into effect of new economic sanctions against Iran. The
40
60
80
100
120
140
160
180
200
40
60
80
100
120
140
160
180
200
Jan-
03
Nov
-03
Sep-
04
Aug
-05
Jun-
06
May
-07
Mar
-08
Feb-
09
Dec
-09
Nov
-10
Sep-
11
Jul-
12
Jun-
13
REER (parallel)
REER (official)
Source: IMF staff calculations.
Official and Parallel Real Effective Exchange Rates (Index 100=2005)

ISLAMIC REPUBLIC OF IRAN
48 INTERNATIONAL MONETARY FUND
authorities ceased transacting at the most appreciated official rate in July 2013, making the FX Center rate the official rate. Since the end of last year, accelerating inflation has pushed up the REERs by more than 30 percent.
4. The equilibrium real effective exchange rate approach analyzes the relationship between Iran’s official exchange rate and economic fundamentals. Using monthly data, a vector error-correction model estimates the long-run relationship between Iran’s real effective exchange rate (REER) and oil prices and oil exports. Given observed values of the fundamentals, the model predicts an equilibrium level of the REER in every period. In addition, the model can break down movements in the equilibrium into changes in the fundamentals.
5. The equilibrium approach suggests that the official real effective exchange rate was overvalued despite the significant depreciation in 2012. The rial depreciated by about 50 percent on a real effective basis in September 2012, when the authorities introduced a new depreciated official rate applicable to most current account transactions. Meanwhile, however, the equilibrium REER dropped even more sharply due to the steep fall in reported export volumes. The model therefore suggests that the depreciation in 2012 reflected the marked deterioration in Iran’s external environment. The value of the rial in the bureau/parallel market has remained about 20 percent more depreciated than the official rate, providing another angle to examine the degree of exchange rate misalignment.
6. The external sustainability approach suggests the projected current account deficit in the medium term (the underlying current account) is close to its sustainable level. Bems and de Carvalho Filho’s (2009) present a methodology for estimating external sustainability for resource-intensive countries. In their framework, external positions are sustainable if import expenditure equals the income stream derived from resource wealth. Applying this approach to Iran requires two steps. First, to estimate Iran’s hydrocarbon wealth, staff assumes that export volumes of crude oil remain constant from 2019 at a level that is three quarters below the average export volume in 2007–12. Gas export volumes grow by 2.4 percent per year from 2018, consistent with the U.S. EIA 2013 annual report. Assumptions about export prices are consistent with the Fall 2013 WEO database. The discounted sum of all future hydrocarbon exports is then equal to $712 billion, an
0
50
100
150
200
250
300
350
0
50
100
150
200
250
300
Jan-
03
Nov
-03
Sep-
04
Aug
-05
Jun-
06
May
-07
Mar
-08
Feb-
09
Dec
-09
Nov
-10
Sep-
11
Jul-
12
Jun-
13
REER (official)
Equilibrium REER
Source: IMF staff calculations.
REER and EREER (Market)(Index 100=2005)
-200
-150
-100
-50
0
50
100
150
200
250
300
-200
-150
-100
-50
0
50
100
150
200
250
300
Jan-
03
Nov
-03
Sep-
04
Aug
-05
Jun-
06
May
-07
Mar
-08
Feb-
09
Dec
-09
Nov
-10
Sep-
11
Jul-
12
Jun-
13
Oil price
Exports
Source: IMF staff calculations.
Contribution to Changes in EREER (Market)(Index numbers; cumulative from 2003)

ISLAMIC REPUBLIC OF IRAN
INTERNATIONAL MONETARY FUND 49
estimate of Iran’s external hydrocarbon wealth. Second, to estimate the flow of income available for import expenditures, the stock of resource wealth has to be converted into annuities. Two common conversion methodologies exist—constant real per capita annuity and constant real annuity, although the differences are very small in the case of Iran, given low population growth. The results suggest that Iran’s projected (or underlying) current account balance is narrowly above the sustainable levels of around –1 percent of GDP.
7. The current account norms derived from the external sustainability approach are sensitive to parameter choice. For example, if the nominal rate of return that discounts future hydrocarbon export revenue increases from 6 to 8 percent, but real rates of return are unaffected, the current account norm under the constant real per capita rule increases to a surplus of 0.7 percent of GDP in 2019, compared to a deficit of 1.1 percent of GDP. The effect of trimming the assumption of gas export volume growth from 2.4 to 0 percent (because of higher domestic consumption, for example) on the current account norm has a similar magnitude.
-4
-2
0
2
4
6
8
10
2012 2013 2014 2015 2016 2017 2018 2019
UnderlyingNorm - constant real annuityNorm - constant real per capita annuity
Source: Fund staff calculations.
Current Account—Underlying and Norms(In percent of GDP)
GMM Coefficients
Contribution to CA
Norm1
GMM Coefficients
Contribution to CA norm1
GMM Coefficients
Contribution to CA
Norm1
GMM Coefficients
Contribution to CA Norm1
Core CGER regressorsConstant 0.039 3.9% 0.350 3.5% 0.043 4.3% 0.044 4.4%Lagged dependent 0.330 2.5% 0.383 2.9%Fiscal balance/Non-oil fiscal balance GDP 0.851 -3.2% 0.385 -2.1% 0.363 -2.0% 0.391 -2.1%Oil trade balance/GDP 0.454 2.7% 0.469 2.7% 0.459 2.7%Old age dependency -0.053 -0.4% -0.059 -0.4% -0.034 -0.2% -0.034 -0.2%Population growth -0.693 -0.9% -0.930 -1.2% -0.632 -0.8% -0.589 -0.8%NFA/GDP 0.023 0.7% 0.022 0.7%Relative income -0.017 -0.4% 0.044 1.0% 0.071 1.7% 0.073 1.7%Economic growth -0.053 -0.1% -0.069 -0.2% -0.064 -0.2% -0.056 -0.1%
Net oil-exporter specific regressorsOil wealth 0.000 0.7% 0.001 2.1% 0.000 -1.4%Degree of maturity in oil production 0.160 2.8% 0.170 -3.0%
Additional regressorsREER growth 0.073 0.1%Terms of trade growth 4.269 -1.6%
Estimated current account norm (2019) 0.5% 4.7% 10.5% 4.0%Underlying current account
1/ Methodology based on Beidas-Strom and Cashin, 2011, "Are Middle Eastern Current Account Imbalances Excessive?" IMF Working Paper 11/195.
0.4%
Current Account-GMM Estimation and Implied Norm for Net-Oil Exporters 1/(Dependent variable: current account balance, as a share of GDP)
Specification I Specification II Specification III Specification IV

ISLAMIC REPUBLIC OF IRAN
50 INTERNATIONAL MONETARY FUND
8. The macroeconomic balance approach also finds that Iran’s underlying current account is close to its norm. However, unlike the external sustainability approach, the macroeconomic balance approach suggests that Iran’s underlying current account is below the norm. Following Beidas-Strom and Cashin (2011), the macroeconomic balance approach estimates four main specifications of Iran’s equilibrium current account. The specifications differ as to whether they include a lagged dependent variable and how they proxy resource wealth (see text table). Specifications II and IV are the most appropriate for Iran as they capture the economic impact of Iran’s significant oil and gas reserves. In contrast, specification I does not take into account that Iran’s resource wealth surpasses current net foreign assets, and specification III carries a counterintuitive sign on the contribution of oil and gas wealth to the current account norm. The macroeconomic balance approach therefore puts the current account norm at about 4 percent of GDP, which is above staff’s projected current account surplus of 0.6 percent of GDP in 2019.
9. The overall assessment of the rial is different in the alternative scenario, which assumes a different external environment and reforms. In staff’s alternative scenario, oil exports reach their pre-crisis levels by the end of next year, and keep growing to 2.5 million barrels per day in 2019. At these levels of oil exports, the equilibrium REER would be significantly more appreciated, suggesting that the rial is currently undervalued. The external sustainability approach would not detect a misalignment, with the sustainable current account norms practically identical with the underlying current account. Only the result of the macroeconomic balance approach would be unchanged, with the current account norms significantly above staff’s projected current account in the medium term of 1 percent of GDP. In sum, using inputs from the alternative scenario illustrates that the exchange rate assessment hinges crucially on assumptions about the prospects of Iran’s external environment.

ISLAMIC REPUBLIC OF IRAN
INTERNATIONAL MONETARY FUND 51
Appendix IV. Debt Sustainability Analysis
As of December 31, 20132/
2011 2012 2013 2014 2015 2016 2017 2018 Sovereign Spreads
Nominal gross public debt 15.5 9.3 11.8 9.7 10.9 12.5 14.6 16.1 17.6 EMBIG (bp) 3/ "n.a."
Public gross financing needs n.a. 3.7 4.1 4.9 7.8 7.5 9.1 6.0 7.9 5Y CDS (bp) "n.a."
Real GDP growth (in percent) 5.5 2.7 -5.6 -1.7 1.5 2.3 2.4 2.3 2.3 Ratings Foreign Local
Inflation (GDP deflator, in percent) 16.8 37.6 17.6 35.8 20.1 20.3 18.6 18.9 18.9 Moody's n.a. n.a.
Nominal GDP growth (in percent) 23.3 41.3 11.0 33.5 21.9 23.1 21.5 21.6 21.7 S&Ps n.a. n.a.
Effective interest rate (in percent) 4/ 1.9 1.0 1.1 9.3 13.2 18.3 20.5 14.8 13.6 Fitch n.a. n.a.
2011 2012 2013 2014 2015 2016 2017 2018 cumulative
Change in gross public sector debt 0.1 -4.1 2.4 -2.1 1.2 1.6 2.1 1.5 1.5 5.8
Identified debt-creating flows -5.2 -4.6 -1.3 -3.0 0.9 1.4 2.0 1.5 1.4 4.2
Primary deficit -2.6 -0.3 0.3 0.8 2.3 2.2 2.4 2.5 2.7 12.9
Primary (noninterest) revenue and grants25.1 19.7 15.0 13.9 12.4 11.8 11.1 10.4 9.9 69.5
Primary (noninterest) expenditure 22.5 19.4 15.2 14.7 14.7 14.0 13.4 13.0 12.6 82.4
Automatic debt dynamics 5/
-2.6 -3.5 -0.8 -2.1 -0.7 -0.4 -0.1 -0.8 -1.1 -5.3
Interest rate/growth differential 6/
-2.7 -3.8 -0.8 -2.1 -0.7 -0.4 -0.1 -0.8 -1.1 -5.3
Of which: real interest rate -2.0 -3.6 -1.3 -2.3 -0.6 -0.2 0.1 -0.5 -0.8 -4.2
Of which: real GDP growth -0.7 -0.3 0.5 0.1 -0.1 -0.2 -0.2 -0.3 -0.3 -1.0
Exchange rate depreciation 7/
0.2 0.3 0.0 … … … … … … …
Other identified debt-creating flows 0.0 -0.8 -0.8 -1.7 -0.7 -0.4 -0.3 -0.2 -0.2 -3.5
Privatization (negative) 0.0 -0.8 -0.8 -1.7 -0.7 -0.4 -0.3 -0.2 -0.2 -3.5
Contingent liabilities 0.0 0.0 0.0 0.0 0.0 0.0 0.0 0.0 0.0 0.0
Other Debt Creating Flows 0.0 0.0 0.0 0.0 0.0 0.0 0.0 0.0 0.0 0.0
Residual, including asset changes 8/
5.2 0.4 3.8 0.9 0.2 0.2 0.1 0.1 0.0 1.6
Source: IMF staff.
1/ Public sector is defined as central government.
2/ Based on available data.
3/ Long-term bond spread over German bonds.
4/ Defined as interest payments divided by debt stock (excluding guarantees) at the end of previous year.
5/ Derived as [(r - π(1+g) - g + ae(1+r)]/(1+g+π+gπ)) times previous period debt ratio, with r = interest rate; π = growth rate of GDP deflator; g = real GDP growth rate;
a = share of foreign-currency denominated debt; and e = nominal exchange rate depreciation (measured by increase in local currency value of U.S. dollar).
6/ The real interest rate contribution is derived from the numerator in footnote 5 as r - π (1+g) and the real growth contribution as -g.
7/ The exchange rate contribution is derived from the numerator in footnote 5 as ae(1+r).
8/ Includes asset changes and interest revenues (if any). For projections, includes exchange rate changes during the projection period.
9/ Assumes that key variables (real GDP growth, real interest rate, and other identified debt-creating flows) remain at the level of the last projection year.
Islamic Republic of Iran: Public Sector Debt Sustainability Analysis (DSA) - Baseline Scenario
-1.3
balance 9/
primary
(in percent of GDP unless otherwise indicated)
Debt, Economic and Market Indicators 1/
2002-2010
Actual
Projections
Contribution to Changes in Public Debt
Projections
2002-2010
Actual
debt-stabilizing
-15
-10
-5
0
5
10
15
20
2002 2003 2004 2005 2006 2007 2008 2009 2010 2011 2012 2013 2014 2015 2016 2017 2018
Debt-Creating Flows
Primary deficit Real GDP growth Real interest rate
Exchange rate depreciation Other debt-creating flows Residual
Change in gross public sector debt
projection
(in percent of GDP)
-10
-5
0
5
10
15
20
cumulative

ISLAMIC REPUBLIC OF IRAN
52 INTERNATIONAL MONETARY FUND
Baseline Scenario 2013 2014 2015 2016 2017 2018 Historical Scenario 2013 2014 2015 2016 2017 2018
Real GDP growth -1.7 1.5 2.3 2.4 2.3 2.3 Real GDP growth -1.7 3.9 3.9 3.9 3.9 3.9
Inflation 35.8 20.1 20.3 18.6 18.9 18.9 Inflation 35.8 20.1 20.3 18.6 18.9 18.9
Primary Balance -0.8 -2.3 -2.2 -2.4 -2.5 -2.7 Primary Balance -0.8 2.3 2.3 2.3 2.3 2.3
Effective interest rate 9.3 13.2 18.3 20.5 14.8 13.6 Effective interest rate 9.3 13.2 21.2 37.5 22.8 -11.5
Constant Primary Balance Scenario
Real GDP growth -1.7 1.5 2.3 2.4 2.3 2.3
Inflation 35.8 20.1 20.3 18.6 18.9 18.9
Primary Balance -0.8 -0.8 -0.8 -0.8 -0.8 -0.8
Effective interest rate 9.3 13.2 19.6 23.5 16.6 15.5
Recognition of Arrears in 2014, 10 % of GDP
Real GDP growth -1.7 1.5 2.3 2.4 2.3 2.3
Inflation 35.8 20.1 20.3 18.6 18.9 18.9
Primary Balance -0.8 -12.3 -2.2 -2.4 -2.5 -2.7
Effective interest rate 9.3 13.2 14.5 16.4 13.4 12.8
Source: IMF staff.
Underlying Assumptions(in percent)
Islamic Republic of Iran: Public DSA - Composition of Public Debt and Alternative Scenarios
Alternative Scenarios
Composition of Public Debt
Recognition of Arrears in 2014, 10 % of GDP
Baseline Historical Constant Primary Balance
-5
0
5
10
15
20
25
30
2011 2012 2013 2014 2015 2016 2017 2018
Gross Nominal Public Debt
(in percent of GDP)
projection
-5
0
5
10
15
20
2011 2012 2013 2014 2015 2016 2017 2018
Public Gross Financing Needs
(in percent of GDP)
projection
0
5
10
15
20
25
30
2002 2004 2006 2008 2010 2012 2014 2016 2018
By Maturity
Medium and long-term
Short-term
projection
(in percent of GDP)
0
5
10
15
20
25
30
2002 2004 2006 2008 2010 2012 2014 2016 2018
By Currency
Local currency-denominated
Foreign currency-denominated
projection
(in percent of GDP)

ISLAMIC REPUBLIC OF IRAN STAFF REPORT FOR THE 2014 ARTICLE IV CONSULTATION—INFORMATIONAL ANNEX Approved By
Middle East and Central Asia Department (In Consultation with Other Departments)
FUND RELATIONS _________________________________________________________________________ 2
RELATIONS WITH THE WORLD BANK ____________________________________________________ 4
STATISTICAL ISSUES _______________________________________________________________________ 5
CONTENTS
March 13, 2014

ISLAMIC REPUBLIC OF IRAN
2 INTERNATIONAL MONETARY FUND
FUND RELATIONS (As of January 31, 2014) Membership Status: Joined: 12/29/1945; Article VIII General Resources Account SDR Million Percent Quota
Quota 1,497.20 100.00 Fund holdings of currency 1,497.20 100.00 Reserve position 0.01 0.00
SDR Department SDR Million Percent of Allocation
Net cumulative allocation 1,426.06 100.00 Holdings 1,551.87 108.82 Outstanding Purchases and Loans: None
Financial Arrangements: None
Projected Payments to Fund (SDR Million; based on existing use of resources and present holdings of SDRs)
Forthcoming 2014 2015 2016 2017 2018
Principal Charges/Interest 0.01 0.01 0.01 0.01 0.01 Total 0.01 0.01 0.01 0.01 0.01
Nonfinancial Relations Exchange System
The exchange rate is determined in the central bank’s foreign exchange trading center. The de jure exchange rate arrangement has been a managed floating arrangement against a basket of currencies since 2002. Since the rial continued to depreciate against the basket with some step adjustments, the de facto exchange rate arrangement has been reclassified to other managed arrangement from a stabilized arrangement, effective May 1, 2011. With effect from September 6, 2004, the Islamic Republic of Iran accepted the obligations under Article VIII, Sections 2, 3, and 4 of

ISLAMIC REPUBLIC OF IRAN
INTERNATIONAL MONETARY FUND 3
the Fund’s Articles of Agreement. Iran maintains exchange restrictions and multiple currency practices subject to Fund jurisdiction under Article VIII, Sections 2(a) and 3:
Exchange restrictions arise from (i) limitations on the availability of foreign exchange for travel and studies abroad as well as for the payment for imports based on priority lists. Amounts in excess of these limitations may only be purchased in the foreign exchange bureau market but at a more depreciated exchange rate, and (ii) limitations on the transferability of rial profits from certain investments under the Foreign Investment Promotion and Protection Act and from limitations on other investment-related current international payments under this act.
A Multiple currency practice, which also gives rise to an exchange restriction, arises from the establishment of an official exchange rate for use in all exchange transactions, which in practice differs by more than 2 percent from the rate used by foreign exchange bureaus.
A Multiple currency practice arises from the budget subsidies for foreign exchange purchases in connection with payments of certain letters of credit opened prior to March 21, 2002 under the previous multiple exchange rate system.
Last Article IV Consultation
The last Article IV consultation was concluded by the Executive Board on July 20, 2011.
Technical Assistance
Since FY 2009, Iran received the following technical assistance:
FAD FY 2009 Tax administration and VAT FY 2010 Tax policy FY 2010 Tax Administration—Risk Management and Audit FY 2011 Tax Administration FY 2013 Tax Administration FY 2014 Tax Administration
LEG FY 2009 Anti-Money Laundering/Combating Financing of Terrorism regulations
MCM FY 2010 Macrofinancial Policies and Financial Stability (with MCD and LEG)
STA FY 2011 GDDS: Metadata Development

ISLAMIC REPUBLIC OF IRAN
4 INTERNATIONAL MONETARY FUND
RELATIONS WITH THE WORLD BANK
JMAP Implementation
Area Product Delivery Date
World Bank
Poverty Reduction Employers Survey Analysis FY09
Energy and Mining Electricity Pricing and Power Sector Reform TA FY09
Energy and Mining Promotion of Renewable Energy TA FY09
Transport Transport TA FY10
Country Monitoring Economic Monitoring FY12–FY14
IMF
Financial Sector 2009 Article IV Consultation Report
Technical Assistance
Currency Reform FY2008–10
Monetary Policy Modeling FY2009–10
AML/CFT FY2009–10
Bank Restructuring and Supervision FY2010
Fiscal Sector 2009 Article IV Consultation Report
Selected Issues Paper
Energy Sector Reform FY2009–10
Technical Assistance
Major Tax Reforms FY2009–10
Trade and Exchange Restrictions 2009 Article IV Consultation Report
Exchange Rate Assessment CGER Methodologies
Technical Assistance
Implementing Changes to the Foreign Investment FY2009–10
Regulatory Framework

ISLAMIC REPUBLIC OF IRAN
INTERNATIONAL MONETARY FUND 5
STATISTICAL ISSUES Data provision to the Fund is generally adequate for effective surveillance; however, the data have been reported with significant delays, notwithstanding the recent improvement in timeliness. The Central Bank of Iran (CBI) disseminates key statistical aggregates in its quarterly Economic Trends, also available at <http://www.cbi.ir/e/>. Iran has participated in the International Monetary Fund’s General Data Dissemination System (GDDS) since August 2012 by publishing comprehensive information on the statistical production and dissemination practices on the IMF’s Dissemination Standards Bulletin Board. Iran, however, still needs to improve timeliness of data dissemination to fully meet the GDDS standards.
Real sector statistics
National accounts statistics are reasonably sound but should be released in a timely manner. There is scope for further progress, especially in the coverage of small-scale industries and services, informal sector and calculation of sector based economic activity deflators. Also, the CBI and the Statistical Center of Iran (SCI) could make further progress to review and unify their respective GDP estimates.
Price statistics are methodologically sound and released in a timely manner. The official labor market statistics are released by the SCI, and are based on the definitions by the International Labor Organization (ILO). The data is based on an urban and rural population sample of about 60,000 households, and the threshold for considering a person employed is to have worked at least one hour during the reference week. Labor market statistics, however, could benefit from further improvement, particularly with regard to hours worked and wage data.
Government finance statistics
Fiscal statistics on budgetary central government operations are reasonably sound but should be released in a timely manner.
The data are compiled in accordance with the Government Finance Statistics Manual 2001 (GFSM2001) for the budgetary central government operations. The data consist of a statement of operations for budgetary central government operations and do not cover nonfinancial public corporations. There is scope to improve coverage of fiscal reporting on general government by including the nonfinancial public corporations sector data. In addition, regular reporting on the financial activities of the National Development Fund and the Targeted Subsidy Organization and their consolidation into the public sector accounts could help improve fiscal data coverage. Under current presentation, the Targeted Subsidy Organization is considered as a public corporation and is classified in the nonfinancial public corporations sector.

ISLAMIC REPUBLIC OF IRAN
6 INTERNATIONAL MONETARY FUND
Data on central government operations cover the general budget, the special purpose funds, and certain transactions with the Social Security Organization. These data are not consolidated. There is a need to expand the coverage of central government to include the complete transactions of the Social Security Organization, four pension funds, and five procurement and distribution centers.
The existing cash-based government accounting system should be upgraded toward an accrual accounting system or a modified cash accounting where noncash operations (such as advances and arrears) are identified.
Financing data in the GFS are broken down by residency of debt holders and by type of debt instruments according to GFSM 2001. However, there is a need to develop a comprehensive database on domestic and external public debt and to align the coverage of the monetary data with the coverage of the fiscal data.
Monetary statistics
Monthly monetary data are reported to STA for publication in IFS, but timeliness needs to be improved.
Compilation of monetary statistics diverges from international standards in the application of the residency criterion and in the sectorization and classification of accounts. The authorities are undertaking improvements in each of these areas, in line with the recommendations of past STA missions.
The measure of broad money employed by the CBI does not include deposits of public nonfinancial corporations, local governments, or foreign-currency deposits of residents.
External sector data
The accounting system for foreign exchange receipts and payments of the CBI and banks is being implemented in line with the methodological guidelines of the Fund’s Balance of Payments Manual, fifth edition (BPM5).
Data on the international investment position are compiled, but not disseminated. Only data on public and publicly guaranteed debt are disseminated, but classifications do not fully accord with the guidelines of the External Debt Guide. The data template on international reserves and foreign currency liquidity is not compiled.

ISLAMIC REPUBLIC OF IRAN
INTERNATIONAL MONETARY FUND 7
Islamic Republic of Iran: Common Indicator Required for Surveillance (As of February 25, 2014)
Date of latest
Observation
Date
Received
Frequency
of
Data6
Frequency
of
Reporting6
Frequency of
Publication6
Exchange Rates March 12, 2014 March 12, 2014 D D D
International Reserve Assets and Reserve Liabilities
of the Monetary Authorities1
December 2013 February 2014 M I Q
Reserve/Base Money December 2013 February 2014 M Q Q
Broad Money December 2013 February 2014 M Q Q
Central Bank Balance Sheet December 2013 February 2014 M Q NA
Consolidated Balance Sheet of the Banking System December 2013 February 2014 M Q Q
Interest Rates2 March 2013 November 2013 M Q Q
Consumer Price Index January 2014 February 2014 M M M
Revenue, Expenditure, Balance and Composition of
Financing3–General Government4
NA NA NA
Revenue, Expenditure, Balance and Composition of
Financing3–Central Government
December 2013
January 2014 M Q Q
Stocks of Central Government and Central
Government-Guaranteed Debt5
March 2013 November 2013 Q Q Q
External Current Account Balance September 2013 February 2014 M Q Q
Exports and Imports of Goods and Services September 2013 February 2014 M Q Q
GDP/GNP September 2013 January 2014 Q Q Q
Gross External Debt December 2013 February 2014 M Q Q
International Investment Position 7/ Sept. 2010 May 2011 A I NA
1/ Includes reserve assets pledged or otherwise encumbered as well as net derivative positions. 2/ Both market-based and officially determined, including discount rates, money market rates, rates on treasury bills, and notes and bonds. 3/ Foreign, domestic bank, and domestic nonbank financing. 4/ The general government consists of the central government (budgetary funds, extra budgetary funds, and social security funds) and state and local governments. 5/ Including currency and maturity composition.
6/ Daily (D), weekly (W), monthly (M), quarterly (Q), annually (A), irregular (I), and not available (NA).
7/ Includes the external financial assets and liabilities vis-à-vis nonresidents of the financial sector.

Press Release No. 14/152 FOR IMMEDIATE RELEASE April 3, 2014 IMF Executive Board Concludes Article IV Consultation with the Islamic Republic of Iran On March 28, 2014 the Executive Board of the International Monetary Fund (IMF) concluded
the Article IV consultation1 with the Islamic Republic of Iran.
Iran had achieved considerable progress in raising per capita income and living standards in
previous decades. But in recent years, such progress stalled as both domestic policies and the
external environment deteriorated.
Macroeconomic performance worsened markedly following the subsidy reform in late 2010 and
the intensification of sanctions in 2012. The economy contracted by almost 6 percent in 2012/13
and 12-month inflation rose from about 12 percent in late 2010 to around 45 percent in July
2013. With the deterioration in the external environment in 2012, the authorities abandoned their
unified and managed exchange rate regime until they eventually unified the official exchange
rates again in June 2013. The balance of payments remained in surplus, but the current account
surplus declined to 6½ percent of GDP in 2012/13, almost halving from the year before. The
sharp fall in oil exports was the main factor, partly offset by import compression. The deficit of
the capital account remained contained, leaving the overall balance of payments in a surplus of
3½ percent of GDP in 2012/13. Gross foreign assets of the Central Bank of Iran (CBI) rose to
about $105 billion by end-2012/13. The fiscal position also deteriorated significantly. With
about 10 percentage points of GDP decline in total revenues since 2010/11, the authorities cut
spending and the overall budget balance shifted from a surplus of 3 percent of GDP in 2010/11
to an estimated deficit of 1 percent of GDP in 2013/14. The deficit of the Targeted Subsidy
Organization remained high, bringing the expanded overall deficit to about 2¼ percent of GDP
1 Under Article IV of the IMF's Articles of Agreement, the IMF holds bilateral discussions with members, usually every year. A staff team visits the country, collects economic and financial information, and discusses with officials the country's economic developments and policies. On return to headquarters, the staff prepares a report, which forms the basis for discussion by the Executive Board.
International Monetary Fund
700 19th Street, NW
Washington, D. C. 20431 USA

2
in 2013/14. Throughout these shocks, monetary conditions were relatively accommodative, as
domestic interest rates became increasingly negative in real terms. The financial system was
also adversely affected, particularly banks’ asset quality and profitability.
Since the Presidential election in mid-2013, there have been some signs of stability. The
exchange rate has appreciated markedly in the bureau/parallel market. The CBI has kept a lid on
base money growth thanks to tighter credit to the banking system and some fiscal consolidation,
and 12-month inflation has declined to about 29 percent in January 2014.
Looking ahead, the near-term outlook remains highly uncertain. Facing continued constrained
prospects for oil revenues and international financial transactions, the economy is envisaged to
remain stagnant in 2013/14, with real GDP estimated to decline by 1¾ percent. With some
positive tailwinds from the external side and some incipient signs that the pace of contraction in
domestic demand is slowing, it is projected that economic activity would begin to stabilize in
2014/15, with real GDP projected to increase by 1–2 percent. But the current outlook remains
highly uncertain and subject to downside risks. In the meantime, the authorities are taking steps
to make the regulatory framework for foreign investment in the oil sector more attractive, while
upside risks emanate from the interim agreement with the P5+1.
Executive Board Assessment2
Executive Directors acknowledged the difficult economic environment facing the Iranian
economy in recent years. While Directors were heartened by incipient signs of stabilization in
economic activity and the decline in inflation, they noted that the economic outlook remains
uncertain and subject to downside risks. They encouraged the authorities to continue
implementing prudent macroeconomic policies and advancing structural reforms to lay the basis
for sustained high growth and employment.
Directors emphasized that tight monetary policy, balanced fiscal consolidation, and supply-side
reforms are essential to deal with stagflation. They welcomed the removal of the financing of
the Mehr housing program from the Central Bank of Iran’s balance sheet, and encouraged the
authorities to seek long-term noninflationary financing for this program. Directors also
2 At the conclusion of the discussion, the Managing Director, as Chairman of the Board, summarizes the views of Executive Directors, and this summary is transmitted to the country's authorities. An explanation of any qualifiers used in summings up can be found here: http://www.imf.org/external/np/sec/misc/qualifiers.htm.

3
recommended increasing interest rates gradually to bring inflation down and anchor
expectations. They welcomed the measures to broaden the revenue base away from oil, as well
as the steps to strengthen tax administration and reduce exemptions.
Directors noted that institutional reforms to refocus the Central Bank of Iran’s mandate on price
stability are essential to entrench macroeconomic stability. Reforms to the fiscal policy
framework should strengthen its countercyclical role, limit risks, and enhance macroeconomic
policy coordination.
Directors took note of the staff assessment that the official exchange rate in real effective terms
appears to be somewhat overvalued relative to the level implied by medium-term fundamentals,
while recognizing the uncertainty surrounding that assessment. They welcomed the authorities’
intention to unify the foreign exchange market and remove restrictions, and encouraged the
authorities to manage the exchange rate flexibly in light of external risks and still high inflation.
Directors agreed that subsidy reform should proceed with the right supporting framework and
macroeconomic policies. They supported the authorities’ plans to increase domestic energy
prices gradually, while improving targeted cash transfers. Directors also noted that the reform
should foster the adoption of new technologies and tighter budget constraints in energy-
intensive sectors.
Directors urged the authorities to strengthen the central bank’s supervisory powers and
enforcement capacity. They encouraged the authorities to level the field of competition through
further privatization and reforms to government-mandated credit policies. Directors also agreed
that plans to deal with nonperforming loans and recapitalize public banks should be supported
by restructuring, enhanced risk management and accountability, a strengthened bank resolution
framework, and a financially-sound deposit guarantee fund.
Directors viewed improvements to the business environment as potentially providing a boost to
productivity and growth. They encouraged the authorities to review labor regulations to ease the
rigidity of contracts and nonwage costs. Strengthening the regime against money laundering and
the financing of terrorism would also help reinsert the domestic financial system into the global
economy, lower transaction costs, and increase productivity.
Directors welcomed the authorities’ recent steps to improve the timeliness of official statistics
and noted that there is scope for further improvements.

4
Sources: Iranian authorities; and Fund staff estimates and projections.
1/ The Iranian fiscal year ends March 20.
Islamic Republic of Iran: Selected Macroeconomic Indicators, 2011/12–2013/14 1/
Est. 2011/12 2012/13 2013/14
(Annual change, in percent, unless otherwise indicated)
National accounts Nominal GDP at market prices (in billions of Iranian rials)
6,121,004 6,793,170 9,068,975
Real GDP at factor cost 3.0 -5.8 -1.7 Real oil and gas GDP 1.3 -34.1 -5.7 Real non-oil GDP 3.2 -3.1 -1.4 CPI inflation (average) 21.5 30.5 35.2 CPI inflation (end of period) 20.5 41.2 22.0 Unemployment rate (in percent of labor force) 12.3 12.2 12.9
(In percent of GDP) Budgetary operations Revenue 19.7 15.0 13.9 Of which: oil revenue 10.8 6.6 6.2 Expenditure 19.5 15.3 14.8 Expense 14.8 13.1 13.6 Net acquisition of nonfinancial assets 4.7 2.2 1.2 Net lending/borrowing (overall balance) -1.4 -2.0 -2.2 Net lending/borrowing (budget) 0.2 -0.3 -0.9 Balance of Targeted Subsidy Organization -1.6 -1.6 -1.3
(Annual change in percent, unless otherwise indicated)
Monetary sector Narrow money (M1) 15.8 29.1 20.5 Broad money (M2) 19.6 30.6 24.9
(In billions of U.S. dollars, unless otherwise indicated)
External sector Current account balance 59.4 26.3 29.2 In percent of GDP at market prices 11.0 6.6 8.0 Gross official reserves 92.2 104.4 107.7
(In U.S. dollars, unless otherwise indicated)
Oil and gas sector Total oil and gas exports (billions) 118.2 62.9 56.3 Liquid fuels production (in millions of barrels/day) 4.0 3.2 2.8 Memorandum items: Average exchange rate (Iranian rials per U.S. dollar) 11,312 12,260 24,770

Statement by Jafar Mojarrad, Executive Director for Iran
March 28, 2014
My authorities thank staff for their hard work and the frank and candid discussions. They are in
broad agreement with staff on a wide range of issues, and intend to draw on the Fund’s policy
advice and technical assistance in moving forward with their reform strategy.
The government of President Rohani, which took office in June 2013, has strong political and
social support and a clear mandate to address the economic challenges ahead, including
containing inflation, promoting high and inclusive growth, increasing employment
opportunities, and reducing the economy’s dependence on oil. My authorities are committed to
steadfast implementation of ambitious reforms in several key areas, despite the enormous
obstacles posed by the international trade and financial sanctions. They have already taken steps
to reduce inflation, stabilize the exchange market, and prepare the groundwork for critical
structural reforms to strengthen the economy’s resilience to external shocks.
Overview
Since 2011, the Iranian economy has been exposed to two major domestic and external shocks,
namely the subsidy reform and international trade and financial sanctions, which were
compounded by weak macroeconomic management and inadequate policy response. These
developments, which are well rendered in the report, have led to a significant growth contraction
in 2012/13 and 2013/14, in connection with the intensification of the sanctions, and a sharp rise
in inflation, also reflecting accommodative fiscal and monetary policies and the large pass-
through of the sizable exchange rate depreciation. Nonetheless, the economy has exhibited a
measure of resilience, given the magnitude of the shocks, and is expected to emerge from
recession in 2014/15 and grow by 1.5 percent in real terms. Year-on-year CPI inflation, which
doubled in 2012/13 to 41 percent, has been declining since then, and is estimated at about
23 percent in February 2014 in line with the Central Bank of Iran’s (CBI) effort to contain the
growth of base money. Moreover, the external current account balance has remained in surplus,
gross international reserves have increased, and external debt has remained negligible.
The new government has firmly moved in the direction of easing external constraints and
addressing the many economic, financial, and social challenges ahead. High priority is given to

2
reducing inflation, unifying the exchange rates, completing the subsidy reform, improving fiscal
management, strengthening the banking system, and embarking on critical structural reforms to
invigorate growth and increase employment. Despite the new government’s initial efforts,
including fiscal and monetary discipline, and constructive engagement with the outside world, it
may take some time to achieve macroeconomic stability and set the economy on a path of high
growth and employment creation.
Addressing stagflation
The authorities agree on the strategy to address stagflation through tight monetary policy, fiscal
consolidation, and structural reforms to improve supply response. They plan to lower the
average CPI inflation from 35 percent to 23 percent in a year’s time, notwithstanding the
potential impact from the second phase of the subsidy reform, and have already taken steps to
this effect through a tight control of base money and terminating the financing of the large
housing program (Mehr) by CBI. The authorities agree that bringing profit rates more in line
with inflation would help address some difficulties in credit markets and enable the CBI to
better manage liquidity. They intend to issue CBI participation papers to contain money growth.
While there are concerns about output costs and second-round effects from the planned increase
in domestic energy prices, staff and authorities concur that a gradual monetary policy tightening
will limit these effects, in line with the SIP findings about the inflation-output trade-off in Iran.
Ensuring a successful disinflation strategy also requires a comprehensive reform of the
monetary policy framework, including strengthening the price stability mandate of the CBI and
enhancing its operational independence, on which consensus within the government is growing.
My authorities are open to examining all options in this area in conformity with Iran’s
institutional setting.
Since the successful exchange rate unification in 2002, Iran has adopted a managed float
exchange rate regime, eliminated most exchange rate restrictions for current transactions, and
liberalized some capital movements. Progress in this area, however, has been set back in recent
years, and a large premium has emerged in the bureau/parallel market compared to the official
exchange rate. The authorities are committed to unifying the official and bureau/parallel
exchange rates by mid-2015, notwithstanding the complexity of the task given external
environment constraints. Difficulties in accessing foreign exchange have also resulted in the

3
emergence of arrears on external payments by public and private sector entities. The authorities
are prepared to clear these arrears with foreign assets held abroad, and to eliminate foreign
exchange restrictions and related arrears.
On the supply side, trade and financial sanctions involve drastic physical limitations to output
and exports, as well as high production costs stemming from shortages of inputs and foreign
exchange. These severe constraints, which cannot be easily overcome by increased productivity
or competitiveness, have not allowed the economy to fully benefit from the change in relative
prices induced by exchange rate deprecation, as would be the case under normal circumstances.
Nonetheless, the authorities’ reform agenda includes wide-ranging structural reforms to improve
the business environment, enhance economic efficiency, and raise growth to absorb new
entrants to the labor market.
Fiscal policy
With a significant loss of budget oil revenue due to international sanctions since 2010/11, the
fiscal situation deteriorated in 2012/13 and 2013/14, despite sizable cuts in both capital and
current spending. The overall fiscal balance shifted from a surplus of 3 percent of GDP in
2010/11 to a deficit estimated at 1 percent of GDP in 2013/14. Adding the cash deficit of the
Targeted Subsidies Organization (TSO) raises the expanded deficit to 2¼ percent of GDP.
The 2014/15 budget bill approved on February 6, 2014, seeks to maintain the expanded deficit at
around 2½ percent of GDP (the second phase of subsidy reform should eliminate the TSO
deficit) to continue to support the economy while taking steps to broaden the revenue base away
from oil, prioritizing capital spending, and containing the growth of current spending. Total
spending growth is significantly reduced compared with the previous budget. The VAT rate was
increased from 6 to 8 percent and the authorities intend to raise it further to 10 percent one year
ahead of schedule. The tax law will be reviewed and tax incentives for certain activities and for
large statutory bodies will be reduced. Moreover, capital gains tax on equity investments and
real estate are to be introduced, the tax administration is proceeding with the implementation of
an integrated tax system, and efforts are underway to strengthen compliance. These efforts
would increasingly allow current spending to be covered by tax revenue rather than oil revenues,
which would be mostly allocated to capital spending.

4
Subsidy reform
The landmark targeted subsidy reform (TSR), which was launched in December 2010, initiated
a major shift in a decades-old subsidy system that was very costly and inefficient. The TSR
aimed at replacing subsidies with targeted cash transfers to households, and providing assistance
to enterprises and the government to adjust to the cost of high energy bills. After initial success
in the first phase of the reform, shortcomings in implementation and mounting economic
difficulties, including large depreciation of the nominal exchange rate, led to the postponement
of the second phase in mid-2012. Staff assessment of this important reform in terms of its
economic impact and its implementation, as well as the lessons to be drawn from such
experience, is well articulated in the useful SIP, and my authorities will give them adequate
attention in formulating next steps.
The authorities are committed to pursuing the reform, but with adjustments aimed at improving
the targeting of the most vulnerable households through better identification and means testing
of beneficiaries. The corporate sector will be encouraged to save energy, including the increased
use of less energy-intensive technology, and will be subjected to tighter budget constraints. With
strong political backing for gradually increasing domestic prices, in early February 2014,
Parliament approved plans to cut subsidies on fuel and food, but delayed implementation to
allow the authorities to mitigate the impact on consumers. In an effort to reduce the subsidies’
burden on the budget and improve the cash flow of the reform, the 2014/15 budget calls for
savings of about 2 percent of GDP in subsidy payments.
Financial Sector
Iran’s financial system has been adversely affected by the sanctions and by distortive
government-mandated credit policies, together with weakened risk management and incentives
for adequate supervision, which resulted in high non-performing loans (NPL), low profitability,
and weak credit growth. Efforts to address these problems include strengthening the CBI’s
supervisory powers and extending them to all banks and financial institutions. Non-bank credit
institutions have been encouraged to consolidate and apply for a banking license. In order to
strengthen risk management and compliance with prudential limits, senior management at state-
owned banks have been replaced, and consideration is being given to subjecting these banks to
better accounting and provisioning standards. In addition, steps are underway to restructure and

5
recapitalize public banks to make them more robust financially. Private banks which have
continued to exhibit a relatively better situation, are also strengthening their capital base. With
regard to the rise in NPL, the authorities intend to continue to monitor the situation closely and
will take additional measures, as needed, to strengthen banks’ balance sheets.
Medium-term outlook and structural reforms
The authorities agree that the lifting of the restrictions on oil exports and international financial
transactions, as well as stepped-up implementation of critical reforms will shape Iran’s medium-
term outlook. Quantification of the outlook, however, is subject to a high degree of uncertainty,
and assumptions underlying the scenarios are not necessarily binary, i.e. reforms and lifting of
sanctions take place together (alternative scenario), or do not (baseline scenario). The authorities
are determined to move forward with their reform agenda to the full extent possible regardless
of whether current international restrictions are partially or fully eliminated. Under the
circumstances, authorities believe that with the right policies and reform, Iran has the potential
to achieve growth rates exceeding those stated in the staff alternative scenario.
Deepening structural reforms will be critical to promote higher sustainable growth and increase
employment opportunities, and remains a key objective of the authorities’ medium-term
strategy. Various initiatives have been taken to promote private sector activity and employment,
including simplifying administrative procedures under the ‘Law for Continued Improvement of
the Business Environment” and taking steps to improve the privatization process. The
authorities are aware of the need to raise the employment content of growth by making the labor
market more responsive to changing conditions in the economy, including improving labor skills
and addressing other labor market rigidities. They remain committed to promoting private sector
investment and attracting FDI to facilitate technology transfer and enhance efficiency. Further
efforts would also be made toward improving corporate governance and deepening domestic
capital markets, which the authorities view as critical to promote efficient long-term financing
of the economy.

6
Other issues
Progress on strengthening the AML regulatory framework has been made, most notably the
adoption by the AML High Council of 14 new AML instructions, the establishment of an
economic crime prosecutor office, and a defined roadmap for improving the AML system. The
CFT bill has been approved by Parliament, and since it includes criminalization and punishment
issues, it has been forwarded to the judiciary for an opinion. Recommendations have been made
to make the bill more compliant with best international practice, and it is expected to have the
judiciary’s opinion before end-2014.
On statistical issues, the authorities remain confident that their system is consistent with best
international practice and are considering Fund TA to help reaffirm the underlying
methodologies.
Conclusion
Overall, my authorities face daunting challenges of addressing the multi-layered reforms that are
needed to set the economy anew on a path of macroeconomic stability and high growth in a
highly unfavorable external environment. While the task will be arduous, and will require buy-in
and strong social support, the authorities are firmly determined to see through this difficult
period and look forward to continued close cooperation with the Fund in support of their reform
strategy.