immigration, entrepreneurship and the venture start …web.uvic.ca/~hschuetz/immigstartup6.pdf ·...
TRANSCRIPT

"Immigration, Entrepreneurship and the Venture Start-Up Process"
Herbert J. Schuetze* Department of Economics,
University of Victoria Victoria, BC
E-Mail: [email protected] Phone: (250) 721-8541
Fax: (250) 721-6214
Heather Antecol Department of Economics
Claremont McKenna College Claremont, California
E-Mail: [email protected]
August, 2005
* Corresponding author. Funding for this research was provided by SSHRC (grant # 410-2003-1823). We are grateful to Hui Feng for competent research assistance. We are solely responsible for any omissions or errors.

Table of Contents: 1. Introduction……………………………………………………………………………1 2. Immigration Policy, Structural Market Characteristics and Self-Employment……….5 3. Empirical Framework…………………………………………………………………10 4. Estimation and Results………………………………………………………………...13 5. Earnings Outcomes……………………………………………………………………22 6. Conclusions……………………………………………………………………………27 References………………………………………………………………………………..31 Endnotes………………………………………………………………………………….39 Tables and Figures Table 1: Self-Employment Rates of Men………………………………………………..42 Table 2: Summary of Selected Trends in Predicted Values……………………………..43 Table 3: Decomposition of Changes in the Probability of Self-Employment…………...44 Table 4: Average Log Weekly Earnings of Self-Employed Men………………………..45 Table 5: Earnings Regressions - Assimilation, Cohort and Period Effects……………...46 Figure 1: Business Immigration to Australia and Canada……………………………….47 Appendix Table 1: Variable Definitions…………………………………………………48

1
1. Introduction
Immigrants represent an important source of human capital, which is central to
the development of an entrepreneurial base for many countries. Immigrants are indeed an
entrepreneurial lot – with self-employment rates among many immigrant groups that are
significantly higher than those of native workers. For example, Fairlie (Chapter 10 of
this book) finds that all racial groups in the US, with the exception of Latino immigrants,
have higher self-employment rates than natives. Similar results have been identified
elsewhere in the literature for the US as well as other countries (Clark and Drinkwater,
1998 – UK, Borjas, 1986; Fairlie and Meyer, 1996; Fairlie and Woodruff, 2004 –US, and
Schuetze, 2005 – Canada). The potential to invigorate entrepreneurship through
immigration has not gone unnoticed by policy-makers. Several countries have
implemented programs designed to attract immigrant entrepreneurs. Immigration
policies in countries such as Australia, Canada and Germany include special visas and
entry requirements that facilitate immigration by would-be entrepreneurs.
Perhaps because of the importance of self-employment among immigrants, a
number of research studies have attempted to identify the reasons for the high incidence
of this labor market activity among immigrants compared to natives. A number of
researchers have suggested that cultural factors related to one’s country of origin may
play a role in determining immigrants’ higher propensities towards self-employment.
Light (1984) found significant heterogeneity in self-employment rates across country of
origin and attributed it to diversity in traditions of commerce. Light and Rosenstein
(1995) suggest that different ethnic groups are endowed with diverse “supply
characteristics” that may provide a special advantage in entrepreneurship; such as the

2
ability to cook Chinese food among Chinese immigrants. Others have suggested that
attitudes towards entrepreneurship may be related to one’s religion (Carrol and
Mosakowski, 1987; Rafiq, 1992; and Clark and Drinkwater, 2000). However, empirical
support for the hypothesis that self-employment rates among immigrant groups are
correlated with home-country self-employment rates has been mixed. While Yeungert
(1995) found that immigrants from countries with high self-employment rates are more
likely to become self-employed in the U.S., Fairlie and Meyer (1996) found no
correlation.
One of the dominant explanations for the high rates of immigrant self-
employment put forth early in the literature is blocked mobility. It has been argued that
ethnic minorities faced with discrimination from employers in the wage and salary sector
turn to self-employment as a way to advance in such segmented labor markets1 (Light,
1972; Sowell, 1981; Moore, 1983, Min, 1984; Phizacklea, 1988; Metcalf, Modood and
Virdee, 1996; Mata and Pendakur, 1998; Li, 1998; Wong and Ng, 2002). Examples
include Min (1984) and Wong and Ng (2002), who found that among Korean
entrepreneurs in Atlanta and Chinese self-employed in Vancouver, respectively,
disadvantage in the non-ethnic market was a major reason for choosing self-employment.
Another leading hypothesis suggests that the presence of ethnic concentrations or
“enclaves” in the host country create opportunities for potential immigrant entrepreneurs.
It is argued that ethnic enclaves provide its members with greater access to capital
through the pooling of investment resources (Light, 1972), a supply of local labor (Light
and Bonacich, 1988), and consumers with tastes for goods that ethnic entrepreneurs are
better positioned to provide (Aldrich et al., 1985). However, evidence for such an

3
enclave effect has also been mixed. As Parker (2004: 121-122) points out, while some
studies find that the presence and size of ethnic enclaves positively impacts the
probability of self-employment among its members (Le, 2000; Flota and Mora, 2001; and
Lofstrom, 2002), many do not (Borjas and Bronars, 1989; Yuengert, 1995; Razin and
Langlois, 1996; Clark and Drinkwater, 1998, 2000, and 2002). Even within studies there
is not consensus. For example, Borjas (1986) and Boyd (1990) find support for an
enclave effect among some ethnic groups but not others.
Despite the relatively large literature explaining differences in the levels of self-
employment, however, few studies (only 3 to our knowledge: Borjas, 1986; Lofstrom,
2002; and Schuetze, 2005) have examined the start-up process and the factors that
influence the early years of the business lifecycle among self-employed immigrants2.
This gap in the literature is important to fill because characterizing the start-up process
may provide important clues to how and why immigrant firms are formed and develop
with years since migration in the host country. In addition, all previous studies focus on
immigrant self-employment outcomes in a single country; limiting opportunities to
examine the role that immigration policy plays in immigrant self-employment.
In this chapter we establish the key features of the venture start-up process among
immigrants and attempt to identify factors that influence their decision to start a business.
Primarily due to data limitations our working definition of entrepreneurs throughout this
chapter includes all individuals who are “self-employed” and we use the terms
interchangeably. Because our focus in this chapter is on the path into self-employment
among immigrants, the primary outcome of interest is whether or not immigrants choose
self-employment (the propensity towards self-employment). However, in an attempt to

4
determine the “quality” of immigrant entrepreneurial outcomes we also examine their
weekly earnings. To help identify common traits across countries in the start-up process
and the role that immigration policy and country-specific institutions/market factors play
we analyze self-employment outcomes in three countries – Australia, Canada and the
United States. The economies in these countries are quite similar in many respects, as
has been documented in the literature, but (as we discuss in the next section) differ in
important ways with respect to labor market institutions, broad immigration policy and
policy focusing more specifically on immigrant entrepreneurship. All of this creates a
good “natural experiment” in which to compare the immigrant experience3.
The availability of high-quality census microdata from the three countries allows
us to examine a comparable and detailed analysis of the start-up process. Because cross-
section studies on immigrant outcomes confound secular changes in cohort outcomes
with changes in the start-up patterns of self-employment within cohorts4, we employ an
empirical approach, similar to the relatively large number of studies examining
immigrant outcomes in the wage sector, to examine the self-employment outcomes of
immigrants. In particular, pairs of data files are used to perform an empirical
decomposition that allows identification of start-up patterns (changes in self-employment
incidence within an arrival cohort) for comparison across immigrant cohorts of different
vintages. This method also allows for identification of the performance of self-employed
immigrants relative to natives.
The remainder of this chapter is as follows. Section 2 highlights the immigration
policy and other institutional/structural market differences relevant to immigrant self-
employment outcomes across the three countries over the period examined. Section 3

5
depicts the empirical strategy used to identify the key elements of immigrants’ self-
employment experience. Section 4 describes the data and our primary estimation results
(those focusing on business start-up), while Section 5 examines the “quality” of self-
employment outcomes by examining earnings. Finally, Section 6 concludes the chapter.
2. Immigration Policy, Structural Market Characteristics and Self-Employment
Australia, Canada and the United States have a long tradition of immigration that,
by international standards, has resulted in large immigrant population shares. The
similarities and differences in the immigration experiences of these three countries are
well known and have been exploited by a number of researchers to analyze the impacts of
immigration policy and institutional/market factors on immigrant outcomes5. This
section provides a comparison of the immigration policies, institutions, and structural
market characteristics across these three countries6. Particular attention is given to those
differences that are likely relevant to self-employment outcomes among immigrants and
to the period in which cohort assimilation profiles can be determined from the data
utilized (roughly 1956-1990). For a more exhaustive history of these countries’
immigration policies see, for example, Antecol, Cobb-Clark and Trejo (2003) for
Australia, Green (1995), Green and Green (1992; 1995) for Canada, and for a comparison
between Canadian and US policy, see Borjas (1993).
To begin, we describe similarities and differences in immigration policy and their
likely impacts on self-employment outcomes. Until the 1960’s entry into the three
countries was based primarily on national origin. In the United States the composition of
visas distributed was set to match the national origin of the foreign-born population of the
1920 U.S. Census. Canadian policy gave preference to immigrants from Britain,

6
northwest Europe and the United States, while Australia’s favoured British immigration
(Antecol, Cobb-Clark, Trejo, 2003). In 1962 Canada moved away from national origin
as the right to sponsor family members for immigration was extended to non-traditional
source countries. The US also largely abandoned national origin (Briggs, 1984); a move
that was later followed by Australia in 1973, which ended its “White Australia” policy.
The policies that replaced national origin differed significantly across the three countries.
The introduction of “points systems” in 1967 in Canada and in the late 1970’s in
Australia placed more weight on skilled migration. Under these points systems non-
sponsored immigrants enter under the “skilled category” and are evaluated and obtain
“points” based on observable skills, which are considered important to one’s success in
the labor market. Those obtaining enough points are permitted entry. In contrast, the US
adopted an immigration policy that placed greater emphasis on family reunification.
The shift away from national origin led to a significant change in the source
regions of immigrants to all three countries (see Green, 1995 for Canada, Borjas, 1993
for the US and Miller, 1999 for Australia). The composition of immigrants was
increasingly comprised of immigrants from Asia, for example, as opposed to the more
traditional regions of the United Kingdom and Western Europe. In addition, while there
is considerable debate in the literature regarding the precise reason for the changes in
skill composition7, it has been shown that a shift in the relative skill levels of immigrants
arriving across the three countries occurred subsequent to these policy changes. As is
shown by Borjas (1993) who compares Canada and the United States and Chiswick
(1987) who includes Australia in his comparison of immigrant outcomes, these shifts
resulted in average education levels among immigrants arriving to Canada and Australia8

7
which were higher than those among immigrants to the United States following the
changes in policy in the three countries.9
While these shifts in composition likely had differential impacts on the self-
employment outcomes of immigrants to these countries, the precise nature of these
impacts is unclear. Given that immigrant cohorts were increasingly comprised of ethnic
minorities in all three countries the blocked mobility hypothesis suggests that self-
employment propensities among cohorts arriving after the move away from national
origin would have increased. However, as noted above, the probability of self-
employment may also be affected by the level of self-employment in the source countries
of immigrants and the presence of ethnic enclaves in the receiving country. Moreover,
there are substantial differences in the ethnic composition of immigrants across the three
countries (see Antecol, Cobb-Clark, and Trejo 2003a, 2003b), thus it is unclear what
impact the move away from national origin likely had on relative self-employment
outcomes in these three countries. In addition, previous research largely suggests that
education or skill level is positively correlated with the probability of self-employment in
the overall population10. Thus, increases in the skill level relative to the US among
immigrants arriving in Canada and Australia may have led to increases in self-
employment in these two countries.
The introduction of the skilled class of workers to Canada and Australia likely
also had a more direct impact on self-employment among immigrants. In 1976, in
Australia, and 1978, in Canada, a second category of skilled worker was added with the
creation of a “business skills” class in both countries. The business immigrant programs
introduced in Australia and Canada were similar in many respects but differed in a

8
number of important ways. During the period covered by this study both programs
contained three sub-categories of business class immigrants; the “business owner”,
“senior executive” and “investor”11 categories were introduced in Australia and the
“entrepreneur”, “self-employment”, and (in 1986) “investor” categories in Canada. The
primary differences between the business skills classes and the “standard” skilled worker
class are the criteria used to assess workers’ skills and the requirement to run a business
subsequent to entry. Like the Canadian program, the Australian business skills program
placed greater weight on previous experience (business experience) and the availability
of investment funds12 than the other skilled immigrant entry category. In addition, both
countries’ business skill programs required immigrants, by threat of visa cancellation, to
enter into business within the first three years after arrival13.
However, much like the other skilled immigrant categories14, the criteria used to
determine permanent residency under the business skills program was much more
stringent in Australia than in Canada. Also unlike Canada’s program, the criteria for
entry through the business class in Australia were more difficult to satisfy than those of
the other skilled classes. In general, in order to be eligible for permanent residence in
Australia immigrants had to fulfil a more demanding set of requirements with respect to
age, qualifications, experience and language ability than those intending to migrate to
Canada. In particular with respect to business immigrants, the Australian program
required that applicants had owned or operated a business for at least two of the four
years prior to application. This was not required of business immigrants entering
Canada.

9
This more stringent assessment of potential immigrant entrepreneurs is likely to
result in fewer immigrants choosing self-employment upon entry to Australia, relative to
Canada (and perhaps even the United States, which has no similar entry program), but
increased longevity among permanent immigrants who do start businesses. On the other
hand, the requirement to operate a business within the first few years after arrival may
have resulted in higher rates of self-employment immediately after entry relative to the
US. Thus, the impacts of the Australian business immigrant program on self-
employment early after entry relative to Canada were likely negative while the impacts
relative to US entry self-employment rates are ambiguous.
Indeed Figure 1, which illustrates the percent of total immigration that is
comprised of business immigration in Australia (dashed line) and Canada (solid line) up
until 1990, bears this out to a certain extent. While the percentages of total immigration
comprised of business immigrants entering Australia and Canada annually had increased
substantially by the late 1980’s, these rates were lower in Australia in every year than
those in Canada. Between 1980 and 1986 Canada received an annual inflow of nearly
6,000 business class immigrants; accounting for an average of 6 percent of overall
immigration. By the late 1980’s the number of business class immigrants had increased
to over 15,000 annually or 9 percent of overall immigration. In comparison, in 1982, six
years after the introduction of the program and the first year for which we have data, just
over 1,000 immigrants or 1 percent of total immigrants entered under the business
immigrant program in Australia. This number grew to 10,000 immigrants or 8.25 percent
of the total number of Australian immigrants by 1989. These numbers likely reflect the
more selective nature of the business immigrant program in Australia relative to Canada.
10
Aside from differences in immigration policy, structural and institutional
differences across the three countries are also likely to influence the type of immigrants
attracted to each destination and, therefore, their self-employment outcomes. More
generous social programs (including national health insurance, unemployment insurance
and welfare systems) in Australia and Canada are likely to attract workers at the lower
end of the skill distribution. While the literature on the impacts of taxation is mixed (see
Parker (2004) and Schuetze (2004) for reviews), this type of selection is likely reinforced
by the fact that income tax rates in the United States are structured in such a way as to
allow successful entrepreneurs to reap more of their benefits relative to those in Canada
and Australia. The one cross-country study by Schuetze (2000), which examines
differences in taxation between Canada and the US, supports this hypothesis. In addition
the access to large markets in the United States may attract previously successful
entrepreneurs from other countries. The availability and generosity of loan guarantee
schemes, direct loans to small businesses and other government programs, such as those
that encourage self-employment among the unemployed in Canada and the US, may
result in differences in immigrant self-employment outcomes across the three countries.
Our comparative analysis will help to shed light on the relative importance of the
selection of immigrants based on structural/institutional factors and that of immigration
policy.
3. Empirical Framework
We adopt the regression framework developed by Borjas (1986), as set out in
Schuetze (2005), for estimating the effects of duration in destination country (number of
years since migration) and year of arrival cohorts on self-employment propensities.

11
Focusing on the group of employed immigrants, the following cross-sectional self-
employment probability equation can be estimated by probit for each country separately:
(1) )( 'kt
Kkttt XP δβ ∑+Φ=
where Pt is the probability of self-employment in year t, Xt is a vector of observable
characteristics related to the self-employment decision, Φ is the normal cumulative
distribution function, k indexes a series of five-year arrival cohorts identified by the
earliest year of arrival among those in the cohort (for example the 1971-75 cohort is
labelled 1971), and the δk,t are cohort-year specific intercepts.
One could estimate changes in the self-employment propensity of immigrants
through time using the coefficient estimates of the δk,t from equation (1); looking across
cohorts of different vintages. However, such estimates are unreliable if there exist time
varying cohort specific fixed effects that impact the two sectors of employment
differently. Borjas (1995) and Baker and Benjamin (1994) find that more recent cohorts
of immigrants to the US and Canada, respectively, have poorer earnings outcomes in the
wage sector than earlier cohorts. Thus, the use of a single cross-section is unlikely to be
appropriate. Instead, estimates which are free of this potential fixed effect bias can be
obtained using quasi-panel methods in which “synthetic cohorts” of immigrants are
followed through time. Therefore, equation 1 is estimated at two points in time (1981
and 1991 in Australia and Canada, and 1980 and 1990 in the US).
With this estimation strategy a decomposition of the cross-section change in the
probability of self-employment can be stated as follows. Consider the predicted

12
probability of self-employment for a cohort group k in 1991 evaluated at the average
values of immigrant characteristics in that year ( X ). This probability is given by:
(2) )ˆˆ(ˆ91,9191, kk XP δβ +Φ=
The predicted probability of the cohort in 1991 that arrived ten years later than k, again
evaluated at X , is:
(3) )ˆˆ(ˆ91,109191,10 ++ +Φ= kk XP δβ
Given the definitions in equations 2 and 3 the cross section change in the self-
employment propensity over ten years for 1991 is equal to 91,1091,ˆˆ
+− kk PP . Following
Borjas (1985) this change can be decomposed into two components as follows:
(4) )ˆˆ()ˆˆ(ˆˆ91,1081,81,91,91,1091, ++ −+−=− kkkkkk PPPPPP
where 81,ˆ
kP is the predicted probability of self-employment for cohort k in 1981
evaluated at X (i.e., at the average values of immigrant characteristics in 1991). More
specifically, it is the following prediction:
(5) )ˆˆ(ˆ81,8181, kk XP δβ +Φ=
It is important to note that cohort k in 1981 has the same number of years since migration
as cohort k+10 in 1991.
Thus, the first term on the right-hand side of equation 4 gives the change in the
predicted percent of immigrants in cohort k experiencing self-employment over the ten
year period15. In other words, these estimates provide a measure of net self-employment
start-up for each of our immigrant cohort groups. Because we observe immigrant cohorts
of all vintages (from just after arrival onward) these estimates paint a picture of the entire
self-employment “start-up process” for immigrants16. The second term in equation 4

13
gives the difference in the probability of self-employment between two cohorts with the
same number of years since migration. This difference provides an estimate of the
impact of cohort fixed effects on the propensity to choose self-employment. It will be
negative if more recent cohorts are more likely to choose self-employment (for example,
if wage employment outcomes are worse relative to self-employment for more recent
cohorts).
An additional concern arises when there are unobserved time effects (other than
those arising from years in host country) that change over the ten year period. In this
case the estimates in equation 4 are biased. A common solution to this problem in the
literature is to normalize the changes in immigrant outcomes to some base group. Our
base group is comprised of native workers. Thus, we also provide estimates of the within
and across cohort changes in self-employment probabilities among immigrants that are
net of changes in these predicted probabilities among native workers17 with similar
characteristics over the ten-year period (see Schuetze, 2005, for a more detailed account).
4. Estimation and Results
The data used in the analysis are drawn from the 1981 and 1991 (1 percent
samples) Australian Censuses, the 1981 (2 percent sample) and 1991 (3 percent sample)
Canadian Census Public Use Microdata Files18, and the US Census, 5 percent public use
A samples for 1980 and 1990. These data files are chosen because they are the most
recent census pairs available covering the same period and for which sufficient
comparable information is available to carry out the analysis.19 The samples are
restricted to males who are employed in the survey week (the week prior to the survey),
who are not in the armed forces20 and not in school at the time of the survey. To control

14
for aging within cohorts across the ten-year time frames the samples are restricted to
individuals aged 18 to 54 in 1980/81 and to those aged 28 to 64 in 1990/91.21 Because of
the prevalence of self-employment in the agricultural sector among non-immigrants the
samples are further restricted to individuals employed in non-agricultural industries22.
Due to the large sample sizes of the US census data, 40 percent random samples of non-
immigrants are taken. Weights are applied throughout the calculations to the US samples
that account for the unbalanced samples taken and the fact that the 1990 Census is a non-
random sample of the population. We also exclude individuals with missing values for
any of the variables used in the analysis. Finally, the data files are pooled across pairs of
Census files in each country.
The primary outcome variable of interest in the analysis is an indicator of self-
employment activity. The self-employment indicator used is based on the class of worker
variables in Canada and the United States and on occupational/labor force status in
Australia. In both Canada and the United States, the definition of self-employed includes
individuals who indicate that they work for themselves in incorporated or unincorporated
businesses and those in professional practices. In Australia, the definition of self-
employed includes individuals who indicate they are conducting their own business
irrespective of whether they employ others. In all three countries, the self-employed
definitions exclude unpaid family workers. Table 1 describes how self-employment
varies with nativity and immigrant arrival cohort in the three countries23. Here, and
throughout the chapter, the intervals listed for immigrant arrival cohorts are those defined
in the Australian and Canadian data; the slightly different immigrant cohorts defined in
the U.S. data are as follows: pre-1960, 1960-64, 1965-69, 1970-74, 1975-79, 1980-84,

15
and 1985-90.24 The 1991 Australian census does not distinguish 1960s arrivals from
earlier immigrants, and therefore “pre-1971” is the most precise arrival cohort that can be
defined consistently across censuses for Australian immigrants. For Canada and the
United States, however, immigrants arriving during these years are disaggregated into
“1966-70,” “1961-65,” and “pre-1961” cohorts.
Table 1 shows that in the United States, immigrants as a group have average self-
employment rates that are only slightly above those of native workers (with immigrant-
native self-employment differentials of approximately 1 percentage point), whereas in
Canada and Australia immigrant men tend to have considerably higher self-employment
rates than their native-born counterparts (immigrant-native self-employment differentials
of approximately 4 and 2 percentage points in both years, respectively). In Australia and
Canada, male self-employment rates rose for both natives and immigrants between 1981
and 1991, although the increases were larger in Australia (increases of 4.3 and 5.1
percentage points for natives and immigrants, respectively) than in Canada (where
increases for both groups were 1.8 percentage points). In the US, male rates of self-
employment remained relatively stable over the 1980-90 period. The fact that the
increases across nativity were quite similar within countries, despite differences across
the three countries, might suggest that country-specific factors play a role in determining
self-employment outcomes among immigrants. Finally, examining the raw self-
employment rates across cohorts shows that more recent arrival cohorts in all
years/countries have lower rates of self-employment than earlier arrivals and natives.
However, within 5-10 years in Canada and slightly longer (10-15 years) in the US and
Australia immigrants have completely closed the immigrant/native self-employment gap,

16
irrespective of the survey year. This might suggest that some immigrants require time in
the destination country before starting up businesses and/or that more recent arrivals are
less likely to become entrepreneurs. Distinguishing between these two explanations is
only possible by identifying within cohort changes in self-employment separately from
across cohort changes and controlling for differences in characteristics across groups.
As indicated above, such decompositions are given by equation 4 net of the
outcomes of our base group. In order to derive these, we estimate probit models of the
probability of self-employment, separately, for each country for immigrants and natives
jointly using the pooled data files. In identifying demographic and economic
characteristics that influence the relative returns in the two sectors for inclusion in the
analysis we are guided by previous research on the determinants of self-employment25
and immigrant outcomes in the wage and salary sector26. We include controls for age,
level of education, marital status and source country of immigrants (see Appendix Table
1 for variable definitions).
To make the decomposition more tractable we place some constraints on the
coefficients. In particular, we allow the impacts of the demographic and economic
variables to differ across immigrants and natives but restrict them to be the same within
these groups across the years examined; such that; β81=β91=β and θ81=θ91=θ. With these
assumptions the decompositions for each country can be derived using the pooled data
files through the estimation of a single probit equation and interacting the appropriate
coefficients with indicator variables for survey year and immigration status to match the
constraints imposed. To overcome the classic problem of distinguishing between cohort,

17
age and period effects we impose the common identifying restriction that the period
effect is the same for immigrants and natives27.
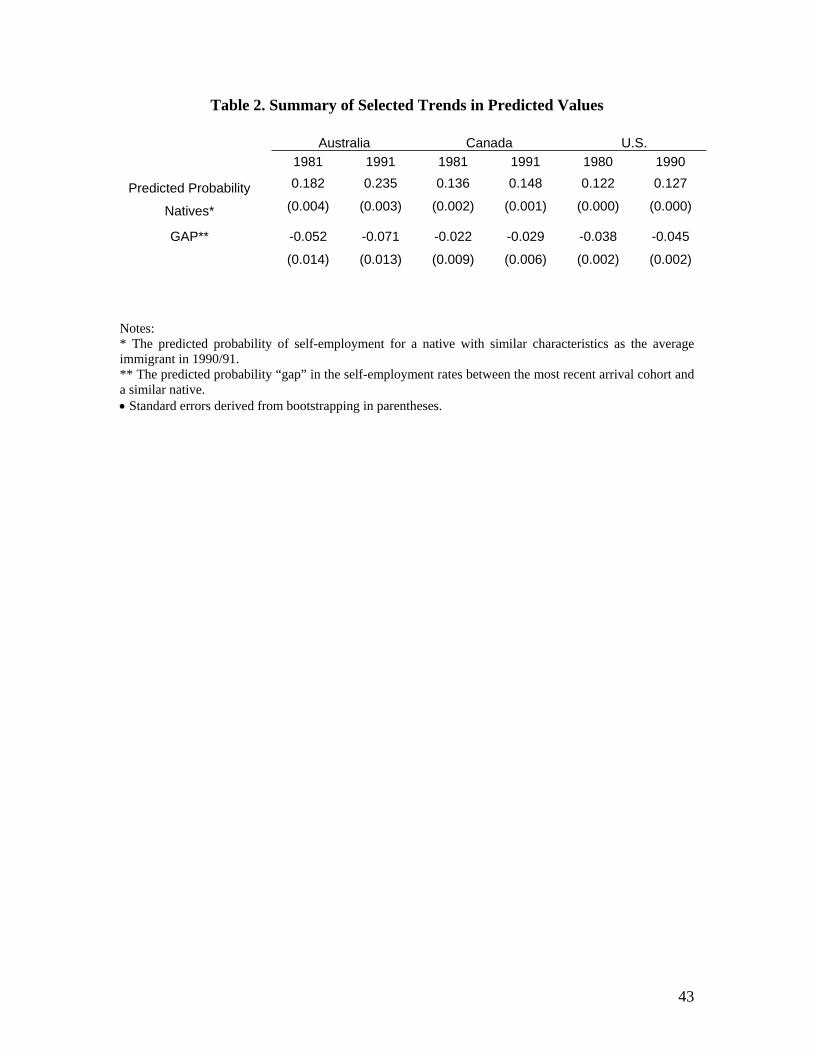
Table 2 highlights some of the trends in predicted outcomes derived from the
coefficient estimates28. The first row provides the predicted probability of self-
employment for each year and country for a native with the average characteristics of
immigrants in 1990/91, in each country. Consistent with overall trends in self-
employment in the three countries these results show secular growth in self-employment
among these representative workers in Australia and Canada and little or no change in the
United States. Much like the raw trends, self-employment grew most rapidly in Australia
even after controlling for individual characteristics. Row 2 of the Table 2 gives the
predicted self-employment rate gap between a representative immigrant from the most
recent arrival cohorts in each year/country and a similar native. This gap is negative and
statistically significant in all cases, which suggests that immigrants to all three countries
initially enter with self-employment rates that are lower than those among similar native
workers. Consistent with our expectations on the impacts of a more selective business
immigrant program in Australia, the gaps in self-employment rates upon entry are
greatest among immigrants to Australia. These gaps are lowest among immigrants to
Canada, perhaps as a result of the requirement to own and operate a business early after
entry to Canada (within the first three years) under the business skills program, although
the Canada-US differences are not large. Finally, while the gap grew between 1980/81
and 1990/91 in all three countries, the gap grew most substantially (from 5 percentage
points to 7 percentage points) in Australia while in Canada and the US it grew more
modestly, from 2.2 (3.8) to 2.9 (4.5) percentage points in Canada (the US). To determine

18
whether or not these gaps persist over time in the destination country we turn next to the
decompositions.
Table 3 presents decompositions of the cross-section self-employment
propensity profiles into estimates of the “within” cohort increases in self-employment net
of cohort effects, our measure of the self-employment start-up process, and estimates of
the effects of changes in cohort propensities “across” cohorts with similar years since
migration. The first column under each of the country headings gives the cross-section
prediction of self-employment growth while the second and third columns provide the
decompositions of these without adjusting for secular changes in self-employment over
the period. The last two columns account for secular changes in self-employment in each
of the countries using natives as the base group. The cross-section estimates show little
growth in business start-up among immigrants beyond the first 10 to 15 years after arrival
in all three countries. Most of the entries are statistically insignificant with the exception
of those for the most recent arrivals. However, the “unadjusted” results of the
decomposition show that, once across cohort effects are taken into account, immigrants in
all three countries experience significant within cohort increases in business start-up that
extend beyond the first 10 to 15 years in the destination country. The across cohort
estimates, which are negative and generally statistically significant, suggest that secular
changes in the composition of immigrant cohorts have led to increases in self-
employment propensities among immigrants with similar years in all three countries.
Thus, confirming that the cross-section self-employment growth estimates are biased.
Looking across countries (still focusing on the unadjusted results), an interesting
pattern of self-employment growth is observed through time in the destination country.

19
In all countries, the within cohort increases in self-employment propensities are higher
among the most recent arrival cohorts than among those with more potential labor market
experience in the destination country. Thus, it appears that the business start-up process
is accelerated in the first ten to fifteen years after arrival. In addition, the rate of growth
within cohorts is much higher across all vintages of immigrants in Australia than in
Canada or the US. This is interesting in light of the fact that the self-employment rate
gap between immigrants and natives upon entry to Australia is much larger than those in
Canada and the US (see Table 2). It also appears that the across cohort increases in self-
employment were higher in Australia. These patterns may also reflect overall trends in
employment compensation in the three countries that have made self-employment more
attractive; a dominant feature of the Australian experience. Before deriving any
conclusions, however, the analysis must control for general trends in self-employment
outcomes.
The “adjusted” entries in each of the country panels account for these secular
trends. The overall effect of normalizing the results is to dampen both the within and
across cohort effects (albeit only very slightly in the US). In fact, a number of the entries
in the “adjusted” column become small in magnitude and statistically insignificant. This
suggests that some of the growth in self-employment within and across cohorts is
explained by secular increases in the probability of self-employment within the three
countries. Despite this, some of the entries remain significant after normalizing and
interesting patterns of self-employment “assimilation” continue to emerge across the
countries.

20
First, there is some evidence of increases in the propensity towards self-
employment across cohorts that are consistent with the timing of changes in immigration
policy that were implemented between the 1960’s and the 1970’s in all three countries.
The move away from national origin occurred early in the United States; the effects of
which were most noticeable by the early 1970’s, in terms of source country composition.
The statistically significant across cohort entries for the “61-71” and the “66-76” cohorts
are consistent with the timing of these changes and with the shift in policy resulting in
higher rates of self-employment among immigrants. As noted above, the move away
from national origin occurred somewhat later in Australia and Canada. However, despite
similar changes in policy with respect to national origin and the introduction of points
systems there is only weak evidence of across cohort increases in self-employment
around the time of these changes in Canada and Australia. Point estimates for the “66-
76” and “71-81” across cohort changes indicate somewhat sizeable increases in the self-
employment propensity for both countries; however they are not statistically significant
at conventional levels.
Second, it appears that a number of immigrants require time in wage employment
before starting self-employment ventures. Rates of self-employment within cohorts net
of secular trends increase with years since migration among immigrants to all three
countries. Like the patterns observed in the unadjusted results, much of this
“assimilation” occurs in the first ten to fifteen years after arrival. The estimated within
cohort increases among the most recent arrivals in each of the three countries are larger in
magnitude and more likely to be statistically significant than those among earlier arrival
cohorts. For example, the most recent arrivals to Australia in the 1981 census (the 1976-

21
1980 arrivals) experienced an increase of 9 percentage points over and above that
predicted for similar natives in their first 10 to 15 years in that country, between 1981 and
1991. This compares to a less than 4 percentage point net increase over this period
among those who arrived 5 years earlier (between 1971 and 1975) and zero net growth
for those who arrived ten years earlier.
In addition, the magnitudes of the increases in self-employment propensities
experienced among immigrant cohorts in their first 10 to 15 years in each country are
substantial. Continuing with Australia as an example, the gap between the “76” cohort
and natives upon entry in 1981 was just over five percentage points (see Table 2). As
noted above this cohort experienced an estimated net increase in the self-employment rate
of 9 percentage points and implies that by 1991 the rate of self-employment for this
cohort was nearly 4 percentage points higher than a similar native. Similarly, the
projected self-employment rate differentials between immigrants to Canada and the US
and similar natives were 2.8 and 2.4 percentage points based on the gap from Table 2 and
within growth for the “76” cohorts in Table 3. In all cases immigrant self-employment
rates caught up to and overtook those of similar natives in the first 10 to 15 years after
arrival. Interestingly, this “overtaking” occurred despite significant differences in the
size of the entry gaps across the countries. Indeed, it appears that the amount of
“assimilation” that occurred after entry, to a certain extent, coincided with the size of the
entry gaps. The entry gap and the net increases in self-employment subsequent to entry
were highest among immigrants to Australia, followed by those to the United States, and
then those to Canada. However, consistent with our expectation of longer survival in
self-employment due to the relatively more selective Australian skilled worker categories

22
(both business and standard skilled classes), the amount of “overtaking” was less among
immigrants to Canada and the United States than among Australian immigrants.
The fact that immigrant self-employment rates rapidly overtook those of natives
despite differences in the general level of self-employment across the three countries
suggests that, regardless of differences in the institutional or country specific factors that
influence rates of self-employment, immigrants adapt quite rapidly. That immigrant self-
employment rates eventually exceed those of similarly skilled natives may suggest that
workers who choose to immigrate are more “entrepreneurial” than non-migrants. On the
other hand (as discussed earlier in the introduction to this chapter) immigrants may
choose self-employment not because they possess strong business skills but because of
blocked mobility in the wage sector and, thus, self-employment represents employment
of last resort. We attempt to sort between these two possibilities in the next section.
5. Earnings Outcomes
The results in Section 4 highlight the differences in the numbers of immigrants
who choose self-employment across the three countries but give little indication as to
whether or not these are good business ventures. In this section we attempt to shed light
on the relative “quality” of the self-employment experiences of immigrants to Australia,
Canada and the United States by examining the earnings outcomes of the self-employed.
Once again using these three countries as a “laboratory”, by analyzing this measure of
quality we hope to further our understanding of the impacts of immigrant policy and
other institutional/market characteristics on immigrant self-employment outcomes.
The approach taken to examine earnings is similar to that outlined above in
Section 3 to examine self-employment propensities, except for the following important

23
differences. First with respect to the sample, we continue to focus on males in the same
age categories as above and who are not in agricultural industries or enrolled in school at
the time of the survey. However, we now restrict attention to individuals who are self-
employed and with a reasonable attachment to the labor force (worked 14 or more weeks
in the previous year).29 Because the class of worker variables in the Canadian and US
census files refer to the type of employment during the survey week while the earnings
data pertain to the previous year, we alter our definition of “self-employed” in the
earnings analysis.30 In particular, the data in these two countries contain information on
the amount and source of income in the year prior to the survey, which we use to impute
whether the individual was self-employed or not. For the vast majority of individuals in
our samples, assigning self-employment status on the basis of this information is straight-
forward: most respondents had only one source of labor market income (wage and salary
earnings or self-employment income). For those with multiple sources of earnings we
simply assigned individuals earning a substantial fraction31 of their previous year’s
income from running a business to the “self-employed” category. Because income from
the operation of an incorporated business is included in the wage and salary earnings of
these individuals in these two surveys, unlike above, the definition of “self-employed”
used in this section includes only those who operated unincorporated businesses. Given
that most businesses in the early stages of development are likely to be unincorporated,
this difference is likely not an issue.
The measure on which we concentrate our attention is the log of weekly
earnings.32 This measure was chosen, in part, because the hours worked variable in the
Australian data is reported as a categorical variable; making hourly earnings infeasible to

24
calculate. In addition, the Canadian data on hours pertains to the survey week rather than
the year prior to the survey. To examine the sensitivity of our results to possible
variation in hours worked we redid the analysis restricting the sample to full-time
workers. These results, which are available upon request from the authors, were
substantively similar to those presented in the chapter. Finally, because the earnings
measure is continuous, unlike above, the estimation equations in this section are linear
and estimated using multiple regression analysis.33
Table 4 describes how log weekly earnings among the self-employed vary with
nativity and immigrant arrival cohort in the three countries. To enable the reader to draw
comparisons across years, within each country, we restrict attention to individuals aged
18-54 (20-54 in Australia) in all years and inflate the 1980/1981 earnings to 1990/91
values using the CPI from each of the countries. However, comparisons of the levels of
earnings across countries are not meaningful as we did not adjust the figures for the rates
of exchange between the various currencies. On average, it appears that self-employed
immigrants earn approximately the same amount of income as natives in all three
countries. In addition, immigrants and natives in all three countries experienced little
growth in real log earnings over the period. One difference across the three countries of
note is that the pattern across cohorts in average earnings appears to differ in the United
States from those observed in Australia and Canada. There are generally no significant
differences between the average earnings of more recent and earlier arrival cohorts in
Australia and Canada, while raw average earnings increase with years in the United
States.

25
The decomposition of the log weekly earnings of self-employed immigrants into
within and across cohort changes presented in Table 5 allow us to control for possible
changes in the “quality” of immigrants across cohorts, differences in labor market
characteristics, and secular trends in earnings. The second and third columns in each of
the country panels, which give the decomposition results without adjusting for secular
trends among natives, indicate significant increases both within and across cohorts in all
three countries. Most of these increases, as indicated by the “adjusted” results, are
attributable to growth in nominal earnings and other secular trends. Controlling for these
secular trends (columns 4 and 5), we find that an interesting pattern emerges across the
countries. Male self-employed immigrants to Australia enter with average log weekly
earnings that are about the same as a similar native (the estimated “gap” in 1981 is
negative 3 percent but statistically insignificant) and earnings do not appear to increase
relative to natives with time in the country. Looking across cohorts with the same
number of years in Australia, there is no indication of changes in earnings outcomes; in
other words, no indication of a change in quality across cohorts.
Compared to Australia, the outcomes among self-employed immigrants to Canada
appear to be worse. The entry earnings gap between self-employed immigrants and
natives (estimated at negative 21 percent and significant in 1981) suggests that an
immigrant arriving in the late 1970’s entered with earnings below those of similarly
skilled natives. In addition, while earnings among earlier cohorts increased relative to
natives between 1981 and 1991, those of immigrants arriving to Canada in the late 1970’s
did not. Neither the “71” or “76” arrival cohorts experienced significant within growth
net of secular trends over the ten year period while the “61” and “66” arrival cohorts did.

26
Thus, it appears that either the self-employed immigrant earnings outcomes of more
recent arrivals are poorer relative to earlier arrivals or that it takes several years in
Canada for the earnings of self-employed immigrants to catch up to those of natives.
Finally, evidence of a further deterioration in earnings outcomes among Canadian
immigrants is reflected in the earnings gap, which fell to almost negative 40 percent in
1991.
In contrast to the earnings outcomes of self-employed immigrants to Canada,
immigrants to the US performed quite well relative to natives in that country. While
male self-employed immigrants to the US entered with earnings below those of similar
natives (the gap is estimated at negative 18 percent in 1980), their earnings appear to
catch-up to those of natives in the first number of years in the country. Earnings among
the “76” cohort grew by 18.6 percentage points relative to natives in the first 10 to 15
years in the United States. In fact, cohorts of all vintages to the United States in our
sample experienced significant increases in earnings net of secular trends. This suggests
that average earnings among self-employed immigrants to this country eventually surpass
those of natives.
The variation in the earnings outcomes among self-employed immigrants suggests
that there is a great deal of heterogeneity in the quality of the self-employment
experiences across the three countries. That self-employed immigrants did not
experience earnings outcomes that exceeded those of natives in Australia and Canada
suggests that the higher rates of self-employment experienced among immigrants to all
three countries is not likely due to greater business skills among immigrants to all
countries. Instead, it appears that immigrants, much like natives, enter self-employment

27
for varied reasons, which depend, in part, on country-specific factors. Lastly, the
differences across countries suggest that immigration policy and other country specific
factors likely influence the quality of immigrant self-employment outcomes (discussed in
detail in the subsequent section).
6. Conclusions
Given the recent emphasis placed on immigrant entrepreneurship by government
policy makers around the world it is important to understand the potential for
immigration policy in attracting successful entrepreneurs. A central issue underlying the
likely success of immigration policy in achieving these goals is the ability of such
policies to overcome other institutional and market forces that make some countries more
attractive to entrepreneurs than others. We characterize the business start-up process for
immigrant men and look for clues to the likely impacts of immigration policies and other
institutional/market frameworks on immigrant self-employment outcomes by examining
the self-employment experiences of immigrants to three countries: Australia, Canada and
the United States. These three countries are similar in many respects but differ
substantially with respect to immigration policies, other institutions, and market
characteristics, which impact self-employment outcomes.
First, with respect to the characteristics of the business start-up process among
immigrant men we find that a number of interesting conclusions can be drawn from the
observed self-employment patterns. The results in all three countries suggest that the
process of starting a business for many immigrants involves a transition from wage
employment to self-employment. Immigrants to all three countries had self-employment
rates below those of similar natives at the time of entry to the destination country.

28
However, in all years/countries we find positive and statistically significant growth in the
self-employment propensities of newly arriving immigrants, over and above that of
similar natives. This may be because, relative to wage employment, self-employment
typically requires bigger financial investment, the development of contacts and greater
country-specific knowledge. Given that all of these typically take time to acquire,
perhaps it is not surprising that a period of integration is required.
In addition, despite very different rates of self-employment across the three
countries, we find that rates of self-employment catch up to and overtake those of similar
natives within 10 to 20 years after arrival. This suggests that, regardless of differences in
the institutional or country-specific factors that influence rates of self-employment,
immigrants adapt to these conditions relatively quickly. This result also casts doubt on
explanations for the observed higher rates of self-employment among immigrants, which
suggest that immigrants do not assimilate but simply adopt their host-country self-
employment propensities. While immigrant self-employment rates eventually exceed
those of similarly skilled natives, an examination of the earnings outcomes in self-
employment across the three countries reveals that these higher self-employment rates
may not be associated with greater entrepreneurial skill levels among immigrants arriving
to all countries. We find a great deal of heterogeneity across the three countries in the
earnings outcomes of immigrants relative to natives. For example, while the relatively
“good” earnings outcomes among immigrants to the United States are consistent with
immigrants possessing higher levels of business skill, the poor earnings outcomes among
immigrants to Canada are not.

29
Second, with respect to the relative impacts of policy and other country specific
factors on self-employment outcomes, we find evidence that, while immigration policy
may affect self-employment outcomes at the margin the most substantial determinants are
likely other institutional/market structure forces that attract entrepreneurs. To see how
we come to this conclusion, consider the differences in immigration policy and other
market structures across the three countries. Australia and Canada are perhaps most alike
among the three in terms of immigration policy, tax policy, size of local markets and
other market factors. Unlike the United States, both of these countries have immigration
policies that screen immigrants to a certain extent based on skill characteristics and
formal business skill programs. There is, however, one primary difference between
Australia and Canada’s immigration policies. Australia’s skills requirements for entry
through both the business and other skill categories are relatively more stringent than
those of Canada. Thus a comparison between the self-employment outcomes of
immigrants across Australia and Canada allows us to isolate the impact of this policy
difference. Comparing Australia and Canada to the United States, on the other hand,
provides information not only on the impacts of immigration policy (in particular, the
presence or absence of a “points” system) but also the effects of differences in
institutional/market characteristics. The United States differs from Australia and Canada
in terms of the size of the local market, tax policy and other institutional factors. In
particular, while Canada and Australia have more generous social programs, the US has
more favorable tax provisions for entrepreneurs under the income tax system and access
to larger markets. These differences likely favor the United States relative to Canada and
Australia as a destination of choice for the most skilled entrepreneurs.

30
As noted above, looking across countries we do indeed find evidence that
suggests that immigration policy has an impact on self-employment outcomes. These
impacts, perhaps not surprisingly, were most evident in the Australian results. For
example, Australia’s relatively rigorous “points” requirements for entry appear to have
had the expected effects both in terms of self-employment business start-up and earnings
outcomes. Consistent with our expectations, relative to those to Canada and the United
States, immigrants to Australia entered with self-employment rates that were further
below those of similarly skilled natives than those in the other two countries but
experienced relatively high rates of self-employment with time in the destination country.
Also consistent with a more selective points system, relative to those in Canada the
earnings outcomes among male self-employed immigrants to Australia were more
favorable. On the other hand, comparing immigrant self-employment rates in Canada to
those in the US, we find little evidence that Canadian immigration policy has had a
significant impact.
As a final point, our examination of the earnings outcomes among immigrants to
the United States and comparison to those to Australia and Canada leads us to conclude
that self-selection among immigrant entrepreneurs based on other market factors, such as
market size and tax policy, are likely more important than immigration policy. Self-
employed immigrants to the United States out-performed immigrants to Canada and
Australia in terms of earnings outcomes relative to natives. These differences in the
relative earnings outcomes among male immigrants between the United States and the
other two countries were substantial, despite the fact that immigrants to the United States
were not formally screened based on skills.

31
Bibliography
Aldrich, H., J. Cater, T. Jones, D. McEvoy and P. Velleman. 1985. “Ethnic Residential
Concentration and the Protected Market Hypothesis.” Social Forces, 63, pp. 996-1009.
Antecol, Heather, Deborah A. Cobb-Clark, and Stephen J. Trejo. 2003a. “Immigration
Policy and the Skills of Immigrants to Australia, Canada, and the United States.” Journal
of Human Resources, 38(1), pp. 192-218.
--------, 2003b, “The Skills of Female Immigrants to Australia, Canada, and the United
States”, Host Societies and the Reception of Immigrants, Jeffrey G. Reitz (ed.), San
Diego: Center for Comparative Immigration Studies, pp. 327-359.
--------, 2004, “The History of Selective Immigration in Australia, Canada, and the
United States”, Brussels Economic Review, Special Edition: Selective Immigration-
Consequences for Source and Destination Countries, forthcoming.
Antecol, Heather, Peter Kuhn, and Stephen Trejo. 2003. “Assimilation via Prices or
Quantities? Labor Market Institutions and Immigrant Earnings Growth in Australia,
Canada, and the United States,” IZA Discussion Paper # 802.
Aronson, R.L., 1991. Self-Employment. ILR Press: Ithaca, N.Y.

32
Baker, M., and D. Benjamin. 1994. “The Performance of Immigrants in the Canadian
Labor Market,” Journal of Labor Economics, Vol. 12, No. 3 (July): pp. 369-405
Beach, C.M., and C. Worswick. 1993. “The Performance of Immigrants in the Canadian
Labor Market,” Journal of Labor Economics, 12 (July): pp. 369-405
Bloom, D, G. Grenier, and M. Gunderson. 1995. “The Changing Labor Market Position
of Canadian Immigrants,” Canadian Journal of Economics, 28: pp. 987-1005
Borjas, G., 1985. “Assimilation, Changes in Cohort Quality and the Earnings of
Immigrants,” Journal of Labor Economics 3: pp. 463-489
--------, 1986. “The Self-Employment Experience of Immigrants,” The Journal of Human
Resources, Vol. 21, No. 4 (Autumn): pp. 485-506
--------, 1993. “Immigration Policy, National Origin and Immigrant Skills: A Comparison
of Canada and the United States,” in Small Differences That Matter: Labor Markets and
Income Maintenance in Canada and the United States, eds. D. Card and R. Freeman.
Chicago: University of Chicago Press.
--------, 1995. “Assimilation and Changes in Cohort Quality Revisited: What Happened to
Immigrant Earnings in the 1980s?,” Journal of Labor Economics, Vol. 13, No. 2 (April):
pp. 201-245

33
Briggs, V.M., Jr. 1984. Immigration Policy and the American Labor Force, Baltimore:
Johns Hopkins University Press
Borjas, G. and S. Bronars 1989. “Consumer Discrimination and Self-Employment,”
Journal of Political Economy 97: pp. 581-605
Boyd, R. L., 1990 “Black and Asian Self-Employment in Large Metropolitan Areas: A
Comparative Analysis,” Social Problems, 37, pp. 258-69.
Carroll, G. R. and E. Mosakowski, 1987 “The Career Dynamics of Self-Employment,”
Administrative Sciences Quarterly, 32, pp. 570-89.
Chiswick, B.R., 1978. “The Effect of Americanization on the Earnings of Foreign-Born
Men,” Journal of Political Economy, 86, pp. 897-921.
--------, 1986. “Immigration Policy, Source Countries and Immigrant Skills: Australia,
Canada and the United States,” in The Economics of Immigration, Proceedings of the
Conference held at the Australian National University. Canberra: Australian Government
Printing Service.
Clark, K. and S. Drinkwater, 1998. “Ethnicity and Self-Employment in Britain,” Oxford
Bulletin of Economics and Statistics, 60: pp. 383-407

34
--------, 2000. “Pushed Out or Pulled In? Self-Employment Among Ethnic Minorities in
England and Wales,” Labour Economics, Vol. 7, pp. 603-28
--------, 2002. “Enclaves, Neighbourhood Effects and Employment Outcomes: Ethnic
Minorities in England and Wales,” Journal of Population Economics, Vol. 15, pp. 5-29
Fairlie, R. and Bruce Meyer. 1996. "Ethnic and Racial Self-Employment Differences and
Possible Explanations", Journal of Human Resources, Vol.31, No. 4, pp. 757-793.
Fairlie, R. and C. Woodruff, 2004. "Mexican Entrepreneurship: A Comparison of Self-
employment in Mexico and the United States", Working Paper, University of California
Santa Cruz
Flota, C. and M.T. Mora, 2001 “The Earnings of Self-Employed Mexican-Americans
along the US-Mexico Border,” Annals of Regional Science, 35, pp. 483-99.
Green, A. G., 1995 “A Comparison of Canadian and U.S. Immigration Policy in the
Twentieth Century,” in Diminishing Returns, ed. D. DeVoretz. Toronto: CD Howe
Institute and Laurier Institution
Green, A. G., and D.A. Green, 1995 “Canadian Immigration Policy: The Effectiveness of
the Point System and Other Instruments,” Canadian Journal of Economics, 28, pp. 1006-
41.

35
Lalonde, Robert J., and Robert Topel. 1992 “The Assimilation of Immigrants in the US
Labor Market,” In Immigration and the Workforce, edited by George J. Borjas and
Richard Freeman. Chicago: University of Chicago Press.
Le, A.T. 2000 “The Determinants of Immigrant Self-Employment in Australia,”
International Migration Review, 13, pp. 183-214.
Lester, L. and Sue Richardson, 2004 “A Comparison of Australian and Canadian
Immigration Policies and Labour Market Outcomes,” Report to the Department of
Immigration and Multicultural and Indigenous Affairs: Commonwealth of Australia.
Li, Peter, 1998 The Chinese in Canada, Second Edition Toronto: Oxford University Press
Light, I., 1972 Ethnic Entrepreneurs in America, Berkeley, CA: University of California
Press
--------, 1984. “Immigrant and Ethnic Enterprise in North America,” Ethnic and Racial
Studies, Vol. 7, pp. 195-216
Light, I. and E. Bonacich, 1988 Immigrant Entrepreneurs: Koreans in Los Angeles 1965-
1982, Berkeley, CA: University of California Press

36
Light, I. and C. Rosenstein, 1995 Race, Ethnicity and Entrepreneurship in Urban
America, New York: Aldine de Gruyter
Lofstrom, M. 2002, "Labor Market Assimilation and the Self-Employment Decision of
Immigrant Entrepreneurs," Journal of Population Economics, 15, pp. 83-114
Mata, F. and Ravi Pendakur, 1998 “Immigration, Labour Force Integration and the
Pursuit of Self-Employment,” RIIM working paper #98-05
Metcalf, H., T. Mohood and S. Virdee, 1996, Asian Self-Employment: The Interaction of
Culture and Economics, London: Policy Studies Institute
Miller, P.W. 1999, "Immigration Policy and Immigrant Quality: The Australian Points
System", American Economic Review, Vol. 89, No. 2, pp. 192-197
Min, P.G., 1984 "From White Collar Occupations to Small Business: Korean
Immigrants’ Occupational Adjustment", The Sociological Quarterly, Vol. 25, pp. 333-
352
--------, 1988. “Ethnic Business Enterprise: Korean Small Business in Atlanta,” New
York: Center for Migration Studies

37
Moore, R.L., 1983 "Employer Discrimination: Evidence from Self-Employed Workers,"
Review of Economics and Statistics, 655, pp. 496-501
Parker, S. C., 2004 The Economics of Self-Employment and Entrepreneurship,
Cambridge: Cambridge University Press
Phizacklea, A., 1988, "Entrepreneurship, Ethnicity and Gender", Ch.2 in Enterprising
Women, eds. S. Westwood and P. Bhachu., London: Routledge
Rafiq, M., 1992, "Ethnicity and Enterprise: A Comparison of Muslim and Non-Muslim
Owned Asian Businesses in Britain", New Community, 19, pp. 43-60
Razin, E. and A. Longlois, 1996, "Metropolitan Characteristics and Entrepreneurship
Among Immigrants and Ethnic Groups in Canada", International Migration Review, 30,
pp. 703-27
Schuetze, H.J., 2000, "Taxes, Economic Conditions and Recent Trends in Male Self-
Employment: A Canada-U.S. Comparison", Labour Economics, 7, pp. 507-544
--------, 2004, "Tax Policy and Entrepreneurship", Swedish Economic Policy Review, Vol.
11, No. 2.
38
--------, 2005, "The Self-Employment Experience of Immigrants to Canada", University
of Victoria working paper.
Sowell, T., 1981, Markets and Minorities, New York: Basic Books
Wong, L. and Michele Ng. 2002. "The Emergence of Small Transnational Enterprise in
Vancouver: The Case of Chinese Immigrant Entrepreneurs," International Journal of
Urban and Regional Research. 26 (3): 508-530
Yuengert, A.M. 1995 “Testing Hypothesis of Immigrant Self-Employment,” The Journal
of Human Resources, Vol. 30, No. 1 (Winter): pp. 194-204

39
Endnotes
1 See Light and Rosenstein, 1995 and Parker, 2004, for a more thorough discussion of the literature.
2 Borjas (1986) and Lofstrom (2002) examine data on the US. However, because these studies are limited
to a single country over a limited period of time they do not provide much insight into the roles of
immigration policy and other institutional/market factors in the start-up process – a topic of focus in this
chapter. Schuetze (2005), which most closely resembles the current study, focuses on self-employment
outcomes of immigrants through time in both Canada and the United States.
3 A number of studies have made use of this setting. See, for example, Chiswick (1987), Antecol, Cobb-
Clark, and Trejo (2003a) and (2003b), and Antecol, Kuhn and Trejo (2003).
4 See, for example, Borjas (1985) or LaLonde and Topel (1992).
5 Examples include Chiswick (1987), Duleep and Regets (1992), Borjas (1993), and Antecol, Cobb-Clark
and Trejo (2003).
6 Much of this section is based on previous work by Antecol, Cobb-Clark and Trejo (2003).
7 The debate, (see Duleep and Sanders, 1992; Borjas, 1993; and Antecol, Cobb-Clark and Trejo, 1993),
centers around the issue of whether or not it was the introduction of the points systems in Canada and
Australia which led to the shift in observable skills (such as, education levels) of immigrants. The fact that
the shifts in skill occurred, however, is of central interest to the current chapter, not the reason for the shift
per se.
8 Perhaps because of the more stringent evaluation of skilled immigrants to Australia, Chiswick (1987)
finds the average levels of education highest among Australian immigrants.
9 Antecol, Cobb-Clark, and Trejo (2003a, 2003b) find similar results using the 1990/91 censuses for
Australia, Canada and the US. However, once immigrants from Central/South America are excluded, the
skill levels of immigrants are similar across the three countries.
10 See Parker (2004), pg. 73 for a review of this literature.
11 Other categories are available to those who are sponsored by an Australian State/Territory. For more
information go to www.immi.gov.au.

40
12 A minimum amount of investment capital is required for those entering under the investor and
entrepreneur categories.
13 This is not the case for “investors” in either country.
14 Lester and Richardson (2004) provide a good comparison of the two countries’ immigration policies.
15 For this estimate to be unbiased it must be assumed that cohort specific fixed effects are equal across
time. This may not be true in this setting if, for example, the composition of the cohort changes through the
remigration of immigrants based on skills.
16 By “start-up” we mean not necessarily that the firm itself is newly created (we do not observe this) but
that the immigrant owner is new to a given venture in the destination country.
17 However, as in Schuetze (2005), the results here are similar when the base group is comprised of
previous immigrants. These results are available from the authors upon request.
18 Because detailed information on year of arrival for immigrants in regions determined to have too few
observations to protect confidentiality are unavailable, data drawn from the Canadian census files is
restricted to Quebec, Ontario and the Western Provinces.
19 In particular, the year of arrival information in the 2001 Australian Census is not detailed enough to
analyze using the empirical framework laid out in Section 3.
20 Data limitations prohibit us from identifying individuals in the armed forces in Australia.
21 In Australia, the samples are restricted to individuals aged 20 to 54 in 1981 and to those aged 30 to 64 in
1991 because of data limitations.
22 Agricultural industries include agricultural production and services, forestry, fishing, hunting and
trapping.
23 To account for aging of the cohorts of workers, unlike in the regression data, we restrict attention to
individuals aged 18-54 (20-54 in Australia) in all years.
24 For ease of exposition, we will refer to particular immigrant cohorts using the year intervals that pertain
to the Australian and Canadian data, with the implied understanding that in the U.S. data the actual cohort
intervals begin and end one year earlier.
25 See Aronson, 1991 and Parker, 2004, for reviews

41
26 Examples include Chiswick, 1978; Borjas, 1985, 1995; Beach and Worswick, 1993; and Green and
Green, 1995
27 In essence, the period effect is estimated from natives, and this information is used to identify cohort and
assimilation effects for immigrants.
28 The full set of regression results are available from the authors upon request.
29 In Australia, we restrict the sample to respondents who worked 16 (15) or more hours in their main job in
the reference week in 1981 (1991).
30 In Australia, all variables pertain to the reference week, therefore, we continue to define self-employment
as described in Section 4.
31 The results reported here include those with self-employment income comprising 25 percent or more of
the previous year’s earnings. However, the results are not sensitive to this cut-off – in part because the
incidence of individuals with multiple sources of income is relatively rare.
32 Unfortunately, the Australian census does not distinguish an individual’s earnings from his other sources
of income, so for Australia we are forced to use weekly personal income as our proxy for wages.
33 While the income measure in Australia is categorical, we convert it into a continuous variable by
assigning each individual the midpoint of his income category. To ensure this does not effect our results,
we estimate the model using both interval and censored regression. The results are similar and available
upon request.

42
Table 1. Self-Employment Rates of Men
Notes: • Samples in all years are restricted to men aged 18-54 (20-54 in Australia). • Standard deviations in parentheses. • Number of observations in brackets.
Australia Canada U.S.
1981 1991 1981 1991 1980 1990
Natives
0.136
(0.343)
[17389]
0.179
(0.384)
[21068]
0.099
(0.299)
[62379]
0.117
(0.321)
[104923]
0.102
(0.302)
[727852]
0.110
(0.312)
[788906]
Immigrants
0.153
(0.360)
[6344]
0.204
(0.403)
[7591]
0.145
(0.352)
[17016]
0.163
(0.369)
[26325]
0.114
(0.318)
[130510]
0.117
(0.321)
[221569]
Cohort
Pre 1961
0.177
(0.309)
[68976]
0.192
(0.394)
[4459]
0.158
(0.364)
[32093]
0.161
(0.367)
[22925]
61-65
0.147
(0.354)
[1960]
0.195
(0.397)
[2150]
0.139
(0.346)
[17348]
0.148
(0.355)
[17561]
66-70
0.171
(0.377)
[4686]
0.240
(0.427)
[3430]
0.140
(0.347)
[3539]
0.176
(0.380)
[4792]
0.123
(0.328)
[22825]
0.142
(0.349)
[23476]
71-75
0.108
(0.310)
[837]
0.182
(0.386)
[1053]
0.114
(0.318)
[3100]
0.162
(0.369)
[5018]
0.100
(0.301)
[27351]
0.143
(0.350)
[30027]
76-80
0.094
(0.292)
[821]
0.247
(0.432)
[777]
0.087
(0.282)
[1820]
0.158
(0.365)
[3483]
0.061
(0.239)
[30893]
0.129
(0.335)
[36242]
81-85
0.174
(0.379)
[876]
0.148
(0.355)
[2675]
0.101
(0.301)
[45988]
86-91
0.129
(0.336)
[1455]
0.108
(0.310)
[3748]
0.059
(0.236)
[45350]
43
Table 2. Summary of Selected Trends in Predicted Values
Australia Canada U.S. 1981 1991 1981 1991 1980 1990
Predicted Probability
Natives*
0.182
(0.004)
0.235
(0.003)
0.136
(0.002)
0.148
(0.001)
0.122
(0.000)
0.127
(0.000)
GAP**
-0.052
(0.014)
-0.071
(0.013)
-0.022
(0.009)
-0.029
(0.006)
-0.038
(0.002)
-0.045
(0.002)
Notes: * The predicted probability of self-employment for a native with similar characteristics as the average immigrant in 1990/91. ** The predicted probability “gap” in the self-employment rates between the most recent arrival cohort and a similar native. • Standard errors derived from bootstrapping in parentheses.

44
Table 3. Decomposition of Changes in the Probability of Self-Employment
Australia Canada U.S. Cross- Unadjusted Adjusted Unadjusted Adjusted Unadjusted Adjusted Section Within Across Within Across
Cross-
Section Within Across Within Across
Cross-
Section Within Across Within Across
51-61 -0.015
(0.009)
0.009
(0.007)
-0.005
(0.007)
-0.002
(0.007)
0.007
(0.007)
-0.010
(0.003)
0.000
(0.003)
-0.011
(0.003)
-0.005
(0.003)
-0.006
(0.003)
61-71 0.020
(0.010)
0.034
(0.011)
-0.014
(0.011)
0.022
(0.011)
-0.002
(0.011)
-0.015
(0.003)
0.003
(0.004)
-0.018
(0.003)
-0.002
(0.004)
-0.013
(0.003)
66-76 -0.030
(0.019)
0.061
(0.010)
-0.091
(0.019)
0.007
(0.011)
-0.037
(0.020)
-0.003
(0.008)
0.023
(0.009)
-0.026
(0.010)
0.011
(0.009)
-0.014
(0.010)
-0.008
(0.003)
0.018
(0.003)
-0.026
(0.003)
0.013
(0.003)
-0.021
(0.003)
71-81 0.020
(0.022)
0.092
(0.021)
-0.072
(0.020)
0.038
(0.021)
-0.018
(0.021)
0.012
(0.010)
0.039
(0.009)
-0.026
(0.010)
0.027
(0.009)
-0.015
(0.010)
0.024
(0.003)
0.036
(0.003)
-0.011
(0.003)
0.031
(0.003)
-0.006
(0.003)
76-86 0.110
(0.021)
0.144
(0.022)
-0.035
(0.018)
0.091
(0.023)
0.019
(0.019)
0.057
(0.029)
0.061
(0.011)
-0.004
(0.010)
0.049
(0.011)
0.008
(0.010)
0.069
(0.002)
0.067
(0.003)
0.002
(0.002)
0.062
(0.003)
0.007
(0.003)
Notes: • For a description of the decomposition see text. • Standard errors derived from bootstrapping in parentheses.

45
Table 4. Average Log Weekly Earnings of Self-Employed Men
Australia Canada U.S.
1981 1991 1981 1991 1980 1990
Natives 6.155
(0.578)
[2147]
6.125
(0.749)
[3298]
6.408
(0.984)
[4323]
6.325
(1.060)
[8133]
6.283
(0.944)
[55798]
6.168
(1.086)
[64674]
Immigrants 6.146
(0.547)
[863]
6.097
(0.740)
[1338]
6.417
(0.933)
[1392]
6.312
(1.070)
[2361]
6.361
(0.958)
[10347]
6.196
(1.087)
[17831]
Cohort Pre 1961
6.472
(0.899)
[649]
6.375
(0.945)
[440]
6.462
(0.894)
[3446]
6.402
(1.034)
[2466]
61-65
6.301
(1.068)
[175]
6.348
(1.035)
[213]
6.440
(0.970)
[1630]
6.364
(1.020)
[1747]
66-70 6.138
(0.529)
[708]
6.075
(0.778)
[712]
6.388
(0.905)
[288]
6.415
(1.013)
[440]
6.351
(0.965)
[1922]
6.281
(1.142)
[2178]
71-75 6.177
(0.504)
[84]
6.126
(0.680)
[166]
6.422
(0.977)
[191]
6.317
(1.174)
[473]
6.294
(0.964)
[1951]
6.300
(1.076)
[2875]
76-80 6.184
(0.739)
[71]
6.081
(0.772)
[174]
6.332
(0.885)
[89]
6.217
(1.054)
[325]
5.124
(1.027)
[1398]
6.206
(1.112)
[3219]
81-85
6.161
(0.604)
[126]
6.285
(1.050)
[258]
6.018
(1.034)
[3341]
86-91
6.134
(0.693)
[160]
6.094
(1.232)
[212]
5.836
(1.080)
[2005]
Notes: • Samples in all years are restricted to men aged 18-54 (20-54 in Australia). • Earnings values inflated to each countries 1990/91 level using CPI. • Standard deviations in parentheses. • Number of observations in brackets.

46
Table 5. Earnings Regressions Assimilation, Cohort and Period Effects
Australia Canada U.S. Cross- Unadjusted Adjusted Unadjusted Adjusted Unadjusted Adjusted Section Within Across Within Across
Cross-Section Within Across Within Across
Cross-Section Within Across Within Across
51-61 -0.024
(0.750)
0.441
(0.000)
-0.422
(0.00)
0.006
(0.917)
0.012
(0.697)
0.057
(0.086)
0.476
(0.000)
-0.506
(0.000)
0.058
(0.022)
-0.001
(0.971)
61-71 0.122
(0.594)
0.667
(0.000)
-0.545
(0.000)
0.232
(0.023)
-0.110
(0.230)
0.059
(0.053)
0.486
(0.000)
-0.484
(0.000)
0.068
(0.041)
-0.009
(0.775)
66-76 -0.010
(0.873)
0.671
(0.000)
-0.681
(0.000)
-0.008
(0.834)
-0.002
(0.974)
0.165
(0.219)
0.595
(0.000)
-0.430
(0.000)
0.160
(0.029)
0.005
(0.951)
0.066
(0.059)
0.488
(0.000)
-0.456
(0.000)
0.070
(0.000)
-0.003
(0.905)
71-81 0.001
(0.994)
0.669
(0.000)
-0.668
(0.000)
-0.010
(0.900)
0.011
(0.890)
0.024
(0.232)
0.503
(0.000)
-0.479
(0.000)
0.068
(0.416)
-0.043
(0.642)
0.198
(0.000)
0.567
(0.000)
-0.417
(0.000)
0.149
(0.000)
0.048
(0.087)
76-86 0.072
(0.392)
0.674
(0.000)
-0.602
(0.000)
-0.005
(0.961)
0.077
(0.474)
0.176
(0.098)
0.432
(0.000)
-0.256
(0.036)
-0.003
(0.973)
0.179
(0.147)
0.246
(0.000)
0.605
(0.000)
-0.389
(0.000)
0.186
(0.000)
0.059
(0.134)
Note: P-values are reported in parentheses.

47
Figure 1:
Business Immigration to Australia and Canada: 1980-1990
0.00%1.00%2.00%3.00%4.00%5.00%6.00%7.00%8.00%9.00%
10.00%
1980
1981
1982
1983
1984
1985
1986
1987
1988
1989
1990
Year
Perc
ent o
f Ann
ual T
otal
Canada Australia
Sources:
Canadian data – Citizenship and Immigration Canada (various years) “Citizenship and Immigration
Statistics,” Cat. No. MP22-1: Minister of Public Works and Government Services Canada.
Australian data – Department of Immigration and Multicultural and Indigenous Affairs (various years),
“Population Flows: Immigration Aspects,” Australian Bureau of Statistics.

48
Appendix Table Appendix Table 1.
Variable Definitions
Australia Canada U.S. age Age Age Age
agesq Age Squared Age Squared Age Squared
Years of Education
ed1 =1 if Less than 9 years =1 if less than grd. 5 =1 if grade 8 or less
ed2 =1 if 10-13 years =1 if grade 5-8 =1 if less than highschool
ed3 =1 if Some College =1 if grade 9-13 =1 if highschool grad
ed4 =1 if BA+ =1 if sec. school grad =1 if some college/bach.
ed5 NA =1 if trade certificate =1 if Masters/Ph.D.
ed6 NA =1 if non-univ: no trade NA
ed7 NA =1 if non-univ: trade NA
ed8 NA =1 if non-univ: other NA
ed9 NA =1 if univ: no cert NA
Ed10 NA =1 if univ: cert<bach NA
Ed11 NA =1 if bachelors + NA
Marital Status
mstat1 =1 if Single =1 if Divorced =1 if Married
mstat2 =1 if Married =1 if Married =1 if Widowed
mstat3 =1 if Sep./Div./Widowed =1 if Separated =1 if Divorced
mstat4 NA =1 if Never Married =1 if Separated
mstat5 NA =1 if Widowed =1 if Never Married
Y91 =1 if 1991 =1 if 1991 =1 if 1990
Place of Birth
pob2 =1 if North America and USA =1 if USA =1 if Africa
pob3 =1 if Germany =1 if UK =1 if Canada
pob4 =1 if Netherlands =1 if Germany =1 if Other North Am.
pob5 =1 if UK and Ireland =1 if Italy =1 if Mexico
pob6 =1 if Yugoslavia =1 if Portugal =1 if S. and Central Am.
pob7 =1 if Italy =1 if Poland =1 if East Asia
pob8 =1 if Southern Europe =1 if USSR =1 if South Asia
pob9 =1 if Poland =1 if Other Europe =1 if Middle East
pob10 =1 if USSR & Baltic States =1 if Asia =1 if Other Asia
pob11 =1 if Other Europe =1 if Africa =1 if Western Europe

49
Appendix Table 1. (Cont.)
Australia Canada U.S. pob12
=1 if Southeast Asia
=1 if Central./South
America
=1 if Southern Europe
pob13 =1 if South Asia & India =1 if Other =1 if Eastern Europe
pob14 =1 if Mid East & North Africa NA =1 if Northern Europe
pob15 =1 if Africa NA =1 if Former USSR
pob16
=1 if South/Central America &
Caribbean NA
=1 if Oceania
pob17 =1 if Oceania, Antarctica, NZ NA =1 if Other
immig =1 if Immigrant =1 if Immigrant =1 if Immigrant
Year of Arrival
D56 NA =1 if before 1961 =1 if before 1960
D61 NA =1 if 1961-1965 =1 if 1960-1964
D66 =1 if before 1971* =1 if 1966-1970 =1 if 1965-1969
D71 =1 if 1971-1975* =1 if 1971-1975 =1 if 1970-1974
D76 =1 if 1976-1980* =1 if 1976-1980 =1 if 1975-1979
D81 =1 if 1981-1985 =1 if 1981-1985 =1 if 1980-1984
D86 =1 if 1986-1991 =1 if 1986-1991 =1 if 1985-1990
*In 1981 these categories for Australia are before 1972, 1972-1976, and 1977-1981, respectively.