immobilising proteins on silica using modified silaffin ... · pdf fileimmobilising proteins...
TRANSCRIPT

1
Supplementary information for
Immobilising proteins on silica using modified silaffin peptides
Carolin C. Lechnera,b and Christian F.W. Beckera* a University of Vienna, Department of Chemistry, Institute of Biological Chemistry, Währinger Strass 38, 1090 Vienna, Austria. b Present address: Ecole Polytechnique Fédérale de Lausanne, Fondation Sandoz Chair in Biophysical Chemistry of Macromolecules, 1015 Lausanne, Switzerland. Corresponding author: * [email protected]
1.1 Materials ........................................................................................................................ 2 1.2 Instrumentation .............................................................................................................. 2 1.3 HPLC and mass spectrometry ........................................................................................ 3 1.4 Cloning of Thioredoxin (TRX)-GyrA-H6-CBD fusion protein..................................... 3 1.5 Protein expression and purification ............................................................................... 4 1.6 DTT-mediated hydrolysis of TRX-MESNa thioester .................................................... 4 1.7 Scanning electron microscopy and fluorescence microscopy ........................................ 5 1.8 Quantification of precipitated silica ............................................................................... 5 1.9 Stability of silica immobilised eGFP against denaturation with SDS ............................ 5 1.10 Quantification of loading of silica with TRX and release of TRX from silica .............. 5 1.11 Determination of enzyme activity of TRX and silica immobilised TRX ...................... 6
2 Supplementary data ................................................................................................................ 7
2.1 Generation of eGFP and TRX with a C-terminal MESNa thioester moiety .................. 7 2.2 Expressed protein ligation of eGFP and TRX proteins with peptides A to D ............. 10 2.3 Particle size analysis .................................................................................................... 20 2.4 Silica precipitation with eGFP-peptide conjugates ...................................................... 21 2.5 Silica precipitation with eGFP ..................................................................................... 22 2.6 Stability of silica immobilised eGFP against denaturation with SDS .......................... 22 2.7 Hydrolysis of C-terminal MESNa thioester moiety from TRX ................................... 24 2.8 Release of TRX and TRX-peptide conjugates from silica material ............................. 24 2.9 Activity of silica immobilised TRX ............................................................................. 25
3 References ............................................................................................................................ 26
Electronic Supplementary Material (ESI) for Biomaterials Science.This journal is © The Royal Society of Chemistry 2014

1 Materials and Methods 1.1 Materials 9-fluorenylmethoxycarbonyl (Fmoc)-protected amino acid derivatives, 2-(1H-benzotriazol-1-yl)-1,1,3,3-tetramethyluronium hexafluorophosphate (HBTU) and preloaded Fmoc-Leu-Wang resin were purchased from Novabiochem (Nottingham, UK). N,N-dimethylformamide (DMF), dichloromethane (DCM) and acetonitril (ACN) were obtained from Biosolve (Valkenswaard, The Netherlands). All other commonly used chemical reagents and solvents were purchased in the highest available quality from the following companies if not noted otherwise: Gerbu (Gaiberg, Germany), Invitrogen (Darmstadt, Germany), J.T. Baker (Griesheim, Germany), Merck (Darmstadt, Germany), NeoLab (Heidelberg, Germany), Omnilab (Bremen, Germany), Roth (Karlsruhe, Germany), Sigma-Aldrich (Taufkirchen, Germany) or VWR (Darmstadt, Germany). The Wizard® Plus SV Minipreps DNA Purification System for isolation of plasmids from E. coli cells, DNA polymerases (Pfu and Taq), restriction enzymes (NcoI and SpeI) and the dNTP mix were purchased from Promega (Mannheim, Germany). PCR fragments were purified with QIAquick PCR Purification Kit from Quiagen (Hilden, Germany). T4 DNA ligase was obtained from Thermo Fisher Scientific (Schwerte, Germany). Alkaline phosphatase (from bovine intestinal mucosa) was from Sigma, 100 bp and 1kb DNA ladders from Invitrogen. Chemical competent E. coli strains XL1-Blue, BL21(DE3) and Rosetta 2(DE3) were from Strategene and Invitrogen, respectively. Oligonucleotide synthesis and gene sequencing were performed by VBC Biotech (Vienna, Austria). SDS-PAGE analysis was accomplished with 15 % SDS gels according to Laemmli1 or with precast gradient gels (8-16 % polyacrylamide) from Peqlab (Erlangen, Germany). The LMW-SDS marker kit was from GE Healthcare (Freiburg, Germany). Gels were stained with Coomassie Brilliant Blue R-250. Centrifugal filtrations units were from Millipore (Amicon Ultra-15) or from Sartorius (Vivaspin 500), Zeba™ Spin Desalting Columns were from Thermo Fisher Scientific. Recombinant DNaseI was purchased from Roche (Mannheim, Germany). 1.2 Instrumentation The MJ Mini Thermal Cycler for PCR, the chamber for horizontal DNA electrophoresis and the Mini-Protean II system for SDS-PAGE were from Biorad (München, Germany). UV-Vis absorption measurements were carried out using an Amersham Biosciences Ultrospec 2100 pro system (Freiburg, Germany) or a NanoDrop 2000c (Thermo Fisher Scientific). E. coli cells were lysed using a microfluidizer manufactured by Constant Systems (Warwick, England). Sedimentations were accomplished in Avanti J25 and J26XP centrifuges and rotors (JA-10, JA-8.1000 and JA-25.50) from Beckman Coulter, (Krefeld, Germany). Purifications of proteins were done using Äkta Prime FPLC systems and HisTrap™ HP columns from GE Healthcare. Analytical reversed phase HPLC was performed on a Dionex Ultimate 3000 instrument using C4 columns (Kromasil 300-5-C4, 150×4.6 mm, 5 µm particle size and BioBasic-4, 150×4.6 mm, 5 µm particle size, Thermo Fisher). ESI-MS analysis was conducted with a LCQ-fleet (Thermo Fisher Scientific) and with a Waters AutoPurification HPLC/MS system (3100 Mass Detector, 2545 Binary Gradient Module, 2767 Sample Manager and 2489 UV/Visible Detector), respectively. For LC-MS separation was achieved using C4

3
columns (Kromasil 300-5-C4, 50×4.6 mm, 5 µm particle size and BioBasic-4 150 x 2.1 mm, 5 µm particle size, Thermo Fisher). Electron micrographs were recorded with the scanning electron microscopes Zeiss Supra 55 VP operating at 5 kV and JEOL JSM 5900 LV operating at 20 kV, respectively. Samples were sputter coated in high vacuum with gold in a Bal-Tec SCD 005 system or with gold/palladium using a Leica SCD050 sputter coater. Fluorescence micrographs were obtained using a Zeiss Axiovert 200 microscope. A Genios plate reader from Tecan (Männedorf, Switzerland) equipped with filters (excitation 485 nm; emission 535 nm) was used for measurements of eGFP fluorescence. Absorbance measurements in multiwell format were carried out with a Synergy Mx plate reader from Biotek (Bad Friedrichshall, Germany). 1.3 HPLC and mass spectrometry Analytical RP-HPLC analyses were carried at a flow rate of 1 mL/min with buffer A (0.1% (v/v) TFA in ddH2O) and buffer B (0.08% (v/v) TFA in ACN) as mobile phase. Separation was achieved running linear gradients from 5 % to 65 % buffer B in buffer A over 30 min. When LC-MS was performed with the LCQ-fleet connected to an UltiMate3000 Dionex HPLC, a flow rate of 0.35 mL/min was applied and the TFA in buffer A and buffer B was replaced with 0.1 % (v/v) formic acid. For analytical LC-MS analyses with the Waters AutoPurification HPLC/MS system, the flow rate was 1 mL/min, linear gradients were 5-65% buffer B in 10 min and the buffers contained 0.05 % (v/v) TFA. Mass spectra were acquired using electrospray ionisation in the positive mode. 1.4 Cloning of Thioredoxin (TRX)-GyrA-H6-CBD fusion protein The plasmid pBad202 coding for a hispatch-thioredoxin gene was a kind gift from Henning Mootz (University of Münster, Germany). Using pBad202 as template, the thioredoxin gene was amplified via PCR using the following primers (recognition sequences for restriction enyzmes are shown in italic): forward primer 5’ - CACCATCCATGGGATCTGATAAAATTATTCATCTG - 3’ reverse primer 5’ – TACCACACTAGTGCATCTCCCGTGATGCAATATTCCGCAAATTT
TCCAGAGCCGGCCAGGTTAGCG- 3’ For cloning of the thioredoxin sequence (TRX) in frame with the GyrA intein in a pTXB3 plasmid, the forward primer contains an NcoI recognition sequence and a SpeI restriction site was introduced in the reverse primer. With the reverse primer the additional amino acid sequence KFAEY (underlined) was introduced to the C-terminus of the thioredoxin. Purified PCR product and the pTXB3 vector were both digested with NcoI and SpeI. Linearised pTXB3 was treated with alkaline phosphatase for 1 h at 37 °C to remove phosphate groups from the 5’ end and subsequently purified. Finally, the PCR insert and the vector were incubated with T4 DNA ligase overnight at 22 °C. The ligation mixture was transformed into E. coli XL1-Blue using the heat shock method and bacteria were grown on selective medium. From positive clones, the plasmids were isolated and the correct sequence of the resulting TRX-GyrA-His6-CBD fusion construct in pTXB3 was confirmed by gene sequencing.
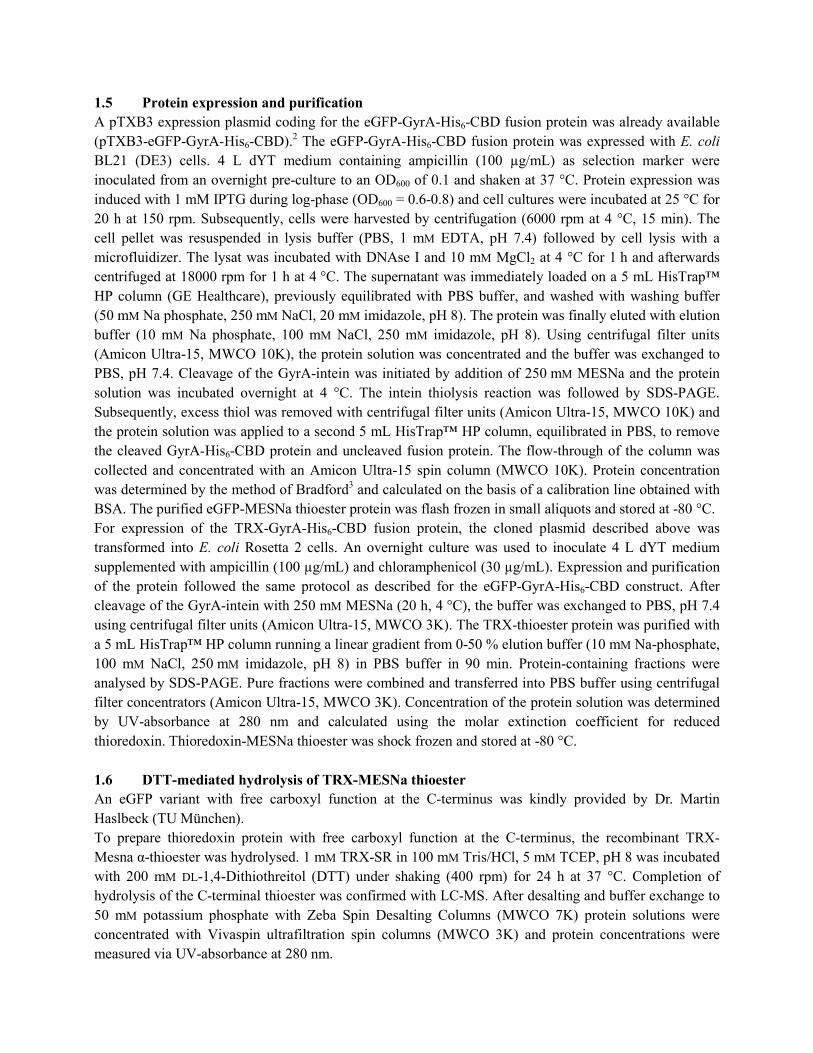
1.5 Protein expression and purification A pTXB3 expression plasmid coding for the eGFP-GyrA-His6-CBD fusion protein was already available (pTXB3-eGFP-GyrA-His6-CBD).2 The eGFP-GyrA-His6-CBD fusion protein was expressed with E. coli BL21 (DE3) cells. 4 L dYT medium containing ampicillin (100 µg/mL) as selection marker were inoculated from an overnight pre-culture to an OD600 of 0.1 and shaken at 37 °C. Protein expression was induced with 1 mM IPTG during log-phase (OD600 = 0.6-0.8) and cell cultures were incubated at 25 °C for 20 h at 150 rpm. Subsequently, cells were harvested by centrifugation (6000 rpm at 4 °C, 15 min). The cell pellet was resuspended in lysis buffer (PBS, 1 mM EDTA, pH 7.4) followed by cell lysis with a microfluidizer. The lysat was incubated with DNAse I and 10 mM MgCl2 at 4 °C for 1 h and afterwards centrifuged at 18000 rpm for 1 h at 4 °C. The supernatant was immediately loaded on a 5 mL HisTrap™ HP column (GE Healthcare), previously equilibrated with PBS buffer, and washed with washing buffer (50 mM Na phosphate, 250 mM NaCl, 20 mM imidazole, pH 8). The protein was finally eluted with elution buffer (10 mM Na phosphate, 100 mM NaCl, 250 mM imidazole, pH 8). Using centrifugal filter units (Amicon Ultra-15, MWCO 10K), the protein solution was concentrated and the buffer was exchanged to PBS, pH 7.4. Cleavage of the GyrA-intein was initiated by addition of 250 mM MESNa and the protein solution was incubated overnight at 4 °C. The intein thiolysis reaction was followed by SDS-PAGE. Subsequently, excess thiol was removed with centrifugal filter units (Amicon Ultra-15, MWCO 10K) and the protein solution was applied to a second 5 mL HisTrap™ HP column, equilibrated in PBS, to remove the cleaved GyrA-His6-CBD protein and uncleaved fusion protein. The flow-through of the column was collected and concentrated with an Amicon Ultra-15 spin column (MWCO 10K). Protein concentration was determined by the method of Bradford3 and calculated on the basis of a calibration line obtained with BSA. The purified eGFP-MESNa thioester protein was flash frozen in small aliquots and stored at -80 °C. For expression of the TRX-GyrA-His6-CBD fusion protein, the cloned plasmid described above was transformed into E. coli Rosetta 2 cells. An overnight culture was used to inoculate 4 L dYT medium supplemented with ampicillin (100 µg/mL) and chloramphenicol (30 µg/mL). Expression and purification of the protein followed the same protocol as described for the eGFP-GyrA-His6-CBD construct. After cleavage of the GyrA-intein with 250 mM MESNa (20 h, 4 °C), the buffer was exchanged to PBS, pH 7.4 using centrifugal filter units (Amicon Ultra-15, MWCO 3K). The TRX-thioester protein was purified with a 5 mL HisTrap™ HP column running a linear gradient from 0-50 % elution buffer (10 mM Na-phosphate, 100 mM NaCl, 250 mM imidazole, pH 8) in PBS buffer in 90 min. Protein-containing fractions were analysed by SDS-PAGE. Pure fractions were combined and transferred into PBS buffer using centrifugal filter concentrators (Amicon Ultra-15, MWCO 3K). Concentration of the protein solution was determined by UV-absorbance at 280 nm and calculated using the molar extinction coefficient for reduced thioredoxin. Thioredoxin-MESNa thioester was shock frozen and stored at -80 °C. 1.6 DTT-mediated hydrolysis of TRX-MESNa thioester An eGFP variant with free carboxyl function at the C-terminus was kindly provided by Dr. Martin Haslbeck (TU München). To prepare thioredoxin protein with free carboxyl function at the C-terminus, the recombinant TRX-Mesna α-thioester was hydrolysed. 1 mM TRX-SR in 100 mM Tris/HCl, 5 mM TCEP, pH 8 was incubated with 200 mM DL-1,4-Dithiothreitol (DTT) under shaking (400 rpm) for 24 h at 37 °C. Completion of hydrolysis of the C-terminal thioester was confirmed with LC-MS. After desalting and buffer exchange to 50 mM potassium phosphate with Zeba Spin Desalting Columns (MWCO 7K) protein solutions were concentrated with Vivaspin ultrafiltration spin columns (MWCO 3K) and protein concentrations were measured via UV-absorbance at 280 nm.

5
1.7 Scanning electron microscopy and fluorescence microscopy For scanning electron microscopic analysis the silica precipitates were resuspended in water, transfered to a Thermanox™ coverslip and air dried. These coverslips were placed onto appropriate sample holders of the respective scanning electron microscope. The samples derived from silica precipitation with eGFP-peptide conjugates or co-precipitation experiments with eGFP and R5 peptides were sputter coated with gold in high vacuum (Bal-Tec SCD 005). Subsequently, the electron micrographs were recorded with the JEOL JSM 5900 LV scanning electron micrograph operating at 20 kV. Silica precipitates from experiments with TRX were sputter coated with gold/palladium in high vacuum (Leica SCD050) and analysed at 5 kV with the Zeiss Supra 55VP scanning electron microscope. Fluorescence micrographs of eGFP containing samples were recorded with a Zeiss Axiovert 200 microscope using the oil immersion objective. 1.8 Quantification of precipitated silica The amount of precipitated silica was quantified by a modified β-silicomolybdate assay.4,5 The silica precipitates were washed twice with water and subsequently incubated for 1 h at RT in 2 M NaOH to dissolve the silica. To 40 µL of this solution with dissolved silica, 160 µL of ultrapure water and 800 µL of a molybdate solution ( 1.35 mL 37% HCl, in 40.3 mL ddH2O mixed with a solution of 774.2 mg (NH4)6Mo7O24 × 4 H2O in 9.7 mL ddH2O, pH adjusted to 1.12 with 2 M NaOH) were added. The absorbance of this solution was measured at 370 nm against a blank of 40 µL NaOH, 160 µL ddH2O and 800 µL molybdate solution. The amount of silicon was calculated based on a calibration curve obtained with a silicon atomic absorption standard solution. Control experiments showed no interference of R5 peptides in these quantification assays. However, since the TRX protein showed interaction with the molybdate, the absorption of different dilutions of TRX mixed with molybdate solution was measured and used for normalisation. All assays for quantification were carried out at least in triplicate. 1.9 Stability of silica immobilised eGFP against denaturation with SDS Silica precipitations with eGFP-peptide conjugates and co-precipitations with eGFP and the different peptides A-D were carried out as described above. The obtained silica material was carefully washed with water to remove unspecifically bound and precipitated eGFP. Subsequently, the silica was resuspended in buffer (50 mM Tris/HCl, pH 6.5). Measurement of eGFP fluorescence was carried out on a Genios plate reader device equipped with an excitation filter for 485 nm and an emission filter for 535 nm. After measuring the initial fluorescence of the individual samples, a SDS solution (5% SDS in 50 mM Tris/HCl, pH 6.5) was added to a final concentration of 0.5% SDS to initiate protein denaturation. The decrease in fluorescence of eGFP was monitored over time for 5 min. Control and reference experiments were carried out using non-silica immobilised eGFP. Both, the stability of eGFP in 50 mM Tris/HCl buffer, pH 6.5 over measurement time was confirmed and the denaturation of free eGFP in buffer solution upon addition of 0.5% SDS was followed. All experiments and measurements were carried out in triplicate. The relative fluorescence retained after 5 min treatment with 0.5% SDS for each sample was calculated based on the fluorescence of the initial measurements. 1.10 Quantification of loading of silica with TRX and release of TRX from silica To quantify the amount of TRX-protein and -conjugates that were entrapped in the silica material, the silica precipitation experiments were carried out as described above. Subsequently, the silica materials
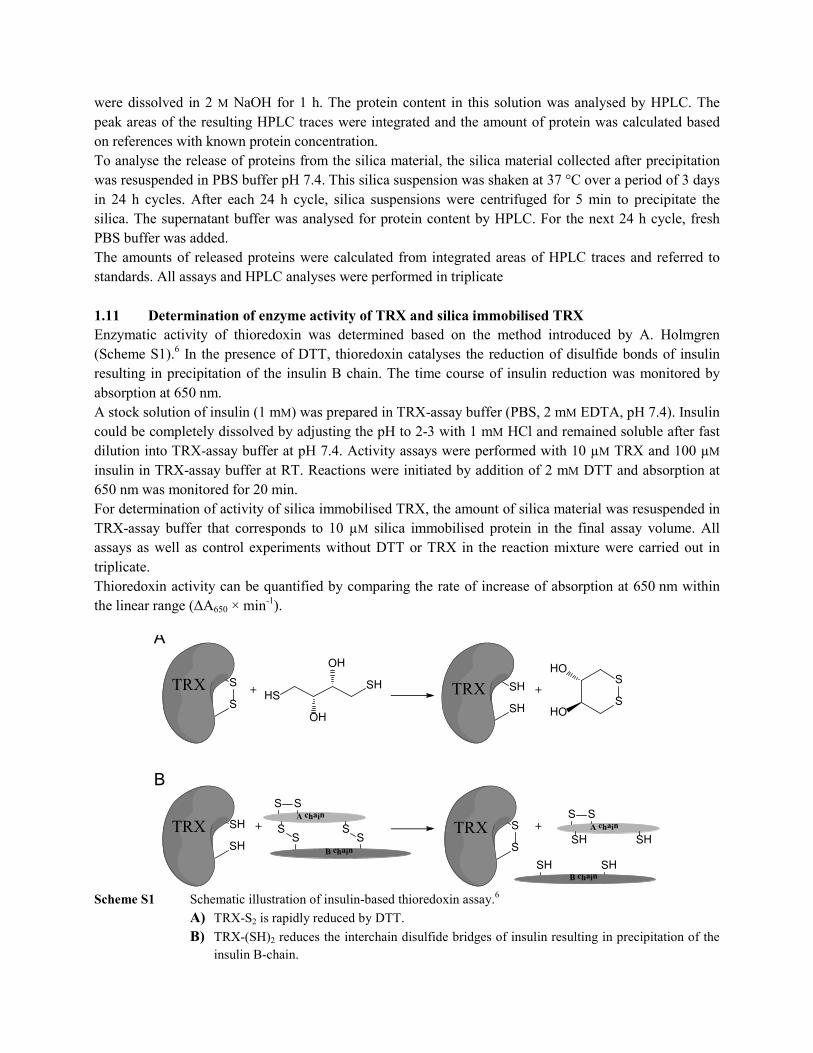
were dissolved in 2 M NaOH for 1 h. The protein content in this solution was analysed by HPLC. The peak areas of the resulting HPLC traces were integrated and the amount of protein was calculated based on references with known protein concentration. To analyse the release of proteins from the silica material, the silica material collected after precipitation was resuspended in PBS buffer pH 7.4. This silica suspension was shaken at 37 °C over a period of 3 days in 24 h cycles. After each 24 h cycle, silica suspensions were centrifuged for 5 min to precipitate the silica. The supernatant buffer was analysed for protein content by HPLC. For the next 24 h cycle, fresh PBS buffer was added. The amounts of released proteins were calculated from integrated areas of HPLC traces and referred to standards. All assays and HPLC analyses were performed in triplicate 1.11 Determination of enzyme activity of TRX and silica immobilised TRX Enzymatic activity of thioredoxin was determined based on the method introduced by A. Holmgren (Scheme S1).6 In the presence of DTT, thioredoxin catalyses the reduction of disulfide bonds of insulin resulting in precipitation of the insulin B chain. The time course of insulin reduction was monitored by absorption at 650 nm. A stock solution of insulin (1 mM) was prepared in TRX-assay buffer (PBS, 2 mM EDTA, pH 7.4). Insulin could be completely dissolved by adjusting the pH to 2-3 with 1 mM HCl and remained soluble after fast dilution into TRX-assay buffer at pH 7.4. Activity assays were performed with 10 µM TRX and 100 µM insulin in TRX-assay buffer at RT. Reactions were initiated by addition of 2 mM DTT and absorption at 650 nm was monitored for 20 min. For determination of activity of silica immobilised TRX, the amount of silica material was resuspended in TRX-assay buffer that corresponds to 10 µM silica immobilised protein in the final assay volume. All assays as well as control experiments without DTT or TRX in the reaction mixture were carried out in triplicate. Thioredoxin activity can be quantified by comparing the rate of increase of absorption at 650 nm within the linear range (ΔA650 × min-1).
S
SHS
SH
OH
OH
TRX +SH
SHTRX +S
SHO
HO
SH
SHTRX + SS
SS
SSA
chain
B chain S
STRXSH
SH
SH
SH
SSA
chain
B chain
+
A
B
Scheme S1 Schematic illustration of insulin-based thioredoxin assay.6
A) TRX-S2 is rapidly reduced by DTT. B) TRX-(SH)2 reduces the interchain disulfide bridges of insulin resulting in precipitation of the
insulin B-chain.

7
2 Supplementary data 2.1 Generation of eGFP and TRX with a C-terminal MESNa thioester moiety To generate a variant of eGFP with a C-terminal thioester moiety, the protein was expressed in fusion with the GyrA intein encoded by a pTXB3 vector.7,8 The pTXB3 plasmid was modified to contain an additional hexahistidine tag between the GyrA intein and chitin-binding domain (CBD), which allows affinity purification on Ni-NTA resin.2 In the pTXB3 vector, the asparagine at the C-terminus of the Mxe GyrA intein is mutated to alanine to prevent cleavage at this splice junction.8 The initial N-S acyl shift at the N-terminal cleavage site can still occur and the intermediate thioester can be trapped by exogenous thiols resulting in cleavage of the intein and release of the N-terminal target protein with C-terminal thioester moiety. However, the efficiency of this cleavage reaction is affected by the protein context of the cleavage site, especially by the amino acid directly preceding the intein.9,10 In order to achieve high efficiency of thiol-mediated cleavage of the Mxe GyrA intein, additional amino acids including the tyrosine preceding the Mxe GyrA intein in its native protein context (KFAEY) were introduced to the C-terminus of eGFP as well as TRX during cloning of the GyrA-His6-CBD fusion constructs.10 After expression and purification of the eGFP-GyrA-His6-CBD fusion protein, cleavage of the intein was induced by addition of MESNa resulting in the production of eGFP with a C-terminal thioester. The eGFP-MESNa thioester protein was separated from GyrA-His6-CBD and uncleaved fusion protein with a second Ni-NTA affinity column. Typically, 3.3 mg of eGFP-MESNa thioester were obtained from 1 liter of E. coli culture. Analysis of the eGFP-thioester protein with SDS-PAGE (Fig. S1, A) and analytical LC-MS (Fig. S1) proved the high purity of the protein. The observed mass resulting from LC-MS analysis (27803 Da) fits the calculated mass of eGFP with a C-terminal MESNa thioester (27797 Da) and revealed that no hydrolysis of the thioester occurred during purification.

A B
C D
Fig. S1 Purification of eGFP with a C-terminal MESNa thioester moiety. A) Coomassie-stained SDS-PAGE gel (15%) of purified eGFP-MESNa thioester. Lane 1: LMW marker; Lane 2: purified eGFP-MESNa thioester. B) HPLC chromatogram of analytical LC-MS analysis of purified eGFP-MESNa thioester. C) Mass spectrum of the peak at 24.0 min from analytical LC-MS analysis of purified eGFP-MESNa thioester. D) Deconvoluted mass spectrum. Calculated mass: 27797 Da; observed mass: 27803 Da.
The TRX-GyrA-His6-CBD fusion protein was successfully expressed using E. coli Rosetta 2(DE3). The thioredoxin used in this study is a variant of the wildtype E.coli thioredoxin in which several amino acids are mutated to histidines. As a result of the thioredoxin fold, these histidines form a patch on the surface with the capacity to bind to nickel ions immobilised on a NTA resin.11 Therefore, the TRX-MESNa thioester was eluted from the second Ni-NTA affinity column following the cleavage of the TRX-GyrA-His6-CBD fusion protein with a gradient of increasing imidazole. Nevertheless, SDS-PAGE analysis of purified TRX-MESNa thioester (12.7 kDa) showed minor impurities at higher molecular weights (Fig. S2, A). The observed bands in the range of 25-30 kDa could originate from GyrA-His6-CBD protein (29.1 kDa) which could not be efficiently separated from the TRX-thioester protein. Alternatively, the TRX-MESNa protein might form disulfide-linked homodimers as observed previously,12,13 that are not readily reduced with the β-mercaptoethanol present in the sample preparation buffer for SDS-PAGE. From 1 liter E. coli culture, on average 12 mg TRX-MESNa thioester protein were obtained.
9
A B
C D
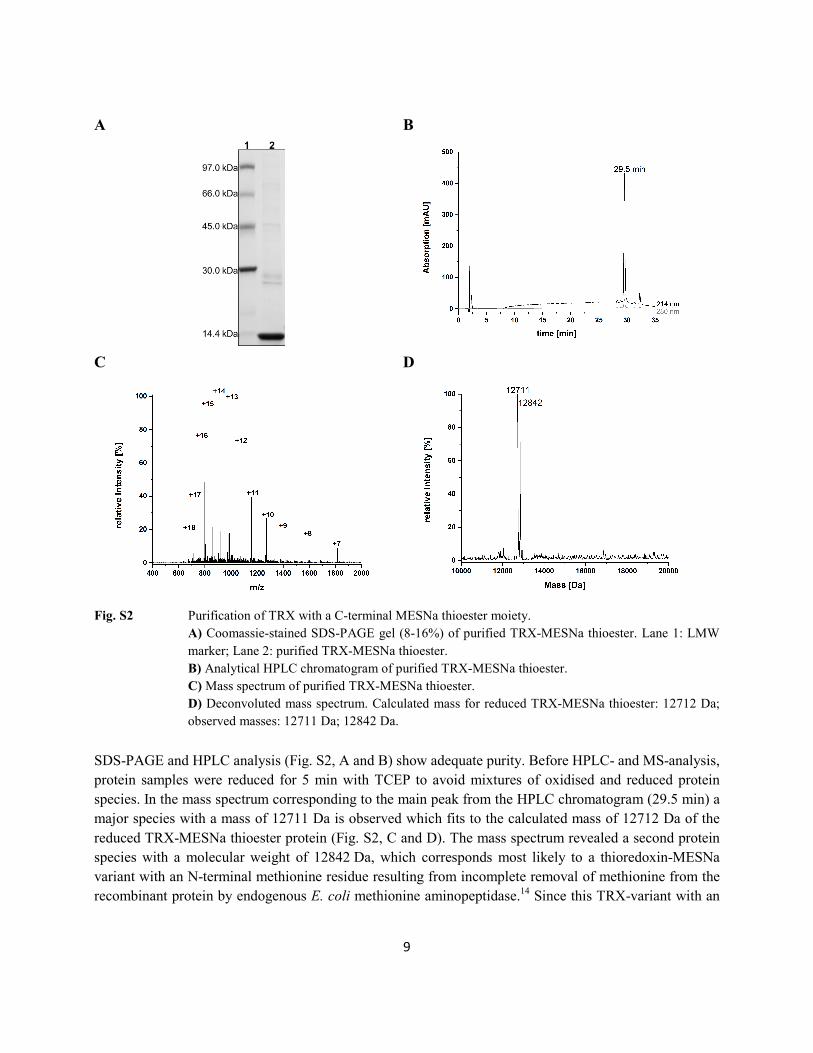
Fig. S2 Purification of TRX with a C-terminal MESNa thioester moiety.
A) Coomassie-stained SDS-PAGE gel (8-16%) of purified TRX-MESNa thioester. Lane 1: LMW marker; Lane 2: purified TRX-MESNa thioester. B) Analytical HPLC chromatogram of purified TRX-MESNa thioester. C) Mass spectrum of purified TRX-MESNa thioester. D) Deconvoluted mass spectrum. Calculated mass for reduced TRX-MESNa thioester: 12712 Da; observed masses: 12711 Da; 12842 Da.
SDS-PAGE and HPLC analysis (Fig. S2, A and B) show adequate purity. Before HPLC- and MS-analysis, protein samples were reduced for 5 min with TCEP to avoid mixtures of oxidised and reduced protein species. In the mass spectrum corresponding to the main peak from the HPLC chromatogram (29.5 min) a major species with a mass of 12711 Da is observed which fits to the calculated mass of 12712 Da of the reduced TRX-MESNa thioester protein (Fig. S2, C and D). The mass spectrum revealed a second protein species with a molecular weight of 12842 Da, which corresponds most likely to a thioredoxin-MESNa variant with an N-terminal methionine residue resulting from incomplete removal of methionine from the recombinant protein by endogenous E. coli methionine aminopeptidase.14 Since this TRX-variant with an

N-terminal methionine residues will not interfere with TRX function in following experiments, the TRX-MESNa thioester protein was not further purified. 2.2 Expressed protein ligation of eGFP and TRX proteins with peptides A to D The eGFP protein with C-terminal MESNa thioester was ligated to peptide variants A to D using ethanethiol as additive to promote thioester exchange and ligation reactions. The ligation mixtures were incubated at room temperature for 20 h and subsequently analysed with SDS-PAGE (Fig. S3). The gel shows that eGFP-peptide conjugate bands are distinctly shifted to higher molecular weights compared to the eGFP-MESNa thioester protein indicating successful ligation. The ligation of eGFP with peptides A to D was further confirmed by LC-MS analysis (Fig. S4 to S7). The observed masses for the eGFP-peptide conjugates are in good agreement with the calculated masses. The minor peaks in the HPLC chromatograms at higher retention times could be assigned to hydrolysed eGFP thioester protein. The ligation reactions gave satisfactory yields between 66-80% as calculated from integrated peak areas of HPLC traces.
Fig. S3 Coomassie-stained SDS-PAGE gel (15%) of EPL reaction between eGFP-MESNa thioester and
peptides A to D. Lane 1: LMW marker; Lane 2: purified eGFP-MESNa thioester; Lane 3: eGFP-A; Lane 4: eGFP-D; Lane 5: eGFP-C; Lane 6: eGFP-B.

11
A B
C
Fig. S4 LC-MS analysis of eGFP-A conjugate.
A) HPLC chromatogram of analytical LC-MS analysis of eGFP-A conjugate. B) Mass spectrum of the peak at 23.3 min from analytical LC-MS analysis of eGFP-A. C) Deconvoluted mass spectrum. Calculated mass: 29772 Da; observed mass: 29776 Da.

A B
C
Fig. S5 LC-MS analysis of eGFP-B conjugate.
A) HPLC chromatogram of analytical LC-MS analysis of eGFP-B conjugate. B) Mass spectrum of the peak at 23.3 min from analytical LC-MS analysis of eGFP-B. C) Deconvoluted mass spectrum. Calculated mass: 29815 Da; observed mass: 29818 Da.
13
A B
C
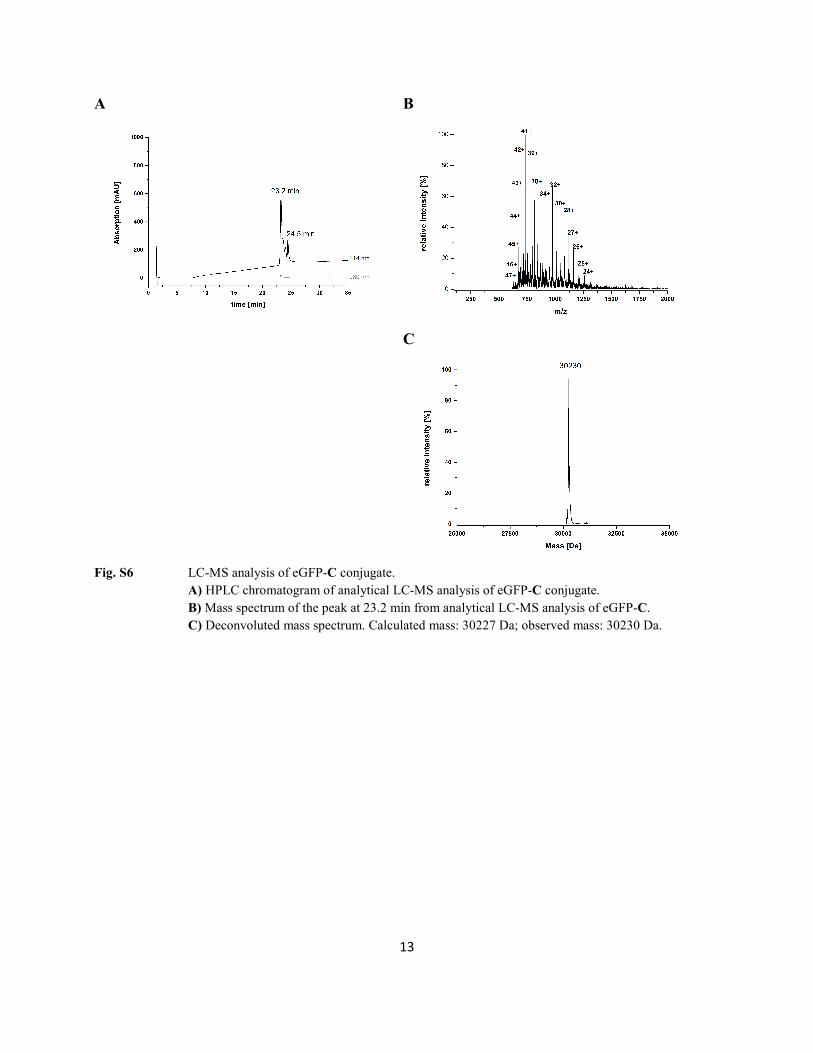
Fig. S6 LC-MS analysis of eGFP-C conjugate.
A) HPLC chromatogram of analytical LC-MS analysis of eGFP-C conjugate. B) Mass spectrum of the peak at 23.2 min from analytical LC-MS analysis of eGFP-C. C) Deconvoluted mass spectrum. Calculated mass: 30227 Da; observed mass: 30230 Da.

A B
C
Fig. S7 LC-MS analysis of eGFP-D conjugate.
A) HPLC chromatogram of analytical LC-MS analysis of eGFP-D conjugate B) Mass spectrum of the peak at 23.4 min from analytical LC-MS analysis of eGFP-D. C) Deconvoluted mass spectrum. Calculated mass: 29852 Da; observed mass: 29856 Da.
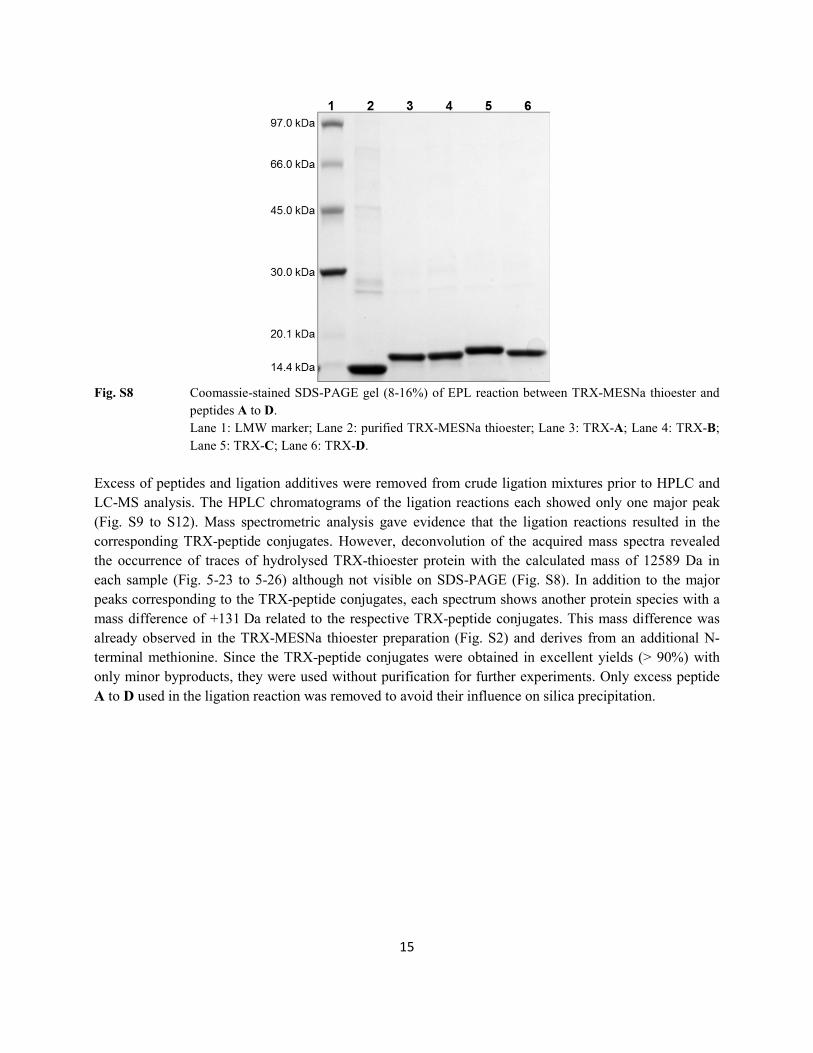
Accordingly, the purified TRX-MESNa thioester was used in expressed protein ligation reactions with peptides A to D to yield the corresponding TRX-peptide conjugates. These reactions were performed at 30 °C with thiophenol as ligation mediator. 5 mMTCEP were added to the reaction solution to keep the protein sulfhydryl groups permanently reduced. SDS-PAGE analysis of the EPL reactions after 24 h reveals the appearance of new bands at higher molecular weights compared to the TRX-thioester protein that correspond to the ligation products (Fig. S8). All reactions proceeded very efficiently and yielded 91-98% of ligation products.
15
Fig. S8 Coomassie-stained SDS-PAGE gel (8-16%) of EPL reaction between TRX-MESNa thioester and
peptides A to D. Lane 1: LMW marker; Lane 2: purified TRX-MESNa thioester; Lane 3: TRX-A; Lane 4: TRX-B; Lane 5: TRX-C; Lane 6: TRX-D.
Excess of peptides and ligation additives were removed from crude ligation mixtures prior to HPLC and LC-MS analysis. The HPLC chromatograms of the ligation reactions each showed only one major peak (Fig. S9 to S12). Mass spectrometric analysis gave evidence that the ligation reactions resulted in the corresponding TRX-peptide conjugates. However, deconvolution of the acquired mass spectra revealed the occurrence of traces of hydrolysed TRX-thioester protein with the calculated mass of 12589 Da in each sample (Fig. 5-23 to 5-26) although not visible on SDS-PAGE (Fig. S8). In addition to the major peaks corresponding to the TRX-peptide conjugates, each spectrum shows another protein species with a mass difference of +131 Da related to the respective TRX-peptide conjugates. This mass difference was already observed in the TRX-MESNa thioester preparation (Fig. S2) and derives from an additional N-terminal methionine. Since the TRX-peptide conjugates were obtained in excellent yields (> 90%) with only minor byproducts, they were used without purification for further experiments. Only excess peptide A to D used in the ligation reaction was removed to avoid their influence on silica precipitation.
A B
C
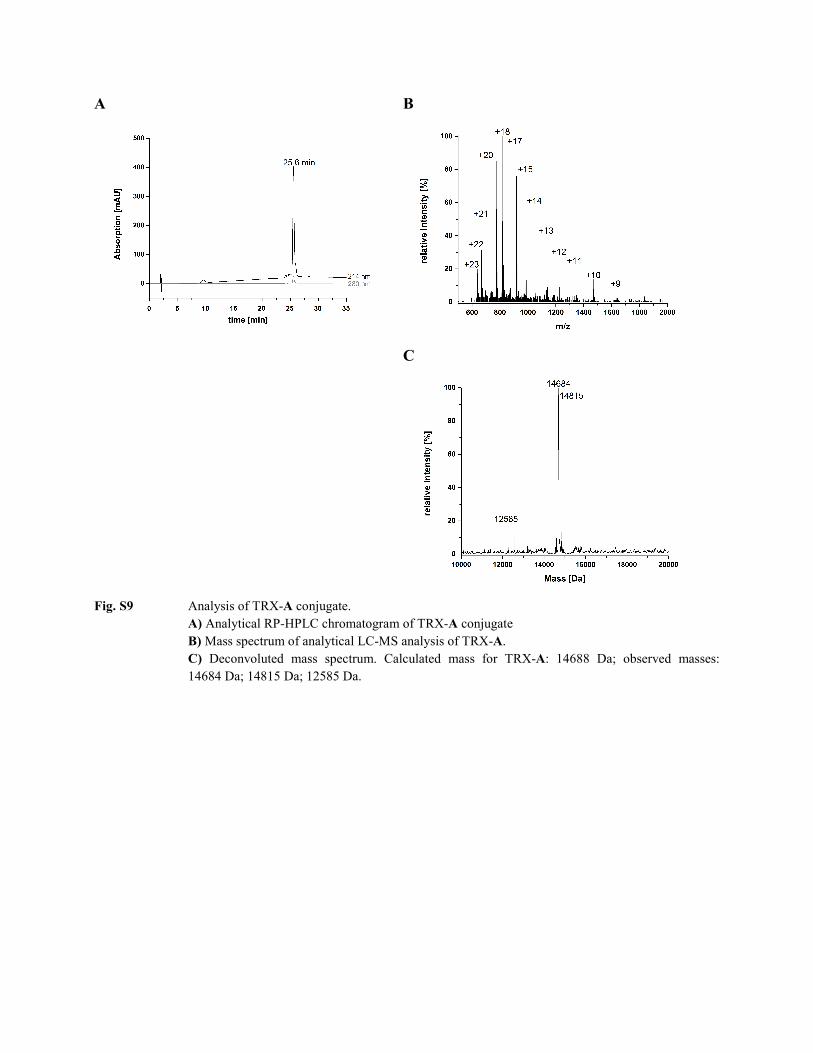
Fig. S9 Analysis of TRX-A conjugate.
A) Analytical RP-HPLC chromatogram of TRX-A conjugate B) Mass spectrum of analytical LC-MS analysis of TRX-A. C) Deconvoluted mass spectrum. Calculated mass for TRX-A: 14688 Da; observed masses: 14684 Da; 14815 Da; 12585 Da.

17
A B
C
Fig. S10 Analysis of TRX-B conjugate.
A) Analytical RP-HPLC chromatogram of TRX-B conjugate. B) Mass spectrum of analytical LC-MS analysis of TRX-B. C) Deconvoluted mass spectrum. Calculated mass for TRX-B: 14731 Da; observed masses: 14724 Da; 14857 Da; 12585 Da.
A B
C
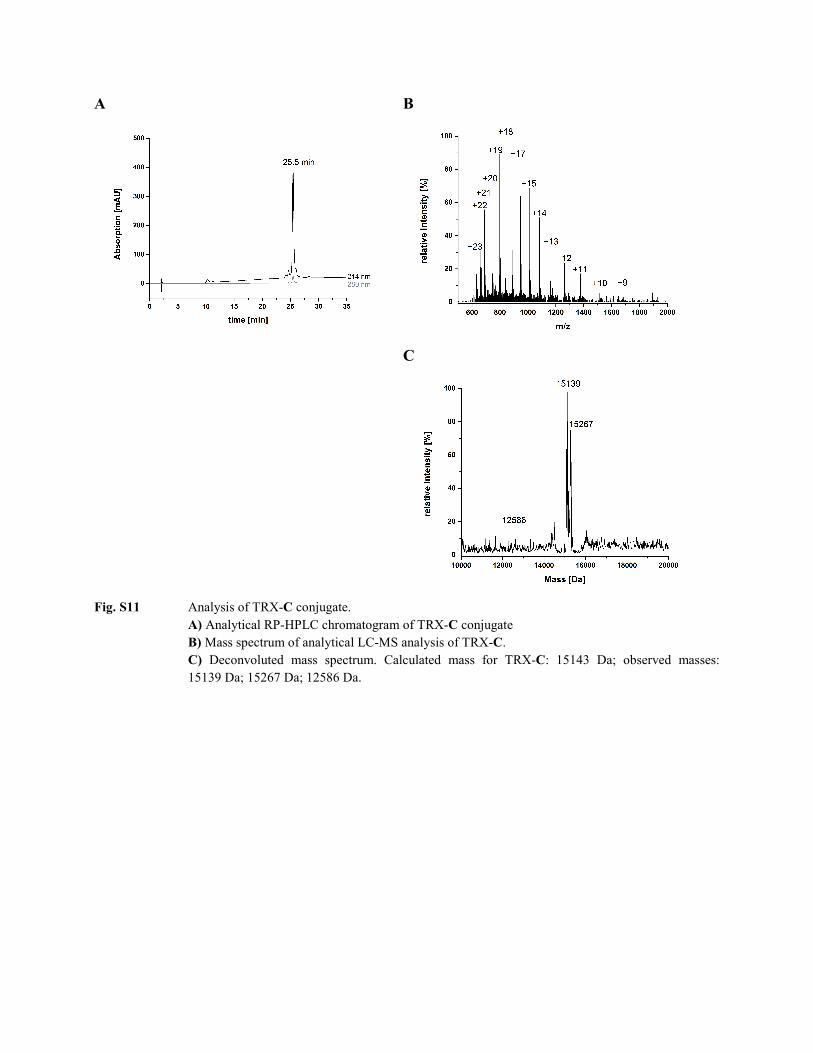
Fig. S11 Analysis of TRX-C conjugate.
A) Analytical RP-HPLC chromatogram of TRX-C conjugate B) Mass spectrum of analytical LC-MS analysis of TRX-C. C) Deconvoluted mass spectrum. Calculated mass for TRX-C: 15143 Da; observed masses: 15139 Da; 15267 Da; 12586 Da.

19
A B
C
Fig. S12 Analysis of TRX-D conjugate.
A) Analytical RP-HPLC chromatogram of TRX-D conjugate B) Mass spectrum of analytical LC-MS analysis of TRX-D. C) Deconvoluted mass spectrum. Calculated mass for TRX-D: 14768 Da; observed masses: 14763 Da; 14893 Da; 12584 Da.
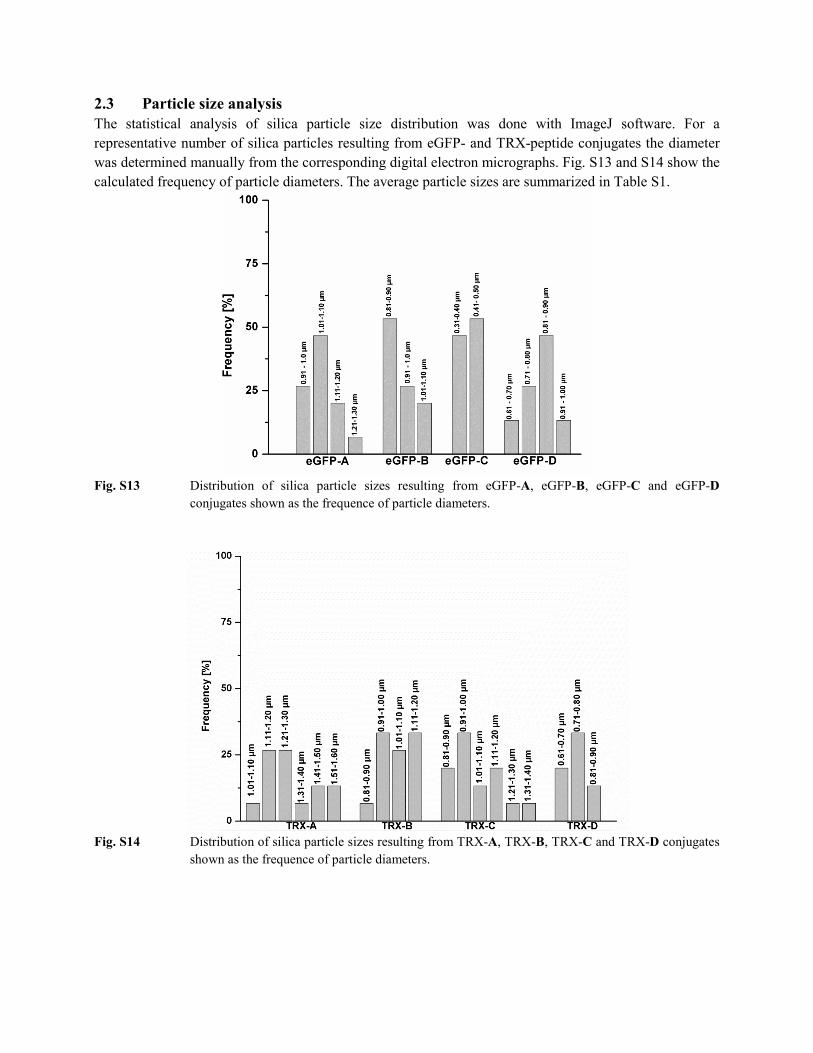
2.3 Particle size analysis The statistical analysis of silica particle size distribution was done with ImageJ software. For a representative number of silica particles resulting from eGFP- and TRX-peptide conjugates the diameter was determined manually from the corresponding digital electron micrographs. Fig. S13 and S14 show the calculated frequency of particle diameters. The average particle sizes are summarized in Table S1.
Fig. S13 Distribution of silica particle sizes resulting from eGFP-A, eGFP-B, eGFP-C and eGFP-D
conjugates shown as the frequence of particle diameters.
Fig. S14 Distribution of silica particle sizes resulting from TRX-A, TRX-B, TRX-C and TRX-D conjugates
shown as the frequence of particle diameters.

21
Table S1 Average silica particle sizes resulting from eGFP- and TRX-peptide conjugates. sample Average particle size eGFP-A conjugate 1.05 ± 0.08 µm eGFP-B conjugate 0.93 ± 0.07 µm eGFP-C conjugate 0.40 ± 0.03 µm eGFP-D conjugate 0.81 ± 0.09 µm TRX-A conjugate 1.34 ± 0.21 µm TRX-B conjugate 1.03 ± 0.09 µm TRX-C conjugate 1.03 ± 0.16 µm TRX-D conjugate 0.77 ± 0.08 µm
2.4 Silica precipitation with eGFP-peptide conjugates
Fig. S15 Fluorescence (upper panel) and bright-field (lower panel) micrographs of silica particles resulting form silica precipitations with covalent eGFP-peptide conjugates. Scale bars 1 µm. a) eGFP-A conjugate; b) eGFP-B conjugate; c) eGFP-C conjugate; d) eGFP-D conjugate.
Fig. S16 Fluorescence (upper panel) and bright-field (lower panel) micrographs of silica material resulting form silica co-precipitation with eGFP and peptide variants. Scale bars 1 µm. a) co-precipiation with eGFP and peptide A; b) co-precipiation with eGFP and peptide B; c) co-precipiation with eGFP and peptide C; d) co-precipiation with eGFP and peptide D.

2.5 Silica precipitation with eGFP A B
Fig. S17 Scanning electron micrograph (A) and fluorescence micrograph (B) of silica material resulting
from silica precipitation with eGFP. Scale bars 1 µm. 2.6 Stability of silica immobilised eGFP against denaturation with SDS Immobilisation of eGFP in a silica matrix is aimed to result in stabilisation of the protein. GFP already exhibits a remarkably high stability against heat, pH-changes, proteases and denaturants due to its compact β-barrel fold.15,16 Yet at pH 6.5, GFP was shown to be sensitive to denaturation by SDS.17 Thus, the stabilisation of eGFP caused by silica immobilisation using modified R5 peptides A-D was investigated by analysing denaturation of eGFP with 0.5% SDS at pH 6.5. Denaturation was followed by the decrease of intrinsic fluorescence.18 eGFP in aqueous buffer at pH 6.5 is rapidly denatured by 0.5% SDS as indicated by the rapid drop in fluorescence intensitiy to 10% of the initial value (Fig. S14, Table S1). Without addition of SDS, eGFP is stable and remains fluorescence for several hours (data not shown). Compared to free eGFP in buffer, the silica immobilised eGFP is greatly stabilised against denaturation with SDS and retains at least 50% of its initial fluorescence intensity (Fig. S14). These observations can be explained by surface exposed eGFP getting rapidly denatured after addition of SDS. The remaining fluorescent eGFP is most likely tightly enclosed by silica after in vitro precipitation mediated by the R5 peptide variants A-D and thereby protected against denaturation. Although the observed differences in stabilisation between co-precipitation and covalent eGFP-peptide conjugates are not significant, a direct influence of the different peptide variants on stabilisation could be observed. With the unmodified peptide A and the trimethylated variant B, similar stabilisation of silica-immobilised eGFP was achieved (Fig. S14). Both peptide variants result in spherical silica particles with a homogenous size distribution. On the other hand, with the spermidine or phosphate modified peptides C and D greater stabilisation was achieved (Fig. S14). Peptide C induces the formation of inhomogenously sized silica spheres and peptide D leads to bulky silica material composed of silica nano-particles.19 Therefore, the peptide modifications do not only influence the morphology of the silica materials, but also their physical properties such as pore size. This might be reflected by the different stabilisation effects observed for eGFP with different peptide variants.

23
Fig. S18 Stability of silica immobilised eGFP against treatment with 0.5 % SDS at pH 6.5 monitored by
intrinsic eGFP fluorescence. Covalent eGFP-peptide conjugates and simple coprecipitation experiments (eGFP + peptide A-D) are compared here.
Table S2 Stability of silica immobilised eGFP against treatment with 0.5% SDS at pH 6.5
sample relative fluorescence retained after 5 min
eGFP in solution 10 ± 4 % eGFP-A conjugate 62 ± 5 % eGFP-B conjugate 64 ± 3 % eGFP-C conjugate 74 ± 10 % eGFP-D conjugate 82 ± 10 % eGFP + peptide A (Co-precipitation) 66 ± 3 % eGFP + peptide B (Co-precipitation) 54 ± 3 % eGFP + peptide C (Co-precipitation) 94 ± 10 % eGFP + peptide D (Co-precipitation) 77 ± 8 %
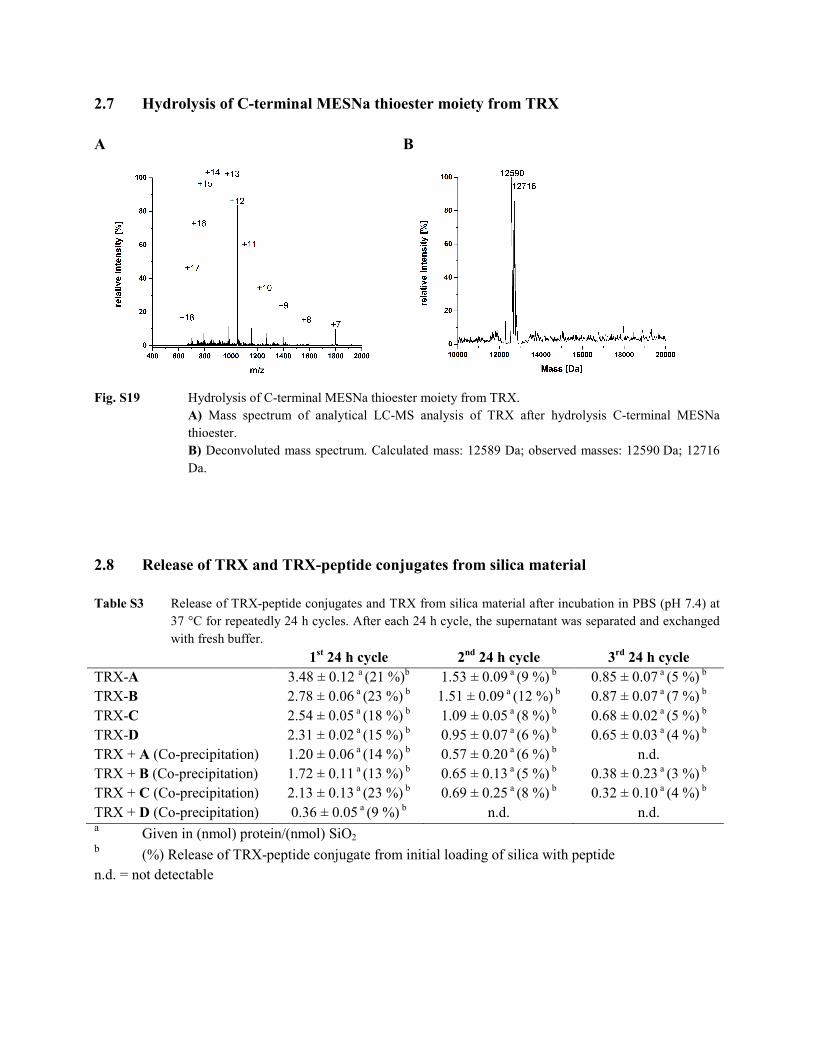
2.7 Hydrolysis of C-terminal MESNa thioester moiety from TRX A B
Fig. S19 Hydrolysis of C-terminal MESNa thioester moiety from TRX.
A) Mass spectrum of analytical LC-MS analysis of TRX after hydrolysis C-terminal MESNa thioester. B) Deconvoluted mass spectrum. Calculated mass: 12589 Da; observed masses: 12590 Da; 12716 Da.
2.8 Release of TRX and TRX-peptide conjugates from silica material Table S3 Release of TRX-peptide conjugates and TRX from silica material after incubation in PBS (pH 7.4) at
37 °C for repeatedly 24 h cycles. After each 24 h cycle, the supernatant was separated and exchanged with fresh buffer.
1st 24 h cycle 2nd 24 h cycle 3rd 24 h cycle TRX-A 3.48 ± 0.12 a (21 %)b 1.53 ± 0.09 a (9 %) b 0.85 ± 0.07 a (5 %) b TRX-B 2.78 ± 0.06 a (23 %) b 1.51 ± 0.09 a (12 %) b 0.87 ± 0.07 a (7 %) b TRX-C 2.54 ± 0.05 a (18 %) b 1.09 ± 0.05 a (8 %) b 0.68 ± 0.02 a (5 %) b TRX-D 2.31 ± 0.02 a (15 %) b 0.95 ± 0.07 a (6 %) b 0.65 ± 0.03 a (4 %) b TRX + A (Co-precipitation) 1.20 ± 0.06 a (14 %) b 0.57 ± 0.20 a (6 %) b n.d. TRX + B (Co-precipitation) 1.72 ± 0.11 a (13 %) b 0.65 ± 0.13 a (5 %) b 0.38 ± 0.23 a (3 %) b TRX + C (Co-precipitation) 2.13 ± 0.13 a (23 %) b 0.69 ± 0.25 a (8 %) b 0.32 ± 0.10 a (4 %) b TRX + D (Co-precipitation) 0.36 ± 0.05 a (9 %) b n.d. n.d. a Given in (nmol) protein/(nmol) SiO2 b (%) Release of TRX-peptide conjugate from initial loading of silica with peptide n.d. = not detectable
25
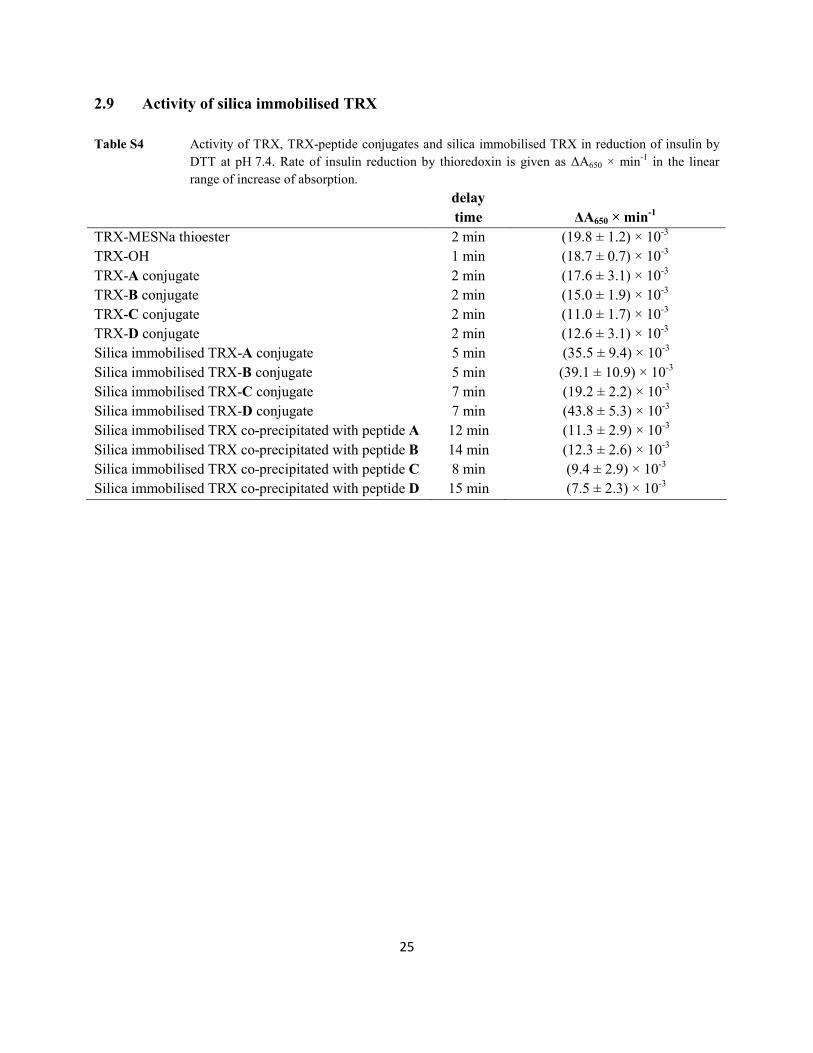
2.9 Activity of silica immobilised TRX Table S4 Activity of TRX, TRX-peptide conjugates and silica immobilised TRX in reduction of insulin by
DTT at pH 7.4. Rate of insulin reduction by thioredoxin is given as ΔA650 × min-1 in the linear range of increase of absorption.
delay time ΔA650 × min-1
TRX-MESNa thioester 2 min (19.8 ± 1.2) × 10-3 TRX-OH 1 min (18.7 ± 0.7) × 10-3 TRX-A conjugate 2 min (17.6 ± 3.1) × 10-3 TRX-B conjugate 2 min (15.0 ± 1.9) × 10-3 TRX-C conjugate 2 min (11.0 ± 1.7) × 10-3 TRX-D conjugate 2 min (12.6 ± 3.1) × 10-3 Silica immobilised TRX-A conjugate 5 min (35.5 ± 9.4) × 10-3 Silica immobilised TRX-B conjugate 5 min (39.1 ± 10.9) × 10-3 Silica immobilised TRX-C conjugate 7 min (19.2 ± 2.2) × 10-3 Silica immobilised TRX-D conjugate 7 min (43.8 ± 5.3) × 10-3 Silica immobilised TRX co-precipitated with peptide A 12 min (11.3 ± 2.9) × 10-3 Silica immobilised TRX co-precipitated with peptide B 14 min (12.3 ± 2.6) × 10-3 Silica immobilised TRX co-precipitated with peptide C 8 min (9.4 ± 2.9) × 10-3 Silica immobilised TRX co-precipitated with peptide D 15 min (7.5 ± 2.3) × 10-3

3 References 1 U. K. Laemmli, Nature 1970, 227, 680. 2 N. K. Chu, D. Olschewski, R. Seidel, K. F. Winklhofer, J. Tatzelt, M. Engelhard,C. F.
Becker, J. Pept. Sci. 2010, 16, 582. 3 M. M. Bradford, Anal. Biochem. 1976, 72, 248. 4 R. K. Iler. The Chemistry of Silica, Wiley-Interscience, New York, 1979, p.174. 5 R. Wieneke, A. Bernecker, R. Riedel, M. Sumper, C. Steinem, A. Geyer, Org. Biomol. Chem.
2011, 9, 5482. 6 A. Holmgren, J. Biol. Chem. 1979, 254, 9627. 7 S. Chong, F. B. Mersha, D. G. Comb, M. E. Scott, D. Landry, L. M. Vence, F. B. Perler, J.
Benner, R. B. Kucera, C. A. Hirvonen, J. J. Pelletier, H. Paulus, M. Q. Xu, Gene 1997, 192, 271.
8 T. C. Evans, J. Benner, M. Q. Xu, Protein Sci. 1998, 7, 2256. 9 A. Telenti, M. Southworth, F. Alcaide, S. Daugelat, W. R. Jacobs, F. B. Perler, J.Bacteriol.
1997, 179, 6378. 10 M. W. Southworth, K. Amaya, T. C. Evans, M. Q. Xu, F. B. Perler, Biotechniques 1999, 27,
110. 11 Z. Lu, E. A. DiBlasio-Smith, K. L. Grant, N. W. Warne, E. R. LaVallie, L. A. Collins-Racie,
M. T. Follettie, M. J. Williamson, J. M. McCoy, J. Biol. Chem. 1996, 271,5059. 12 A. Holmgren, B. O. Söderberg, H. Eklund, C. I. Brändén, Proc. Natl. Acad. Sci. U. S. A.
1975, 72, 2305. 13 F. K. Gleason, C. J. Lim, M. Gerami-Nejad, J. A. Fuchs, Biochemistry 1990, 29, 3701. 14 A. Ben-Bassat, K. Bauer, S. Y. Chang, K. Myambo, A. Boosman, S. J. Chang, J. Bacteriol.
1987, 169, 751. 15 A. Nagy, A. Malnasi-Csizmadia, B. Somogyi, D. Lorinczy, Thermochim. Acta 2004, 410,
161. 16 T. C. Penna, M. Ishii, A. P. Junior, O. Cholewa, Appl. Biochem. Biotechnol. 2004, 113-116,
469. 17 K. M. Alkaabi, A. Yafea, S. S. Ashraf, Appl. Biochem. Biotechnol. 2005, 126, 149. 18 S. H. Bokman, W. W. Ward, Biochem. Biophys. Res. Commun. 1981, 101, 1372. 19 C. C. Lechner, C. F. W. Becker, C. F. W. Chem. Sci. 2012, 3, 3500.