impact assessment (ia) - gov.uk · the options in this ia are: baseline; continue with the...
TRANSCRIPT
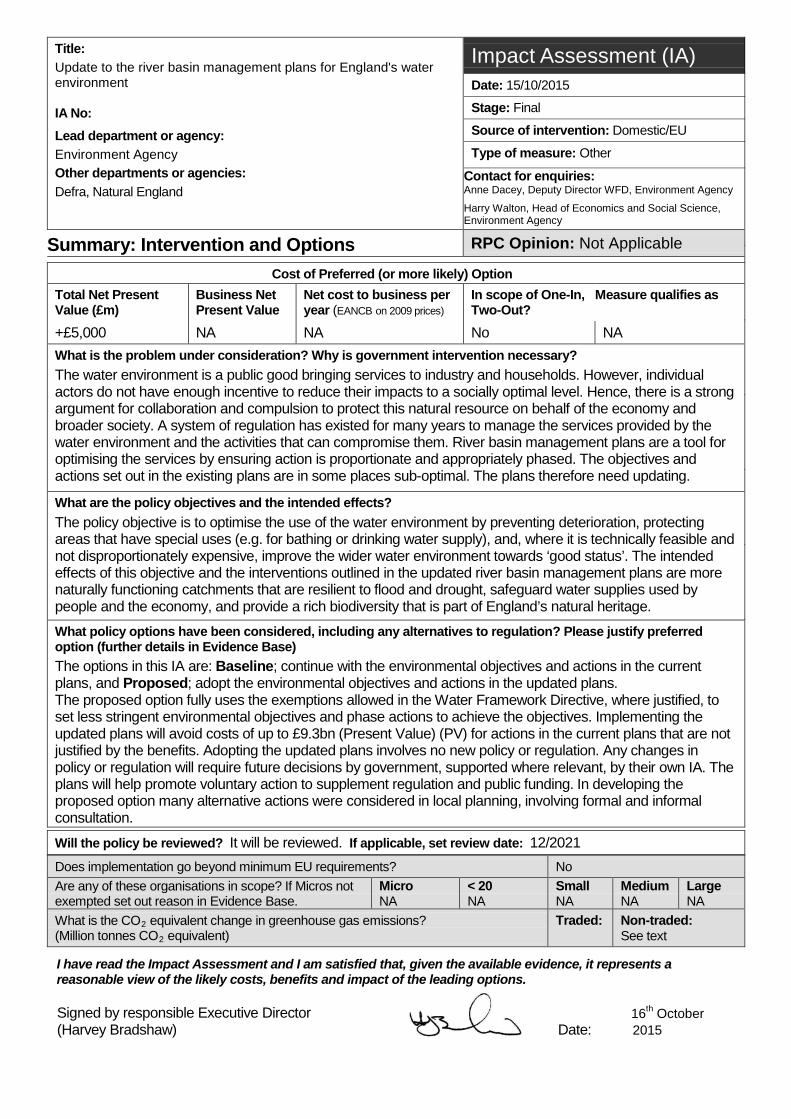
Title: Update to the river basin management plans for England's water environment IA No: Lead department or agency: Environment Agency Other departments or agencies: Defra, Natural England
Impact Assessment (IA) Date: 15/10/2015 Stage: Final Source of intervention: Domestic/EU Type of measure: Other
Contact for enquiries: Anne Dacey, Deputy Director WFD, Environment Agency
Harry Walton, Head of Economics and Social Science, Environment Agency
Summary: Intervention and Options
RPC Opinion: Not Applicable Cost of Preferred (or more likely) Option
Total Net Present Value (£m)
Business Net Present Value
Net cost to business per year (EANCB on 2009 prices)
In scope of One-In, Two-Out?
Measure qualifies as
+£5,000 NA NA No NA What is the problem under consideration? Why is government intervention necessary? The water environment is a public good bringing services to industry and households. However, individual actors do not have enough incentive to reduce their impacts to a socially optimal level. Hence, there is a strong argument for collaboration and compulsion to protect this natural resource on behalf of the economy and broader society. A system of regulation has existed for many years to manage the services provided by the water environment and the activities that can compromise them. River basin management plans are a tool for optimising the services by ensuring action is proportionate and appropriately phased. The objectives and actions set out in the existing plans are in some places sub-optimal. The plans therefore need updating.
What are the policy objectives and the intended effects? The policy objective is to optimise the use of the water environment by preventing deterioration, protecting areas that have special uses (e.g. for bathing or drinking water supply), and, where it is technically feasible and not disproportionately expensive, improve the wider water environment towards ‘good status’. The intended effects of this objective and the interventions outlined in the updated river basin management plans are more naturally functioning catchments that are resilient to flood and drought, safeguard water supplies used by people and the economy, and provide a rich biodiversity that is part of England’s natural heritage.
What policy options have been considered, including any alternatives to regulation? Please justify preferred option (further details in Evidence Base) The options in this IA are: Baseline; continue with the environmental objectives and actions in the current plans, and Proposed; adopt the environmental objectives and actions in the updated plans. The proposed option fully uses the exemptions allowed in the Water Framework Directive, where justified, to set less stringent environmental objectives and phase actions to achieve the objectives. Implementing the updated plans will avoid costs of up to £9.3bn (Present Value) (PV) for actions in the current plans that are not justified by the benefits. Adopting the updated plans involves no new policy or regulation. Any changes in policy or regulation will require future decisions by government, supported where relevant, by their own IA. The plans will help promote voluntary action to supplement regulation and public funding. In developing the proposed option many alternative actions were considered in local planning, involving formal and informal consultation. Will the policy be reviewed? It will be reviewed. If applicable, set review date: 12/2021 Does implementation go beyond minimum EU requirements? No Are any of these organisations in scope? If Micros not exempted set out reason in Evidence Base.
Micro NA
< 20 NA
Small NA
MediumNA
Large NA
What is the CO2 equivalent change in greenhouse gas emissions? (Million tonnes CO2 equivalent)
Traded:
Non-traded: See text
I have read the Impact Assessment and I am satisfied that, given the available evidence, it represents a reasonable view of the likely costs, benefits and impact of the leading options.
Signed by responsible Executive Director (Harvey Bradshaw) Date:
16th October 2015
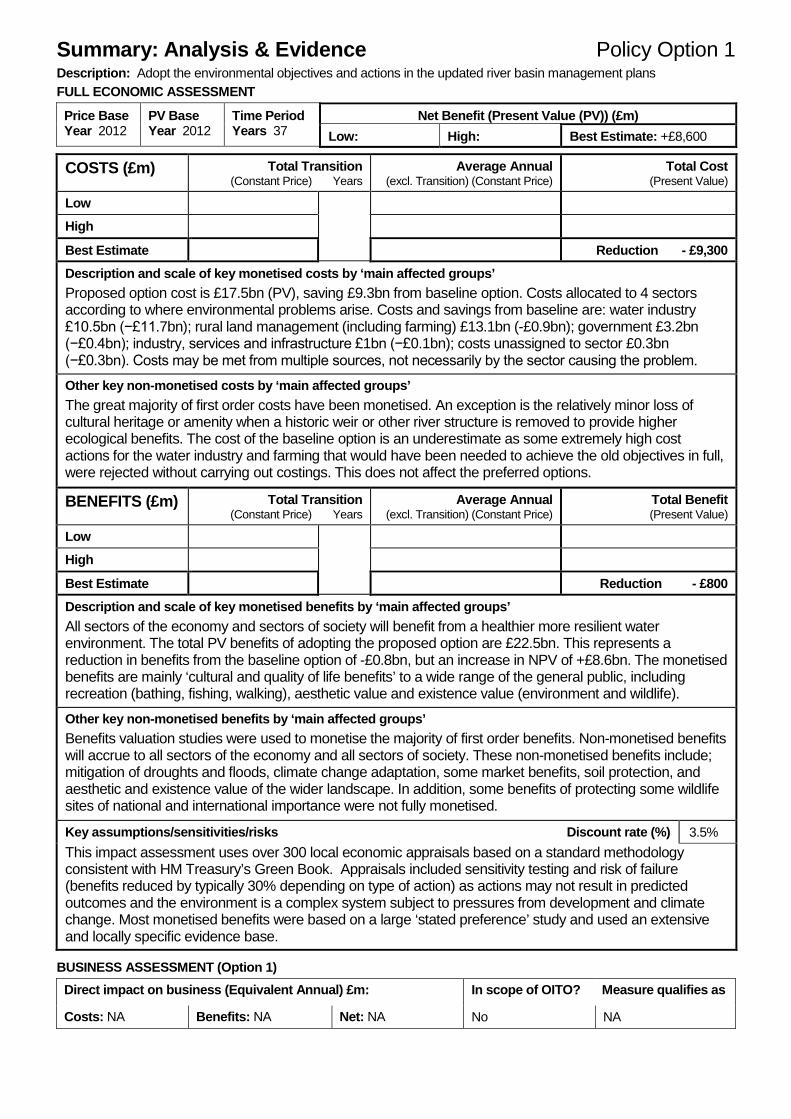
Summary: Analysis & Evidence Policy Option 1 Description: Adopt the environmental objectives and actions in the updated river basin management plans FULL ECONOMIC ASSESSMENT
Price Base Year 2012
PV Base Year 2012
Time Period Years 37
Net Benefit (Present Value (PV)) (£m) Low: High: Best Estimate: +£8,600
COSTS (£m) Total Transition
(Constant Price) Years
Average Annual (excl. Transition) (Constant Price)
Total Cost (Present Value)
Low
High
Best Estimate
Reduction - £9,300
Description and scale of key monetised costs by ‘main affected groups’ Proposed option cost is £17.5bn (PV), saving £9.3bn from baseline option. Costs allocated to 4 sectors according to where environmental problems arise. Costs and savings from baseline are: water industry £10.5bn (−£11.7bn); rural land management (including farming) £13.1bn (-£0.9bn); government £3.2bn (−£0.4bn); industry, services and infrastructure £1bn (−£0.1bn); costs unassigned to sector £0.3bn (−£0.3bn). Costs may be met from multiple sources, not necessarily by the sector causing the problem.
Other key non-monetised costs by ‘main affected groups’ The great majority of first order costs have been monetised. An exception is the relatively minor loss of cultural heritage or amenity when a historic weir or other river structure is removed to provide higher ecological benefits. The cost of the baseline option is an underestimate as some extremely high cost actions for the water industry and farming that would have been needed to achieve the old objectives in full, were rejected without carrying out costings. This does not affect the preferred options.
BENEFITS (£m) Total Transition (Constant Price) Years
Average Annual (excl. Transition) (Constant Price)
Total Benefit (Present Value)
Low
High
Best Estimate
Reduction - £800
Description and scale of key monetised benefits by ‘main affected groups’ All sectors of the economy and sectors of society will benefit from a healthier more resilient water environment. The total PV benefits of adopting the proposed option are £22.5bn. This represents a reduction in benefits from the baseline option of -£0.8bn, but an increase in NPV of +£8.6bn. The monetised benefits are mainly ‘cultural and quality of life benefits’ to a wide range of the general public, including recreation (bathing, fishing, walking), aesthetic value and existence value (environment and wildlife). Other key non-monetised benefits by ‘main affected groups’ Benefits valuation studies were used to monetise the majority of first order benefits. Non-monetised benefits will accrue to all sectors of the economy and all sectors of society. These non-monetised benefits include; mitigation of droughts and floods, climate change adaptation, some market benefits, soil protection, and aesthetic and existence value of the wider landscape. In addition, some benefits of protecting some wildlife sites of national and international importance were not fully monetised.
Key assumptions/sensitivities/risks Discount rate (%)
3.5% This impact assessment uses over 300 local economic appraisals based on a standard methodology consistent with HM Treasury’s Green Book. Appraisals included sensitivity testing and risk of failure (benefits reduced by typically 30% depending on type of action) as actions may not result in predicted outcomes and the environment is a complex system subject to pressures from development and climate change. Most monetised benefits were based on a large ‘stated preference’ study and used an extensive and locally specific evidence base.
BUSINESS ASSESSMENT (Option 1) Direct impact on business (Equivalent Annual) £m: In scope of OITO? Measure qualifies as
Costs: NA Benefits: NA Net: NA No NA

1
Impact assessment for the updated river basin management plans (2015): evidence base Contents 1. Background ....................................................................................................................... 2
2. What is the problem under consideration? Why is government intervention necessary? ... 4
3. What are the policy objectives and intended effects? ........................................................ 6
4. What policy options have been considered? ..................................................................... 7
5. Appraisal process ............................................................................................................. 9
6. Description and scale of key monetised and other non monetised costs and benefits by main affected groups........................................................................................................... 14
7. Business assessment ..................................................................................................... 34
8. Risks and Assumptions ................................................................................................... 35
9. Conclusions .................................................................................................................... 37
ANNEX A: Comparison of the estimates of costs and benefits of previous impact assessments ................................................................................................................... 38
ANNEX B: Changes between 2014 and 2015 economic analysis ................................... 40
ANNEX C: River Basin District tables .............................................................................. 43

2
1. Background
River basin management plans (the plans) set out environmental objectives for all groundwater and surface water bodies (including estuaries and coastal waters) and summarise the wide ranging programmes of measures needed to meet those objectives. The plans and associated programmes of measures are updated on a six yearly basis in line with the requirements of the Water Framework Directive (WFD) and transposing regulations. The first plans were published in 2009. This impact assessment relates to the updated plans of 2015.
The purpose of the plans and the WFD is to achieve sustainable water management by rationalising and integrating various existing policies and regulations designed to protect the water environment in one legal framework. River basin management planning is the government's tool for optimising the goods and services provided by the water environment by ensuring action is proportionate and appropriately phased.
Economic analysis is a core requirement of river basin management planning including consideration of the positive and negative consequences of environmental pressures and management measures. Wider environmental priorities, economic considerations and social issues are also taken into account when setting objectives in river basin management plans.
In proposing objectives in the updated river basin management plans, the Environment Agency has considered what measures are technically feasible, and whether the benefits delivered by carrying out the measures are proportionate to the costs. In addition, the plans include consideration of distributional impacts (how costs are distributed between those sectors that pay) and social impacts. A key test for adopting alternative objectives is a justification that the measures necessary to achieve the default objective would be ‘disproportionately expensive’. The Secretary of State for Environment, Food and Rural Affairs will decide what is disproportionate, based on a range of evidence, including this impact assessment.
In developing the plans, the Environment Agency aims to ensure public and private money is invested effectively and transparently for the greatest benefit to society as a whole.
In England, businesses, the third sector and public sector jointly spend about £5 billion a year to protect the water environment (to prevent deterioration) and protect public health and wellbeing. This includes:
• water industry operating costs to collect and treat sewage of approximately £3 billion
• industry and businesses investment of around £1 billion to mitigate their potential impact on the water environment and meet basic regulatory requirements
• £450 million by agriculture to meet basic regulatory requirements and further reduce impacts on the water environment - this includes payments under the Common Agricultural Policy and voluntary industry initiatives
• expenditure by government and the voluntary sectors to mitigate historic damage and provide water related benefits for people and wildlife
Over the last six years much has been done to improve the understanding of the water environment. The quantity and quality of the evidence available continues to grow because of significant investment:
• Across England, an additional £4.7 million has been invested in a new ecological monitoring programme for rivers and an additional £1.5 million has been invested in chemical monitoring technology. This means the evidence base for the updated plans is more robust; being better able to detect the nature of environmental impacts.
3
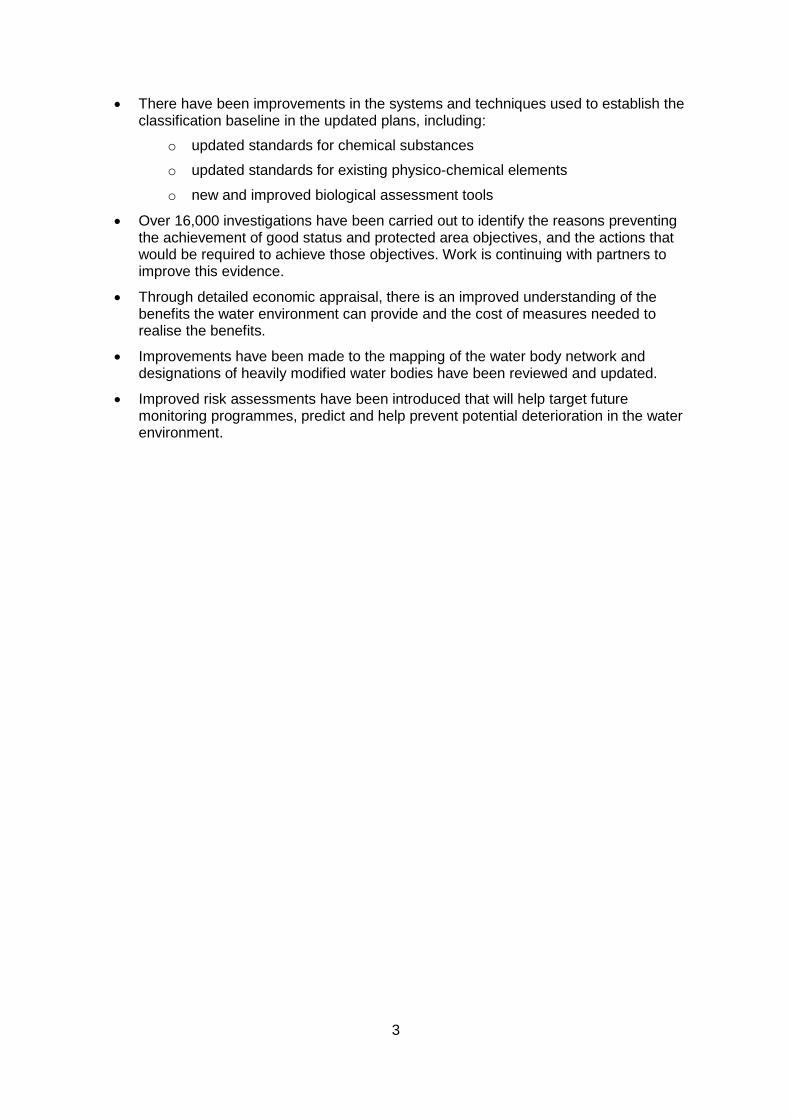
• There have been improvements in the systems and techniques used to establish the classification baseline in the updated plans, including:
o updated standards for chemical substances
o updated standards for existing physico-chemical elements
o new and improved biological assessment tools
• Over 16,000 investigations have been carried out to identify the reasons preventing the achievement of good status and protected area objectives, and the actions that would be required to achieve those objectives. Work is continuing with partners to improve this evidence.
• Through detailed economic appraisal, there is an improved understanding of the benefits the water environment can provide and the cost of measures needed to realise the benefits.
• Improvements have been made to the mapping of the water body network and designations of heavily modified water bodies have been reviewed and updated.
• Improved risk assessments have been introduced that will help target future monitoring programmes, predict and help prevent potential deterioration in the water environment.
4
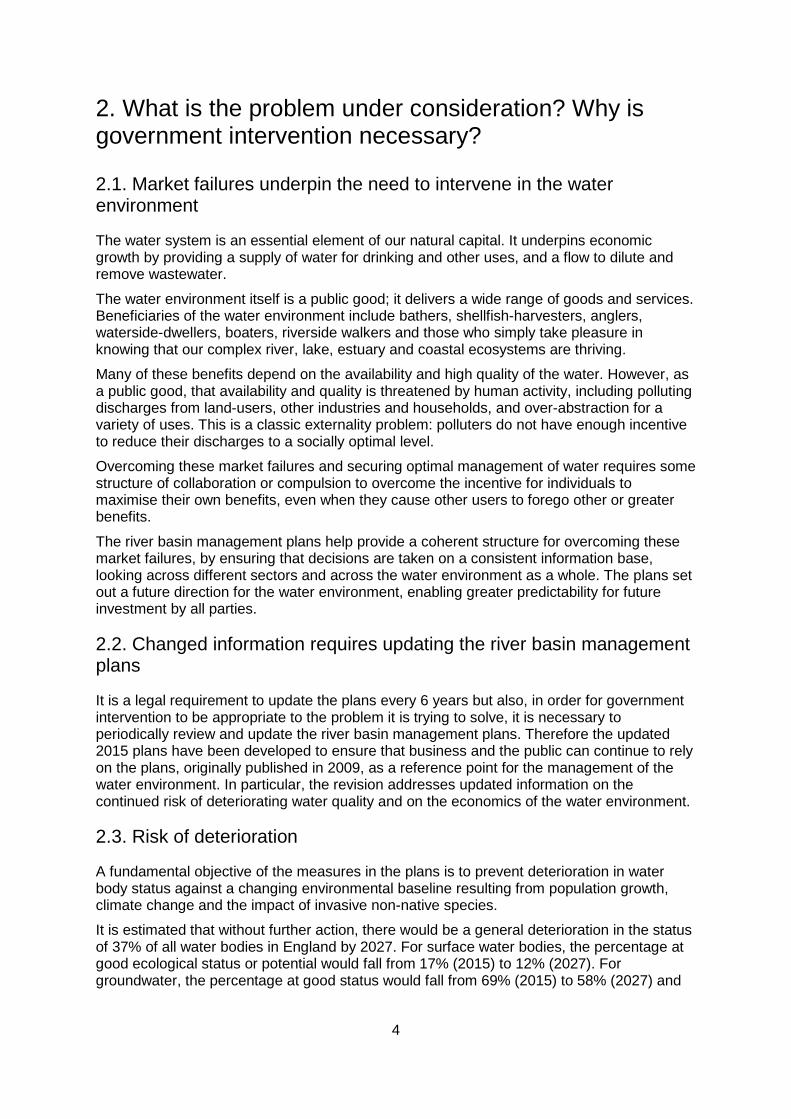
2. What is the problem under consideration? Why is government intervention necessary?
2.1. Market failures underpin the need to intervene in the water environment The water system is an essential element of our natural capital. It underpins economic growth by providing a supply of water for drinking and other uses, and a flow to dilute and remove wastewater.
The water environment itself is a public good; it delivers a wide range of goods and services. Beneficiaries of the water environment include bathers, shellfish-harvesters, anglers, waterside-dwellers, boaters, riverside walkers and those who simply take pleasure in knowing that our complex river, lake, estuary and coastal ecosystems are thriving.
Many of these benefits depend on the availability and high quality of the water. However, as a public good, that availability and quality is threatened by human activity, including polluting discharges from land-users, other industries and households, and over-abstraction for a variety of uses. This is a classic externality problem: polluters do not have enough incentive to reduce their discharges to a socially optimal level.
Overcoming these market failures and securing optimal management of water requires some structure of collaboration or compulsion to overcome the incentive for individuals to maximise their own benefits, even when they cause other users to forego other or greater benefits.
The river basin management plans help provide a coherent structure for overcoming these market failures, by ensuring that decisions are taken on a consistent information base, looking across different sectors and across the water environment as a whole. The plans set out a future direction for the water environment, enabling greater predictability for future investment by all parties.
2.2. Changed information requires updating the river basin management plans
It is a legal requirement to update the plans every 6 years but also, in order for government intervention to be appropriate to the problem it is trying to solve, it is necessary to periodically review and update the river basin management plans. Therefore the updated 2015 plans have been developed to ensure that business and the public can continue to rely on the plans, originally published in 2009, as a reference point for the management of the water environment. In particular, the revision addresses updated information on the continued risk of deteriorating water quality and on the economics of the water environment.
2.3. Risk of deterioration
A fundamental objective of the measures in the plans is to prevent deterioration in water body status against a changing environmental baseline resulting from population growth, climate change and the impact of invasive non-native species.
It is estimated that without further action, there would be a general deterioration in the status of 37% of all water bodies in England by 2027. For surface water bodies, the percentage at good ecological status or potential would fall from 17% (2015) to 12% (2027). For groundwater, the percentage at good status would fall from 69% (2015) to 58% (2027) and
5
53% (2015) to 25% (2027) for groundwater quantitative and groundwater chemical status, respectively.
The main reasons for the predicted deterioration in surface waters if preventative measures are not taken are a predicted increase in the physical modification of rivers and the spread of invasive non-native species. The predicted increase in physical modification is driven by climate change and population growth resulting in the need for increased flood protection and land drainage, the spread of urban areas and the need for more water storage (impoundments). The main reasons for predicted deterioration in groundwater quantitative status are linked to groundwater abstraction impacting on surface water flows or exceeding the available groundwater resource. The main reasons for predicted deterioration in groundwater chemical status are impact on groundwater quality from nitrates and pesticides, impact on surface water chemistry and ecology from nitrates, metals, phosphate and solvents, and saline intrusion.
The loss of benefits (for surface waters) is estimated to be £7 billion in present value terms (PV) over a 37 year appraisal period. This is likely to be an underestimate because it is based on willingness to pay values for improvements rather than willingness to accept compensation for loss, which research has shown is generally higher1, and water bodies are likely to continue to deteriorate beyond 2027 without additional protection.
2.4. New economic evidence
In line with an increased understanding of the significant benefits that water ecosystems can provide for recreation and amenity, better estimates of relevant costs and benefits have been applied than was possible for the 2009 plans. The updated plans are therefore in line with the government white paper ‘The Natural Choice’. The white paper is committed to bringing the value of nature into the mainstream, to create an economy where economic growth and the health of natural resources sustain each other and is supported by recent recommendations from the Natural Capital Committee.
1 A Review of WTA / WTP Studies, John K. Horowitz and Kenneth E. McConnell 2002, Journal of Environmental Economics and Management 44, 426_447
6
3. What are the policy objectives and intended effects?
River basin management planning aims to optimise the provision of goods and services provided by the water environment. The measures in the updated plans aim to achieve this by preventing deterioration, protecting areas that have special uses (for example, for bathing or drinking water supply) and, where it is cost beneficial, improving the wider water environment towards 'good status'. The intended effects are more naturally functioning catchments that are resilient to flood and drought, safeguard water supplies used by people and the economy, and provide a rich biodiversity that is part of England's natural heritage.
Approving the updated plans will give the appropriate legal status to the new environmental objectives within them and the programmes of measures which they contain. This will allow the organisations delivering programmes of measures to move forward with implementing these in an appropriate way. This will also provide the legal standing for the application of exemptions from the default objective of good status, on grounds of technical feasibility or disproportionate expense, and provide ministerial approval for phasing of costs over the period of the second and third plans.
Overall, the intended effects of the updated plans will be more water bodies at good status and more protected areas in favourable condition or achieving designated status standards. Good status will contribute to a water body providing many of the goods and services that would be expected of a sustainable resource. This status allows for economic resilience for those businesses dependent on use of the resource and provides opportunity for economic growth in development of new goods and services in a sustainable context.
The updated plans also provide clarity on the long term ambition for achievement of good status or setting of ‘alternative’ objectives. In certain and specific circumstances (set out in Articles 4.4 and 4.5 of the WFD) member states may deviate from achieving the default objectives. Environmental objectives which are different from the default environmental objectives are referred to as alternative environmental objectives.
Use of alternative environmental objectives is the mechanism which the WFD provides for:
• considering other environmental, social and economic priorities alongside water management priorities
• prioritising measures over successive river basin management planning cycles
The alternative environmental objectives and their conditions are the only relevant considerations when justifying the prioritisation of action under the WFD.
The types of alternative environmental objective are:
• an extended deadline (for example, achieving good status by 2027)
• a less stringent objective (for example, achieving moderate status by 2021)
In some circumstances both may apply to a water body objective (for example, achieving moderate status by 2027).
The updated plans, in developing a more comprehensive understanding of the use of alternative objectives, allow for longer term economic and social planning.

7
4. What policy options have been considered?
The options are:
• Baseline - continue with the package of regulatory and investment actions to achieve the environmental objectives and actions in the current plans (2009) - aim to prevent deterioration, achieve protected area objectives and carry out all technically feasible improvements towards good status.
Under this option water bodies would be expected to achieve good status unless natural background conditions prevent it or there is no known technical solution to existing problems, regardless of whether the measures are cost beneficial or not.
When defining the baseline it is assumed that all other legislation which has been passed and funding which has been committed is implemented and spent. It is assumed that the Eel Regulations, Nitrate Vulnerable Zone changes and other water related legislation progressed outside of the river basin management planning process will proceed. The costs and benefits of these measures have already been accounted for in other policy appraisal exercises and so are not included here.
• Proposed - adopt the package of regulatory and investment actions to achieve the environmental objectives and actions in the updated plans (2015) - aim to prevent deterioration, achieve protected area objectives and carry out all technically feasible improvements in status where benefits exceed costs.
Under this option water bodies would be expected to achieve good status where there are cost beneficial technically feasible measures, unless natural background conditions prevent it or there is no known technical solution to existing problems.
The proposed option uses the exemptions allowed in the WFD to set less stringent environmental objectives on the grounds of technical feasibility and disproportionate expense. Implementing this option will provide a higher net present value (NPV) than the baseline option because even though the benefits are higher in the baseline option, the costs are significantly higher than in the proposed option. Over £9 billion (PV) of actions in the baseline option are not justified by the benefits.
Development of the proposed option involved consideration of alternative measures in a catchment appraisal process to determine which bundles of measures were disproportionately expensive. The appraisals identified bundles of measures which were considered cost beneficial (which had a benefit-cost ratio (BCR) greater than 1) and bundles of measures which were considered not cost-beneficial (BCR less than 1). If there was more than one viable bundle of measures, the bundle with the highest NPV was recommended. Rejected alternative bundles of measures are not presented here but are available on request2. More information on how the Environment Agency used economic appraisal as a tool for river basin management planning can be downloaded via the DataShare service3.
Both options include phasing of measures and the achievement of environmental objectives to 2027 where justified.
The proposed option requires no additional changes in policy or regulation, although options for the mechanism to achieve some of the actions will still have to be considered in future policy appraisals.
2 Catchment economic appraisals are available on request via the National Customer Contact Centre on 03708 506506
3 https://ea.sharefile.com/i/ia2938a7e56f442aa

8
Both options under consideration contain regulatory and non-regulatory measures. The former are used particularly where there is no alternative means of securing the environmental objectives. Other measures include voluntary approaches, which are promoted throughout the plans, for example, catchment sensitive farming.

9
5. Appraisal process
5.1. Appraisal method
5.1.1 General approach
The appraisal methodology used to assess the costs and benefits of measures to improve water bodies to good status, which feeds into the baseline and proposed options, adhere to the appraisal instructions set out in the Treasury Green Book and supplementary guidance4.
The national appraisal methodology and tools were developed in consultation with stakeholders. They used best available information on costs and effects of actions and measures to address pressures, for example, based on Common Research Programme on Economics5 overseen by a range of stakeholder bodies, plus other research. The appraisal methodology also included consideration of ecosystem services.
The appraisals were undertaken at catchment scale and have been used to inform the design of local programmes of measures and set proposed objectives. They were then aggregated to national level to inform the impact assessment. National level evidence on measures to prevent deterioration and achieve protected area objectives has also been included.
5.1.2 Measures to prevent deterioration and achieve protected area objectives
Nationally held information about programmes of measures, costs and benefits for preventing deterioration in status and achieving protected area objectives was used. This includes the following protected areas: Natura 2000 sites (under Habitats and Birds Directives); Shellfish Waters; Bathing Waters; Drinking Water Protected Areas; nutrient sensitive areas under the Urban Waste Water Directive; and Nitrates Directive.
Costs to prevent deterioration are mainly for short term measures (2015 – 2021, projected to 2027). Water resources costs (for surface water and groundwater) and groundwater quality costs are longer term, and indicate the investment needed up to 2040 to reduce the risk of deterioration.
5.1.3 Measures to achieve water body status improvement objectives
Appraisals were undertaken which considered the costs and benefits of measures needed to improve and contribute to the restoration of all the catchments in England. These used evidence from programmes of investigations to understand why some water bodies are not meeting the default objective of good status or potential. Measures were grouped together into a bundle for appraisal and their benefits assessed in terms of the overall improvement to km (or km2) of water bodies in the catchment. Individual improvements resulting from each
4 Green Book: Appraisal and evaluation in government, HM Treasury 2013
https://www.gov.uk/government/publications/the-green-book-appraisal-and-evaluation-in-central-governent
Green Book supplementary guidance: environment, HM Treasury 2013
https://www.gov.uk/government/publications/green-book-supplementary-guidance-environment 5 http://webarchive.nationalarchives.gov.uk/20080305115859/http://www.defra.gov.uk/environment/water/wfd/economics/research.htm

10
measure were not appraised. This approach meant double counting of benefits for the same km (or km2) of water body was avoided.
Costs Information on costs of measures was obtained from a wide variety of sources including water company business plans, individual project appraisals, government published figures and the Environment Agency’s own business plans. Local costs were preferentially selected. If costs were not available locally then national values from the cost effectiveness database6 were used.
The costs associated with the rural land management sector were produced using the Cost of Agricultural Measures (CAM) tool7. This is a spreadsheet that considers 61 agricultural measures that would give a positive response to water quality pressures at a catchment scale. The measures were bundled into a number of suggested mechanisms for ease of understanding and implementation, for example, agri-environment or voluntary initiatives.
In all catchments, the most cost effective measures have been selected, for example, low cost measures were preferred against higher cost land use change. However, the effectiveness of measures at a catchment scale in reducing diffuse water pollution from agriculture is not well understood. If the less costly measures do not result in the predicted benefits, more costly land use change measures may be required in future to achieve the objectives. Therefore, whether the CAM tool or an alternative method was used, it is possible that the extent of action to achieve good status in both the baseline and proposed options may be underestimated.
Indicative/accurate costs for phosphate (P) treatment measures with limits >0.5 mg/l P have been obtained from water companies in most cases. If these were not available, estimated costs were used from the Environment Agency’s cost effectiveness database. Where P treatment measures to ≤0.5 mg/l P are needed, estimated costs have been used which have been generated by the Environment Agency8. In a minority of cases, accurate costs were available where local agreement to treat to ≤0.5 mg/l P has already been reached with water companies.
To assess the costs and benefits of long term water company investment and to help identify those sewage treatment works improvements for inclusion in the price review 2014 (PR14) national environment programme (NEP), measures to treat phosphate (P) down to 0.1 mg/l P in sewage treatment work effluent have been included in the appraisals. UKWIR National PR14 phosphorus trials will consider whether treating P to < 0.5 mg/l can be considered technically feasible in future.
Benefits In appraisals for surface waters the Environment Agency used the National Water Environment Benefit Survey (NWEBS)9 (updated for 2012 values10) willingness to pay values to estimate some of the benefits (in pounds sterling per km or km2) of improvements 6 Cost Effectiveness Database, Environment Agency 2013 7 Cost of Agricultural Measures Tool, Environment Agency 2014 8 Review of best practice in treatment and reuse / recycling of phosphorus at wastewater treatment works (Atkins for the Environment Agency). 9 The Benefits of Water Framework Directive Programmes of Measures in England and Wales, A Final Report to DEFRA re CRP Project 4b/c”, NERA Economic Consulting & Accent, November 2007
10 P. Metcalfe (2012). Update of CRP WFD Benefit Values – Economic Component. A Draft Report for the Environment Agency.
11
to the water environment from society’s perspective. NWEBS provides benefits from WFD status improvements (bad to poor, poor to moderate etc.) per km (or km2) of river, lake, estuary or coastal water affected, based on willingness to pay values which capture aesthetic, recreational and existence benefits.
For groundwater appraisals, values were transferred from previous peer-reviewed economic assessments to monetise some ecosystem service benefits11.
This method of valuation is a proportionate approach that monetises some of the benefits expected to result from applying a bundle of measures to a catchment and compares these benefits to the costs of implementing the measures.
The changes in benefits that have been monetised in this impact assessment are mainly:
• cultural and quality of life benefits, including:
o recreation, includes all recreational uses of rivers, lakes and coastal areas, for example, walking and sports such as fishing, rowing and kayaking
o aesthetic value, where people value water environments that look clean with varied wildlife
o existence value, or the value people derive from knowing that such environments exist in a healthy state, irrespective of whether they use it
• monetary benefits for the provision of freshwater from actions to improve groundwater (where significant in the qualitative and quantitative stage of the assessment)
• biodiversity benefits from agricultural environment schemes (again where significant in the qualitative and quantitative stage of the assessment)
• ecosystem service values resulting from wetland creation12
• other significant benefits such as additional output from commercial fisheries or from tourism have also been monetised
Where benefits cannot be monetised they have been captured qualitatively in an appraisal summary table for each catchment to record whether benefits or disbenefits to ecosystems services are ‘significant’, ‘noticeable but not significant’ or have ‘no net change’. These tables are based on the ecosystem services framework to assessing benefits, as specified in the Treasury’s ‘Green Book supplementary guidance: environment’. In the case where the assessment of the monetised costs and benefits of measures suggests the measures are worthwhile, monetising additional benefits would only result in the BCR and the NPV increasing, which in this process is not necessary as it will not change the final appraisal decision. However, where the results of the appraisal straddle the BCR of 1 and there are significant impacts described in the appraisal summary table which are not monetised, these can be expressed clearly alongside the monetised element of the appraisal to inform the final decision about whether the bundle of measures is likely to be justified or not.
Once the BCR has been estimated, ‘sensitivity analysis’ for each catchment appraisal was undertaken to better understand how assumptions on the key inputs affect the results and therefore how sensitive the results are to changing those assumptions. They can help highlight the significance of key assumptions and uncertainties on the results of the appraisal. The thresholds of the results were tested, for example, by doubling the benefits and halving the costs to see where the tipping point lies to ensure that no additional costs or
11Groundwater Appraisal Guidance, Environment Agency, 2013 12 Brander, L.M., R.J.G.M. Florax and J.E. Vermaat (2006) The empirics of wetland valuation: a comprehensive summary and a meta-analysis of the literature, Environmental and Resource Economics, 33:223–50.
12
benefits which may have been overlooked in the appraisal might tip the measure so that is no longer cost beneficial.
The main appraisal tool for assessing the costs and benefits of bundles of measures over a 37 year appraisal period (for both options) is designed to be both easy to use for non-economists and credible, identifying bundles of measures which are clearly cost beneficial (BCR greater than 1) and bundles of measures which are clearly not cost beneficial (BCR less than 1). If there is more than one viable bundle of measures, the bundle with the highest net present value has been recommended.
Development of baseline and proposed options The cost and benefit figures produced using the appraisal method above were collated nationally then broken down by river basin district. The costs, which were assigned to the four sector groups (see Section 5.3), were broadly allocated to the sectors whose activities cause the problem (‘polluter pays principle’), not necessarily who pays for the measures.
The baseline option is composed of all the bundles of measures, both cost beneficial and non-cost beneficial, that improve the water bodies in the catchment to good status (where this is technically feasible).
The proposed option is composed of the cost beneficial bundles of measures only. These are those bundles of measures which improve water bodies in a catchment to good status or where this wasn’t cost beneficial, the bundles of measures which improve water bodies but not necessarily all to good status.
5.2. Price base, Present Value base and time period
The price base is 2012. Costs and benefits for the baseline and proposed options are forecast over 37 years. This is 12 years, from 2015 to 2027 (cycles 2 and 3 of the WFD), plus an average asset life of 25 years (assumption of the longest surviving asset being appraised when installed late in the planning period).
The appraisals used a discount rate of 3.5% for the first 30 years and then 3% thereafter, as per Treasury Green Book guidance. The appraisal period shows the full long term impacts of the plans and continues the approach in impact assessments for the previous plans.
5.3. Sector groups
For the purpose of this impact assessment, the sectors whose activities benefit from or can impact on the quality of the water environment have been put in four groups. The groups are:
• government
• rural land management
• industry, services and infrastructure
• water industry
13
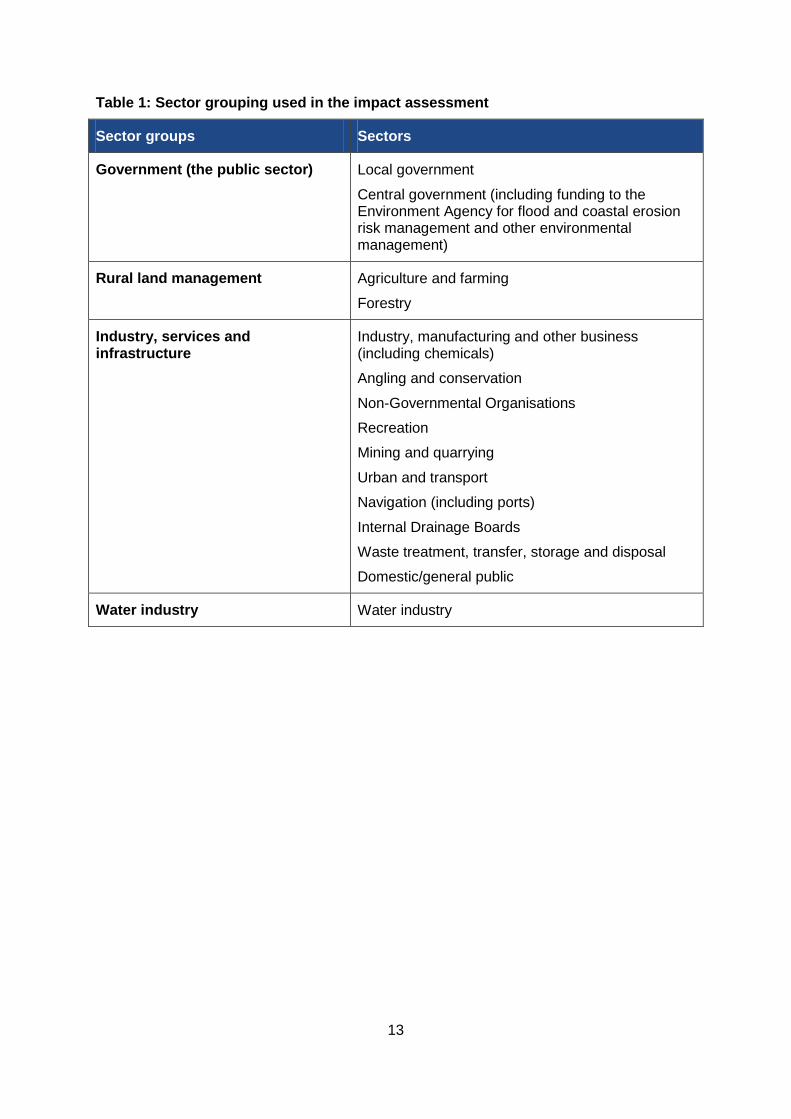
Table 1: Sector grouping used in the impact assessment
Sector groups Sectors
Government (the public sector) Local government
Central government (including funding to the Environment Agency for flood and coastal erosion risk management and other environmental management)
Rural land management Agriculture and farming
Forestry
Industry, services and infrastructure
Industry, manufacturing and other business (including chemicals)
Angling and conservation
Non-Governmental Organisations
Recreation
Mining and quarrying
Urban and transport
Navigation (including ports)
Internal Drainage Boards
Waste treatment, transfer, storage and disposal
Domestic/general public
Water industry Water industry
14
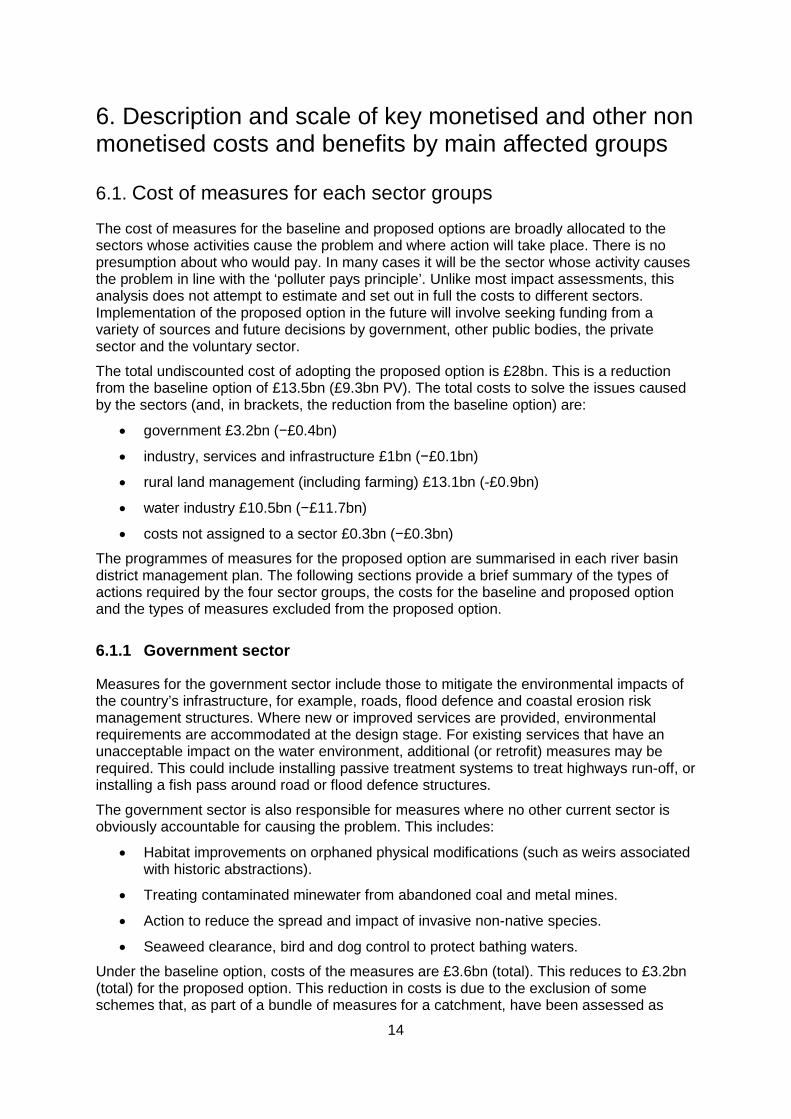
6. Description and scale of key monetised and other non monetised costs and benefits by main affected groups
6.1. Cost of measures for each sector groups
The cost of measures for the baseline and proposed options are broadly allocated to the sectors whose activities cause the problem and where action will take place. There is no presumption about who would pay. In many cases it will be the sector whose activity causes the problem in line with the ‘polluter pays principle’. Unlike most impact assessments, this analysis does not attempt to estimate and set out in full the costs to different sectors. Implementation of the proposed option in the future will involve seeking funding from a variety of sources and future decisions by government, other public bodies, the private sector and the voluntary sector.
The total undiscounted cost of adopting the proposed option is £28bn. This is a reduction from the baseline option of £13.5bn (£9.3bn PV). The total costs to solve the issues caused by the sectors (and, in brackets, the reduction from the baseline option) are:
• government £3.2bn (−£0.4bn)
• industry, services and infrastructure £1bn (−£0.1bn)
• rural land management (including farming) £13.1bn (-£0.9bn)
• water industry £10.5bn (−£11.7bn)
• costs not assigned to a sector £0.3bn (−£0.3bn)
The programmes of measures for the proposed option are summarised in each river basin district management plan. The following sections provide a brief summary of the types of actions required by the four sector groups, the costs for the baseline and proposed option and the types of measures excluded from the proposed option.
6.1.1 Government sector
Measures for the government sector include those to mitigate the environmental impacts of the country’s infrastructure, for example, roads, flood defence and coastal erosion risk management structures. Where new or improved services are provided, environmental requirements are accommodated at the design stage. For existing services that have an unacceptable impact on the water environment, additional (or retrofit) measures may be required. This could include installing passive treatment systems to treat highways run-off, or installing a fish pass around road or flood defence structures.
The government sector is also responsible for measures where no other current sector is obviously accountable for causing the problem. This includes:
• Habitat improvements on orphaned physical modifications (such as weirs associated with historic abstractions).
• Treating contaminated minewater from abandoned coal and metal mines.
• Action to reduce the spread and impact of invasive non-native species.
• Seaweed clearance, bird and dog control to protect bathing waters.
Under the baseline option, costs of the measures are £3.6bn (total). This reduces to £3.2bn (total) for the proposed option. This reduction in costs is due to the exclusion of some schemes that, as part of a bundle of measures for a catchment, have been assessed as
15
likely to be disproportionately expensive. These include some schemes for habitat improvement and to ease fish passage.
6.1.2 Industry, services and infrastructure
This sector group covers a wide range of activities, requiring a similarly large range of measures to mitigate their impact. The activities and types of measures include:
• Industry – improve effluent treatment plants, improve the efficiency of water use, and improve general housekeeping to reduce contamination of surface water drains.
• Urban/domestic – improve private sewerage systems, misconnections, septic tanks and private sewage treatment plans. Use of sustainable urban drainage systems to reduce pollution from roads and general urban areas.
• Waste treatment, transfer, storage and disposal – improve leachate management at problem sites by improving collection and treatment systems or off-site disposal. Improve general housekeeping to reduce contamination of surface water drains.
• Ports and navigation – review and if necessary improve dredging plans, install fish passes around physical modifications (for example, locks on navigable rivers) and, where the legitimate use is not compromised, mitigate other environmental impacts of physical modifications.
Under the baseline option, costs of the measures described above are £1.1bn (total). This reduces to £1bn (total) for the proposed option. This reduction in costs is due to the exclusion of some schemes that, as part of a bundle of measures for a catchment, have been assessed as likely to be disproportionately expensive. These include some schemes to ease fish passage and to improve private sewage treatment works.
6.1.3 Rural land management measures
Measures for the rural land management sector are to protect water resources and the water environment. Measures include:
• improved soil management to reduce the loss of soil, phosphate and nitrogen
• improved management of animal slurry/manure to reduce pollution from phosphate, nitrogen and faecal organisms
• improved use of pesticides to reduce pollution of the water environment, particularly in catchments used to supply drinking water
• reduce the amount of water abstracted from sensitive locations by using water more efficiently and greater use of on-farm storage
• prevent livestock from freely accessing watercourses, where they may cause poaching of soil and release of sediment and pollutants, particularly where there is a risk of polluting bathing waters
Under the baseline option, costs of the measures described above are £14bn (total). This reduces to £13.1bn (total) for the proposed option. Only a moderate number of measures have been rejected on the grounds of disproportionate expense – mainly some schemes to reduce diffuse rural pollution at source. Many of the measures to reduce pollution from farming require some land use change; these costs are justified by the benefits. In some cases, the measures will produce long term financial benefits for farmers.

16
6.1.4 Water Industry
Measures for the water industry sector include:
• improving sewerage systems and sewage treatment works to reduce the amount of pollution (ammonia, organic material, phosphate, nitrogen, faecal organisms, metals, and other toxic chemicals) discharges to the water environment
• reducing the amount of water abstracted from sensitive locations by taking water from alternative locations and/or by reducing demand for water
• reducing the number of sewerage misconnections
• installing fish passes around the physical modifications (abstraction weirs and reservoirs) they own
Under the baseline option, costs of the measures are £22.2bn (total). This reduces to £10.5bn (total) for the proposed option. Many of the measures that are rejected on the grounds of disproportionate expense include additional improvements to sewage treatment works to remove ammonia and phosphate. Some proposed schemes that would reduce the quantity of water abstracted have also been rejected.
The majority of measures that have been excluded from the proposed option are for this sector. This is because of the high cost of improving sewage treatment works (many to the current limit of technology) and the high cost of changing patterns of water abstraction. In many cases, the rejected measures would have improved relatively small stretches of river resulting in few additional benefits.
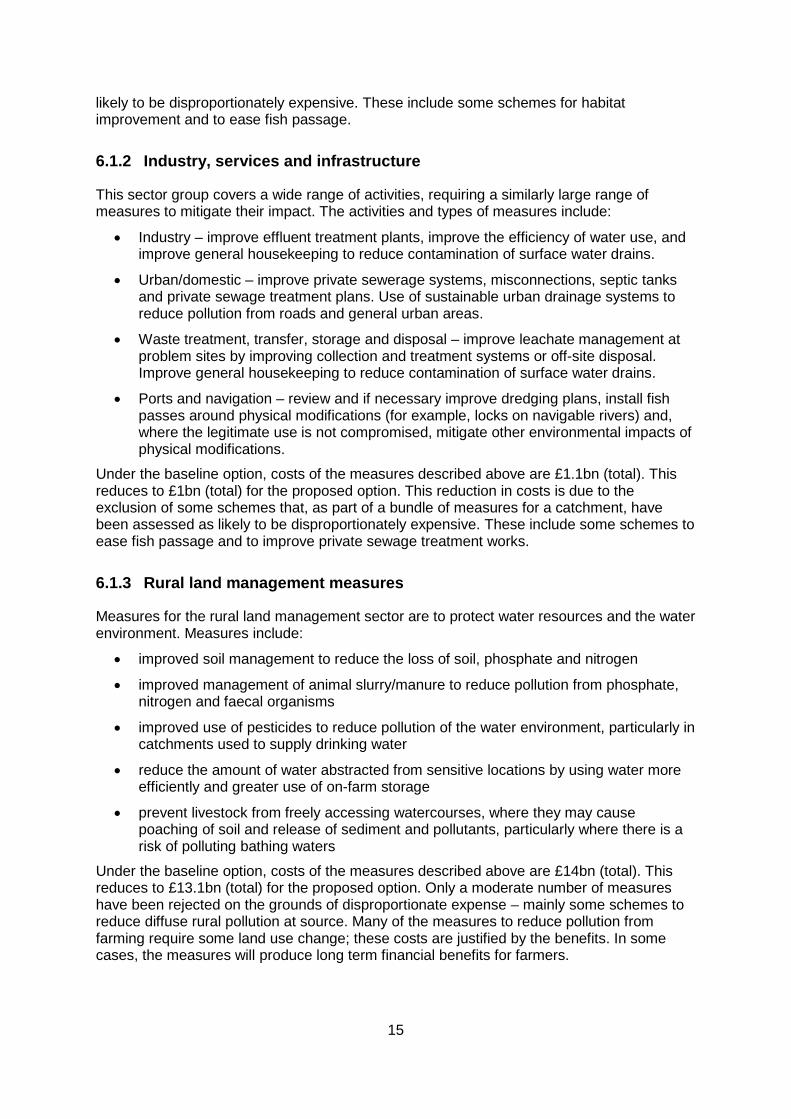
6.2. Who pays for the measures
The cost of measures for the baseline and proposed options are broadly allocated to the sectors whose activities cause the problem. However, beyond the known funding to 2021 (see Section 6.5), no decision has been made on where the costs will fall.
Table 2 summarises the main groups who generally pay for measures to resolve the problems caused by the main sector groups.
17
Table 2: Main sector groups and who pay for measures
Sector group causing or responsible for the
problem
Main groups who pay for measures
Government
Polluter pays Ongoing activities – tax payers
Beneficiary pays
Voluntary group funding for habitat improvements on orphaned assets
Government pays Where no sector is responsible – tax payers
Industry, services, and infrastructure
Polluter pays Operators
Beneficiary pays Developers
Government pays Grants to voluntary groups and service providers
Rural land management
Polluter pays Farmers and growers. Pesticide manufacturers and suppliers
Beneficiary pays
Water companies where it reduces their overall operating costs, for example, water companies’ catchment schemes mainly in drinking water protected areas
Government pays Subsidies under the EU Common Agricultural Policy
Water industry
Polluter pays Water company’s domestic and business customers.
Beneficiary pays Not applicable
Government pays
For South West Water only, government contributes £50 per customer per year to household water bills
Voluntary groups also undertake measures paid for by their members, general fundraising and grants from government, the European Union, Heritage Lottery fund, and private companies. This is generally for issues caused by the rural land management sector or where no sector is responsible or can be made responsible (for example, historic industry).
For measures that address the environmental objectives in the plans, water company customers will save the most money if the proposed option is adopted.
6.3. Benefits of protecting the environment
The main policy objective of the proposed option is to optimise the provision of goods and services provided by the water environment. The plans aim to achieve this by preventing deterioration, protecting areas that have special uses (for example, for bathing or drinking water supply) and, where it is cost beneficial, improving the wider water environment towards 'good status'. The intended effects of this objective are more naturally functioning catchments that are resilient to flood and drought, safeguard water supplies used by people and the economy, and provide a rich biodiversity that is part of England's natural heritage.
18
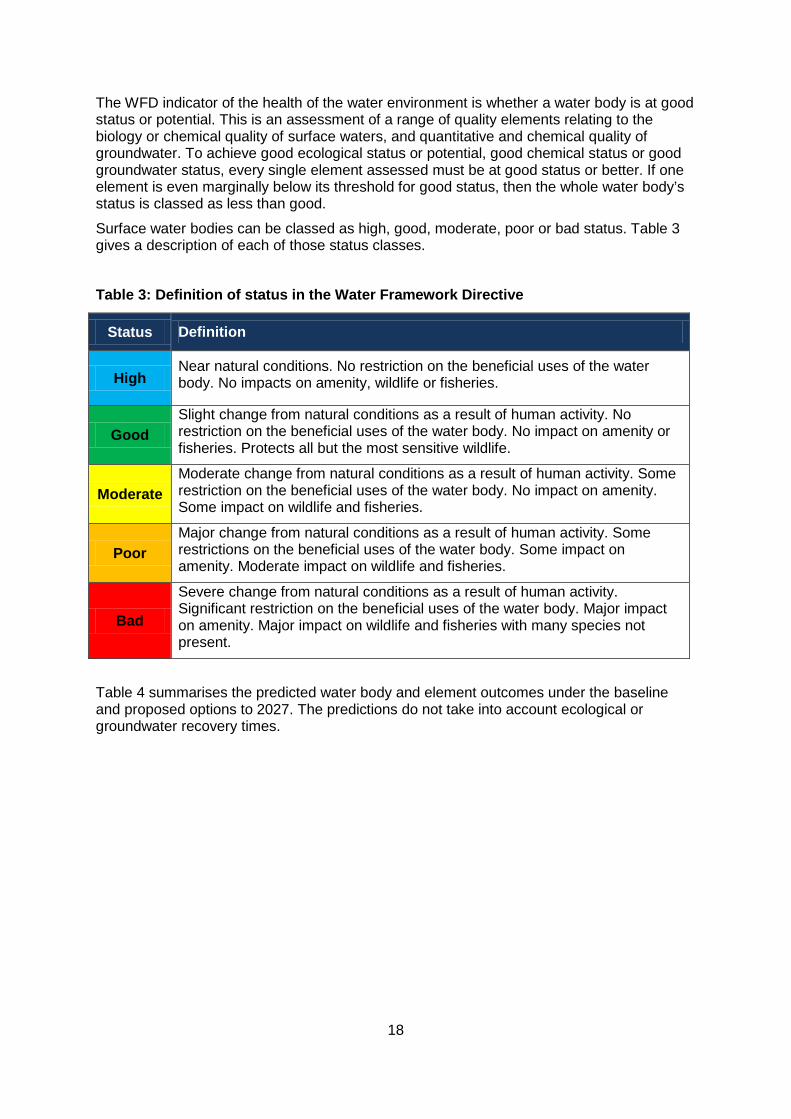
The WFD indicator of the health of the water environment is whether a water body is at good status or potential. This is an assessment of a range of quality elements relating to the biology or chemical quality of surface waters, and quantitative and chemical quality of groundwater. To achieve good ecological status or potential, good chemical status or good groundwater status, every single element assessed must be at good status or better. If one element is even marginally below its threshold for good status, then the whole water body’s status is classed as less than good.
Surface water bodies can be classed as high, good, moderate, poor or bad status. Table 3 gives a description of each of those status classes.
Table 3: Definition of status in the Water Framework Directive
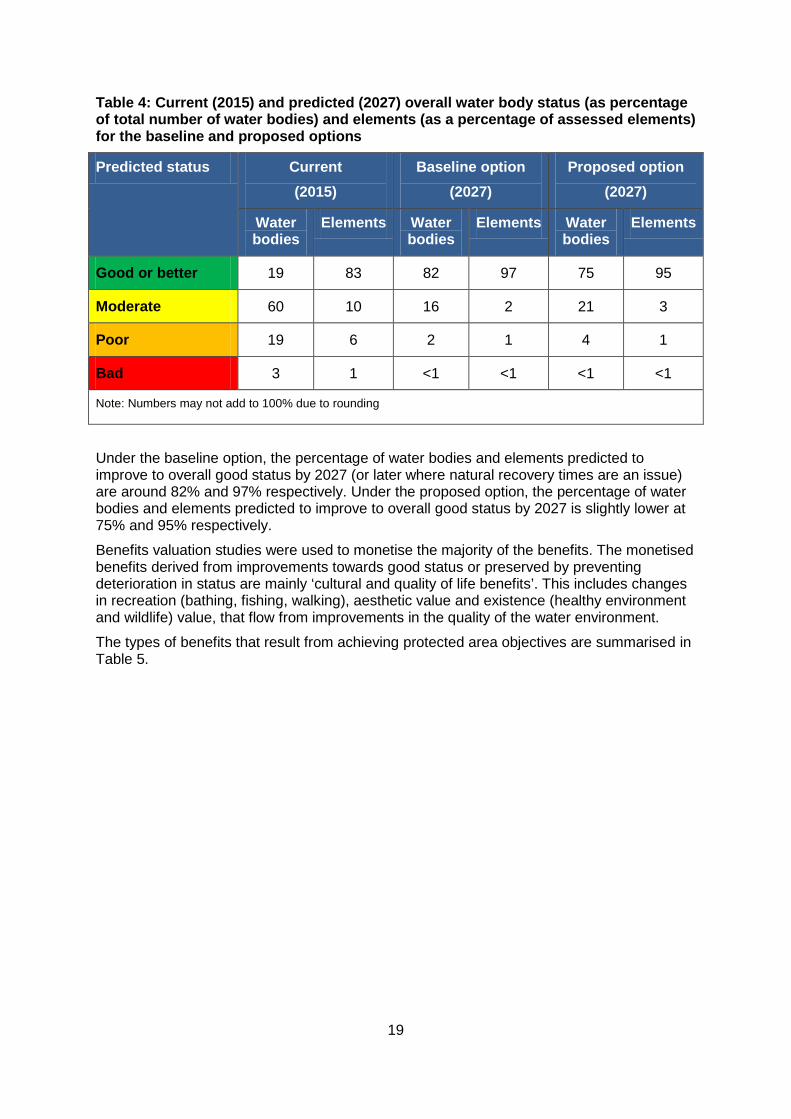
Table 4 summarises the predicted water body and element outcomes under the baseline and proposed options to 2027. The predictions do not take into account ecological or groundwater recovery times.
Status Definition
High Near natural conditions. No restriction on the beneficial uses of the water body. No impacts on amenity, wildlife or fisheries.
Good Slight change from natural conditions as a result of human activity. No restriction on the beneficial uses of the water body. No impact on amenity or fisheries. Protects all but the most sensitive wildlife.
Moderate Moderate change from natural conditions as a result of human activity. Some restriction on the beneficial uses of the water body. No impact on amenity. Some impact on wildlife and fisheries.
Poor Major change from natural conditions as a result of human activity. Some restrictions on the beneficial uses of the water body. Some impact on amenity. Moderate impact on wildlife and fisheries.
Bad
Severe change from natural conditions as a result of human activity. Significant restriction on the beneficial uses of the water body. Major impact on amenity. Major impact on wildlife and fisheries with many species not present.
19
Table 4: Current (2015) and predicted (2027) overall water body status (as percentage of total number of water bodies) and elements (as a percentage of assessed elements) for the baseline and proposed options
Predicted status Current (2015)
Baseline option (2027)
Proposed option (2027)
Water bodies
Elements Water bodies
Elements Water bodies
Elements
Good or better 19 83 82 97 75 95
Moderate 60 10 16 2 21 3
Poor 19 6 2 1 4 1
Bad 3 1 <1 <1 <1 <1
Note: Numbers may not add to 100% due to rounding
Under the baseline option, the percentage of water bodies and elements predicted to improve to overall good status by 2027 (or later where natural recovery times are an issue) are around 82% and 97% respectively. Under the proposed option, the percentage of water bodies and elements predicted to improve to overall good status by 2027 is slightly lower at 75% and 95% respectively.
Benefits valuation studies were used to monetise the majority of the benefits. The monetised benefits derived from improvements towards good status or preserved by preventing deterioration in status are mainly ‘cultural and quality of life benefits’. This includes changes in recreation (bathing, fishing, walking), aesthetic value and existence (healthy environment and wildlife) value, that flow from improvements in the quality of the water environment.
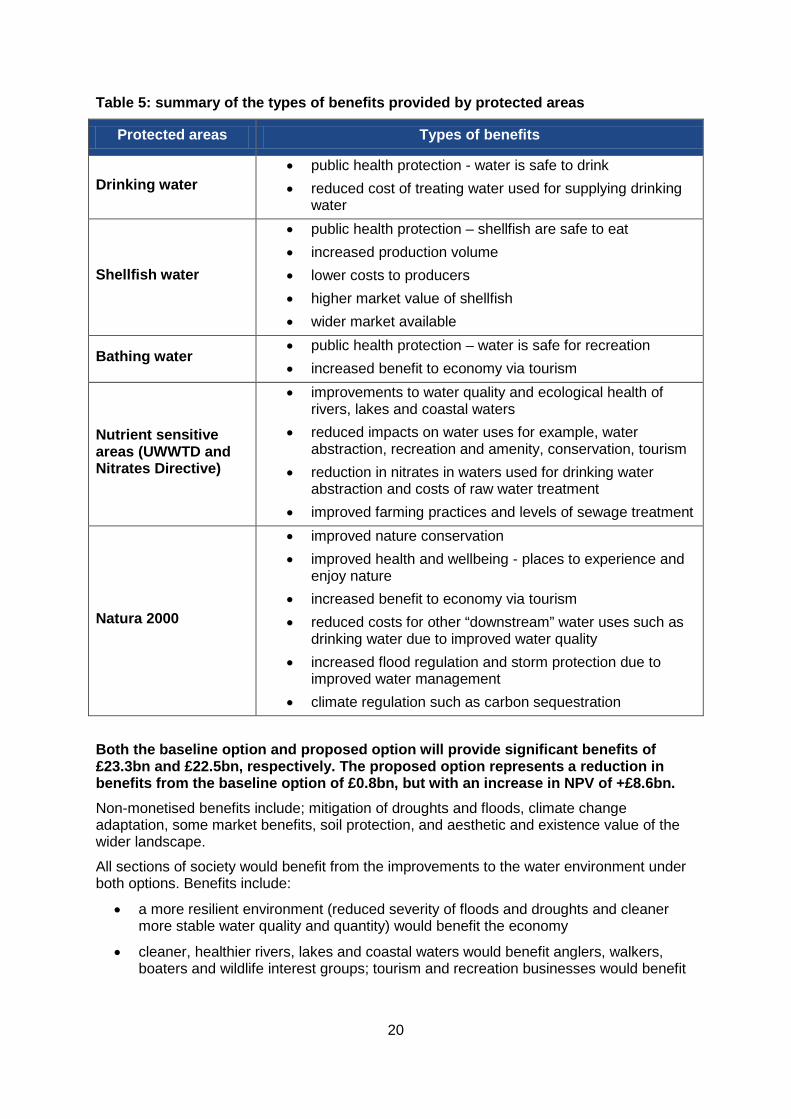
The types of benefits that result from achieving protected area objectives are summarised in Table 5.
20
Table 5: summary of the types of benefits provided by protected areas
Protected areas Types of benefits
Drinking water • public health protection - water is safe to drink • reduced cost of treating water used for supplying drinking
water
Shellfish water
• public health protection – shellfish are safe to eat • increased production volume • lower costs to producers • higher market value of shellfish • wider market available
Bathing water • public health protection – water is safe for recreation • increased benefit to economy via tourism
Nutrient sensitive areas (UWWTD and Nitrates Directive)
• improvements to water quality and ecological health of rivers, lakes and coastal waters
• reduced impacts on water uses for example, water abstraction, recreation and amenity, conservation, tourism
• reduction in nitrates in waters used for drinking water abstraction and costs of raw water treatment
• improved farming practices and levels of sewage treatment
Natura 2000
• improved nature conservation • improved health and wellbeing - places to experience and
enjoy nature • increased benefit to economy via tourism • reduced costs for other “downstream” water uses such as
drinking water due to improved water quality • increased flood regulation and storm protection due to
improved water management • climate regulation such as carbon sequestration
Both the baseline option and proposed option will provide significant benefits of £23.3bn and £22.5bn, respectively. The proposed option represents a reduction in benefits from the baseline option of £0.8bn, but with an increase in NPV of +£8.6bn. Non-monetised benefits include; mitigation of droughts and floods, climate change adaptation, some market benefits, soil protection, and aesthetic and existence value of the wider landscape.
All sections of society would benefit from the improvements to the water environment under both options. Benefits include:
• a more resilient environment (reduced severity of floods and droughts and cleaner more stable water quality and quantity) would benefit the economy
• cleaner, healthier rivers, lakes and coastal waters would benefit anglers, walkers, boaters and wildlife interest groups; tourism and recreation businesses would benefit

21
• improved quality and quantity of surface water and groundwater in the environment would benefit businesses that abstract water for drinking water supply, agriculture, aquaculture and manufacturing
• people’s welfare would increase from knowing that the water environment exists in a healthy state, irrespective of whether they use it
6.4. Monetised costs and benefits for the main components of the baseline and proposed options
The baseline and proposed options consist of actions to achieve the environmental objectives of the WFD. The main three sets of objectives are:
• to prevent deterioration of the status of surface waters and groundwater
• to achieve objectives and standards for protected areas
• to aim to achieve good status for all water bodies or, for heavily modified water bodies and artificial water bodies, good ecological potential, and good surface water chemical status
For preventing deterioration and achieving protected area objectives, the baseline option and proposed option are the same. For the third set of objectives (aim to achieve good status), certain and specific exemptions may be applied. For both the baseline and proposed options, exemptions for natural conditions and technical feasibility have been applied. For the proposed option, an additional exemption of disproportionate expense has been applied. Adopting the proposed option will therefore require a decision to set some less stringent objectives (less stringent than good status) on the grounds of disproportionate expense.
The following sections summarises the costs and benefits of the baseline and proposed options for the overall programme and for each of the three main sets of environmental objectives, with the exception of surface water chemical status. Chemicals are discussed in section 8.
6.4.1 Overall programme
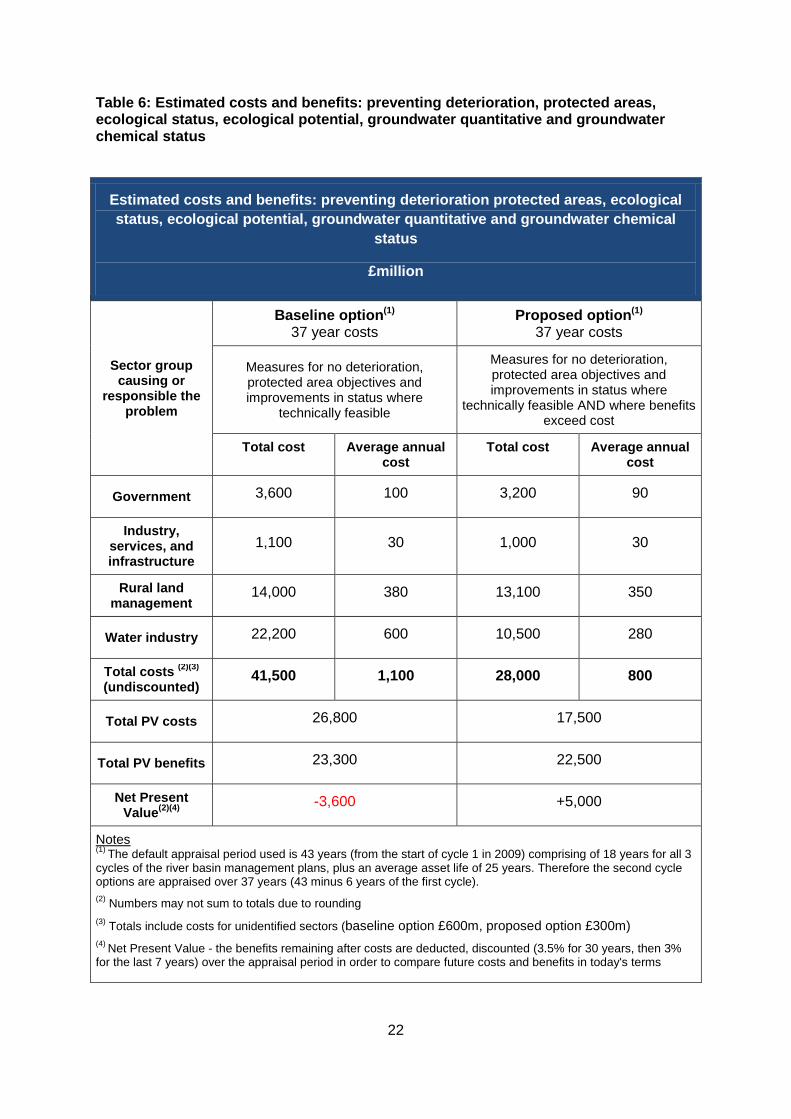
The estimated monetised costs for each sector group where action will take place and overall benefits for the baseline and proposed options are given in Table 6. This table includes the costs and benefits of preventing deterioration, achieving protected area objectives and achieving water body status objectives.
22
Table 6: Estimated costs and benefits: preventing deterioration, protected areas, ecological status, ecological potential, groundwater quantitative and groundwater chemical status
Estimated costs and benefits: preventing deterioration protected areas, ecological status, ecological potential, groundwater quantitative and groundwater chemical
status
£million
Sector group causing or
responsible the problem
Baseline option(1)
37 year costs Proposed option(1)
37 year costs
Measures for no deterioration, protected area objectives and improvements in status where
technically feasible
Measures for no deterioration, protected area objectives and improvements in status where
technically feasible AND where benefits exceed cost
Total cost Average annual cost
Total cost Average annual cost
Government 3,600 100 3,200 90
Industry, services, and infrastructure
1,100 30 1,000 30
Rural land management
14,000 380 13,100 350
Water industry 22,200 600 10,500 280
Total costs (2)(3) (undiscounted)
41,500 1,100 28,000 800
Total PV costs 26,800 17,500
Total PV benefits 23,300 22,500
Net Present Value(2)(4)
-3,600 +5,000
Notes (1) The default appraisal period used is 43 years (from the start of cycle 1 in 2009) comprising of 18 years for all 3 cycles of the river basin management plans, plus an average asset life of 25 years. Therefore the second cycle options are appraised over 37 years (43 minus 6 years of the first cycle). (2) Numbers may not sum to totals due to rounding (3) Totals include costs for unidentified sectors (baseline option £600m, proposed option £300m) (4) Net Present Value - the benefits remaining after costs are deducted, discounted (3.5% for 30 years, then 3% for the last 7 years) over the appraisal period in order to compare future costs and benefits in today's terms
23
The total PV benefits of adopting the proposed option are £22.5bn. This represents a reduction in benefits from the baseline option of £0.8bn, but an increase in NPV of +£8.6bn.
Measures to achieve chemical status objectives are not included in this appraisal, because of the current high uncertainty in scale and cost of the measures if they were implemented. Some abandoned metal mine schemes have been included, where detailed cost benefit appraisal is possible, and their costs and benefits are included in the impact assessment in relation to achieving ecological status objectives.
6.4.2 Preventing deterioration
The costs and benefits of preventing deterioration are the same for the baseline and proposed options to ensure legal compliance, as they are not subject to any exemptions.
The estimated costs and benefits of additional measures (additional to the existing policy framework described in Section 2.3) to prevent the deterioration of the status of water bodies is given in Table 7. Additional measures include:
• tightening of limits in existing permits (discharge to and abstraction of water)
• action to slow the spread of invasive non-native species
• action to reduce the inputs of nitrate to groundwater from agricultural sources
Over half the cost for preventing deterioration are linked to the water industry; of these, costs relating to proposed action on abstraction and flow and action on water quality pressures are similar in scale.

24
Table 7: Estimated costs and benefits of preventing deterioration
Estimated costs and benefits: preventing deterioration (for baseline and proposed options)
£million
Sector group causing or responsible the problem
Preventing deterioration 37 year costs(1)
Total cost Average annual cost
Government 30 <1
Industry, services, and infrastructure 3 <1
Rural land management 1,400 40
Water industry 1,810 50
Total costs(2) (undiscounted) 3,100 80
Total PV costs 2,100
Total PV benefits 4,900
Net Present Value(2)(3) +2,800
Notes (1) The default appraisal period used is 43 years (from the start of cycle 1 in 2009) comprising of 18 years for all 3 cycles of the river basin management plans, plus an average asset life of 25 years. Therefore the second cycle options are appraised over 37 years (43 minus 6 years of the first cycle). (2) Numbers may not sum to totals due to rounding. (3) Net Present Value - the benefits remaining after costs are deducted, discounted (3.5% for 30 years, then 3% for the last 7 years) over the appraisal period in order to compare future costs and benefits in today's terms.
6.4.3 Achieving protected area objectives
The costs and benefits of achieving protected area objectives are the same for the baseline and proposed options. They are set out in Table 8.

25
Table 8: Estimated costs and benefits of achieving protected area objectives
Estimated costs and benefits: of achieving protected areas objectives (for baseline and proposed option)
£million
Sector group causing or
responsible the problem
Protected area Total 37 year costs(1)(2)
Drinking water
Shellfish Bathing Nutrient sensitive
areas (UWWTD and
Nitrates Directive)
Natura 2000
Government 0 0 30 0 320
Industry, services, and infrastructure
0 0 20 0 40
Rural land management
1,580 1,810 650 0 3,350
Water industry 0 270 660 60 910
Total costs(3) (undiscounted)
1,600 2,100 1,400 100 4,600
Total PV costs 900 1,300 900 40 2,900
Total PV benefits 900 200 800 <1 3,700
Net Present Value(3)(4)
0 -1,100 -100 -40 +800
Notes (1) The default appraisal period used is 43 years (from the start of cycle 1 in 2009) comprising of 18 years for all 3 cycles of the river basin management plans, plus an average asset life of 25 years. Therefore the second cycle options are appraised over 37 years (43 minus 6 years of the first cycle). (2) Known costs and benefit data used for period 2015 – 2027. Post 2027 costs and benefits are extrapolated using different assumptions for each sector. Post 2027 annual:
• Government sector costs: 5% of the average annual cost from 2015 to 2027
• Industry, services and infrastructure sector costs: £0
• Rural land management costs: 100% of the average annual cost from 2015 - 2027
• Water industry sector costs: used known figures
• Benefits for all sectors are 100% of the average annual benefits figure from 2015 - 2027 for each sector (3) Numbers may not sum to totals due to rounding. (4) The benefits remaining after costs are deducted, discounted (3.5% for 30 years, then 3% for the last 7 years) over the appraisal period in order to compare future costs and benefits in today's terms.
26
To achieve protected area objectives, the cost of measures to resolve pressures arising from rural land management is higher than the cost of measures to resolve water industry issues. This difference reflects the fact that over the last 20 years the water industry has greatly reduced the impact of its activities on protected areas. Changes in technology and the requirements of protected areas may mean that additional improvements by the water industry are needed after 2021. Protected area costs for the water industry may therefore be underestimated.
For action to achieve Natura 2000, drinking water and bathing water protected area objectives, costs and benefits are broadly balanced. The marginal NPVs (slightly positive and negative) are within estimation errors.
For shellfish waters, costs are over 5 times the benefits, therefore there appears to be a limited economic case for wide scale additional improvements. However, there may be a case for improving some shellfish waters in some areas.
Installing nutrient removal at qualifying sewage treatment works in or upstream of Urban Waste Water Treatment Directive (UWWTD) nutrient sensitive areas is a basic requirement. However, from the simple assessment of benefits used in this study there is only a limited economic case for these improvements.
6.4.4 Achieving water body status objectives
For water body status objectives certain and specific exemptions may be applied. For both the baseline and proposed options, exemptions for natural conditions and technical feasibility have been applied. For the proposed option, an additional exemption of disproportionate expense has been applied. Adopting the proposed option will therefore require a decision to set some less stringent objectives (less stringent than good status) on the grounds of disproportionate expense. This section summarises the evidence to support that decision.
The estimated monetised costs for each sector group where action will take place and overall benefits for the baseline and proposed options are given in Table 9. This table includes just the costs and benefits of the additional action to achieve water body status objectives (it does not include the costs and benefits of measures to prevent deterioration and achieve protected area objectives). It also lists examples of the types of schemes which in some catchments have been excluded on the grounds of disproportionate expense.

27
Table 9: Estimated costs and benefits: ecological status, ecological potential, groundwater quantitative and groundwater chemical status (not including preventing deterioration or protected area costs and benefits)
Estimated costs and benefits: ecological status, ecological potential, groundwater quantitative and groundwater chemical status. Does not include preventing
deterioration or protected area costs and benefits £million (37 years)
Sector group causing or
responsible the problem
Baseline option(1)
Total cost
Proposed option(1)
Total cost
Total cost of
excluded measures
Examples of the types of schemes excluded on the grounds of disproportionate expense
Government 3,600 3,100 500
• improvement to condition of channel/bed and/or banks/shoreline, increase in-channel morphological diversity
• removal or easement of barriers to fish migration, enable fish passage (for example, fish pass)
Industry, services, and infrastructure
1,100 1,000 100 • removal or easement of barriers to fish
migration, enable fish passage (for example, fish pass)
• improve private sewage treatment works
Rural land management
5,800 4,800 1,000 • reduce diffuse rural pollution at source
Water industry 20,500 7,600 12,900 • improve sewage treatment works
Total costs (2)(3) (undiscounted)
31,600 16,800 14,800
Total PV costs 20,800 10,500 10,300
Total PV benefits 14,300 13,400 900
Net Present Value(2)(4)
-6,600 +2,900 -9,400
Notes (1) The default appraisal period used is 43 years (from the start of cycle 1 in 2009) comprising of 18 years for all 3 cycles of the river basin management plans, plus an average asset life of 25 years. Therefore the second cycle options are appraised over 37 years (43 minus 6 years of the first cycle). (2) Numbers may not sum to totals due to rounding. (3) Totals include costs for unidentified sectors (baseline option £600m, proposed option £300m) (4) Net Present Value - the benefits remaining after costs are deducted, discounted (3.5% for 30 years, then 3% for the last 7 years) over the appraisal period in order to compare future costs and benefits in today's terms.
The WFD allows disproportionate expense to be considered when setting water body objectives. The baseline option therefore goes beyond the minimum requirements of the WFD by not fully taking into account the disproportionate expense exemption.
The cost of the measures that have been excluded is £10.3bn (PV). The loss of benefits that would have resulted from the excluded measures is £0.9bn (PV). The results show that there
28
is good evidence to justify setting less stringent objectives on the grounds of disproportionate expense.
Under the proposed option, around 75% of waters could reach good status or potential by 2027 (or later where natural recovery times are an issue). Around 95% of the individual elements measured across all water bodies could reach good status. However, what is affordable in the long term and therefore what can be achieved will be reviewed by government when the plans are updated again in 2021.
6.5. Proposed option: 2015 to 2021 phase
The assessment for the first 6 year phase (2015 to 2021) of the proposed option is based on programmes of measures with known and reasonably secure funding sources. This section therefore represents a summary of the impacts of previous decisions on funding.
6.5.1 Main programmes of measures: 2015 to 2021
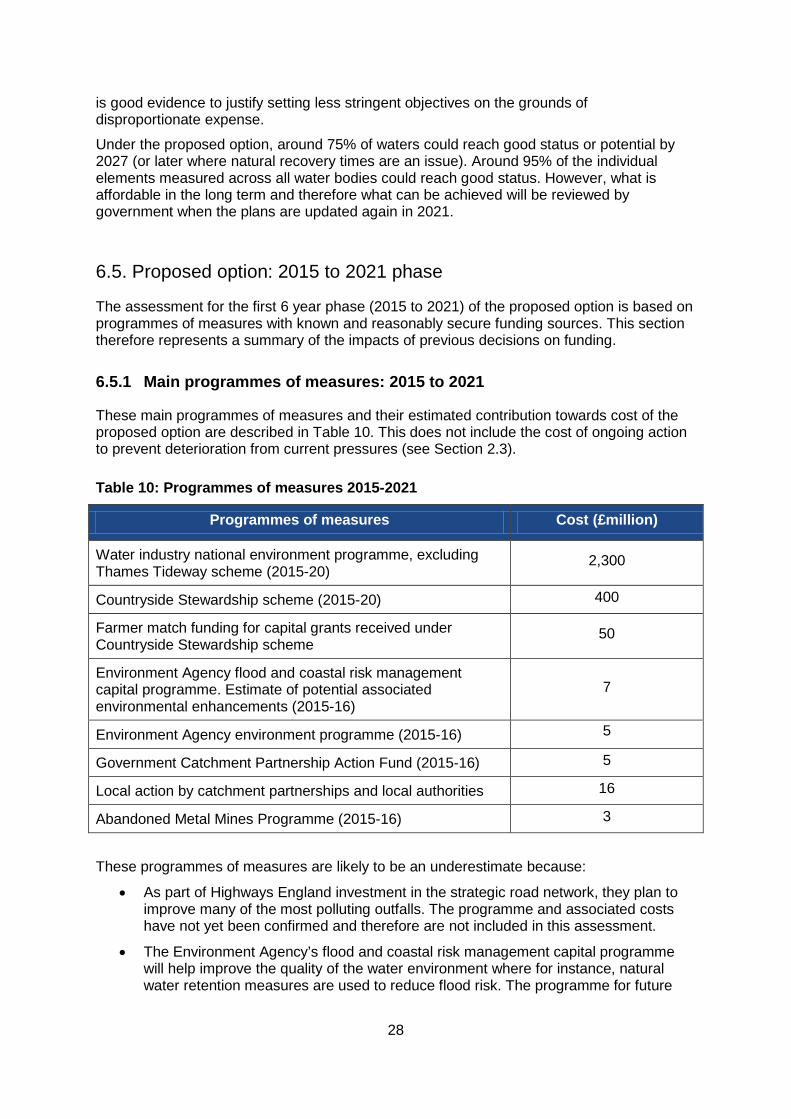
These main programmes of measures and their estimated contribution towards cost of the proposed option are described in Table 10. This does not include the cost of ongoing action to prevent deterioration from current pressures (see Section 2.3).
Table 10: Programmes of measures 2015-2021
Programmes of measures Cost (£million)
Water industry national environment programme, excluding Thames Tideway scheme (2015-20)
2,300
Countryside Stewardship scheme (2015-20) 400
Farmer match funding for capital grants received under Countryside Stewardship scheme
50
Environment Agency flood and coastal risk management capital programme. Estimate of potential associated environmental enhancements (2015-16)
7
Environment Agency environment programme (2015-16) 5
Government Catchment Partnership Action Fund (2015-16) 5
Local action by catchment partnerships and local authorities 16
Abandoned Metal Mines Programme (2015-16) 3
These programmes of measures are likely to be an underestimate because:
• As part of Highways England investment in the strategic road network, they plan to improve many of the most polluting outfalls. The programme and associated costs have not yet been confirmed and therefore are not included in this assessment.
• The Environment Agency’s flood and coastal risk management capital programme will help improve the quality of the water environment where for instance, natural water retention measures are used to reduce flood risk. The programme for future

29
financial years (post April 2016) has not yet been confirmed and is therefore not included in this assessment.
• The Thames Tideway and Lee tunnel schemes in London will improve the quality of the water environment. They are not included in this assessment because their primary purpose is to provide sewerage infrastructure under the Urban Waste Water Treatment Directive.
The total undiscounted cost of known programmes of measures between 2015 and 2021 is £3.6bn. This includes the estimated cost of operating measures (for instance, operating improved sewage treatment works) beyond 2021.
6.5.2 Benefits that arise from programmes of measures: 2015 to 2021
The 2015 to 2021 phase of the proposed option will produce similar types of benefits to those described in section 6.3.
Predicted changes in the status of each water body by 2021 are based on the main programmes of measures where there was confidence that:
• measures will happen by 2021
• the location of the measures and the water bodies that will benefit are known
• changes in element status will occur as a result of the measures
Confidence in this context means there is at least a reasonable expectation (more confident than not) that the measures will happen and the outcome will be met.
By 2021, 3% of water bodies are predicted to improve to good or high overall status, with around 1% of elements improving to good or high status. A more detailed set of predictions are given in Table 11. This equates to 178 water bodies predicted to improve to good or high status by 2021, with 546 elements improving to good or high status.
Where the details of programmes of measures are not yet known (for instance the type and location of measures under Countryside Stewardship) or confirmed (for instance the Environment Agency’s flood and coastal risk management programme after 2016) their impacts have not been included in the predicted changes in water body status. As these measures are implemented, further improvements in water body status will result.
Table 11: Current (2015) and predicted (2021) overall water body status (as percentage of total number of water bodies) and elements (as a percentage of assessed elements) for the 2015 to 2021 phase of the proposed option
Predicted status Current (2015) Proposed option (2021)
Predicted change
Water bodies
Elements Water bodies
Elements Water bodies
Elements
Good or better 19 83 22 84 +3 +1
Moderate 60 10 60 10 0 0
Poor 19 6 16 5 -3 -1
Bad 3 1 2 1 -1 0
Note: Numbers may not add to 100% due to rounding

30
The known programmes of measures will result in some improvements to most protected areas, with many of them reaching their ultimate objective by 2021. Extended deadlines to 2027 have been applied to 98 Natura 2000 and 57 shellfish water protected areas for reasons of technical feasibility and/or disproportionate expense.
Planned action by water companies will prevent deterioration being caused by increased pressure on their assets as a result of population growth. Additional measures (not currently in funded programmes of measures) will be required to reduce the risk of deterioration caused by invasive non-native species and nitrates from diffuse agricultural sources.
The costs and benefits for each sector group and the funding sources for the proposed option for the period 2015 to 2021 are shown in Table 12. This includes an estimate of benefits resulting from measures under Countryside Stewardship.

31
Table 12: Estimated costs and benefits 2015-2021: protected areas, ecological status, ecological potential, groundwater quantitative and groundwater chemical status
Proposed option: 2015 to 2021 phase £million (37 years)
Sector group causing or
responsible for the problem
Total cost (£m)
Average annual
cost (£m)
Funding sources
Government 100 2
Polluter pays Government funding for infrastructure schemes (Environment Agency, Highways England)
Beneficiary pays Voluntary group funding for habitat improvements on orphaned assets
Government pays
Government funding for habitat improvements on orphaned assets and mine water remediation
Industry, services, and infrastructure 20 <1
Polluter pays
Industry funding for dealing with water quality improvements (drainage, misconnections, treatment measures) and habitat improvements on business owned assets
Beneficiary pays Voluntary group funding for habitat improvement
Government pays Not applicable
Rural land management 500(1) 10
Polluter pays Farmers
Beneficiary pays Water company’s catchment schemes mainly in drinking water protected areas. Voluntary groups
Government pays
Payments to farmers and other land managers under the Countryside Stewardship scheme
Water industry 3,000 80
Polluter pays Water company’s domestic and business customers
Beneficiary pays Not applicable
Government pays
For South West Water only, government contributes £50 per customer per year to household water bills
Total costs (undiscounted) 3,600 100
Notes: (1) the RLM costs are based on a range of £430m-£520m due to different scenarios of cost allocation. The midpoint is presented here to be consistent with other costs
Total PV costs 3,000
Total PV benefits 5,800
Net Present Value +2,800 The water industry (funded by their customers) will continue to make the largest investment and the fastest progress towards mitigating the damage their activities have on the water environment. Ofwat’s 2015 review of water company price limits took account of this level of investment.

32
Most of the cost of action to address problems in the rural land management sector is met by government (for example, via Countryside Stewardship scheme funding), with some also being borne by the water industry (for example, via paying for advice to farmers and incentives to change land management practices). The rest is paid for by farmers where they pay 50% of costs when in receipt of a capital grant under the Countryside Stewardship scheme to deliver environmental improvements.
Following the completion of the measures planned for 2015 to 2021, there will still be a significant amount of action required to achieve the environmental objectives in the river basin management plans by 2027. The water industry is broadly on track to deliver their fair share of improvements. For all other sectors a significant increase in the rate of improvement would be required. The review of the updated plans in 2021 will consider whether the environmental objectives are still appropriate and how to implement the improvements required.
6.6. Other key non-monetised costs and benefits
Non monetised costs
The costs have been monetised for achieving protected area, no deterioration, ecological status, ecological potential, groundwater quantitative and groundwater chemical status objectives.
Most potential future costs and associated benefits for achieving status objectives, by reducing the levels of toxic chemicals in discharges from sewage treatment works and managing urban diffuse pollution, have not been included because of large uncertainties in the scale of action that might be required and the cost of such action. This is explained further in Section 8.
Total costs of the baseline option may be underestimated, as some measures with potentially large costs were excluded from the catchment scale appraisals because they would clearly have resulted in little benefit. For instance, measures to achieve dissolved inorganic nitrogen standards in coastal waters were excluded, where the biology, sensitive to increased level of nutrients, is already at good status. Such measures would not have been included in the proposed option as they are clearly not beneficial.
The costs and benefits of government’s proposal to bring previously exempt abstractions into regulatory control (new authorisations) are not included in this impact assessment. The costs and benefits of new authorisations are being prepared in a separate impact assessment, and represent policy proposals of placing currently exempt abstractors in a similar position to licensed abstractors and meeting WFD’s basic measure of prior authorisation and control of abstraction. Doing this will enable a fairer distribution of abstractor costs. Current estimates of the net costs of the new authorisations programme range from about £50m to £120m (preferred option, net present value costs for England only, excluding administrative costs). These estimates cover the impact over 25 years on economic output, for example additional costs of investing in mitigating technology, reduction in abstraction volume or changing location. The majority of these costs are likely to occur in the rural land management sector and in the industry, services and infrastructure sector.
Non monetised benefits Benefits valuation studies were used to monetise the benefits. Non-monetised benefits include; mitigation of droughts and floods, climate change adaptation, some market benefits, soil protection, and aesthetic and existence value of the wider landscape. The benefits of protecting some wildlife sites of national and international importance were not fully monetised.
33
In the detailed catchment appraisals on which this impact assessment is based, where benefits could not be monetised, a qualitative assessment was recorded in an appraisal summary table. These tables are based on the ecosystem services framework to assessing benefits in the recently updated Treasury ‘Green Book supplementary guidance: environment’. Where the monetised assessment had a BCR of 0.5 to 1 and significant non-monetised benefits were identified, additional work was undertaken to identify additional monetised benefits or assess whether the scale of non-monetised benefits was sufficient to alter the choice of measures and environmental objectives.
A potential positive improvement in climate regulation and adaptation benefits under the proposed option is predicted in 30% of catchments but in general not at any significant scale; 7% are considered to have no net change (the minor positive impacts were predicted to be similar to the minor negative impacts) and less than 1% are predicted to have a negative impact. In the remaining 62% of catchments the impacts on climate regulation were considered negligible. However, it is acknowledged that there will be variable levels of effects at a more local scale as programmes of measures are implemented and that more consideration of information available on risks would be required.
Habitat creation and restoration works by environmental non-governmental organisations (NGOs), such as those included in the proposed option, have the potential to create or improve carbon sinks through wetlands, peatlands and woodland planting.
6.7. Comparison with previous impact assessments and the 2014 economic analysis
See Annex A for a comparison with previous impact assessments and Annex B for changes made to the economic analysis following the consultation in 2014.

34
7. Business assessment
7.1. Direct impact on business
Not applicable as this impact assessment does not include new regulation or additional burdens on business.
7.2. Small and Micro Business Assessment (SaMBA)
Not applicable as this impact assessment does not include new regulation or additional burdens on business.
7.3. Impacts on greenhouse gas emissions, climate regulation and adaptation
The Environment Agency used its Strategic Environmental Assessment to assess the potential effects of the plan. The results, including an assessment of carbon impacts, are reported in an Environmental Report that accompanied the consultation on the updated river basin management plans. The Environmental Report considered the likely effects in catchments of a potential range of long-term and justified measures without specific knowledge of their implementation detail or timescales. A summary of these benefits is in Section 6.6 (Non-monetised benefits).
Studies to learn more about the effects of climate change on the water environment are also underway. In the meantime, it makes sense to implement measures that are flexible or increase resilience to extreme weather events and future warming.
Risk assessments are used to help identify significant water management issues by identifying where pressures could change in the future, potentially leading to deterioration or reducing the effectiveness of measures to meet their objectives. The Environment Agency has reviewed and where necessary updated, the risk assessments since the 2009 plan.
Climate change has been taken into account in the design of the programmes of measures:
• For most significant investment programmes, such as water company investment, climate change adaptation and mitigation is a key consideration in the design and planning of projects, taking into account the most up-to-date scenarios for a changing climate at the time of implementation.
• For less significant projects, a flexible step-by-step approach to install measures that are capable of being adapted or extended as required in the future is more appropriate. Where there is a choice of potential solutions, climate change resilience is a factor in decision making.
• Measures resulting from the long-term environmental plans, such as water resources management plans and flood risk management plans include consideration of climate change in their assessment of actions to be taken.

35
8. Risks and Assumptions
8.1. Chemicals
Measures to achieve chemical status objectives are not included in this appraisal. This is because of the current high uncertainty in scale and potential cost of the measures that might be required. The exception to this is for some abandoned metal mine schemes where detailed cost benefit appraisal is possible, and their costs and benefits are included in the impact assessment in relation to achieving ecological status objectives.
In the 2015 status classification about 3% of water bodies fail good chemical status (driven by cadmium, lead, nickel, tributyltin and mercury) and about 2% fail specific pollutant standards which contribute to failure of good ecological status (mostly zinc and copper).
The main sources of chemicals are from abandoned metal mines, urban run-off and waste water treatment works (which receive chemical inputs from a variety of sources, including trade effluent, domestic and diffuse urban sources).
The Water and Abandoned Metal Mines programme was set up by Defra in partnership with the Coal Authority and the Environment Agency to begin to address metal pollution from minewaters where nobody could be identified to be liable. The three existing minewater schemes have total undiscounted costs of around £20 million. The estimated costs of cleaning up further water pollution from abandoned metal mines to achieve protected area objectives and to achieve improvement objectives (where cost beneficial) are just under £145 million (PV) over the appraisal period.
Highways England, the government company that manages motorways and major A roads, will invest about £300m to reduce flooding and environmental impacts from the existing strategic road network over the next 5 years. A proportion of this will address pollution from highway run-off through a programme targeted at surface water outfalls and soakaways, using measures, principally SuDS (‘sustainable drainage systems’, for example, swales and retention ponds), to reduce sediment and associated metal pollution.
Evidence is starting to emerge that there could be significant challenges in meeting Environment Quality Standards (EQS) for some substances such as mercury and some flame retardants that accumulate in food chains. The use of these substances is already highly restricted, but past use means that some of these continue to enter sewage treatment works. While sewage treatment works are already quite effective at removing many of these substances, more may need to be done to meet the EQS for these substances in the future, for example through investment in advanced sewage treatment.
Work is continuing to improve the understanding of the risks of these substances during this planning cycle to enable well informed decisions, for example through a programme that water companies are undertaking to investigate 600 wastewater effluents. A proportion of these should be completed in time to inform any capital investment needs for the Asset Management Plan 7 (AMP7) period between 2020 and 2025, depending on the planning timetable and approach adopted. Any additional investment required for the remaining wastewater treatment works that is not included in AMP7 would have to be considered in the subsequent water industry asset management process.
Estimating the potential costs of any water industry programme beyond 2019 would be speculative. The best overall site specific options going forward will depend on the treatment already in place and also on other harmful chemicals being discharged, which may include new substances introduced at EU level for the next planning cycle. Due to the potential costs and impact on water customers’ bills, any investment decisions on waste water treatment will be subject to further cost and benefit assessments as part of the water industry asset

36
management process, and will inform the update of the river basin management plans in 2021.
8.2. Appraisal assumptions
Assumptions have been applied to the appraisal process and the assessment of costs and benefits. The most significant assumptions and associated risks are summarised below.
Benefit cost ratio – The assumption that a benefit cost ratio of one or greater determines justified measures is used in the assessment of a bundle of measures in catchment appraisals. This is because the benefits in the catchment appraisals are not the maximum societal benefits possible for that catchment but they represent benefits from the best combination of the measures considered. Monetary estimates of benefits of the measures are likely to be conservative, as not all of the improvements in ecosystem services have been captured in monetary terms. National Water Environment Benefits Survey (NWEBS)13 willingness to pay values are used in the cost-benefit analysis. These values were peer reviewed in 2012/13, and it was suggested that they capture the majority of benefits from general water environment improvements. However, the extent to which they do this is dependent on the type of measure. For example, for river restoration / wetland type improvements, the benefits are likely to be an underestimate as flood, carbon and terrestrial biodiversity benefits may not be included. By contrast, for measures to facilitate fish migration, the NWEBS values are likely to be a reasonably complete estimate.
Risk of failure – Expert judgement is used to estimate the risk of measures failing to meet their intended environmental improvement outcome. To take risk of failure into account, benefits were reduced in the catchment appraisals by typically 30% depending on the type of action. However, due to the lack of data on effectiveness of water environment measures derived from post-project evaluations, there is a risk that the benefit reductions are not appropriate. To reduce this risk, the catchment appraisals included sensitivity testing.
Appraisal period – The appraisal period used informs the length of time that the costs and benefits are assessed. An appraisal period of 37 years (2015 - 2052) has been used in this impact assessment. The Treasury Green Book advises that the useful life of the longest living asset should set the appraisal time period. However, in some cases, either the lifetime of the longest living asset is unknown or there is no clear cut lifetime when an asset is removed. The default appraisal period used is 43 years (from the start of cycle 1 in 2009) comprising of 18 years for all 3 cycles of the river basin management plans, plus an average asset life of 25 years.
13 The main method of monetising benefits used was the values supplied by the National Water Environment Benefits Survey (NWEBS) which cover aesthetic, recreational and existence values: P.Metcalfe (2012). Non-market valuation using stated preferences: Applications in the water sector, Thesis submitted to the Dept.of Geography and Environment, the London School of Economics & Political Science.
37
9. Conclusions
This assessment has demonstrated that continuing to protect and improve the services provided by the water environment creates significant economic benefits. However, the measures and objectives in the current river basin management plans are sub-optimal and need updating.
The proposed updates to the river basin management plans (the proposed option) make full and appropriate use of the exemptions to the environmental objectives of the WFD. This includes setting less stringent objectives (less stringent than good status) on the grounds of disproportionate expense. Rejecting the baseline option and adopting the proposed option will reduce costs by £9.3bn (PV) with only a small loss of benefits (-£0.8bn PV).
The cost of measures for the baseline and proposed options are broadly allocated to the sectors whose activities cause the problem and where action will take place. There is no presumption about who would pay. In many cases, it will be the sector whose activity causes the problem in line with the ‘polluter pays principle’. However, unlike most impact assessments, this analysis does not attempt to estimate and set out in full the costs to different sectors. Implementation of the proposed option in the future will involve seeking funding from a variety of sources and future decisions by government, other public bodies, the private sector and the voluntary sector.
The total undiscounted cost of adopting the proposed option is £28bn. This is a reduction from the baseline option of £13.5bn (£9.3bn PV). The total costs to solve the issues caused by the sectors (and, in brackets, the reduction from baseline) are:
• government £3.2bn (−£0.4bn)
• industry, services and infrastructure £1bn (−£0.1bn)
• rural land management (including farming) £13.1bn (-£0.9bn)
• water industry £10.5bn (−£11.7bn)
• costs not assigned to a sector £0.3bn (−£0.3bn)
Around £3bn of funding has already been secured to make progress towards realising the benefits in the proposed option by 2021. Investment by water companies and their customers continue to make a significant contribution. This commitment was included in Ofwat’s 2015 determination of water company price limits. The government’s Countryside Stewardship scheme will also make a significant contribution to improving the services provided by the water environment.
The improvements already planned for the period to 2021 have a significantly higher benefit-cost ratio than that of the proposed option as a whole.

38
ANNEX A: Comparison of the estimates of costs and benefits of previous impact assessments Defra published an update in 2007 of the initial impact assessment that accompanied the transposition of the WFD in 2003 (Overall Impact Assessment for the Water Framework Directive (2000/60/EC), adopted by the European Union Council and European Parliament on December 2000). Option 2 (phased approach) of this impact assessment made use of objectives with extended deadlines (to 2027) and 25% less stringent objectives. This option most closely matches the proposed option in this impact assessment.
An impact assessment was also produced in 2009 for the first cycle river basin management plans. The 2009 impact assessment is not directly comparable with this impact assessment as the costs and benefits for the 2009 plan were calculated only for the first cycle, and the figures didn't include the baseline of existing legislation, as this was included under a separate assessment (the 'reference case').
A comparison of the costs and benefits of option 2 from the 2007 impact assessment and the proposed option from this impact assessment is shown in Table A1. Option 2 of the 2007 impact assessment did not include measures to prevent deterioration and some protected area costs.
Table A1: Comparison of 2007 updated WFD transposition impact assessment and this 2015 impact assessment
Impact assessment Option and appraisal period
Costs PV £m
Benefits PV £m
2007 updated WFD transposition
(price base: 2007)
Option 2 phased
43 years
(2009-2052)
20,645 20,645
2015 updated river basin management
plans (price base: 2012)
Proposed option
37 years
(2015-2052)
17,500 22,500
Once the cost of measures implemented between 2009 and 2015 have been taken into account, the costs and benefits of the proposed option are similar to those estimated in 2007.
Table A2 compares the predicted percentage of water bodies to be at good or better status by 2027 under the proposed policy options set out in the 2007 updated WFD transposition impact assessment and this 2015 impact assessment.

39
Table A2: Overall water body status comparison under the 2007 updated WFD transposition impact assessment and this 2015 impact assessment
Impact assessment Water bodies at good or better (%)
2007 updated WFD transposition (Option 2 phased)
27% in 2009
(baseline)
99% by 2027
(predicted)
2015 updated river basin management plans (proposed option)
19% in 2015
(baseline)
75% by 2027
(predicted)
The difference in baselines suggests that the water environment is now worse than in 2009; this is far from the case. The latest results reflect a much better understanding of the true state of the water environment, as they are based on an expanded ecological monitoring network, improved evaluation techniques and better environmental standards.
The difference in the amount of water bodies predicted to be at good or better status by 2027 is a result of a more comprehensive assessment of the measures required to reach good status including whether those measures are technically feasible and, from the catchment economic appraisals, whether they are justified by the costs and benefits. In the first cycle plans only 5 water bodies in England (all groundwater bodies) were set an objective of less than good status (a less stringent objective) on the grounds of technical infeasibility. All other water bodies were given an objective of reaching good status by 2015 or 2027. The improved assessments for second cycle plans have identified that reaching good status for a larger proportion of water bodies is technically infeasible or disproportionately expensive.
The Environment Agency published an economic analysis as part of the draft update to the river basin management plans consultation in 2014. Annex B summarises the changes made to the economic analysis following the consultation.
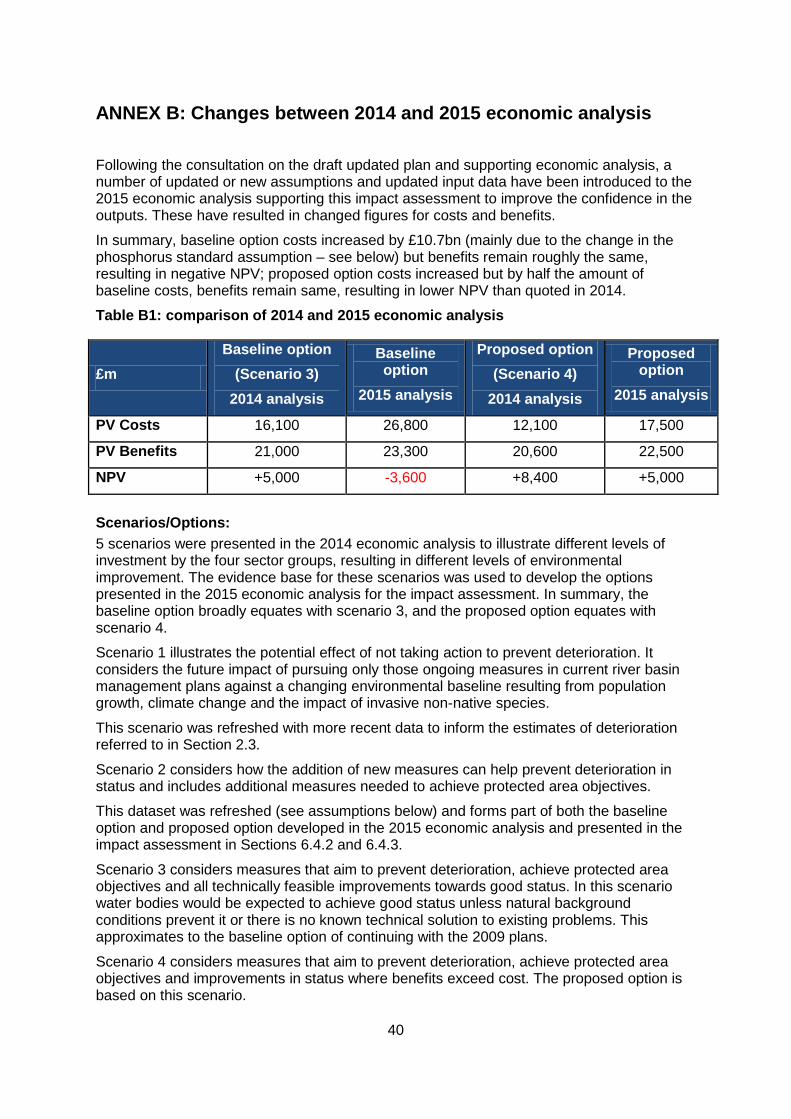
40
ANNEX B: Changes between 2014 and 2015 economic analysis
Following the consultation on the draft updated plan and supporting economic analysis, a number of updated or new assumptions and updated input data have been introduced to the 2015 economic analysis supporting this impact assessment to improve the confidence in the outputs. These have resulted in changed figures for costs and benefits.
In summary, baseline option costs increased by £10.7bn (mainly due to the change in the phosphorus standard assumption – see below) but benefits remain roughly the same, resulting in negative NPV; proposed option costs increased but by half the amount of baseline costs, benefits remain same, resulting in lower NPV than quoted in 2014.
Table B1: comparison of 2014 and 2015 economic analysis
£m Baseline option
(Scenario 3) 2014 analysis
Baseline option
2015 analysis
Proposed option (Scenario 4)
2014 analysis
Proposed option
2015 analysis
PV Costs 16,100 26,800 12,100 17,500
PV Benefits 21,000 23,300 20,600 22,500
NPV +5,000 -3,600 +8,400 +5,000
Scenarios/Options: 5 scenarios were presented in the 2014 economic analysis to illustrate different levels of investment by the four sector groups, resulting in different levels of environmental improvement. The evidence base for these scenarios was used to develop the options presented in the 2015 economic analysis for the impact assessment. In summary, the baseline option broadly equates with scenario 3, and the proposed option equates with scenario 4.
Scenario 1 illustrates the potential effect of not taking action to prevent deterioration. It considers the future impact of pursuing only those ongoing measures in current river basin management plans against a changing environmental baseline resulting from population growth, climate change and the impact of invasive non-native species.
This scenario was refreshed with more recent data to inform the estimates of deterioration referred to in Section 2.3.
Scenario 2 considers how the addition of new measures can help prevent deterioration in status and includes additional measures needed to achieve protected area objectives.
This dataset was refreshed (see assumptions below) and forms part of both the baseline option and proposed option developed in the 2015 economic analysis and presented in the impact assessment in Sections 6.4.2 and 6.4.3.
Scenario 3 considers measures that aim to prevent deterioration, achieve protected area objectives and all technically feasible improvements towards good status. In this scenario water bodies would be expected to achieve good status unless natural background conditions prevent it or there is no known technical solution to existing problems. This approximates to the baseline option of continuing with the 2009 plans.
Scenario 4 considers measures that aim to prevent deterioration, achieve protected area objectives and improvements in status where benefits exceed cost. The proposed option is based on this scenario.
41
Scenario 5 was a modelled illustration of cost and benefits based on assumed funding. The 6 year 2015-2021 phase of the proposed option, in the 2015 economic analysis for this impact assessment, is based on known and reasonably secure funding for measures and predicted outcomes.
Summary of improved analyses:
Improvement measures
Catchment appraisals – Over 85% of catchment appraisals have been updated leading to a changed outcome in terms of BCR, NPV and the bundle of measures proposed for catchments. This is due to a new classification baseline, more recent investigation results, water body network changes and revised planning assumptions, most significantly, the phosphorus standards (see below).
Phosphorus standards – proposed new UKTAG standards for phosphorus have now been adopted. So that longer term water industry planning could be undertaken to minimise the risk of abortive investment, all phosphorus (P) measures including those down to 0.1 mg/l P limits have been assessed in the catchment economic appraisals. This is a change from the 2014 economic analysis where P measures down to 0.5 mg/l P only were assessed in appraisals. Consequently the cost of measures to reduce nutrients in catchments has increased affecting the results of catchment economic appraisals. In many cases, the bundle of measures to get water bodies to good status, which included these more stringent permit limit measures, were appraised as not cost beneficial and an alternative bundle has been assessed and recommended. This has resulted in increased costs in the current baseline option whilst benefits remain similar to the previous analysis. This change is significant for the water industry sector. The change will have had a significant impact on the NPV for the baseline option. The proposed option is also impacted but to a lesser degree.
Abstraction and flow measure costs – in scenario 3 of the 2014 economic analysis, the component of cost to address abstraction and flow pressures was estimated using a national model. In the baseline option of the 2015 economic analysis this component is instead based on the costs compiled from the catchment economic appraisals, in common with most other measures. The costs in the baseline have reduced and although this change could be considered important on its own, comparative to the impact of the changes from the P standards planning assumption (see above), it becomes relatively less significant overall for the water industry sector, and is likely to have had a relatively minor impact on the NPV for the baseline option.
Measures to prevent deterioration and achieve protected area objectives Bathing water benefits – a number of changes have been made to improve the evidence around bathing water benefits. The appraisal period has been adjusted from 25 years (in the 2014 economic analysis) to 37 years to be consistent with the appraisal period used for the other benefits in the 2015 economic analysis. Other changes include: fewer bathing waters included, the national benefits dataset only has been used rather than the local and national data which was used in the 2014 economic analysis, the “gap to good” is getting smaller and in some cases, the costs have been reviewed as solutions have become clearer. Benefits are reduced in both baseline and proposed options for the 2015 economic analysis. This change impacts the benefits to all sectors and is likely to have had a relatively significant impact on the NPV for the baseline and proposed options. Overall, the benefits have decreased compared to the 2014 economic analysis.
No deterioration costs – the water resources component of no deterioration costs was a gap in the 2014 economic analysis. In response to consultation feedback a more complete set of cost estimates has been developed for delivering the no deterioration objective. This has inevitably produced higher cost estimates for preventing deterioration than were
42
published in 2014. Although these can be regarded as upper estimates, they do reflect the potential costs if timely action is to be taken over the next 25 years to prevent deterioration in the water environment. The ‘prevent deterioration’ costs have therefore increased in the baseline and proposed options for the 2015 economic analysis; associated benefits are not expected to begin until 2030 onwards. This change is significant to the water industry sector particularly although additional costs are included for other sectors too. Since both cost and benefit components increase (compared to 2014 economic analysis), the impact on the NPV for the baseline and proposed options is small relative to other changes affecting the NPV.
Natura 2000 costs and benefits for cycle 3 – these were not included in the 2014 economic analysis, but are included in the 2015 economic analysis. Additional costs include remediation of a mine and some Countryside Stewardship scheme land management intervention measures. The inclusion of the cycle 3 cost and benefit data does not have a significant impact on the NPV of the baseline option as the benefits of these measures are deemed equal to the costs. However, the total cost to the government sector is increased. Costs of the Environment Agency’s mitigation programme have been reduced following the identification of a significant overlap with Natural England’s river and lake restoration programme. Overall, it is likely to have had a relatively minor impact on the NPV for the baseline option.
Benefits from Drinking Water Protected Area measures – this was a gap in the 2014 economic analysis; for the 2015 economic analysis an assumption of benefits equal costs was used. The result is that costs and benefits are broadly balanced for this protected area.
No deterioration costs for nitrate in groundwater for rural land management sector – the cost to the rural land management sector of preventing the deterioration of groundwater quality was a gap in the 2014 economic analysis. For the 2015 economic analysis a more complete set of cost estimates has been developed for delivering the no deterioration objective. This has inevitably produced higher cost estimates for preventing deterioration than were published in 2014. Although these can be regarded as upper estimates, they do reflect the potential costs if timely action is to be taken over the next 25 years to prevent deterioration in the water environment. The costs and benefits have increased in the baseline option for the 2015 economic analysis. This change is likely to have had a relatively significant impact on the NPV for the baseline option.
Costs and benefits of 2015-2021 phase of proposed option – actual data on known and secure funding, alongside predicted water body outcomes, have been used to determine the costs and benefits of 6 years of the proposed option. In the 2014 economic analysis, the costs and outcomes of 6 years of funding was modelled as an illustration only (scenario 5). In the 2015 economic analysis, the 2015-2021 phase of the proposed option is based on a realistic funding profile.
The 2014 analysis of the 6 year illustrative funding scenario was based on the ‘sector who pays’ whereas for the 2015-2021 phase of the proposed option in the 2015 analysis shows the costs of measures allocated to the 'polluting sector’. Also, we have estimated how the known funding over 6 years can be extrapolated over 37 years and estimated the benefits over 37 years, to be compatible across the economic analysis, whereas in the consultation we presented the costs and benefits over 6 years only.
The costs and therefore the benefits of some measures have uncertain outcomes in terms of the level of improvement and/or the water bodies which will improve. In cases where the outcomes could not be specified, benefits were assumed to equal the costs.
There are different cost allocation scenarios for rural land management sector measures and so a mid-point of a range (£430-520m) has been used to be consistent with other costs.

43
ANNEX C: River Basin District tables The tables in this annex show estimated costs and benefits (preventing deterioration, protected areas, ecological status, ecological potential, groundwater quantitative and groundwater chemical status) for each river basin district in England. For the cross border river basin districts, the estimates are for those parts of the district that are in England.
Anglian Dee (England) Humber North West Northumbria Severn (England) Solway Tweed (England) South East South West Thames

44
Anglian RBD
Estimated costs and benefits: preventing deterioration, protected areas, ecological status, ecological potential, groundwater quantitative and groundwater chemical
status
£million
Sector group causing or
responsible the problem
Baseline option(1)
37 year costs Proposed option(1)
37 year costs
Measures for no deterioration, protected area objectives and improvements in status where
technically feasible
Measures for no deterioration, protected area objectives and improvements in status where
technically feasible AND where benefits exceed cost
Total cost Average annual cost
Total cost Average annual cost
Government 340 10 320 10
Industry, services, and infrastructure 160 <10 140 <10
Rural land management 2,610 70 2,580 70
Water industry 4,650 130 2,010 50
Total costs (2)(3) (undiscounted) 7,840 210 5,110 140
Total PV costs 4,830 3,020
Total PV benefits 3,160 3,060
Net Present Value(2)(4) -1,670 +30
Notes (1) The default appraisal period used is 43 years (from the start of cycle 1 in 2009) comprising of 18 years for all 3 cycles of the river basin management plans, plus an average asset life of 25 years. Therefore the second cycle options are appraised over 37 years (43 minus 6 years of the first cycle). (2) Numbers may not sum to totals due to rounding (3) Totals include costs for unidentified sectors (baseline option £80m, proposed option £70m) (4) Net Present Value - the benefits remaining after costs are deducted, discounted (3.5% for 30 years, then 3% for the last 7 years) over the appraisal period in order to compare future costs and benefits in today's terms
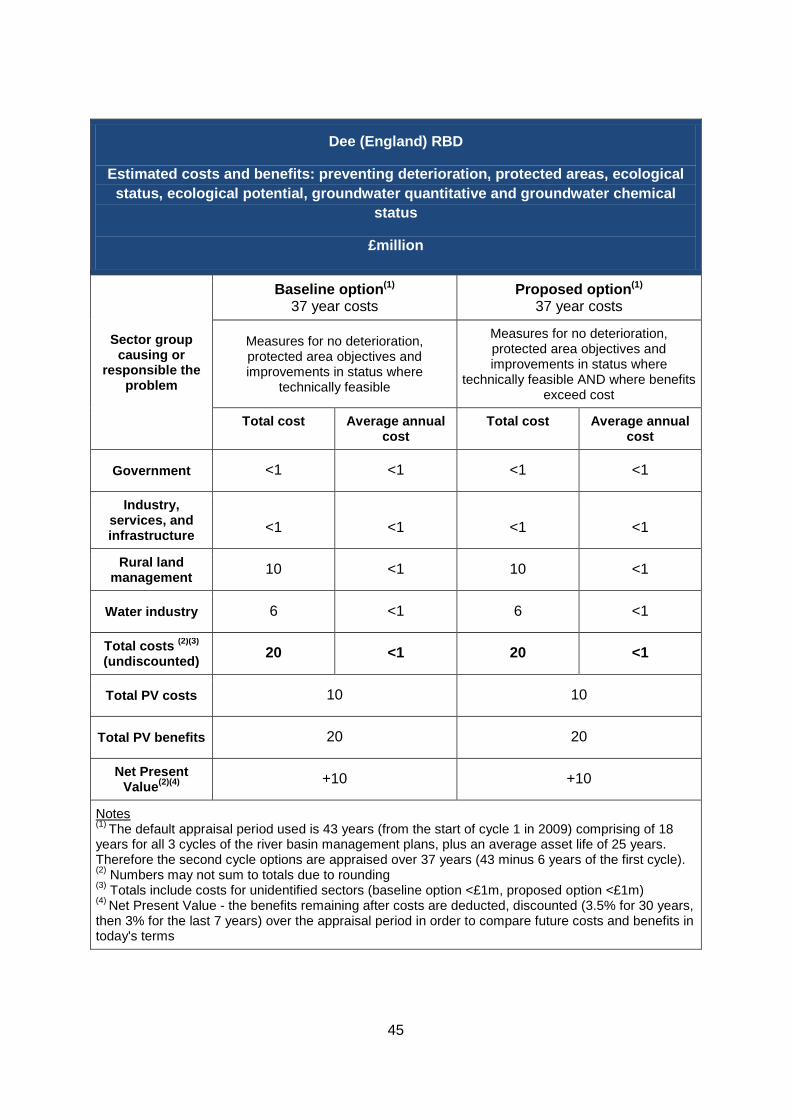
45
Dee (England) RBD
Estimated costs and benefits: preventing deterioration, protected areas, ecological status, ecological potential, groundwater quantitative and groundwater chemical
status
£million
Sector group causing or
responsible the problem
Baseline option(1)
37 year costs Proposed option(1)
37 year costs
Measures for no deterioration, protected area objectives and improvements in status where
technically feasible
Measures for no deterioration, protected area objectives and improvements in status where
technically feasible AND where benefits exceed cost
Total cost Average annual cost
Total cost Average annual cost
Government <1 <1 <1 <1
Industry, services, and infrastructure <1 <1 <1 <1
Rural land management 10 <1 10 <1
Water industry 6 <1 6 <1
Total costs (2)(3) (undiscounted) 20 <1 20 <1
Total PV costs 10 10
Total PV benefits 20 20
Net Present Value(2)(4) +10 +10
Notes (1) The default appraisal period used is 43 years (from the start of cycle 1 in 2009) comprising of 18 years for all 3 cycles of the river basin management plans, plus an average asset life of 25 years. Therefore the second cycle options are appraised over 37 years (43 minus 6 years of the first cycle). (2) Numbers may not sum to totals due to rounding (3) Totals include costs for unidentified sectors (baseline option <£1m, proposed option <£1m) (4) Net Present Value - the benefits remaining after costs are deducted, discounted (3.5% for 30 years, then 3% for the last 7 years) over the appraisal period in order to compare future costs and benefits in today's terms

46
Humber RBD
Estimated costs and benefits: preventing deterioration, protected areas, ecological status, ecological potential, groundwater quantitative and groundwater chemical
status
£million
Sector group causing or
responsible the problem
Baseline option(1)
37 year costs Proposed option(1)
37 year costs
Measures for no deterioration, protected area objectives and improvements in status where
technically feasible
Measures for no deterioration, protected area objectives and improvements in status where
technically feasible AND where benefits exceed cost
Total cost Average annual cost
Total cost Average annual cost
Government 570 20 490 10
Industry, services, and infrastructure 130 <10 140 <10
Rural land management 1,300 40 1,310 40
Water industry 2,600 70 1,270 30
Total costs (2)(3) (undiscounted) 4,620 120 3,220 90
Total PV costs 3,570 2,550
Total PV benefits 3,790 3,720
Net Present Value(2)(4) +210 +1,170
Notes (1) The default appraisal period used is 43 years (from the start of cycle 1 in 2009) comprising of 18 years for all 3 cycles of the river basin management plans, plus an average asset life of 25 years. Therefore the second cycle options are appraised over 37 years (43 minus 6 years of the first cycle). (2) Numbers may not sum to totals due to rounding (3) Totals include costs for unidentified sectors (baseline option £10m, proposed option £20m) (4) Net Present Value - the benefits remaining after costs are deducted, discounted (3.5% for 30 years, then 3% for the last 7 years) over the appraisal period in order to compare future costs and benefits in today's terms
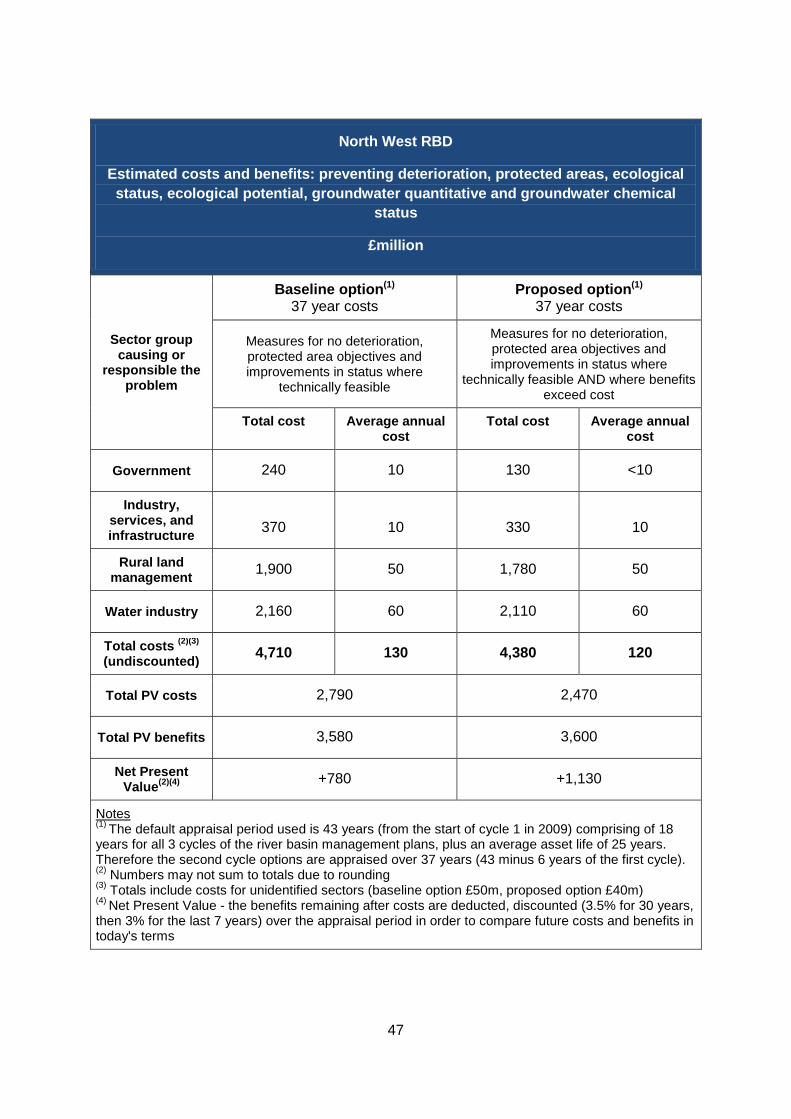
47
North West RBD
Estimated costs and benefits: preventing deterioration, protected areas, ecological status, ecological potential, groundwater quantitative and groundwater chemical
status
£million
Sector group causing or
responsible the problem
Baseline option(1)
37 year costs Proposed option(1)
37 year costs
Measures for no deterioration, protected area objectives and improvements in status where
technically feasible
Measures for no deterioration, protected area objectives and improvements in status where
technically feasible AND where benefits exceed cost
Total cost Average annual cost
Total cost Average annual cost
Government 240 10 130 <10
Industry, services, and infrastructure 370 10 330 10
Rural land management 1,900 50 1,780 50
Water industry 2,160 60 2,110 60
Total costs (2)(3) (undiscounted) 4,710 130 4,380 120
Total PV costs 2,790 2,470
Total PV benefits 3,580 3,600
Net Present Value(2)(4) +780 +1,130
Notes (1) The default appraisal period used is 43 years (from the start of cycle 1 in 2009) comprising of 18 years for all 3 cycles of the river basin management plans, plus an average asset life of 25 years. Therefore the second cycle options are appraised over 37 years (43 minus 6 years of the first cycle). (2) Numbers may not sum to totals due to rounding (3) Totals include costs for unidentified sectors (baseline option £50m, proposed option £40m) (4) Net Present Value - the benefits remaining after costs are deducted, discounted (3.5% for 30 years, then 3% for the last 7 years) over the appraisal period in order to compare future costs and benefits in today's terms

48
Northumbria RBD
Estimated costs and benefits: preventing deterioration, protected areas, ecological status, ecological potential, groundwater quantitative and groundwater chemical
status
£million
Sector group causing or
responsible the problem
Baseline option(1)
37 year costs Proposed option(1)
37 year costs
Measures for no deterioration, protected area objectives and improvements in status where
technically feasible
Measures for no deterioration, protected area objectives and improvements in status where
technically feasible AND where benefits exceed cost
Total cost Average annual cost
Total cost Average annual cost
Government 120 <10 120 <10
Industry, services, and infrastructure 70 <10 70 <10
Rural land management 190 10 190 10
Water industry 600 20 440 10
Total costs (2)(3) (undiscounted) 1000 30 820 20
Total PV costs 630 510
Total PV benefits 1,560 1,550
Net Present Value(2)(4) +930 +1,040
Notes (1) The default appraisal period used is 43 years (from the start of cycle 1 in 2009) comprising of 18 years for all 3 cycles of the river basin management plans, plus an average asset life of 25 years. Therefore the second cycle options are appraised over 37 years (43 minus 6 years of the first cycle). (2) Numbers may not sum to totals due to rounding (3) Totals include costs for unidentified sectors (baseline option £10m, proposed option £9m) (4) Net Present Value - the benefits remaining after costs are deducted, discounted (3.5% for 30 years, then 3% for the last 7 years) over the appraisal period in order to compare future costs and benefits in today's terms

49
Severn (England) RBD
Estimated costs and benefits: preventing deterioration, protected areas, ecological status, ecological potential, groundwater quantitative and groundwater chemical
status
£million
Sector group causing or
responsible the problem
Baseline option(1)
37 year costs Proposed option(1)
37 year costs
Measures for no deterioration, protected area objectives and improvements in status where
technically feasible
Measures for no deterioration, protected area objectives and improvements in status where
technically feasible AND where benefits exceed cost
Total cost Average annual cost
Total cost Average annual cost
Government 190 10 100 <10
Industry, services, and infrastructure 100 <10 60 <10
Rural land management 990 30 1,040 30
Water industry 1,060 30 560 20
Total costs (2)(3) (undiscounted) 2,370 60 1,780 50
Total PV costs 1,780 1,120
Total PV benefits 1,900 1,840
Net Present Value(2)(4) +120 +730
Notes (1) The default appraisal period used is 43 years (from the start of cycle 1 in 2009) comprising of 18 years for all 3 cycles of the river basin management plans, plus an average asset life of 25 years. Therefore the second cycle options are appraised over 37 years (43 minus 6 years of the first cycle). (2) Numbers may not sum to totals due to rounding (3) Totals include costs for unidentified sectors (baseline option £30m, proposed option £30m) (4) Net Present Value - the benefits remaining after costs are deducted, discounted (3.5% for 30 years, then 3% for the last 7 years) over the appraisal period in order to compare future costs and benefits in today's terms

50
Solway Tweed (England) RBD
Estimated costs and benefits: preventing deterioration, protected areas, ecological status, ecological potential, groundwater quantitative and groundwater chemical
status
£million
Sector group causing or
responsible the problem
Baseline option(1)
37 year costs Proposed option(1)
37 year costs
Measures for no deterioration, protected area objectives and improvements in status where
technically feasible
Measures for no deterioration, protected area objectives and improvements in status where
technically feasible AND where benefits exceed cost
Total cost Average annual cost
Total cost Average annual cost
Government 30 0 30 0
Industry, services, and infrastructure 4 0 4 0
Rural land management 630 20 630 20
Water industry 250 10 240 10
Total costs (2)(3) (undiscounted) 920 20 910 20
Total PV costs 560 560
Total PV benefits 700 700
Net Present Value(2)(4) +140 +140
Notes (1) The default appraisal period used is 43 years (from the start of cycle 1 in 2009) comprising of 18 years for all 3 cycles of the river basin management plans, plus an average asset life of 25 years. Therefore the second cycle options are appraised over 37 years (43 minus 6 years of the first cycle). (2) Numbers may not sum to totals due to rounding (3) Totals include costs for unidentified sectors (baseline option <£1m, proposed option <£1m) (4) Net Present Value - the benefits remaining after costs are deducted, discounted (3.5% for 30 years, then 3% for the last 7 years) over the appraisal period in order to compare future costs and benefits in today's terms

51
South East RBD
Estimated costs and benefits: preventing deterioration, protected areas, ecological status, ecological potential, groundwater quantitative and groundwater chemical
status
£million
Sector group causing or
responsible the problem
Baseline option(1)
37 year costs Proposed option(1)
37 year costs
Measures for no deterioration, protected area objectives and improvements in status where
technically feasible
Measures for no deterioration, protected area objectives and improvements in status where
technically feasible AND where benefits exceed cost
Total cost Average annual cost
Total cost Average annual cost
Government 260 10 260 10
Industry, services, and infrastructure 30 <1 20 <1
Rural land management 620 20 620 20
Water industry 810 20 620 20
Total costs (2)(3) (undiscounted) 1,730 50 1,520 40
Total PV costs 1,120 960
Total PV benefits 1,400 1,390
Net Present Value(2)(4) +290 +430
Notes (1) The default appraisal period used is 43 years (from the start of cycle 1 in 2009) comprising of 18 years for all 3 cycles of the river basin management plans, plus an average asset life of 25 years. Therefore the second cycle options are appraised over 37 years (43 minus 6 years of the first cycle). (2) Numbers may not sum to totals due to rounding (3) Totals include costs for unidentified sectors (baseline option £3m, proposed option £3m) (4) Net Present Value - the benefits remaining after costs are deducted, discounted (3.5% for 30 years, then 3% for the last 7 years) over the appraisal period in order to compare future costs and benefits in today's terms

52
South West RBD
Estimated costs and benefits: preventing deterioration, protected areas, ecological status, ecological potential, groundwater quantitative and groundwater chemical
status
£million
Sector group causing or
responsible the problem
Baseline option(1)
37 year costs Proposed option(1)
37 year costs
Measures for no deterioration, protected area objectives and improvements in status where
technically feasible
Measures for no deterioration, protected area objectives and improvements in status where
technically feasible AND where benefits exceed cost
Total cost Average annual cost
Total cost Average annual cost
Government 420 10 450 10
Industry, services, and infrastructure 40 <10 40 <10
Rural land management 4,290 120 3,600 100
Water industry 1,580 40 1,300 40
Total costs (2)(3) (undiscounted) 6,350 170 5,410 150
Total PV costs 3,590 2,990
Total PV benefits 2,920 2,690
Net Present Value(2)(4) -680 -290
Notes (1) The default appraisal period used is 43 years (from the start of cycle 1 in 2009) comprising of 18 years for all 3 cycles of the river basin management plans, plus an average asset life of 25 years. Therefore the second cycle options are appraised over 37 years (43 minus 6 years of the first cycle). (2) Numbers may not sum to totals due to rounding (3) Totals include costs for unidentified sectors (baseline option £20m, proposed option £20m) (4) Net Present Value - the benefits remaining after costs are deducted, discounted (3.5% for 30 years, then 3% for the last 7 years) over the appraisal period in order to compare future costs and benefits in today's terms

53
Thames RBD
Estimated costs and benefits: preventing deterioration, protected areas, ecological status, ecological potential, groundwater quantitative and groundwater chemical
status
£million
Sector group causing or
responsible the problem
Baseline option(1)
37 year costs Proposed option(1)
37 year costs
Measures for no deterioration, protected area objectives and improvements in status where
technically feasible
Measures for no deterioration, protected area objectives and improvements in status where
technically feasible AND where benefits exceed cost
Total cost Average annual cost
Total cost Average annual cost
Government 1,430 40 1,270 30
Industry, services, and infrastructure 170 <10 130 <10
Rural land management 1,470 40 1,350 40
Water industry 8,430 230 1,990 50
Total costs (2)(3) (undiscounted) 11,900 320 4,900 130
Total PV costs 7,940 3,300
Total PV benefits 4,250 3,940
Net Present Value(2)(4) -3,690 640
Notes (1) The default appraisal period used is 43 years (from the start of cycle 1 in 2009) comprising of 18 years for all 3 cycles of the river basin management plans, plus an average asset life of 25 years. Therefore the second cycle options are appraised over 37 years (43 minus 6 years of the first cycle). (2) Numbers may not sum to totals due to rounding (3) Totals include costs for unidentified sectors (baseline option £390m, proposed option £170m) (4) Net Present Value - the benefits remaining after costs are deducted, discounted (3.5% for 30 years, then 3% for the last 7 years) over the appraisal period in order to compare future costs and benefits in today's terms