impact assessment of biomass burning on air … · impact assessment of biomass burning on air...
TRANSCRIPT

Impact assessment of biomass burning on air quality in Southeast and East Asiaduring BASE-ASIA
Kan Huang a, Joshua S. Fu a,b,*, N. Christina Hsu c, Yang Gao a, Xinyi Dong a, Si-Chee Tsay c, Yun Fat Lam a
aDepartment of Civil and Environmental Engineering, The University of Tennessee, Knoxville, TN, USAbUTK-ORNL Center for Interdisciplinary Research and Graduate Education, Knoxville, TN, USAcGoddard Space Flight Center, NASA, Greenbelt, MD, USA
a r t i c l e i n f o
Article history:Received 5 October 2011Received in revised form13 March 2012Accepted 17 March 2012
Keywords:Biomass burningSoutheast AsiaCMAQLong-range transportAerosol chemical propertyAerosol optical property
a b s t r a c t
A synergy of numerical simulation, ground-based measurement and satellite observation was applied toevaluate the impact of biomass burning originating from Southeast Asia (SE Asia) within the frameworkof NASA’s 2006 Biomass burning Aerosols in Southeast Asia: Smoke Impact Assessment (BASE-ASIA).Biomass burning emissions in the spring of 2006 peaked in MarcheApril when most intense biomassburning occurred in Myanmar, northern Thailand, Laos, and parts of Vietnam and Cambodia. Modelperformances were reasonably validated by comparing to both satellite and ground-based observa-tions despite overestimation or underestimation occurring in specific regions due to high uncertainties ofbiomass burning emission. Chemical tracers of particulate Kþ, OC concentrations, and OC/EC ratiosshowed distinct regional characteristics, suggesting biomass burning and local emission dominated theaerosol chemistry. CMAQ modeled aerosol chemical components were underestimated at mostcircumstances and the converted AOD values from CMAQwere biased low at about a factor of 2, probablydue to the underestimation of biomass emissions. Scenario simulation indicated that the impact ofbiomass burning to the downwind regions spread over a large area via the Asian spring monsoon, whichincluded Southern China, South China Sea, and Taiwan Strait. Comparison of AERONET aerosol opticalproperties with simulation at multi-sites clearly demonstrated the biomass burning impact via long-range transport. In the source region, the contribution from biomass burning to AOD was estimated tobe over 56%. While in the downwind regions, the contribution was still significant within the range of26%e62%.
� 2012 Elsevier Ltd. All rights reserved.
1. Introduction
Biomass burning due to forest fires and agricultural wasteburning has been a major concern in SE Asia affecting humanhealth, atmospheric visibility, land use, and aquatic ecosystems.Light-absorbing smoke particles warmed upper layers of theatmosphere, reducing surface evaporation and cutting off convec-tion that was an essential part of the hydrological cycle(Ramanathan et al., 2001). Over South Asia, biomass combustioncontributed to a two-thirds of the total organic carbon and about50% for elemental carbon (Gustafsson et al., 2009). Regional radi-ative impact of biomass burning aerosols in Asia was estimatedranging from�1.9 to 0.4Wm�2 at top of atmosphere and from�0.5to�12.0 Wm�2 at surface (Wang et al., 2007). Liu et al. (2003) used
GEOS-Chem to analyze contributions from various sources to theAsian outflow over the West Pacific. Asian biomass burning peakedin MarcheApril and its contribution was comparable to that fromAsian anthropogenic emission. Lin et al. (2009) found thatconvection over Indochina in spring was weak for the verticaltransport of pollutants. The existence of the mountain leesidetrough could be the most important mechanism for tracers to betransported from surface to above 3 km. Magnitudes of biomassburning emission were highly uncertain and its temporal profileswere especially hard to be determined, causing great difficulties formodeling. A global simulation with GFED biomass burning emis-sion indicated that biomass burning in SE Asia was substantiallyunderestimated due to lack of agricultural fires and the emissionbias was more likely from biomass burning than from anthropo-genic emissions (Nam et al., 2010).
The urgency of solving smoke haze issues was evident from theinitiatives taken by ASEAN (Association of Southeast AsianNations), such as the agreement on transboundary haze pollution
* Corresponding author. Department of Civil and Environmental Engineering, TheUniversity of Tennessee, 59 Perkins Hall, Knoxville, TN 37996-2010, USA.
E-mail address: [email protected] (J.S. Fu).
Contents lists available at SciVerse ScienceDirect
Atmospheric Environment
journal homepage: www.elsevier .com/locate/atmosenv
1352-2310/$ e see front matter � 2012 Elsevier Ltd. All rights reserved.doi:10.1016/j.atmosenv.2012.03.048
Atmospheric Environment xxx (2012) 1e12
Please cite this article in press as: Huang, K., et al., Impact assessment of biomass burning on air quality in Southeast and East Asia during BASE-ASIA, Atmospheric Environment (2012), doi:10.1016/j.atmosenv.2012.03.048
https://ntrs.nasa.gov/search.jsp?R=20140010539 2018-08-15T21:11:47+00:00Z

(ASEAN, 2002). This study is part of NASA’s BASE-ASIA experimentin 2006. SE Asia was a particularly difficult area to perform biomassburning research and it was to a large degree unstudied system-atically (Reid et al., 2009). A pilot study on biomass burning in SEAsia had already revealed its great perturbation on CO, O3, andPM2.5 concentrations (Fu et al., 2011). In this study, we applieda regional atmospheric chemical model CMAQ to understand itsfeasible application in SE Asia since very limited modeling studieshave been documented on the air quality in this region, especiallythe impact from biomass burning. Seasonal variations and spatialdistribution of biomass burning aerosols in SE Asia during the dryseason of 2006 were investigated. The effect of long-range trans-port via the spring Asian monsoon was addressed in this study. Forthe first time, the contribution of biomass burning to the aerosoloptical properties in SE Asia was estimated, which was essential forthe climatic effects. Model evaluation with comparison to in-situground measurements and satellite observations providedconstrains and useful information for the further improvement ofbiomass burning emission inventory.
2. Methodology
2.1. Model description e WRF and CMAQ
The Community Multiscale Air Quality Modeling System(CMAQ) model was driven by The Weather Research and Fore-casting (WRF) model v3.1.1. In WRF, the final analyses dataset(ds083.2) with a horizontal resolution of 1.0� � 1.0� and a temporalresolution of six hours from National Centers for Environmental
Prediction (NCEP) was incorporated as initial and boundaryconditions. The one-way nested approach with four-dimensionaldata assimilation (FDDA) in WRF was performed from a motherdomain with an 81 � 81 km horizontal resolution over Asia nesteddown to 27� 27 km. For CMAQ, Lambert conformal projectionwithtrue latitude limits of 15� and 40� was used on 156 � 176 grid cellswith horizontal resolution of 27 km. This domain covered SE Asiaand part of East Asia, which is shown in Fig. 1. The WRF and CMAQconfigurations are listed in Table 1.
2.2. Emissions and uncertainties
The biomass burning emission used in this study was from theFire Locating and Monitoring of Burning Emissions (FLAMBE) (Reidet al., 2009). Fire locations and timing were derived from MODISactive fire detections, and fire fuels were computed based on theGlobal Land Cover Characterization v2.0 database. FLAMBE had anhourly emission. Biogenic emissions were generated by MEGAN(Model of Emissions of Gases and Aerosols from Nature) v2.02.Hourly meteorological inputs were used to generate the hourlybiogenic emissions inventories. Anthropogenic emissions werebased on NASA’s 2006 Intercontinental Chemical TransportExperiment-Phase B (INTEX-B) emission inventory (Zhang et al.,2009). Fig. S1 shows the spatial distribution of monthly FLAMBEcarbon emission from March to May in 2006. And Table S1 summa-rizes the monthly biomass burning and anthropogenic emissions ofCO, NOx, NH3, SO2, PM2.5, OC, and BC in SE Asia at the country level.
In this study, we performed CMAQ simulations with twoscenarios. Onewas referred to as “base case”, which included all the
Fig. 1. The 27 � 27 km one-way nested domain from the mother domain of 81 � 81 km. All observational sites used in this study are marked in the figure. The blue circles withcenter dot denote monitoring sites in Thailand (14 sites); The green filled dots denote sites from EANET (The Acid Deposition Monitoring Network in East Asia) (8 sites); The red dotsdenote the two supersites in Taiwan; The red squares denote the site from AERONET (The Aerosol Robotic Network) (6 sites). More detailed descriptions of each site are summarizedin Table 2. (For interpretation of the references to color in this figure legend, the reader is referred to the web version of this article.)
K. Huang et al. / Atmospheric Environment xxx (2012) 1e122
Please cite this article in press as: Huang, K., et al., Impact assessment of biomass burning on air quality in Southeast and East Asia during BASE-ASIA, Atmospheric Environment (2012), doi:10.1016/j.atmosenv.2012.03.048
emission sources, i.e, biomass burning emissions, anthropogenicemissions and natural emissions. The other scenario had the sameemission sources with the biomass burning emissions removed. Itwas referred to as “control case”. The differences between the twoscenarios thus provided the contribution from biomass burningemission.
2.3. Ground-based observations
2.3.1. Observational sites in SE Asia (Thailand)A number of monitoring stations operated by Pollution Control
Department (PCD) of Ministry Natural Resources and Environmentof Thailand routinely measured air quality parameters on a dailybasis. Pollutants measured in these sites include PM10, CO, SO2,NO2, and O3. Totally 14 sites were selected and used in this studyafter checking the completeness of data. The locations of each siteare plotted in Fig. 1 (blue circle with center dot) and described inTable 2. According to the site grouping criteria using by PCD (2006),all sites in Thailand were grouped into four regions based on theirgeographic locations. The north region contained Chiang Mai andLampang. The northeast region had one site of Khon Kaen. Thecentral region contained Nakhon Sawan, Saraburi, Ayutthaya, andNonthaburi, with the other sites were grouped into the southregion.
2.3.2. EANETThe Acid Deposition Monitoring Network in East Asia (EANET)
is an international network that involved over 10 countries in Asia,which aimed to monitor wet deposition, dry deposition, soil andvegetation, and inland aquatic environment in Asian countries.Gaseous (SO2, HNO3, HCl, NH3) and particulate (SO4
2�, NO3�, Cl�,
Naþ, Kþ, NH4þ, Ca2þ, Mg2þ) measurements were made with
sampling frequency of weekly or biweekly. The instruments andmethods for the chemical analysis were described in the EANETData Report 2006 (EANET, 2007). The EANET sites used in thisstudy included two sites in Vietnam (Hanoi and Hoa Binh), foursites in Thailand (Bangkok, Patumthani, Chiang Mai, and NakhonRatchasima), and two sites in Philippines (Manila and Los Banos).Their locations are plotted in Fig. 1 (green dot) and described inTable 2.
2.3.3. Taiwan supersitesTwo supersites from Taiwan were utilized in this study. The
southern supersite is located in the Kaohsiung County and thenorthern supersite is located in Taipei (Fig. 1, red dot). The southernsupersite has one core station with three remote stations. The corestation is located at FuyingUniversity and the three remote stationsare located at Ciaotou, Cianjhen, and Chaojhou. At all sites,continuous and high-time resolved measurements were made forPM2.5 chemical composition (SO4
2�, NO3�, OC, and EC). The instru-
ments, methods, detection limits, and precisions at the southernsupersite were described in Lin et al. (2008). And description of thenorthern supersite (Sinjhuang) could be found elsewhere (Changet al., 2007).
2.3.4. AERONETThe Aerosol Robotic Network (AERONET) is a global network
measuring the aerosol optical properties using the ground-basedSun Photometer (Holben et al., 1998). Aerosol size distribution,refractive index, and single scattering albedo were retrieved usingsky radiance almucantar and direct sun measurements (Dubovikand King, 2000). The accuracy of AOD measurements is of theorder of �0.03 regarding to the level 2.0 (cloud screened) data. Inour study domain, six AERONET sites were available during the
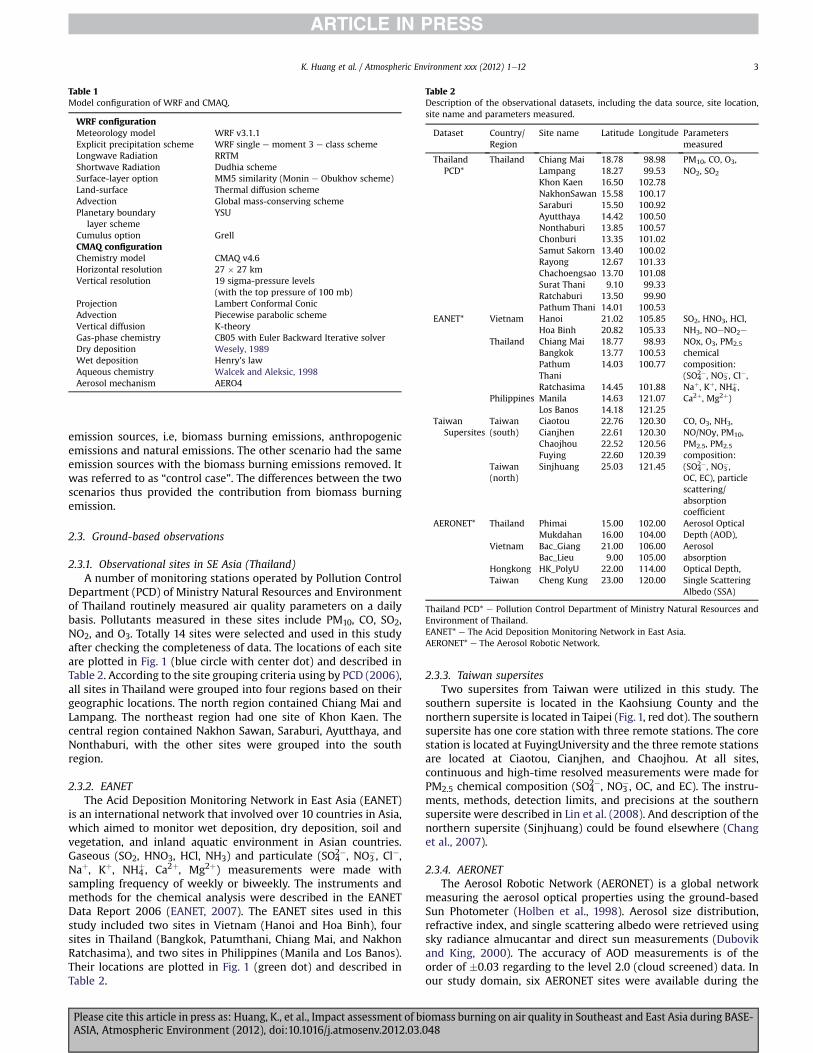
Table 1Model configuration of WRF and CMAQ.
WRF configurationMeteorology model WRF v3.1.1Explicit precipitation scheme WRF single e moment 3 e class schemeLongwave Radiation RRTMShortwave Radiation Dudhia schemeSurface-layer option MM5 similarity (Monin e Obukhov scheme)Land-surface Thermal diffusion schemeAdvection Global mass-conserving schemePlanetary boundary
layer schemeYSU
Cumulus option GrellCMAQ configurationChemistry model CMAQ v4.6Horizontal resolution 27 � 27 kmVertical resolution 19 sigma-pressure levels
(with the top pressure of 100 mb)Projection Lambert Conformal ConicAdvection Piecewise parabolic schemeVertical diffusion K-theoryGas-phase chemistry CB05 with Euler Backward Iterative solverDry deposition Wesely, 1989Wet deposition Henry’s lawAqueous chemistry Walcek and Aleksic, 1998Aerosol mechanism AERO4
Table 2Description of the observational datasets, including the data source, site location,site name and parameters measured.
Dataset Country/Region
Site name Latitude Longitude Parametersmeasured
ThailandPCD*
Thailand Chiang Mai 18.78 98.98 PM10, CO, O3,NO2, SO2Lampang 18.27 99.53
Khon Kaen 16.50 102.78NakhonSawan 15.58 100.17Saraburi 15.50 100.92Ayutthaya 14.42 100.50Nonthaburi 13.85 100.57Chonburi 13.35 101.02Samut Sakorn 13.40 100.02Rayong 12.67 101.33Chachoengsao 13.70 101.08Surat Thani 9.10 99.33Ratchaburi 13.50 99.90Pathum Thani 14.01 100.53
EANET* Vietnam Hanoi 21.02 105.85 SO2, HNO3, HCl,NH3, NOeNO2e
NOx, O3, PM2.5
chemicalcomposition:(SO4
2�, NO3�, Cl�,
Naþ, Kþ, NH4þ,
Ca2þ, Mg2þ)
Hoa Binh 20.82 105.33Thailand Chiang Mai 18.77 98.93
Bangkok 13.77 100.53PathumThani
14.03 100.77
Ratchasima 14.45 101.88Philippines Manila 14.63 121.07
Los Banos 14.18 121.25Taiwan
SupersitesTaiwan(south)
Ciaotou 22.76 120.30 CO, O3, NH3,NO/NOy, PM10,PM2.5, PM2.5
composition:(SO4
2�, NO3�,
OC, EC), particlescattering/absorptioncoefficient
Cianjhen 22.61 120.30Chaojhou 22.52 120.56Fuying 22.60 120.39
Taiwan(north)
Sinjhuang 25.03 121.45
AERONET* Thailand Phimai 15.00 102.00 Aerosol OpticalDepth (AOD),AerosolabsorptionOptical Depth,Single ScatteringAlbedo (SSA)
Mukdahan 16.00 104.00Vietnam Bac_Giang 21.00 106.00
Bac_Lieu 9.00 105.00Hongkong HK_PolyU 22.00 114.00Taiwan Cheng Kung 23.00 120.00
Thailand PCD* e Pollution Control Department of Ministry Natural Resources andEnvironment of Thailand.EANET* e The Acid Deposition Monitoring Network in East Asia.AERONET* e The Aerosol Robotic Network.
K. Huang et al. / Atmospheric Environment xxx (2012) 1e12 3
Please cite this article in press as: Huang, K., et al., Impact assessment of biomass burning on air quality in Southeast and East Asia during BASE-ASIA, Atmospheric Environment (2012), doi:10.1016/j.atmosenv.2012.03.048

study period, which included two from Thailand (Phimai, Mukda-han), two from Vietnam (Bac Giang, Bac Lieu), one from Hong Kong(HK_PolyU) and one from Taiwan (National Cheng Kung U.). Thelocations of each site are also shown in Fig. 1 (red square) anddescribed in Table 2.
3. Results and discussion
3.1. Spatial distribution of CO between CMAQ and AIRS
Carbonmonoxide (CO) was a good tracer for biomass burning asit had a relative long chemical lifetimewith a month or more. Inter-comparison of monthly modeled spatial distribution of column COconcentrations (molecules cm�2) with observed CO concentrations
from the Atmospheric Infrared Sounder (AIRS) are shown in Fig. 2.CMAQ generally captured the spatial patterns of satellite observa-tions in each month. March was the month when high COconcentrations spread over the largest areas during the studyperiod. There were mainly two high CO zones in the domain. Onezone mainly included the Central Eastern China, the North ChinaPlain, some parts of northern China and the Sichuan Basin. Theother zone was the SE Asia area that we focused on, mainlyincluding Myanmar and major areas of Thailand. It could be seenthat in the dense fire regions, model tended to overestimate the COconcentrations. Overestimation of CO emission in FLAMBE over thisregion was probably the major cause. In April, the spatial distri-bution of CO was as similar as in March to some extent, except thatthe high CO areas shrunk a lot in both model simulation and
Fig. 2. The inter-comparison between AIRS (Atmospheric Infrared Sounder) detected total CO column concentrations and CMAQ modeled CO concentrations (units:molecules cm�2) from March to May, respectively.
K. Huang et al. / Atmospheric Environment xxx (2012) 1e124
Please cite this article in press as: Huang, K., et al., Impact assessment of biomass burning on air quality in Southeast and East Asia during BASE-ASIA, Atmospheric Environment (2012), doi:10.1016/j.atmosenv.2012.03.048
satellite observation. Similarly, the model still overestimated insome dense fire areas. In May, both model and satellite showedmuch lower CO concentrations in SE Asia, and this was consistentwith monthly variations of the carbon emissions shown in Fig. S1.In general, the model could capture the spatial pattern reasonablywell.
3.2. Impact of biomass burning in source regions
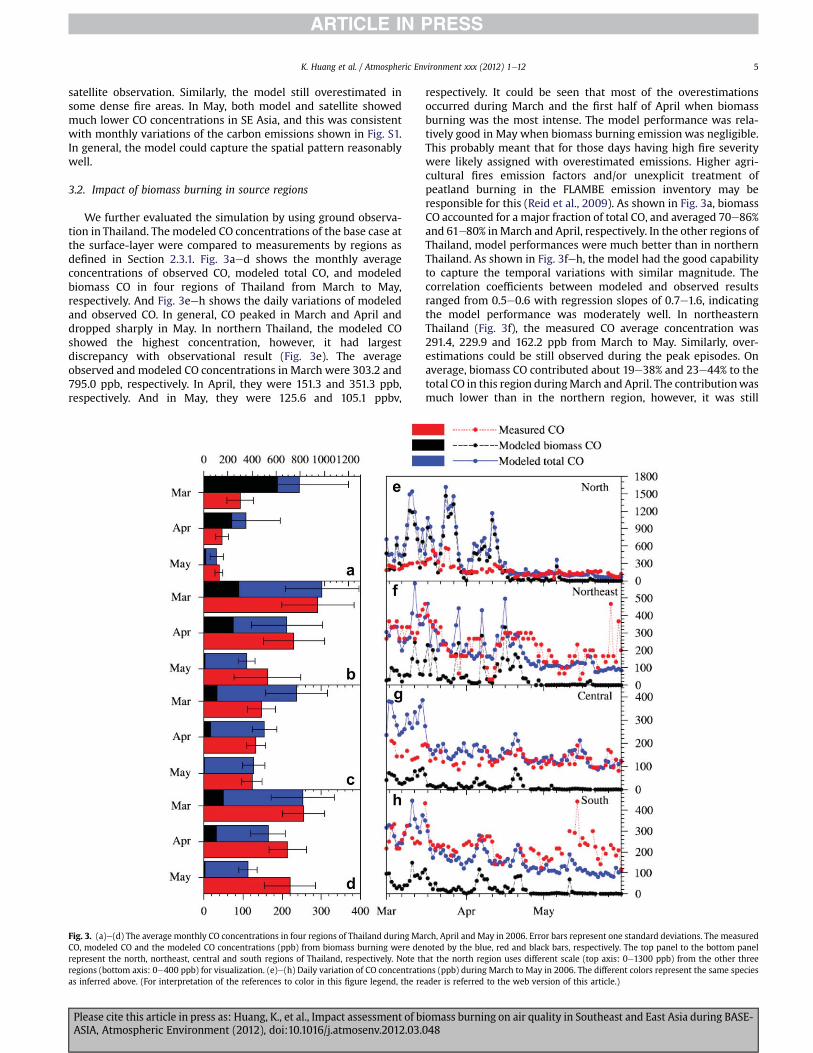
We further evaluated the simulation by using ground observa-tion in Thailand. The modeled CO concentrations of the base case atthe surface-layer were compared to measurements by regions asdefined in Section 2.3.1. Fig. 3aed shows the monthly averageconcentrations of observed CO, modeled total CO, and modeledbiomass CO in four regions of Thailand from March to May,respectively. And Fig. 3eeh shows the daily variations of modeledand observed CO. In general, CO peaked in March and April anddropped sharply in May. In northern Thailand, the modeled COshowed the highest concentration, however, it had largestdiscrepancy with observational result (Fig. 3e). The averageobserved and modeled CO concentrations in March were 303.2 and795.0 ppb, respectively. In April, they were 151.3 and 351.3 ppb,respectively. And in May, they were 125.6 and 105.1 ppbv,
respectively. It could be seen that most of the overestimationsoccurred during March and the first half of April when biomassburning was the most intense. The model performance was rela-tively good in May when biomass burning emission was negligible.This probably meant that for those days having high fire severitywere likely assigned with overestimated emissions. Higher agri-cultural fires emission factors and/or unexplicit treatment ofpeatland burning in the FLAMBE emission inventory may beresponsible for this (Reid et al., 2009). As shown in Fig. 3a, biomassCO accounted for a major fraction of total CO, and averaged 70e86%and 61e80% in March and April, respectively. In the other regions ofThailand, model performances were much better than in northernThailand. As shown in Fig. 3feh, the model had the good capabilityto capture the temporal variations with similar magnitude. Thecorrelation coefficients between modeled and observed resultsranged from 0.5e0.6 with regression slopes of 0.7e1.6, indicatingthe model performance was moderately well. In northeasternThailand (Fig. 3f), the measured CO average concentration was291.4, 229.9 and 162.2 ppb from March to May. Similarly, over-estimations could be still observed during the peak episodes. Onaverage, biomass CO contributed about 19e38% and 23e44% to thetotal CO in this region duringMarch and April. The contributionwasmuch lower than in the northern region, however, it was still
Fig. 3. (a)e(d) The average monthly CO concentrations in four regions of Thailand during March, April and May in 2006. Error bars represent one standard deviations. The measuredCO, modeled CO and the modeled CO concentrations (ppb) from biomass burning were denoted by the blue, red and black bars, respectively. The top panel to the bottom panelrepresent the north, northeast, central and south regions of Thailand, respectively. Note that the north region uses different scale (top axis: 0e1300 ppb) from the other threeregions (bottom axis: 0e400 ppb) for visualization. (e)e(h) Daily variation of CO concentrations (ppb) during March to May in 2006. The different colors represent the same speciesas inferred above. (For interpretation of the references to color in this figure legend, the reader is referred to the web version of this article.)
K. Huang et al. / Atmospheric Environment xxx (2012) 1e12 5
Please cite this article in press as: Huang, K., et al., Impact assessment of biomass burning on air quality in Southeast and East Asia during BASE-ASIA, Atmospheric Environment (2012), doi:10.1016/j.atmosenv.2012.03.048
significant. The central Thailand had the lowest CO concentrationamong the four regions, with average monthly concentrations of147.1, 132.8, and 123.4 ppb during March to May. No distincttemporal variation was observed as indicated from the observa-tional results in Fig. 3g. Overestimation occurred during the firsthalf of March, which could be also due to the overestimatedemission. The contribution of biomass burning to CO was thelowest of less than 15%, indicating central Thailand was onlyslightly impacted by biomass burning. In southern Thailand, the COconcentrations were higher than the central part while lower thannorthern and northeastern regions. The contribution of biomassburning was less than 20% and overestimation was almost notobserved in this region. Oppositely, underestimation occurredduring the last few days of May. This region covered the provincesof Chachoengsao, Chonburi and Rayong, where Thailand’s twomain seaports and some power plants and industrial facilitieslocated there (Pham et al., 2007). Thus, the underestimationmay becaused by underestimating the local anthropogenic sources. Asillustrated from the time-series pattern in the four regions(Fig. 3eeh), we could find that the north and northeast regionsexhibited relatively similarly as the two regions both had severalconsistent CO peak episodes during March and April. And thecentral and south regions exhibited similarly which only both hadpeak episodes during the early March. This meant that north and
northeast Thailand were more influenced by biomass burningwhich could come from the regional transport of adjacent countriessuch as Myanmar and Laos.
3.3. Evaluation from ground aerosol chemical measurement
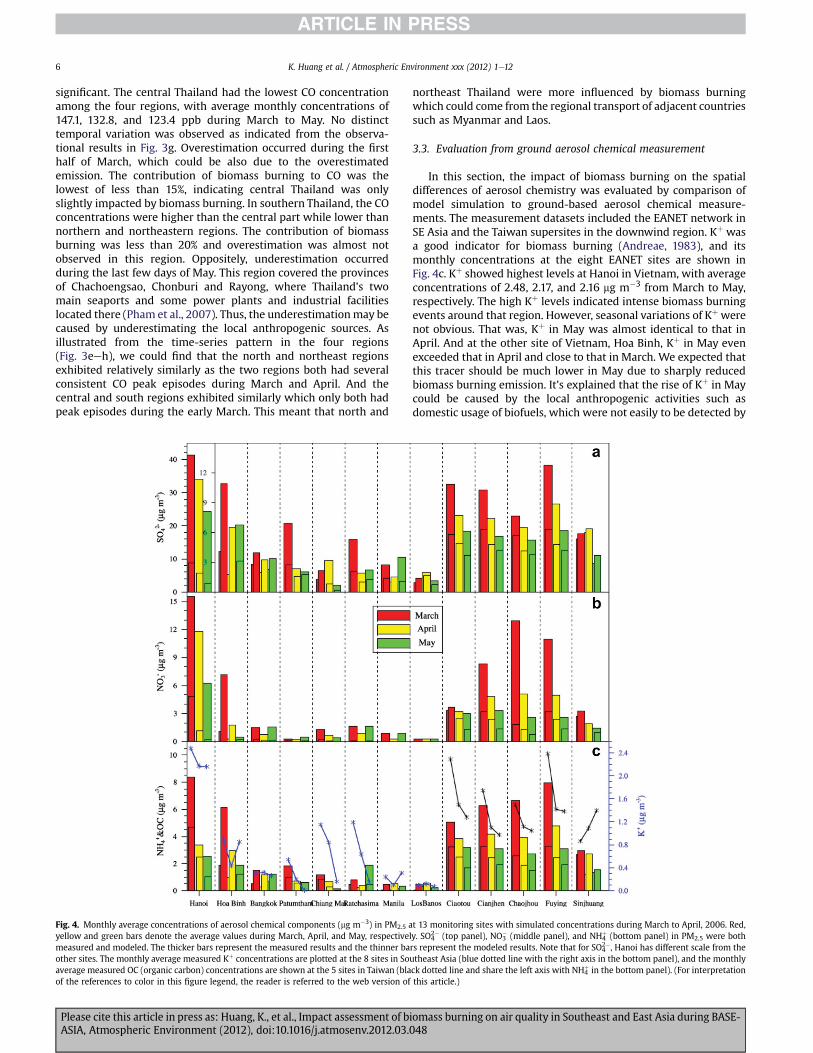
In this section, the impact of biomass burning on the spatialdifferences of aerosol chemistry was evaluated by comparison ofmodel simulation to ground-based aerosol chemical measure-ments. The measurement datasets included the EANET network inSE Asia and the Taiwan supersites in the downwind region. Kþ wasa good indicator for biomass burning (Andreae, 1983), and itsmonthly concentrations at the eight EANET sites are shown inFig. 4c. Kþ showed highest levels at Hanoi in Vietnam, with averageconcentrations of 2.48, 2.17, and 2.16 mg m�3 from March to May,respectively. The high Kþ levels indicated intense biomass burningevents around that region. However, seasonal variations of Kþ werenot obvious. That was, Kþ in May was almost identical to that inApril. And at the other site of Vietnam, Hoa Binh, Kþ in May evenexceeded that in April and close to that in March. We expected thatthis tracer should be much lower in May due to sharply reducedbiomass burning emission. It’s explained that the rise of Kþ in Maycould be caused by the local anthropogenic activities such asdomestic usage of biofuels, which were not easily to be detected by
Fig. 4. Monthly average concentrations of aerosol chemical components (mg m�3) in PM2.5 at 13 monitoring sites with simulated concentrations during March to April, 2006. Red,yellow and green bars denote the average values during March, April, and May, respectively. SO4
2� (top panel), NO3� (middle panel), and NH4
þ (bottom panel) in PM2.5 were bothmeasured and modeled. The thicker bars represent the measured results and the thinner bars represent the modeled results. Note that for SO4
2�, Hanoi has different scale from theother sites. The monthly average measured Kþ concentrations are plotted at the 8 sites in Southeast Asia (blue dotted line with the right axis in the bottom panel), and the monthlyaverage measured OC (organic carbon) concentrations are shown at the 5 sites in Taiwan (black dotted line and share the left axis with NH4
þ in the bottom panel). (For interpretationof the references to color in this figure legend, the reader is referred to the web version of this article.)
K. Huang et al. / Atmospheric Environment xxx (2012) 1e126
Please cite this article in press as: Huang, K., et al., Impact assessment of biomass burning on air quality in Southeast and East Asia during BASE-ASIA, Atmospheric Environment (2012), doi:10.1016/j.atmosenv.2012.03.048
remote sensing techniques. Distinct Kþ levels between Hanoi andHoa Binh were observed. Kþ in Hoa Binh was almost a factor of 2e5lower than in Hanoi, although two siteswere closely located (Fig.1).We assumed the local emission should be more responsible for thisas Hanoi is an urban city while Hoa Binh is rural. As for the four sitesin Thailand, highest Kþ levels were observed at Chiang Mai andNakhon Ratchasima in March with average concentrations of 1.15and 1.19 mg m�3, about 2e3 times higher than at Bangkok andPatumthani. As shown in Fig. 1, Chiang Mai is located in northernThailand, and close to Myanmar, where biomass burning was mostactive. Nakhon Ratchasima is close to Cambodiawhere also showedstrong biomass burning signals (Fig. S1), thus the high Kþ level atNakhon Ratchasima was probably attributed to the regionaltransport from Cambodia and Laos, facilitated by the southeasterlywinds (Fig. 6). In April, Kþ in Chiang Mai and Nakhon Ratchasimadecreased to 0.84 and 0.64 mg m�3. While in May, it dropped moreto 0.16 and 0.15 mgm�3. Seasonal variations of Kþ in ChiangMai andNakhon Ratchasima varied consistent with the biomass burningemission in SE Asia, suggesting the dominant role of biomassburning on the aerosol chemistry in these regions. At Patumthani,Kþ also showed obvious seasonal variations. However, its concen-tration was much lower compared to Chiang Mai and NakhonRatchasima, indicating Patumthani was only moderately impactedby biomass burning. Close to Patumthani, Bangkok also presentedrelatively low Kþ level. Both two cities located in the gulf ofThailand along the south sea coast and far away from the intensebiomass burning regions. Sea breezes from the ocean facilitated thedispersion of pollutants, which also lowered the aerosol concen-trations. As for the two sites in Philippines (Manlia and Los Banos),their concentrations were the lowest among all sites. Although they
were also located in SE Asia, the biomass burning emission thereusually started to be active from May to October, but not in thespring (Reid et al., 2009).
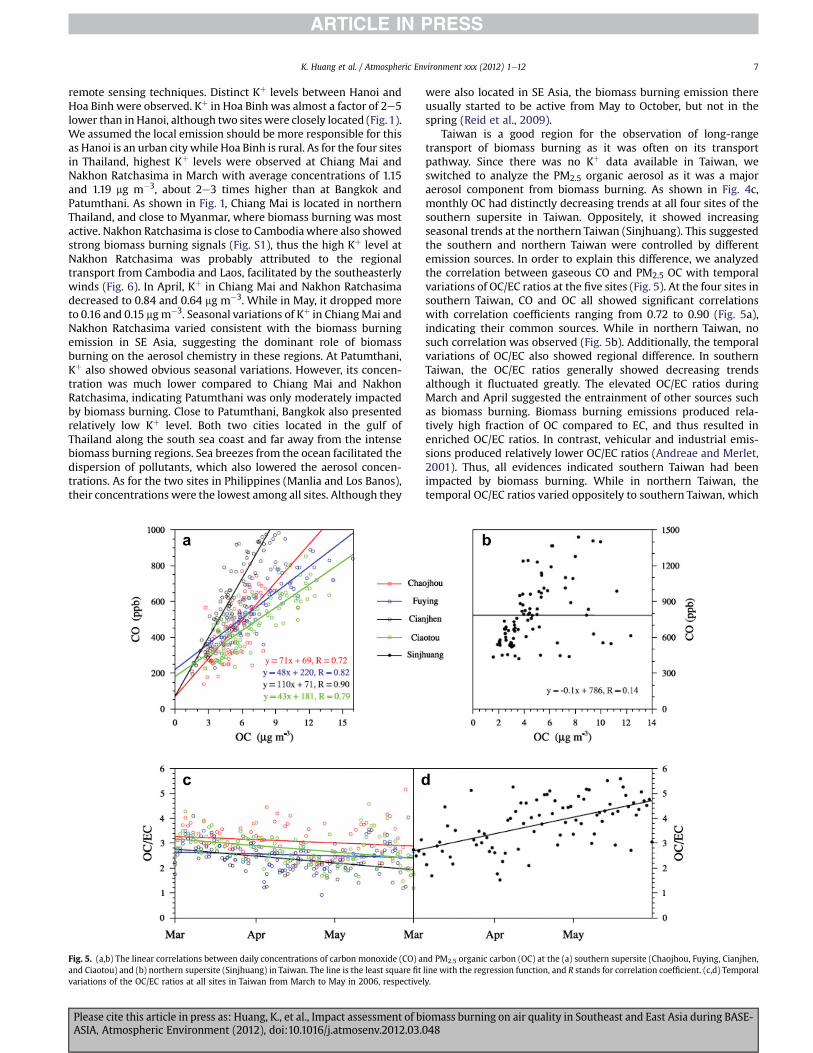
Taiwan is a good region for the observation of long-rangetransport of biomass burning as it was often on its transportpathway. Since there was no Kþ data available in Taiwan, weswitched to analyze the PM2.5 organic aerosol as it was a majoraerosol component from biomass burning. As shown in Fig. 4c,monthly OC had distinctly decreasing trends at all four sites of thesouthern supersite in Taiwan. Oppositely, it showed increasingseasonal trends at the northern Taiwan (Sinjhuang). This suggestedthe southern and northern Taiwan were controlled by differentemission sources. In order to explain this difference, we analyzedthe correlation between gaseous CO and PM2.5 OC with temporalvariations of OC/EC ratios at the five sites (Fig. 5). At the four sites insouthern Taiwan, CO and OC all showed significant correlationswith correlation coefficients ranging from 0.72 to 0.90 (Fig. 5a),indicating their common sources. While in northern Taiwan, nosuch correlation was observed (Fig. 5b). Additionally, the temporalvariations of OC/EC also showed regional difference. In southernTaiwan, the OC/EC ratios generally showed decreasing trendsalthough it fluctuated greatly. The elevated OC/EC ratios duringMarch and April suggested the entrainment of other sources suchas biomass burning. Biomass burning emissions produced rela-tively high fraction of OC compared to EC, and thus resulted inenriched OC/EC ratios. In contrast, vehicular and industrial emis-sions produced relatively lower OC/EC ratios (Andreae and Merlet,2001). Thus, all evidences indicated southern Taiwan had beenimpacted by biomass burning. While in northern Taiwan, thetemporal OC/EC ratios varied oppositely to southern Taiwan, which
Fig. 5. (a,b) The linear correlations between daily concentrations of carbon monoxide (CO) and PM2.5 organic carbon (OC) at the (a) southern supersite (Chaojhou, Fuying, Cianjhen,and Ciaotou) and (b) northern supersite (Sinjhuang) in Taiwan. The line is the least square fit line with the regression function, and R stands for correlation coefficient. (c,d) Temporalvariations of the OC/EC ratios at all sites in Taiwan from March to May in 2006, respectively.
K. Huang et al. / Atmospheric Environment xxx (2012) 1e12 7
Please cite this article in press as: Huang, K., et al., Impact assessment of biomass burning on air quality in Southeast and East Asia during BASE-ASIA, Atmospheric Environment (2012), doi:10.1016/j.atmosenv.2012.03.048
presented an increasing trend (Fig. 5d). The OC/EC ratios stayed lowat most circumstances in March, which meant biomass burningnegligibly impacted there while local emission such as vehicleemission dominated the aerosol chemistry. The OC/EC ratiosgradually increased in April and May, indicating the contribution ofsecondary organic aerosol, which could be derived from the localbiogenic emission.
The bars in Fig. 4 show the monthly measured and modeledconcentrations of threemajor secondary inorganic components (i.e,SO4
2�, NO3�, and NH4
þ) in PM2.5 at all sites. Bigger bars representmeasurement and smaller bars represent simulation. Hanoi hadmuch higher pollution than the other cities of SE Asia. The sum ofmeasured SO4
2�, NO3�, and NH4
þ in PM2.5 reached 65, 49, and33 mg m�3 fromMarch to May, respectively. Peat swamps in SE Asiawere enriched in sulfur (Langmann and Graf, 2003), and gaseousSO2 and ammonia could be discharged from the smolderingcombustion of peat (See et al., 2006). Also, the neighboring coun-tries could contribute to the high sulfur in Vietnam. As stated byArndt et al. (1998) and Engardt et al. (2005), only 30e40% of thesulfur deposition in Vietnam originated from its own domestic
sources, with the rest contributed mainly by southern China andThailand. Thus, long-range transport could be one cause for thehigh sulfur at Hanoi. However, the simulated sulfate, nitrate andammoniumwere biased low by a factor of 5e9, 3e10, and 1.5e2.5,respectively. The underestimation could be due to various reasons.First, biomass burning emission over this region could beunderestimated. Comparison of NAAPS model results to surfaceobservations during an extreme burning event in Indonesiaindicated that FLAMBE underestimated the smoke emission bya factor of 3.5 (Hyer and Chew, 2010). Secondly, the local emis-sion could have a great uncertainty. At Hanoi, about 65% of the SO2emission came from the domestic cooking, and NOx emission wasdominated by motorbikes, these emission sources were highlyuncertain (Hung, 2010). Thirdly, we found that if we calculated theneutralization factor of bases on acids, i.e, the equivalent ratio ofNH4
þ versus the sum of SO42� and NO3
�, the monthly ratio was 0.42,0.21, and 0.23 during March to April, respectively, much lower than1.0. This meant that a significant fraction of SO4
2� and NO3� didn’t
exist in the form of (NH4)2SO4 and NH4NO3. We further checkedanother important alkaline species (Ca2þ), and found its monthly
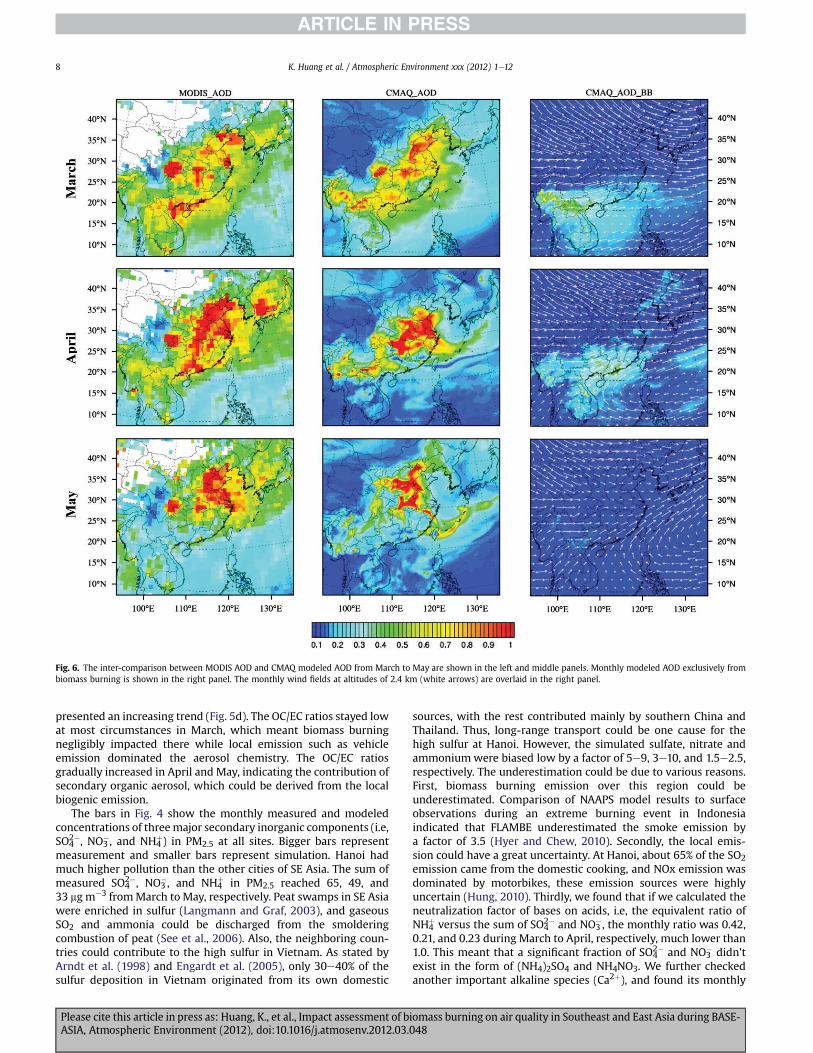
Fig. 6. The inter-comparison between MODIS AOD and CMAQ modeled AOD from March to May are shown in the left and middle panels. Monthly modeled AOD exclusively frombiomass burning is shown in the right panel. The monthly wind fields at altitudes of 2.4 km (white arrows) are overlaid in the right panel.
K. Huang et al. / Atmospheric Environment xxx (2012) 1e128
Please cite this article in press as: Huang, K., et al., Impact assessment of biomass burning on air quality in Southeast and East Asia during BASE-ASIA, Atmospheric Environment (2012), doi:10.1016/j.atmosenv.2012.03.048
concentration reached 13.63,18.19, and 16.30 mgm�3 fromMarch toMay, about 10 times higher than in the wet seasons (EANET, 2007).Forest and peat fires were probably one of the major sources of Ca-rich particles (Li et al., 2003). If we incorporated Ca2þ into the basesand re-calculated the neutralization factor, i.e, the equivalent ratioof the sum of NH4
þ and Ca2þ versus the sum of SO42� and NO3
�, theratios were elevated to 1.0e1.5. Thus, we suspected that theunderestimation of modeled sulfate and nitrate should be due tothat the heterogeneous reactions of sulfate and nitrate were notwell considered in the model. At Hoa Binh, although it is locatedclosely to Hanoi, the measured sulfate, nitrate, and ammoniumwas about a factor of 5e20 lower. However, the modeloverestimated about 2e8 times, and simulated as similar levels asthose of Hanoi. This indicated that the emission inventory wasnot explicit at finer spatial resolution. In Thailand, SO4
2�, NO3�, and
NH4þ at four sites ranged at levels of 0.69e6.87, 0.22e1.6, and
0.15e1.85 mg m�3, respectively. They were much lower thanHanoi, due to the PM emission of Thailand was about 40% lowerthan Vietnam (Zhang et al., 2009). The model simulation per-formed better, probably due to that the emission inventory ofThailand was better than Vietnam. At the downwind sites ofTaiwan, the concentration levels were generally higher than inThailand and Philippines owing to its stronger local anthropogenicsources. At the four sites in southern Taiwan, themodeled inorganicsecondary species were biased low in most circumstances. Con-trastingly, the model performance was pretty well at the northernsupersite (Sinjhuang). Modeled versus measured SO4
2�, NO3� and
NH4þ generated slopes of 1.15, 0.96, and 1.12, respectively. Thus, the
good model performance here corroborated that the perturbationof biomass burning on the aerosol chemistry in northern Taiwanwas negligible. In summary, the spatial variation was moderatelyreproduced and the discrepancy between model and measurementdepended on various factors, such as emission, meteorologicalparameters, and some immature physical and chemical mecha-nisms in the model.
3.4. Aerosol radiative properties
3.4.1. Relation between monsoon and impact of biomass burningRemote sensing provided useful information on the regional
distribution of aerosol optical properties and possible transportpathways. In Fig. 6, the monthly aerosol optical depth (AOD) at thewavelength of 550 nm with 1� � 1� resolution was derived fromMODIS. The corresponding modeled AODwere inter-compared andthe method for converting AOD from CMAQ is described in theAppendix. Generally, the model simulated spatial pattern relativelyconsistent withMODIS observation in eachmonth. DuringMarch inSE Asia, AOD higher than 0.5 spread over Vietnam, the northernLaos, major regions of Myanmar, and northeast Thailand. The highAOD belt extended northeast, which influenced the South ChinaSea, southern inland China, East China Sea and the Taiwan Straitfrom the view of both satellite and simulation. The model over-estimated AOD over the intense fire regions like Myanmar and Laoswhile underestimated over major areas of Thailand where less firesoccurred. In April, the decreases of AOD over SE Asia were detectedby both satellite and model. The long-range transport from sourceregions to the downwind regions was not as strong as inMarch. Themain high AOD zones were located at the North China Plain, centralEastern China and part of Southern China, which was due to theanthropogenic emission in those industrialized areas and could bepartly due to the long-range transport of dust aerosol originatingfrom the Gobi desert in northern China (Huang et al., 2010). In May,AOD over the whole SE Asia dramatically decreased to around 0.3.
Fig. 6 also shows the monthly AOD exclusively from biomassburning with wind fields at altitudes of 2.4 km (white arrows). In
March, the impact from biomass burning in SE Asia covereda widespread area. In the source regions, AOD could be as high as0.4 to 0.6 from the impact of biomass burning. Due to prevailingwinds from thewest and southwest, the impact of biomass burningextended from peninsular SE Asia to the South China Sea, theTaiwan Strait, and some provinces in southern China below 25 N�.The most significant impact due to long-range transport was foundin Yunnan, Guangxi, Guangdong provinces, the Taiwan Strait andthe South China Sea. Less impact was found in regions around25�Ne30�N and over the Western Pacific Ocean. In April, impactsfrom biomass burning in the source regions were still significantand it extended to the latitude of around 30 N�, which had coveredmost of the provinces in southern China. The different spatialdistribution patterns of biomass burning AOD between March andApril were caused by the wind fields. As shown by the wind vectorsin the figure, the average wind fields in March at the latitudes of17�Ne25�N dominantly blew from west to east, which pushed thepollutants eastward. Below 17 N�, winds blew from the east overthe western Pacific and then circulated to higher latitudes whichformed an anticyclone, that’s why we observed that biomassburning impacted greatly over the South China Sea. In April, thewind fields changed and dominantly blew from low latitudes to thehigh latitudes which pushed the emitted pollutants more north-ward and eastward, while the South China Seawas less impacted. InMay, the effect of biomass burning on aerosol was almost negligibleas illustrated in the figure, owing to the tremendous decreases ofbiomass burning emissions and advent of wet season.
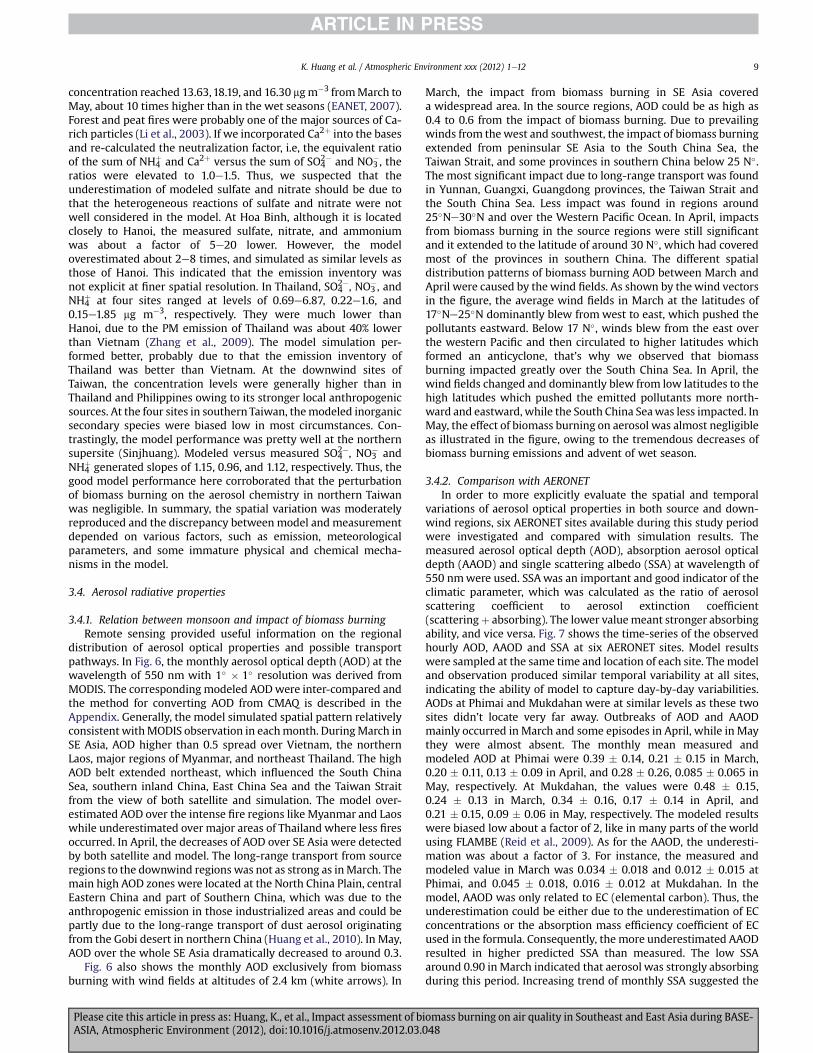
3.4.2. Comparison with AERONETIn order to more explicitly evaluate the spatial and temporal
variations of aerosol optical properties in both source and down-wind regions, six AERONET sites available during this study periodwere investigated and compared with simulation results. Themeasured aerosol optical depth (AOD), absorption aerosol opticaldepth (AAOD) and single scattering albedo (SSA) at wavelength of550 nmwere used. SSAwas an important and good indicator of theclimatic parameter, which was calculated as the ratio of aerosolscattering coefficient to aerosol extinction coefficient(scatteringþ absorbing). The lower valuemeant stronger absorbingability, and vice versa. Fig. 7 shows the time-series of the observedhourly AOD, AAOD and SSA at six AERONET sites. Model resultswere sampled at the same time and location of each site. The modeland observation produced similar temporal variability at all sites,indicating the ability of model to capture day-by-day variabilities.AODs at Phimai and Mukdahan were at similar levels as these twosites didn’t locate very far away. Outbreaks of AOD and AAODmainly occurred in March and some episodes in April, while in Maythey were almost absent. The monthly mean measured andmodeled AOD at Phimai were 0.39 � 0.14, 0.21 � 0.15 in March,0.20 � 0.11, 0.13 � 0.09 in April, and 0.28 � 0.26, 0.085 � 0.065 inMay, respectively. At Mukdahan, the values were 0.48 � 0.15,0.24 � 0.13 in March, 0.34 � 0.16, 0.17 � 0.14 in April, and0.21 � 0.15, 0.09 � 0.06 in May, respectively. The modeled resultswere biased low about a factor of 2, like in many parts of the worldusing FLAMBE (Reid et al., 2009). As for the AAOD, the underesti-mation was about a factor of 3. For instance, the measured andmodeled value in March was 0.034 � 0.018 and 0.012 � 0.015 atPhimai, and 0.045 � 0.018, 0.016 � 0.012 at Mukdahan. In themodel, AAOD was only related to EC (elemental carbon). Thus, theunderestimation could be either due to the underestimation of ECconcentrations or the absorption mass efficiency coefficient of ECused in the formula. Consequently, the more underestimated AAODresulted in higher predicted SSA than measured. The low SSAaround 0.90 in March indicated that aerosol was strongly absorbingduring this period. Increasing trend of monthly SSA suggested the
K. Huang et al. / Atmospheric Environment xxx (2012) 1e12 9
Please cite this article in press as: Huang, K., et al., Impact assessment of biomass burning on air quality in Southeast and East Asia during BASE-ASIA, Atmospheric Environment (2012), doi:10.1016/j.atmosenv.2012.03.048
decreasing role of elemental carbon on the contribution of aerosollight extinction. And also higher relative humidity during the laterperiods resulted in fine mode particle growth and an increase inlight scattering coefficient (Kotchenruther and Hobbs, 1998). Bycalculating the difference of modeled AOD between the base case
and control case, we could estimate the contribution of biomassburning to the total AOD. In March, biomass emission accounted foran average of 24e35% and 36e50% of AOD at Phimai and Mukda-han, respectively. In April, it decreased to 18e29% and 29e42%,respectively. While In May, the contribution was less than 4% at
Fig. 7. The measured (red dot) and modeled (blue line) aerosol optical properties (AOD, AAOD, and SSA) at four AERONET sites (Level 2.0) in Southeast Asia (Thailand: Phimai,Mukdahan; Vietnam: Bac_Giang, Bac_Lieu) and two downwind sites (HongKong: HK_PolyU; Taiwan: Cheng Kung). Model results are sampled at the same location and time atvarious sites. SSA measurement data with corresponding AOD values less than 0.4 are removed due to the low confidence (Dubovik et al., 2000; Holben et al., 2006). (Forinterpretation of the references to color in this figure legend, the reader is referred to the web version of this article.)
K. Huang et al. / Atmospheric Environment xxx (2012) 1e1210
Please cite this article in press as: Huang, K., et al., Impact assessment of biomass burning on air quality in Southeast and East Asia during BASE-ASIA, Atmospheric Environment (2012), doi:10.1016/j.atmosenv.2012.03.048
both sites. Phimai was moderately impacted by biomass burningwhile Mukdahan was more severely impacted. Among the foursites in SE Asia, Bac Giang evidently showed the strongest aerosolextinction. The modeled monthly AOD fromMarch to May reached1.52 � 1.26, 1.10 � 1.09, and 0.15 � 0.09, respectively. It wasunfortunate that no measurement data was available during themost intense periods. However, similar high AOD levels as themodel results in this study could be observed in the other years, e.g,2007, 2008 (cf. http://aeronet.gsfc.nasa.gov/). This site is located inthe northern part of Vietnam and very close to the EANET Hanoi site(Fig. 1). The highest AOD modeled over this region was consistentwith the aerosol chemical analysis in Section 3.3 and satellite imagein Section 3.4.1. The contribution from biomass burning to AODwasthe highest among all sites with approximately 56e69% and59e72% during March and April, respectively. Times series of AODand AAOD at Bac Giang showed some concurrent variations withthat of Mukdahan, especially during the two highest peaks onMarch 27e28 and April 13e14. While this temporal consistencewas not found at Phimai. Mukdahan is located in the Mekong Riverregion and bordered with Laos, where forest fires dominated. Theconsistence of temporal variation of aerosol optical propertiesbetweenMukdahan and Bac Giang suggested that Mukdahan couldbe potentially influenced by the intense biomass burning emissionfrom the northern part of SE Asia. While the inconsistence betweenPhimai and Bac Giang suggested that there was little chance for thebiomass burning originating in northern parts of SE Asia to betransported to the central part of Thailand. That’s why we foundthat the contribution of biomass burning was higher at Mukdahanthan at Phimai. Except for the peak episodes on March 27e28 andApril 13e14, Phimai and Mukdahan had some other concurrentpeak episodes during the study period, i.e, March 3 & 10, April17e18, and May 14e15. These high episodes were probably causedby the local biomass burning emission in Thailand, such as landclearing and straw residue burning. Bac Lieu is another site inVietnam while showed lowest AOD and AAOD values among thefour sites in SE Asia. The average monthly modeled AOD valueswere 0.13 � 0.095, 0.050 � 0.036, and 0.037 � 0.026, respectively.Bac Lieu is located at the very southern edge of Vietnam and closeto the ocean. The low values there should be due to the local weakbiomass burning emission (Fig. S1).
In this study, two AERONET sites available at the downwindregions from SE Asia were investigated, including one site in HongKong (HK_polyU), and one site in Taiwan (National Cheng Kung U.).At HK_PolyU, AOD and AAOD stayed within certain levels duringthe first 25 days in March, then suddenly increased near the end ofMarch, which was 3e4 times that the average level of the previousdays, indicating the transport from elsewhere. This peak episodecorresponded well with that in Bac Giang and three days backwardtrajectory (Draxler and Rolph, 2003) traced back of the origin of airmasses from Myanmar, Laos, Vietnam and southern China (notshown). On March 27, AAOD even reached over 0.5, indicating theaccumulation of strong absorbing substances. Another pollutionepisode occurred on April 13e14, which was also related to thebiomass burning from SE Asia as indicated from the consistentpeaks in Bac Biang and Mukdahan. The monthly contribution frombiomass burning to AOD at HK_PolyU reached 36e50% and 47e62%in March and April, respectively, which was even higher thanThailand and only inferior to Bac Giang. This indicated that thelong-range transport of biomass burning had tremendous impacton the air quality of Hong Kong. More far away from the sourceregion, the modeled optical properties in Taiwan (TW_ChengKung)also presented evident seasonal change and strong temporal vari-ation. The modeled monthly AOD at TW_ChengKung was0.67 � 0.37 in March, 0.49 � 0.38 in April, and 0.16 � 0.13 in May,respectively. High AOD and AAOD peaks occurred mainly in the
second half of March and near the middle of April, which corre-sponded to the outbreaks in source region, e.g, Bac Giang, Muk-dahan, indicating the large-scale influence via long-rangetransport. The contribution of biomass burning to AOD at southernTaiwan was about 26e39% and 27e41% in March and April,respectively.
4. Conclusions
In this paper, we simulated biomass burning in SE Asia duringMarch to May, 2006, by using the Models-3/Community MultiscaleAir Quality (CMAQ) model and the FLAMBE biomass burningemission inventory. Ground-based measurement and satelliteobservation was used to evaluate the model performance. Themajor findings were presented as below:
(1) Biomass burning emissions in the spring of 2006 peaked inMarcheApril when most intense biomass burning occurred inMyanmar, northern Thailand, Laos, and parts of Vietnam andCambodia. CMAQ could reasonably well simulate the spatialpattern and temporal variations of CO in comparison to bothsatellite and ground measurement. Overestimation or under-estimation occurred in different regions due to great uncer-tainties of the biomass burning emission inventory. The largestdiscrepancy between modeled and observed CO occurred innorthern Thailand, which overestimated the peak episodes bya factor of 2e3. In the other regions of Thailand where less firesoccurred, the simulation performed much better.
(2) Scenario simulation not only modeled significant impact ofbiomass burning on AOD (0.4e0.6) in SE Asia source regions,but also in the downwind regions. The Asian spring monsoonfacilitated the impact of biomass burning extending frompeninsular SE Asia to the South China Sea, the Taiwan Strait,and some provinces in southern China. Different spatialdistribution patterns of biomass burning AOD between Marchand April were caused by the different wind fields.
(3) Evaluation of several datasets, i.e, EANET, AERONET, andTaiwan supersites’ data, illustrated distinct regional differencesof aerosol chemical and optical properties. Local biomassburning, anthropogenic sources and long-range/regionaltransport were the main factors controlling the aerosolchemistry. Highest concentrations of particulate Kþ, SO4
2�, NO3�,
and NH4þ were observed at Hanoi in Vietnam. Correspondingly,
highest AOD and AAOD were modeled at Bac Giang, also inVietnam. The contribution of biomass burning to AOD wasestimated to be over 56%, indicating the significant influence ofbiomass burning over this region. In Thailand, the magnitudesof major aerosol chemical components, AOD, and AAOD weremuch lower than in Vietnam. The contribution of biomassburning to AOD was about 18e50%, indicating that Thailandwas moderately impacted. In the downwind regions, thecontribution of biomass burning to AOD at Hong Kong andTaiwan was significant within the range of 26%e62%. Theobserved monthly mean SSA was around 0.90 during intensebiomass burning periods, suggesting the great production ofstrongly absorbing substances (i.e, EC) due to biomass burning.Modeled concentrations of aerosol chemical components werebiased lowatmost circumstances, and themodeled AOD valueswere biased low about a factor of 2, probably due to theunderestimation of biomass burning emission.
Acknowledgments
We thank Thailand PCD, EANET, Taiwan EPA and AERONET forproving the measurement data. We thank Dr. Edward J. Hyer for
K. Huang et al. / Atmospheric Environment xxx (2012) 1e12 11
Please cite this article in press as: Huang, K., et al., Impact assessment of biomass burning on air quality in Southeast and East Asia during BASE-ASIA, Atmospheric Environment (2012), doi:10.1016/j.atmosenv.2012.03.048
providing FLAMBE biomass burning emission data. We thank NASAGSFC on funding support (grant no.: NNX09AG75G). Data productsfrom SMART-COMMIT and Deep Blue groups of NASA GSFC arefunded by the NASA Radiation Sciences Program, managed by Dr.Hal Maring. Hong Kong data was obtained from Hong Kong Envi-ronmental Protection Department.
Appendix. Supplementary material
Supplementary data associated with this article can be found, inthe online version, at doi:10.1016/j.atmosenv.2012.03.048.
References
Andreae, M.O., 1983. Soot carbon and excess fine potassium e long-range transportof combustion-derived aerosols. Science 220, 1148e1151. doi:10.1126/science.220.4602.1148.
Andreae, M.O., Merlet, P., 2001. Emission of trace gases and aerosols from biomassburning. Global Biogeochemical Cycles 15 (4), 955e966. doi:10.1029/2000GB001382.
Arndt, R.L., Carmichael, G.R., Roorda, J.M., 1998. Seasonal source-receptor relation-ships in Asia. Atmospheric Environment 32, 1397e1406.
ASEAN, 2002. ASEAN Agreement on Transboundary Haze Pollution.Chang, S.Y., Lee, C.T., Chou, C.C.K., Liu, S.C., Wen, T.X., 2007. The continuous field
measurements of soluble aerosol compositions at the Taipei aerosol supersite,Taiwan. Atmospheric Environment 41, 1936e1949.
Draxler, R., Rolph, G., 2003. HYSPLIT (HYbrid Single-Particle Lagrangian Integratedtrajectory) model. http://www.arl.noaa.gov/ready/hysplit4.html.
Dubovik, O., King, M.D., 2000. A flexible inversion algorithm for retrieval of aerosoloptical properties from sun and sky radiance measurements. Journal ofGeophysical Research 105 (D16), 20673e20696.
Dubovik, O., Smirnov, A., Holben, B.N., King, M.D., Kaufman, Y.J., Eck, T.F., Slutsker, I.,2000. Accuracy assessments of aerosol optical properties retrieved from AER-ONET sun and sky-radiance measurements. Journal of Geophysical Research105 (D8), 9791e9806. doi:10.1029/2000JD900040.
EANET, 2007. EANET Data Report 2006, Acid Deposition Monitoring Network in EastAsia (EANET).
Engardt, M., Siniarovina, U., Khairul, N.I., Leong, C.P., 2005. Country to countrytransport of anthropogenic sulphur in Southeast Asia. Atmospheric Environ-ment 39, 5137e5148.
Fu, J.S., Hsu, N.C., Gao, Y., Huang, K., Li, C., Lin, N.H., Tsay, S.C., 2011. Evaluating theinfluences of biomass burning during 2006 BASE-ASIA: a regional chemicaltransport modeling. Atmospheric Chemistry & Physics Discussion 11,32205e32243. doi:10.5194/acpd-11-32205-2011.
Gustafsson, O., Krusa, M., Zencak, Z., Sheesley, R.J., Granat, L., Engstrom, E.,Praveen, P.S., Rao, P.S.P., Leck, C., Rodhe, H., 2009. Brown clouds over south Asia:biomass or fossil fuel combustion? Science 323, 495e498. doi:10.1126/science.1164857.
Holben, B.N., Eck, T.F., Slutsker, I., Tanre, D., Buis, J.P., Setzer, A., Vermote, E.,Reagan, J.A., Kaufman, Y.J., Nakajima, T., Lavenu, F., Jankowiak, I., Smirnov, A.,1998. AERONET e a federated instrument network and data archive for aerosolcharacterization. Remote Sensing of Environment 66, 1e16.
Holben, B.N., Eck, T.F., Slutsker, I., Smirnov, A., Sinyukc, A., Schaferc, J., Gilesc, D.,Dubovik, O., 2006. AERONET’s version 2.0 quality assurance criteria. Proceed-ings of SPIE 6408, 64080Q. doi:10.1117/12.706524.
Huang, K., Zhuang, G.S., Lin, Y.F., Li, J.A., Sun, Y.L., Zhang, W.J., Fu, J.S., 2010. Relationbetween optical and chemical properties of dust aerosol over Beijing, China.Journal of Geophysical Research 115, D00K16. doi:10.1029/2009JD013212.
Hung, N.T., 2010. Urban air quality modelling and management in Hanoi, Vietnam.PhD Thesis, Aarhus University, National Environmental Research Institute,Denmark, 211 pp.
Hyer, E.J., Chew, B.N., 2010. Aerosol transport model evaluation of an extremesmoke episode in Southeast Asia. Atmospheric Environment 44, 1422e1427.
Kotchenruther, R.A., Hobbs, P.V., 1998. Humidification factors of aerosols frombiomass burning in Brazil. Journal of Geophysical Research 103 (D24),32081e32089. doi:10.1029/98JD00340.
Langmann, B., Graf, H., 2003. Indonesian smoke aerosols from peat fires and thecontribution from volcanic sulfur emissions. Geophysical Research Letters 30(11), 1547. doi:10.1029/2002GL016646.
Li, J., Posfai, M., Hobbs, P.V., Buseck, P.R., 2003. Individual aerosol particles frombiomass burning in southern Africa: 2, compositions and aging of inorganicparticles. Journal of Geophysical Research 108 (D13), 8484. doi:10.1029/2002JD002310.
Lin, C.H., Wu, Y.L., Lai, C.H., Watson, J.G., Chow, J.C., 2008. Air quality measurementsfrom the southern particulate matter supersite in Taiwan. Aerosol and AirQuality Research 8 (3), 233e264.
Lin, C.Y., Hsu, H.M., Lee, Y.H., Kuo, C.H., Sheng, Y.F., Chu, D.A., 2009. A new transportmechanism of biomass burning from Indochina as identified bymodeling studies.Atmospheric Chemistry & Physics 9, 7901e7911. doi:10.5194/acp-9-7901-2009.
Liu, H.Y., Jacob, D.J., Bey, I., Yantosca, R.M., Duncan, B.N., Sachse, G.W., 2003.Transport pathways for Asian pollution outflow over the Pacific: interannualand seasonal variations. Journal of Geophysical Research 108 (D20), 8786.doi:10.1029/2002JD003102.
Nam, J., Wang, Y., Luo, C., Chu, D.A., 2010. Trans-Pacific transport of Asian dust andCO: accumulation of biomass burning CO in the subtropics and dipole structureof transport. Atmospheric Chemistry & Physics 10, 3297e3308. doi:10.5194/acp-10-3297-2010.
PCD, 2006. Pollution Control Department, Thailand State of Pollution Report 2006.PCD. 06e026, ISBN 978-974-286-344-9.
Pham, T.B.T., Manomaiphiboon, K., Vongmahadlek, C., 2007. Updated emissionestimates of ozone precursors from energy consumption by power plants andindustrial facilities in the central and eastern regions of Thailand. Asian Journalon Energy and Environment 08 (01), 483e489.
Ramanathan, V., Crutzen, P.J., Kiehl, J.T., Rosenfeld, D., 2001. Atmosphere e aerosols,climate, and the hydrological cycle. Science 294, 2119e2124. doi:10.1126/science.1064034.
Reid, J.S., Hyer, E.J., Prins, E.M., Westphal, D.L., Zhang, J.L., Wang, J.,Christopher, S.A., Curtis, C.A., Schmidt, C.C., Eleuterio, D.P., Richardson, K.A.,Hoffman, J.P., 2009. Global monitoring and forecasting of biomass-burningsmoke: description of and lessons from the fire locating and modeling ofburning emissions (FLAMBE) Program. IEEE Journal of Selected Topics inApplied Earth Observations and Remote Sensing 2 (3), 144e162. doi:10.1109/JSTARS.2009.2027443.
See, S.W., Balasubramanian, R., Wang, W., 2006. A study of the physical, chemical,and optical properties of ambient aerosol particles in Southeast Asia duringhazy and nonhazy days. Journal of Geophysical Research 111, D10S08.doi:10.1029/2005JD006180.
Wang, S.H., Lin, N.H., Chou, M.D., Woo, J.H., 2007. Estimate of radiative forcing ofAsian biomass-burning aerosols during the period of TRACE-P. Journal ofGeophysical Research 112, D10222. doi:10.1029/2006JD007564.
Wesely, M.L., 1989. Parameterization of Surface Resistances to Gaseous Dry Depo-sition in Regional-Scale Numerical Models. Atmospheric Environment 23,1293e1304.
Walcek, C.J., Aleksic, N.M., 1998. A Simple but Accurate Mass Conservative Peak-Preserving, Mixing Ratio Bounded Advection Algorithm with Fortran Code.Atmospheric Environment 32, 3863e3880.
Zhang, Q., Streets, D.G., Carmichael, G.R., He, K.B., Huo, H., Kannari, A., Klimont, Z.,Park, I.S., Reddy, S., Fu, J.S., Chen, D., Duan, L., Lei, Y., Wang, L.T., Yao, Z.L., 2009.Asian emissions in 2006 for the NASA INTEX-B mission. Atmospheric Chemistry& Physics 9, 5131e5153. doi:10.5194/acp-9-5131-2009.
K. Huang et al. / Atmospheric Environment xxx (2012) 1e1212
Please cite this article in press as: Huang, K., et al., Impact assessment of biomass burning on air quality in Southeast and East Asia during BASE-ASIA, Atmospheric Environment (2012), doi:10.1016/j.atmosenv.2012.03.048