impact crushing of particle-particle compounds – …¤ge/final.pdf · mechanical process...
TRANSCRIPT
Impact Crushing of Particle-Particle Compounds – Experiment
and Simulation
W. Schubert, M. Khanal, J. Tomas*
Mechanical Process Engineering, Process Engineering Department, Otto-von-Guericke-
University of Magdeburg, Universitätsplatz 2, D-39106 Magdeburg, Germany
Abstract
Particle-particle compound consists of various sized particles with non-uniform properties,
whose properties vary in large range depending upon applications, methods of manufacturing
and ratio of its compositions. The different types of engineering agglomerates and building
materials, like concrete, are some of the examples of particle compounds. Recycling of value
material from building waste such as aggregates from concrete ball provides impetus to
investigate particle-particle compounds.
The liberation of aggregates is carried out by impact crushing in a large scale pneumatic
cannon. Both experiments and Finite and Discrete Element simulations are adopted to study
the cracking phenomena of aggregates. Also, the different aspects of crushing of particle-
particle compounds at different velocities are discussed.
Keywords: discrete element method; finite element method; crushing; impact; concrete
1. Introduction
The different types of engineering agglomerates and building materials like concrete are some
of the examples of particle-particle compounds. Similarly, the proper recycling of particle
compounds is very important in order to utilize value materials. The liberation of value
material from building waste, such as, aggregate from concrete provides the impetus to
investigate particle-particle compounds for recycling. The properties of these compounds vary
widely depending upon applications, methods of manufacturing and ratio of their
* Corresponding author. Fax: +49-391-67-11160, E-mail: [email protected] (J. Tomas)
1
components. Even if the manufacturing conditions are kept constant their properties may be
different due to the random positioning of their ingredients.
The aggregate material as the value component is fixedly embedded in concrete so that
liberation can only occur by forced crushing. During this process the bonds between
aggregate and hardened cement paste, which is the second but valueless component, have to
be burst. Both experiments carried out in a large-scale pneumatic cannon and simulations in
forms of Finite Element Analysis (FEM) and Discrete Element Method (DEM) help to find
out about conditions for aggregate liberation.
The beginning analysis of the liberation of aggregate from hardened cement paste were
carried out by Kiss and Schönert (1979, 1980). Single particle crushing experiments were
performed to investigate whether impact, double impact or compression stressing is more
suitable for liberation. Spheres of 10 mm in diameter consisting of sand particles embedded in
hardened cement paste were used as mineral model material. Arbiter et al. (1969) produced
spheres between 74 and 124 mm in diameter from a mixture of flint-shot sand particles and
high early strength cement and water to test the free fall at stressing velocities up to 7.6 m/s. It
is shown by Schubert (1993) that impact stressing conditions increase the fracture probability
of brittle feed material. Herbst et al. (1974) applied mass balances to describe the liberation
process more in general. Tomas et al. (1999) analyzed the liberation of aggregate particles
during impaction of comparatively large 150 mm concrete spheres at velocities up to 75 m/s.
Tavares and King (1998) studied the single particle breakage under impact loading. The
liberation and comminution of minerals is presented by King (1994). The goals of all
investigations are to observe the crack formation, fracture patterns and particle size
distribution.
Kienzler et al. (1985) investigated elasto-viscoplastic conditions for spheres using FEM
simulations. DEM simulations of impact breakage of spherical agglomerates were carried out
by Kafui (2000) and Thornton et al. (1996, 1999). Mishra et al. (2001) found different
parameters, which influence the breakage of agglomerates through impaction. Similarly, the
solid particle failure under normal and oblique impact was studied by Salman et al. (1995,
2000), who used aluminum oxide particles of 5.15 mm in diameter as material and soda lime
glass spheres, which diameters ranged between 0.4 and 12.7 mm.
The two-dimensional Finite Element Analysis is carried out with central impact loading
condition to understand the stress pattern distributions before cracking rather than to stick in
numerical play. In reality, the continuum approach is not suitable for the analysis of the
particle compound as continuum theory assumes the material as continuous, homogeneous
2
and isotropic which is totally inapplicable with particle compound. Hence, the Discrete
Element Method is adopted for further analysis as it treats the particle compound as the
constituents of different individual small balls as the particles.
2. Fundamentals
2.1. FEM model development
The continuum analysis is adopted to find out the stress distribution inside the concrete ball
when it is in central impact condition. This continuum analysis is carried out by the Finite
Element Analysis Software ANSYS (2002). Though, this continuum analysis does not allow
to visualize the crack propagation, but it provides the distribution of stresses inside the ball
during impact. It is known that crack generation and propagation are functions of stress.
Hence, the continuum analysis can be considered as an essential investigation.
In continuum analysis, the material is assumed to be continuous, homogeneous, isotropic and
it is treated as two-dimensional material, which is quite opposite in the case of the concrete
material. However, the continuum analysis is done to understand the patterns of stresses
generated inside the concrete ball when it is subjected to impact.
2.2. DEM model development
The Particle Flow Code developed by ITASCA (2002) based on the Discrete Element Method
(Cundall et al., 1979) models the movement and interaction of spherical particles and wall
segments. An explicit-time-marching calculation scheme is adopted. The following features
are applied to the concrete model:
a stiffness model, providing a linear elastic relation between the contact forces and the
relative particle displacement,
a slip model, so that two entities in contact may slip relative to each other,
a bond model, limiting the total normal and shear forces that the contact can carry.
Since the program needs the specification of micro-mechanical particle and contact
parameters such as stiffness and bond strength rather than classical macro-mechanical
3

parameters such as Young's modulus, the numerical model, so, has to be calibrated. So the
micro-properties of the model have to be changed until the simulated properties match the real
ones (Fig. 1). A maximum utilization of the real concrete properties gives a good start for a
successful simulation. A summary of the interpretation of micro-properties is given by
Konietzky (2002).
Yes
Utilization of the calibrated model for further impact simulations, in which new comminution conditions are investigated.
No
Variation of the micro-properties.
Pool of experimental data, e.g. digital movies,
particle size distribution and
liberation degree.
DEM-simulation of the impact and crack patterns. Calculation of the particle size
distribution and liberation degree.
Do experiment and simulation results match?
Input of the initial micro-properties of theparticles, which determine the macro-
properties of the model.
Fig. 1. Calibration procedure of the DEM model of a concrete ball, in which crack patterns, particle size distributions and liberation degrees obtained from experiments are chosen as references.
3. Experimental
Spherical shaped concrete samples of 150 mm in diameter of B35 strength category as
common material of civil engineering were chosen for the calibration experiments. These
experiments were carried out using a 250 mm caliber pneumatic cannon (Tomas et al., 1999),
in which the concrete ball is accelerated through a pipe by compressed air. The pipe joins the
4

impact room, where the sample crashes into the target. This event can be observed by a high
speed video camera. Process parameters such as air pressure and stressing velocity are
measured and recorded by a data logging system. Although the acceleration unit provides
stressing velocities up to 300 m/s, the experiments were carried out at the speed range of 10 to
70 m/s, which corresponds to the normally applied rotor velocity of impact type crushers.
After impaction the generated fragments were collected and analyzed to determine the
fracture pattern, particle size distribution and liberation degree.
4. Results and discussion
4.1. FEM Modeling of a concrete ball
An ANSYS model is considered for a two-dimensional ball of 150 mm in diameter impinging
on the target at the velocity of 50 m/s. The ball has 825 number of plane 182 type elements.
The surface to surface contact is adopted. The elastic modulus, density and Poisson’s ratio are
15 kN/mm2, 2382 kg/m3 and 0.28 respectively.
Y
X
Fig. 2. Grid of the ball (left) and stress distribution in Y impinging direction (center). The stresses are given in gray tones with numbers in N/m2. Negative sign shows the compression and positive shows the tension.
Figure 2 shows the maximum compressive stress, which is generated at the bottom of the ball.
Initially, the stress wave is propagated from the contact zone and moves towards the top of the
ball forming different stress zones. Figure 3 shows the major principal stress developed
during impaction. The cone has its maximum absolute change in values from compression to
5

tension. Hence, this region has a dominant effect on the crack generation, and so, the
boundary of this region initiates the crack with a similar shape.
Y
X
Fig. 3. Major principal stress distribution. The stresses are given in gray tones with numbers in N/m2. Negative sign shows the compression and positive shows the tension.
The transition from the compressive to tensile region takes place in the impacted zone, which
is similar to the shape of cone or half ellipse. This region is defined by Rumpf (1973),
Schönert (1993) and Tomas et al. (1999) as the cone of fines. It is the area, where first
disturbance and cracks occur while impacting.
The contact deformation initiates a small circular crack along the radius of the contact circle.
The crack follows this path and forms a wedge shaped fragment showing as a sharp cutting
edge effect. This sharp tip of the fragment penetrates the remaining cone. In that process,
shear stresses are generated at the interface between the cones on the opposite side of the
enhancement of the crack. During the propagation of the circular crack, meridian cracks
propagate and unbalanced stresses introduce many secondary cracks. How much this
phenomenon has occurred depends on the stress generated inside the ball during impaction.
4.2. DEM Modeling of a concrete ball
4.2.1. Creation of the concrete ball
The concrete ball is modeled in two-dimension using 2403 balls randomly arranged (Fig. 4).
In this assembly, 120 balls of 2 -16 mm in diameter represent the aggregate material and 2283
balls of 2.3 mm in diameter represent the hardened cement paste. Each particle group has its
6

own parameters, which differ widely in size, number, density and stiffness (Table 1). The
properties and their shares of the composition correspond to the real concrete of the strength
category B35.
Fig. 4. Cross-sectional area of the modeled 150 mm concrete ball. Balls marked by numbers describe the aggregate material.
The compressive and tensile strength of the concrete of 35 N/mm2 and 4 N/mm2 respectively
is simulated by variations of particle stiffness and bond strength between the spherical
particles (Table 1).
Table 1. Micro-properties of both particle groups and the modeled bonds of the DEM model
Characteristics Hardened cement paste Aggregate
Number and shape 2283 spheres 120 spheres
Diameter 2.3 mm 2-16 mm
Solid density, volume-fraction 1790 kg/m3, 30% 2570 kg/m3, 70%
Stiffness 20 MN/m 600 MN/m
Normalized spring stiffness of each bond 1000 GPa/m
Tensile strength of each bond 6.5 MPa
4.2.2. Calibration by means of crack patterns
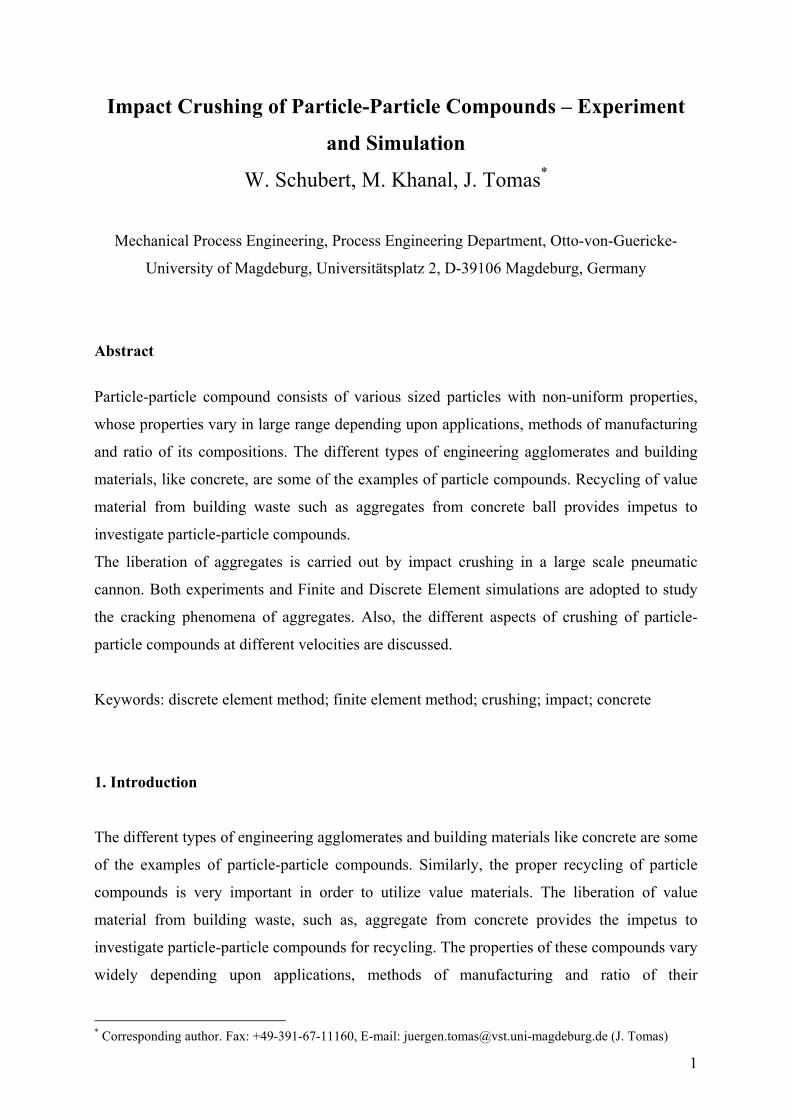
Fracture events in the pneumatic cannon are recorded by a high-speed video camera at a
frequency of 2000 frames/s (Tomas et al., 1999). The pictures in Fig. 5 show the impact of a
7
Fig. 5. The impact event.
concrete ball at the velocity of 53 m/s into a flat
wall in time steps of 0.2 milliseconds. A variety of
records of impact showing similar crack patterns
led to the idea to use pictures for calibration.
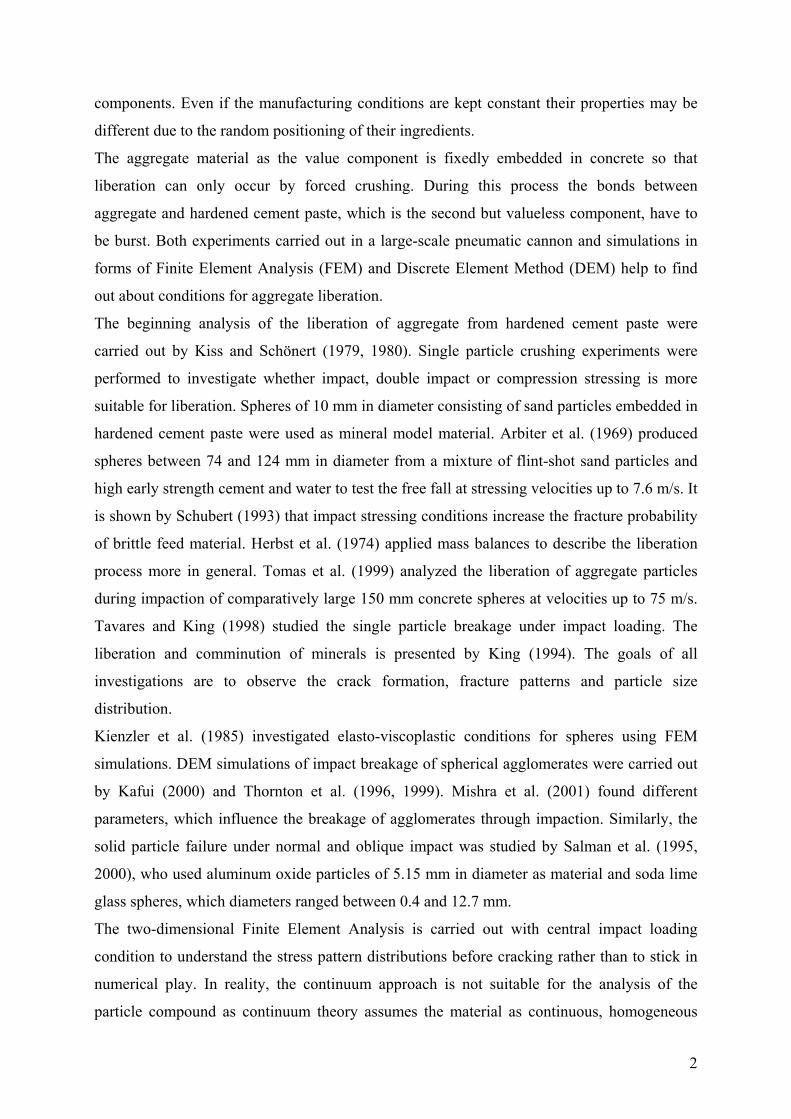
The development of the crack pattern during
impact is well explained as a recurrent event by
Rumpf (1973), Schönert (1993) and Tomas et al.
(1999). “After contact with the impact plate, the
point of contact undergoes a mainly plastic
deformation, extending to a comparatively large
contact surface so that a cone of fines is formed
due to a rapid, relatively unselective
disintegration as a result of the dynamic
compressive and shear stresses (Fig. 6). Between
the cone surface the surrounding concrete ball
material, shearing planes with shear stresses
form in addition to the compressive stresses.
Owing to the high velocity, this cone of fines is
immediately pressed into the concrete ball. ... A
ring tensile stress develops, resulting in the
concrete ball being cut into segments similar to
an orange.”
Fig. 6. Crack pattern in a concrete sphere.
8
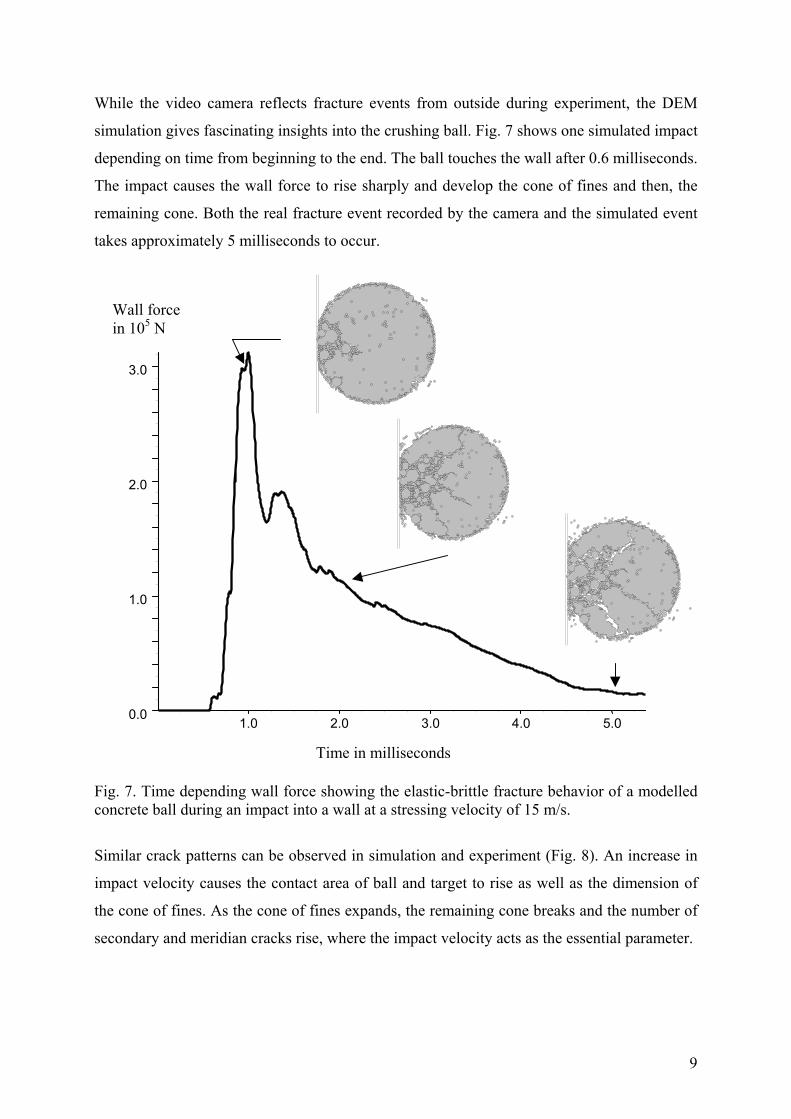
While the video camera reflects fracture events from outside during experiment, the DEM
simulation gives fascinating insights into the crushing ball. Fig. 7 shows one simulated impact
depending on time from beginning to the end. The ball touches the wall after 0.6 milliseconds.
The impact causes the wall force to rise sharply and develop the cone of fines and then, the
remaining cone. Both the real fracture event recorded by the camera and the simulated event
takes approximately 5 milliseconds to occur.
Wall force in 105 N
3.0
2.0
1.0
0.0 5.0 4.0 3.0 2.0 1.0
Time in milliseconds
Fig. 7. Time depending wall force showing the elastic-brittle fracture behavior of a modelled concrete ball during an impact into a wall at a stressing velocity of 15 m/s.
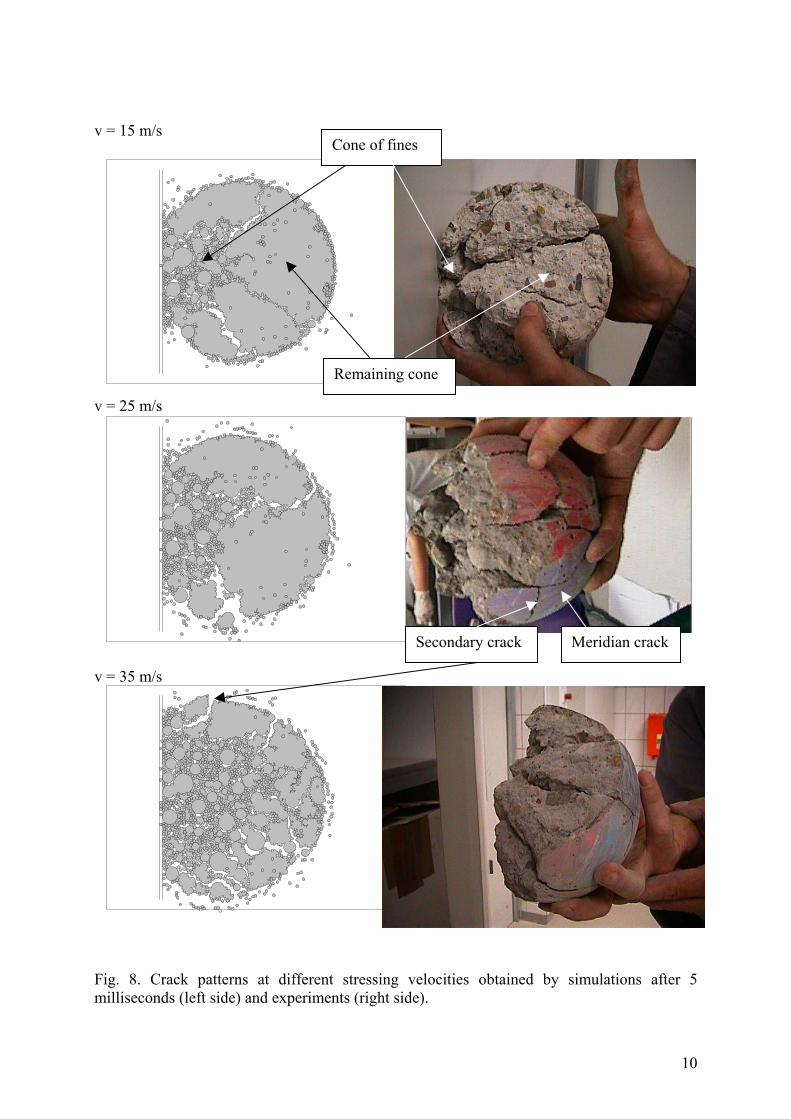
Similar crack patterns can be observed in simulation and experiment (Fig. 8). An increase in
impact velocity causes the contact area of ball and target to rise as well as the dimension of
the cone of fines. As the cone of fines expands, the remaining cone breaks and the number of
secondary and meridian cracks rise, where the impact velocity acts as the essential parameter.
9
v = 15 m/s
v = 25 m/s
v = 35 m/s
Meridian crackSecondary crack
Remaining cone
Cone of fines
Fig. 8. Crack patterns at different stressing velocities obtained by simulations after 5 milliseconds (left side) and experiments (right side).
10
4.2.3. Calibration by means of particle size distributions
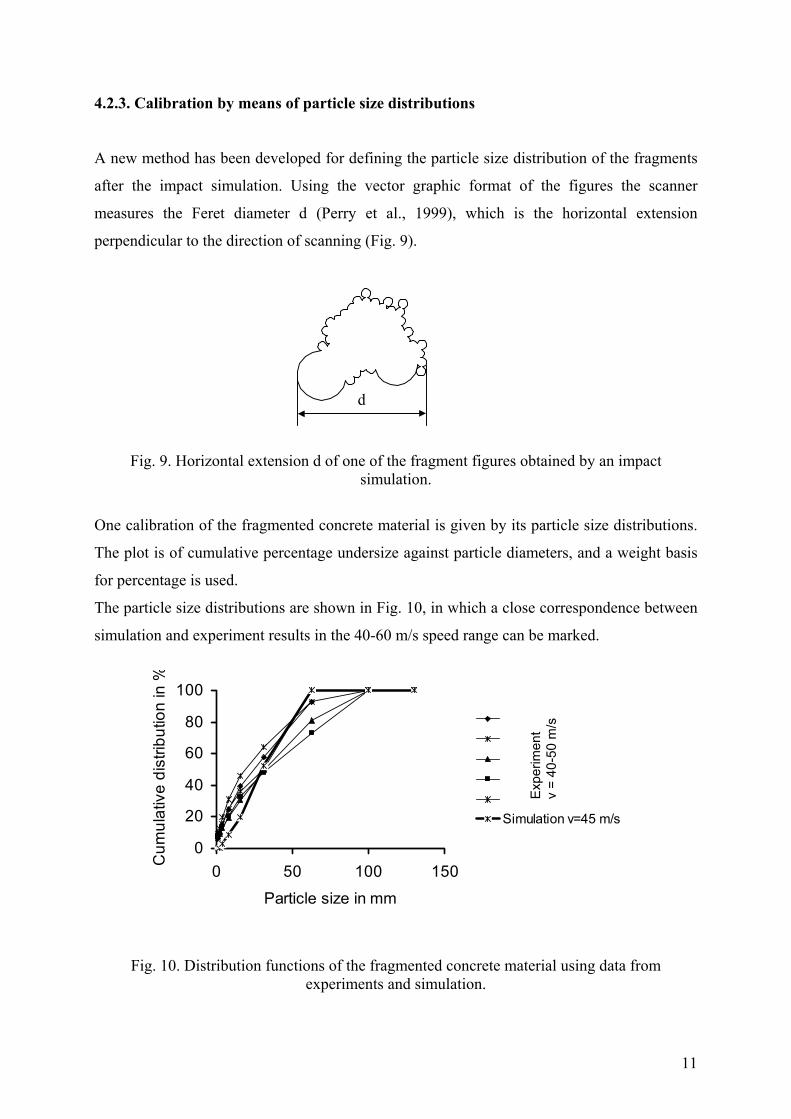
A new method has been developed for defining the particle size distribution of the fragments
after the impact simulation. Using the vector graphic format of the figures the scanner
measures the Feret diameter d (Perry et al., 1999), which is the horizontal extension
perpendicular to the direction of scanning (Fig. 9).
d
Fig. 9. Horizontal extension d of one of the fragment figures obtained by an impact simulation.
One calibration of the fragmented concrete material is given by its particle size distributions.
The plot is of cumulative percentage undersize against particle diameters, and a weight basis
for percentage is used.
The particle size distributions are shown in Fig. 10, in which a close correspondence between
simulation and experiment results in the 40-60 m/s speed range can be marked.
0
20
40
60
80
100
0 50 100 150
Particle size in mm
Cum
ulat
ive
dist
ribut
ion
in %
Simulation v=45 m/s
Exp
erim
ent
v =
40-5
0 m
/s
Fig. 10. Distribution functions of the fragmented concrete material using data from experiments and simulation.
11

4.2.4. Calibration by means of liberation degree
The fragmented parts obtained by simulation are scanned to determine the liberation degree.
During this process each aggregate particle is checked for adhered neighbor particles and
divided into the two categories 'liberated' and 'non-liberated'. An aggregate particle is
considered to be non-liberated when the number of its adhered hardened cement paste
particles reaches not more than 6, which corresponds to an average rate of 5% of impurities
often occurring in recycling practice.
The liberation degrees increase to 60% in the velocity range of 50–55 m/s and show the
simulation results in a good agreement with the experimental data (Fig. 11).
0
10
20
30
40
50
60
70
10 30 50Stress velocity in m/s
Libe
ratio
n de
gree
in %
Experiment
Simulation
Exponentiell(Simulation)
Fig. 11. Liberation degree of the aggregate material obtained by experiments and simulation.
4.2.5. Simulation of different impact geometries and their influence on the liberation
degree
The trial and error method has been adopted to find the optimal impact geometry with the
best, i.e. highest, liberation degree. The concrete ball model composition was kept constant so
that always the same model of concrete ball could be used for simulations.
12
The following conditions were varied to have different stresses:
the impact geometry, e.g. sphere-wall or sphere-tip,
magnitude and direction of the stressing velocity,
stressing events, i.e. single and multiple.
Mostly, the simulations were carried out at velocities between 30 and 60 m/s since the model
calibration matches its best results in this range (compare Fig. 11).
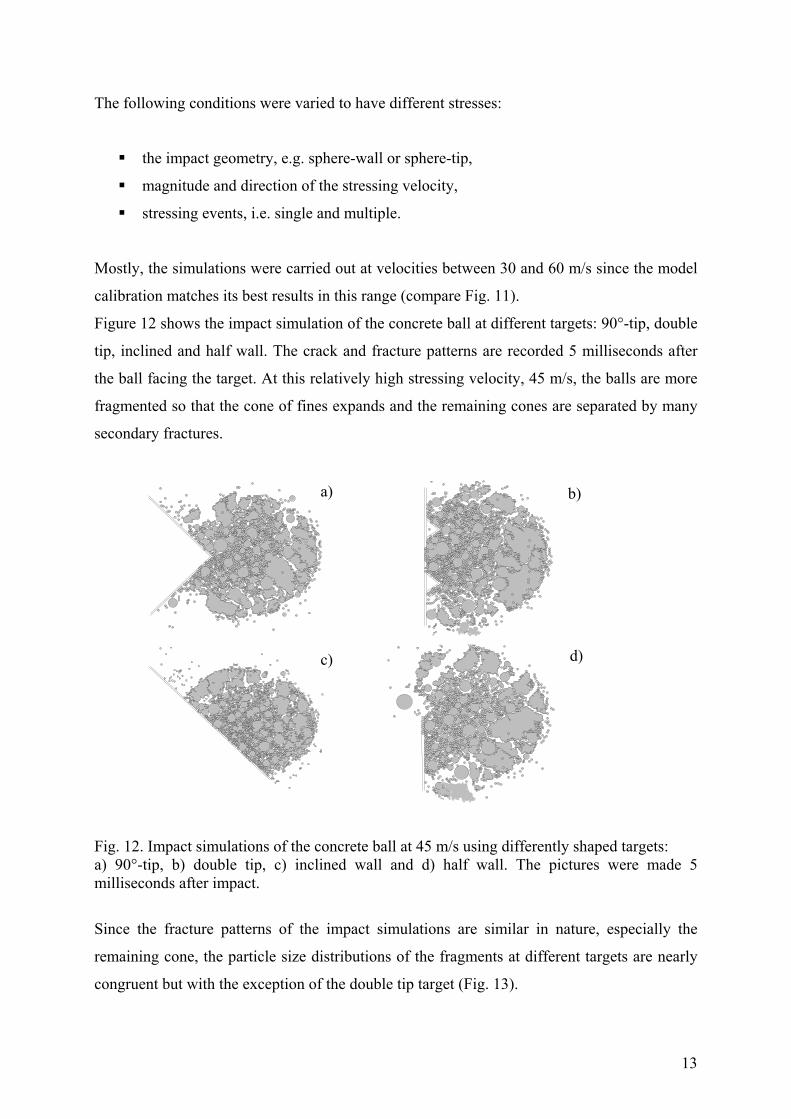
Figure 12 shows the impact simulation of the concrete ball at different targets: 90°-tip, double
tip, inclined and half wall. The crack and fracture patterns are recorded 5 milliseconds after
the ball facing the target. At this relatively high stressing velocity, 45 m/s, the balls are more
fragmented so that the cone of fines expands and the remaining cones are separated by many
secondary fractures.
c)
a) b)
d)
Fig. 12. Impact simulations of the concrete ball at 45 m/s using differently shaped targets: a) 90°-tip, b) double tip, c) inclined wall and d) half wall. The pictures were made 5 milliseconds after impact.
Since the fracture patterns of the impact simulations are similar in nature, especially the
remaining cone, the particle size distributions of the fragments at different targets are nearly
congruent but with the exception of the double tip target (Fig. 13).
13
0
20
40
60
80
100
0 50 100 150
Particle size in mm
Com
mul
ativ
e di
stru
butio
n in
%
Flat wallSingle tipDouble tipInclined wallHalf wall
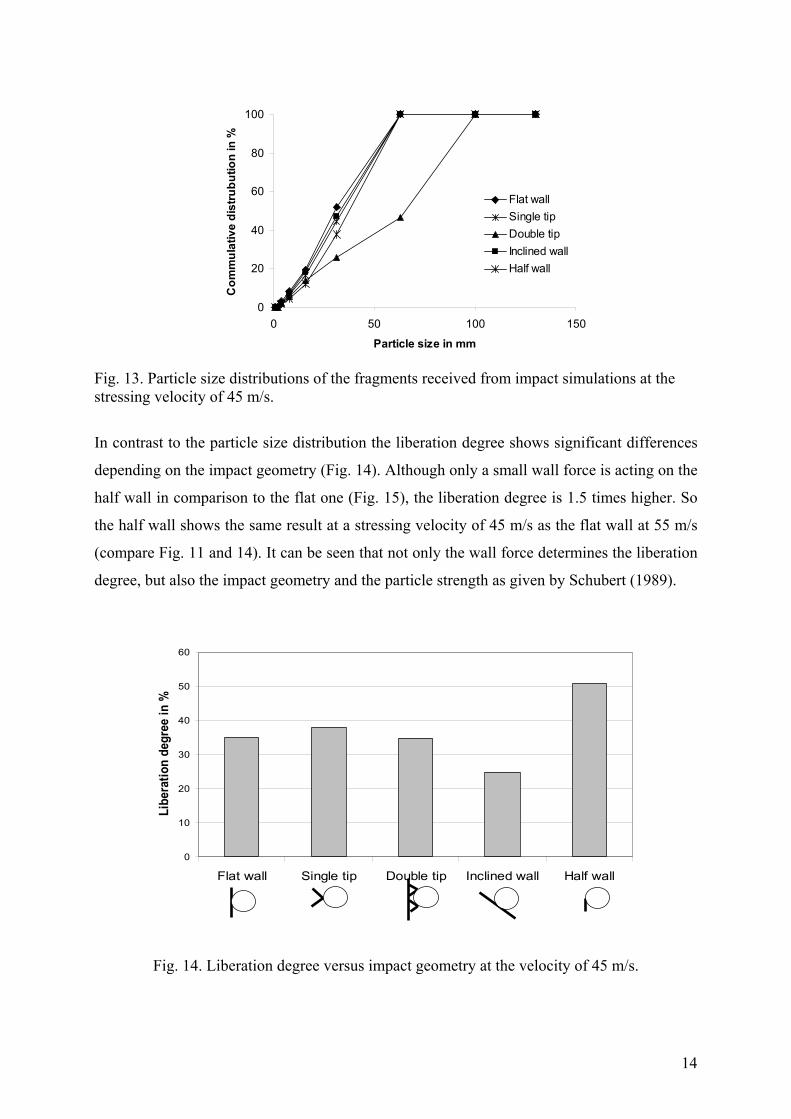
Fig. 13. Particle size distributions of the fragments received from impact simulations at the stressing velocity of 45 m/s.
In contrast to the particle size distribution the liberation degree shows significant differences
depending on the impact geometry (Fig. 14). Although only a small wall force is acting on the
half wall in comparison to the flat one (Fig. 15), the liberation degree is 1.5 times higher. So
the half wall shows the same result at a stressing velocity of 45 m/s as the flat wall at 55 m/s
(compare Fig. 11 and 14). It can be seen that not only the wall force determines the liberation
degree, but also the impact geometry and the particle strength as given by Schubert (1989).
0
10
20
30
40
50
60
Flat wall Single tip Double tip Inclined wall Half wall
Libe
ratio
n de
gree
in %
Fig. 14. Liberation degree versus impact geometry at the velocity of 45 m/s.
14

1.0 2.0 3.0 4.0 5.0Time in s x10 -̂3
0.0
0.5
1.0
1.5
2.0
2.5
3.0
3.5
4.0
4.5
5.0
5.5
6.0
6.5
Wall force in N x10^5
Flat wall
Half wall
Fig. 15. Wall force depending on time and impact geometry during the simulated impact at a stressing velocity of 45 m/s.
5. Conclusion
Both DEM and FEM impact simulations show similar disturbed regions. Depending on the
impact velocity the cracks are furthering inside along as meridian and secondary cracks. With
the help of the Discrete-Element-Method, particle size distributions and liberation degrees of
the comminution process can be predicted with high precision.
To approximate the model parameters to the real concrete properties a precise calibration
procedure is absolutely necessary. Therefore a large number of experiments using the
pneumatic cannon was carried out.
A new scanning method was developed for the transition from simulation results to process
engineering parameters such as liberation degree and particle size. Different types of
simulations were compared and found that, the half wall as the impact target gives the best
results concerning liberation degree.
Acknowledgements
The authors would like to acknowledge The German Research Foundation for the financial
support.
15

References
Arbiter, N., Harris, C. C., Stamboltzis, G. A., 1969. Single fracture of brittle spheres. Soc. Miner. Eng. AIME, Trans., 244: 118-133.
Cundall, P. A., Strack, O. D. L., 1979. A distinct element model for granular assemblies. Geotechnique, 29: 47-65.
Herbst, J. A., Grandy, G. A., Fuerstenau, D. W., 1973. Population balance models for the design of continuous grinding mills. Proceedings of the 10th Int. Min. Proc. Congress. Inst. of Min. and Metal., London, pp. 23-45.
Kafui, K. D., Thornton, C., 2000. Numerical simulations of impact breakage of a spherical crystalline agglomerate. Powder Technology, 109: 113-132.
Kienzler, R., Baudendistel, E., 1985. Numerische Beanspruchungsanalyse einer definiert belasteten Kugel, Technical report Schm 522r3-2/4 , German Research Foundation (DFG), Germany.
King, R. P., 1994. Comminution and liberation of minerals. Minerals Engineering, 7 (2-3): 129-140. Kiss, L., 1979. Vergleich der Prall- und Druckzerkleinerung eines zweikomponentigen, mineralischen
Modellstoffes. Dissertation, Universität Karlsruhe, Germany. Kiss, L. and Schönert, K., 1980. Liberation of two component material by single particle compression
and impact crushing. Aufbereit.-Tech., 30 (5): 223-230. Konietzky, H., 2002. Numerical Modeling in Micromechanics via Particle Methods. Proc. 1st Int.
Symp. Gelsenkirchen/Germany, A. A. Balkema Publishers, The Netherlands. Perry, R. H., Green, D. W., 1999. Perry's Chemical Engineers' Handbook, 7th ed., The McGraw-Hill
Companies Inc., U. S., p. 20-8. Rumpf, H., 1973. Physikalische Aspekte der Zerkleinerung, Ähnlichkeitsgesetz der Bruchmechanik
und die Energieausnutzung der Einzelkornzerkleinerung. Aufbereit.-Tech., 14 (2): 59-71. Salman, A. D., Gorham, D. A., Verba, A., 1995. A study of solid particle failure under normal and
oblique impact. Wear, 186-187: 92-98. Salman, A. D., Gorham, D. A., 2000. The fracture of glass spheres. Powder Technology, 107: 179-
185. Schönert, K., 1993. Grundlagen zur Feinzerkleinerung. Preprints, GVC-Dezembertagung, Köln,
Germany. Schubert, H., 1989. Aufbereitung fester mineralischer Rohstoffe. Band 1, Deutscher Verlag für
Grundstoffindustrie, Leipzig, Germany, pp. 135-136. Schubert, H., 1993. Zur Energieausnutzung bei Zerkleinerungsprozessen. Aufbereit.-Tech., 34 (10):
495-505. Tavares, L. M., King, R. P., 1998. Single-particle fracture under impact loading. Int. J. Miner.
Process., 54 (1): 1-28. Thornton, C., Ciomocos, M. T., Adams, M. J., 1999. Numerical simulations of agglomerate impact
breakage. Powder Technology, 105: 74-82. Tomas, J., Schreier, M., Gröger, T., Ehlers, S., 1999. Impact crushing of concrete for liberation and
recycling. Powder Technology, 105: 39-51. ANSYS 6.1, 2002. Manual of the Finite Element Method software. ANSYS Inc., Canonsburg, U.S. PFC2D Version 3.0, 2002. Manual of the Particle Flow Code in 2 Dimensions software. Itasca
Consulting Group Inc., Minneapolis, Minnesota, U.S.
16