impact factor 3.582-case studies journal issn (2305-509x
TRANSCRIPT
Impact Factor 3.582-Case Studies Journal ISSN (2305-509X) – 2015 Volume 4, Issue 1
http://www.casestudiesjournal.com Page 35
Comparative Analysis of performance of Islamic Vis a Vis Conventional Banking of
Pakistan during Global Financial Crisis 2007-2010
Author,s Details
Dr Ambreen Zeb Khaskhelly, Assistant Professor Department of Economics University of Sindh Jamshoro
Abstract This study aims at to conduct a comparative analysis of performance of on the impact of global financial crisis on Islamic
and conventional banking in Pakistan during the period the 2007-2010. Three performance indicators have been
considered for this purpose namely profitability, liquidity & Soundness. This study covers a four year period from 2007 to
2010.Based on the performance of 2007 the impact has been analyzed by using financial ratios as analysis tool. The
financial ratios like Return on Assets (ROA), Return on Equity (ROE), Loan to Asset Ratio(LAR), Loan to Deposit ratio
(LDR), Assets Utilization(AU), Debt to equity Ratio(DER) and Income to Expense ratio(IER) are used to evaluate
performance of sample banks. Primary data was also collected through survey by using a closed ended questionnaire.
The study explores two main findings (I) there seems no any major variation in liquidity & profitability of both types of
the commercial banks (II) the Islamic banks hold more liquid assets than conventional banks- counterparts, which
affected their liquidity.While analyzing it was also concluded that cost of deposit on conventional side increased as
compared to Islamic Banking and Non Performing Loans were increased after multi year stability and control on healthy
loans on conventional side.
Key Words: Global Financial Crisis, Islamic, Conventional Banks, Liquidity, profitability, Non Performing Loans
Introduction:
The main objectives of this paper are to review the growth of the Islamic banking with respect to their counterpart
conventional banking during the global financial crisis which started in US subprime mortgage and engulfed the entire
globe. While the degree of economic damage varied across the countries, economists are of the same opinion that the
current recession is the worst since the Great Depression of 1930. These are in essence credit crisis which are direct result
of collapse of the mortgage market in United States.
The study is basically aimed at to evaluate and analyze the performance of conventional banking to its counterpart Islamic
banking in Pakistan during the period 2007-2010. Specifically, focus is on two banks viz a viz Meezan bank Limited and
Bank Alfalah Limited one from Islamic side and other from conventional side based on their deposit base ,net work and
products and services provided. Data were collected from their annual reports. In this era of modern technology and very
much competitive financial market it is pretty common to use this technique of analysis for comparison of Bank’s
performance.
Bird’s eye view of Global Financial crisis
The financial crises got extraordinary impetus during the period from 2004 to 2007, stock markets witnessed slow down
and many large banks of the developed economies applied for bailout to evade collapse.
During 2009 global output dropped by 2.2 % percent and the unemployment rate increased by 7 % percent and global
output declined by 2.2 per cent , resulted into more than 35 million people lay off .
The main causes of crises were imprudent lending for a pretty long period of time ,fair value of collateral accepted was
ignored, repayment capacity of borrowers was ignored even down payment was ignored.relaxation of regulations by US
government particularly repeal of the Glass-Steagall Act of 1933 ,improper rating was awarded by rating agencies
against attractive incentives and risk rating mechanism was totally ignored.
Impact of Global Financial Crisis on developed economies
Impact Factor 3.582-Case Studies Journal ISSN (2305-509X) – 2015 Volume 4, Issue 1
http://www.casestudiesjournal.com Page 36
It caused collapse of Financial Institutions globally, includes giant financial & insurance institutions like Lehman
Brothers, American International Group Inc, Fannie Mae, Freddie Mac etc. Central Banks in weak economies like Ice
Land turn out to be bankrupt, Investors lost enormous amount globally severe liquidity crunch and credit squeeze for the
financial sector occurred.
House prices declined by 20% from its peak in 2006 and home equity valued at $13 trillion in the Unites States reached
at lowest level of $8.8 trillion in the mid of 2008. Many banks applied for bailout to avoid bankruptcy which led to a
situation of layoffs and resulted into unemployment which reached its peak level in 2008.
Impact of Global Financial Crisis on Pakistan
A strained global economic recession has seized FDI( Foreign Direct Investment) which declined by 47.5 % during the
period July-April2008-09 However remittances by workers’ from abroad remained unaffected which were around US $
6.4 bln. Pakistan was unable to raise funds from capital markets of the world as entire globe was gripped due to such
unprecedented global financial crisis. Literally Pakistan’s presence was very much limited in the international capital
markets during 2008-09.
Overall Impact on Banking Industry in Pakistan
Keeping in view the demands for financial & economic globalization, Banking system of Pakistan also initiated to link
itself with global financial market.
Consequent upon rumours spread over the country regarding Seizure of Lockers and freezing of Foreign Currency
Accounts (FCY) Pakistan’s financial sector experienced some shocks, which resulted into noticeable withdrawals of
deposits liquidity problem. To lubricate the market suffering from liquidity crunch the central bank of Pakistan injected
round about $ 100 million in the market and also lowered its statutory requirements by 4 %.
Review of Literature
There is a lot of empirical literature regarding the root causes Global Financial Crisis & its impact on banking industry
and world economy as well. A number of reports & research papers attempted to examine the implications and effects of
Global financial Crisis. In case of Pakistan very little empirical literature is available on the various financial and
operational dimensions.
An attempt has been made to analyze and explore the causes and consequences of Global financial Crisis on various
dimensions of Banking industry in Pakistan particularly performance of sample banks with respect to their liquidity
,solvency & profitability. The existing literature explores the causes globally is reviewed as under.
According to T Schuermnn & A.B.Ashcraft, et al, 2007, the root cause of the crisis is the process of collateralization,
which gave birth to the global financial crisis. Near about 75 per cent subprime mortgage loans were linked directly with
the securitization process. Financial derivatives played vital role in securitization of the loans in special compartment of
CLOs (collateralized loan obligations) and CDOs (collateralized debt obligations
Dr Umer Chapra -2008 in his research regarding financial crisis has claimed that the current global economic recession is
worse than the Great Depression of 1929. He further argued that the growth of banking industry will remain slow and
effects of crisis may remain for longer period of time. He further explained on credit problem ,he analyzed that more
profit means more lending and high leverage is the reason which makes excess lending possible and results into artificial
boom in prices of assets and gives rise in speculative investment and consumption. Such high leverage is difficult to
unwind and this vicious cycle of selling ultimately leads to steep decline in prices rather to downturn and outcome is
financial crisis.
Lowenstein (2008) explores that the regulators and central banks have allowed the recurrence of crisis who have failed to
display financial discipline even forget the past events from which lessons should be learnt. It was need of hour to
recognize the early warning signals so that financial derivatives could be managed more firmly and tightly. Rather they
promoted such risky business instead by behaving in a speculative manner and looked for bailout.
Impact Factor 3.582-Case Studies Journal ISSN (2305-509X) – 2015 Volume 4, Issue 1
http://www.casestudiesjournal.com Page 37
Nicholson, 2008 confirms that global financial crisis which gets start from United States has engulfed the entire world.
The crisis was so severe that it not only affected US financial industry but crashed stock exchanges of many countries of
Asia & Europe. Global Financial crisis also affected Socialist economies apart from capitalist, Russian stock Market also
dropped significantly during May 2008.
Bartlett (2008) has expressed his point of view on the causes of financial crisis, he stated that the crises which started with
the fall down of sub-prime mortgage industry in states but the intensity was so severe which engulfed the globe.
According to him losses were unprecedented in the history ,on such risky assets (MBOs, CLOs, CDOs and subprime
securities) accounted for about US $945 billion during March 2008 which he confirmed that these losses are biggest one
even in comparison of banking crisis of Japan accounted for to US$ 780 billion approximately during 90s,During Asian
crisis the losses were accounted for around US $ 420 billion during 90s and Saving & Loan Disaster of United States
were around US $ 380 billion during 1986-95
JPMorgan et al, 2006, explored that Mortgage-Backed securities which were highly risky has witnessed a tremendous
expansion after 1998 although it initiated growth in 70s but its use was very much limited in mortgaged backed
industry before late90s.
Wim Naude has very clearly expressed that there were several causes of global financial crisis which include inter alia
weak regulatory checks ,easy access to cheap money, Irresponsible, imprudent & aggressive lending ,rise in housing
prices with the start of the century which unduly facilitated the mortgage backed loans around one trillion US dollars
particularly to those households who otherwise were not entitled to avail the facility on the basis of very little repaying the
risk so arising was covered by securitization. The predictable income from such infected finances were packed with
other securities like CDO (Collateralized Debt Obligations) & were sold onward by getting required rating of AAA from
world fame rating agencies for which they were offered handsome incentives. Moral Hazards & Conflicts of interest were
common all over in the system.
Yilmaz (2008) has clearly fixed responsibility on U.S mortgage industry that extended mortgage finance facilities to sub
prime clients thus resulted into occurrence of severe nature of financial crisis, initially anticipated the losses in the range
of US $ 300 To 600 billion which later were accounted for about US $1 trillion.
Research Methodology
Ratio Analysis
In this study Banks’ performance have been measured by using ratio analysis technique, the main advantage of this
method is to remove disparity based on their size of deposits ,advances & network and brings the banks at par. This
method was also used by other researchers too such as Ahmed & Hassan (2007),Sabi(1996) and Chen & Shimerda (1981).
Financial Analysis by using Ratios
Profitability Ratios
Return on Assets (ROA):
This ratio is indicator of evaluating managerial efficiency as to how bank management uses its assets profitably. Higher
ratio is better managerial efficiency indicator and shows better performance and vice versa.
Formula used for ROA is, Return on Assets = Net Profit/Total Assets
Return on Equity (ROE):
This ratio is also indicator of managerial efficiency and shows how well a bank invests its capital to generate income. It
evaluates efficiency at generating profits from every unity of equity. Higher ratio is better managerial efficiency indicator
and shows better performance and vice versa.
Impact Factor 3.582-Case Studies Journal ISSN (2305-509X) – 2015 Volume 4, Issue 1
http://www.casestudiesjournal.com Page 38
Formula used for ROE is, Return on Equity =Net Profit/Equity
Credit Risk Performance
Equity to Total Assets (ETA):
It measures the credit risk of banks, it shows as to how bank protects against its assets & investments. Basically it tells
about capacity of shock absorbance arising out from potential losses of loaned assets and investments. Higher ratio is
better indicator of maintaining the loan losses.
Formula used for ETA is, Equity to Total Assets= Common Equity/Assets
Capital Adequacy Ratio (CAR):
It measures banks capital against its Risk Weighted Assets (RWA) /Credit Exposure. Higher ratio does not always mean
good performance but indicates that large amount of capital is maintained to meet risks arising out from its credit
exposures. There are three types of risks, Credit Risks, Market Risks & Operational Risks.
Formula used for CAR is, Tier-I capital +Tier Two capital / Risk Weighted Assets
Management Efficiency
Income Expense Ratio (IER):
This ratio measures the amount of income earned in comparison to operating expenses. This is very common ratio used by
bank management to improve efficiency by controlling operating expenses which results in better income generation.
Higher ratio means better performance in terms of profit with respect to operating expenses.
Formula used for IER is, Income Expense Ratio=Total Income/Total Operating Expenses
Management Ability
Asset Utilization (AU):
This tells how effectively bank’s management uses its assets for revenue generation. Higher ratio is indicator of better use
of assets to generate income & vice versa.
Formula used for AU is, Asset Utilization=Total Revenue/Total Assets
Loan to Deposits Ratio: This ratio indicates that how a Bank utilizes its deposits by extending loans, relatively low ratio
contributes higher liquidity and results in low profits and low ratio creates stress for managing liquidity but higher profits.
Formula used for LDR is, Loan to Deposits Ratio =Total Loans/Total Deposits
Loans to Assets Ratio: This ratio measures that what percentage a bank has invested in shape of loans, the higher ratio
indicates less liquidity and vice versa. But it is pertinent to mention that high ratio leads to better profitability with risk of
solvency.
Formula used for LAR is, Loan to Deposits Ratio =Total Loans/Total Assets
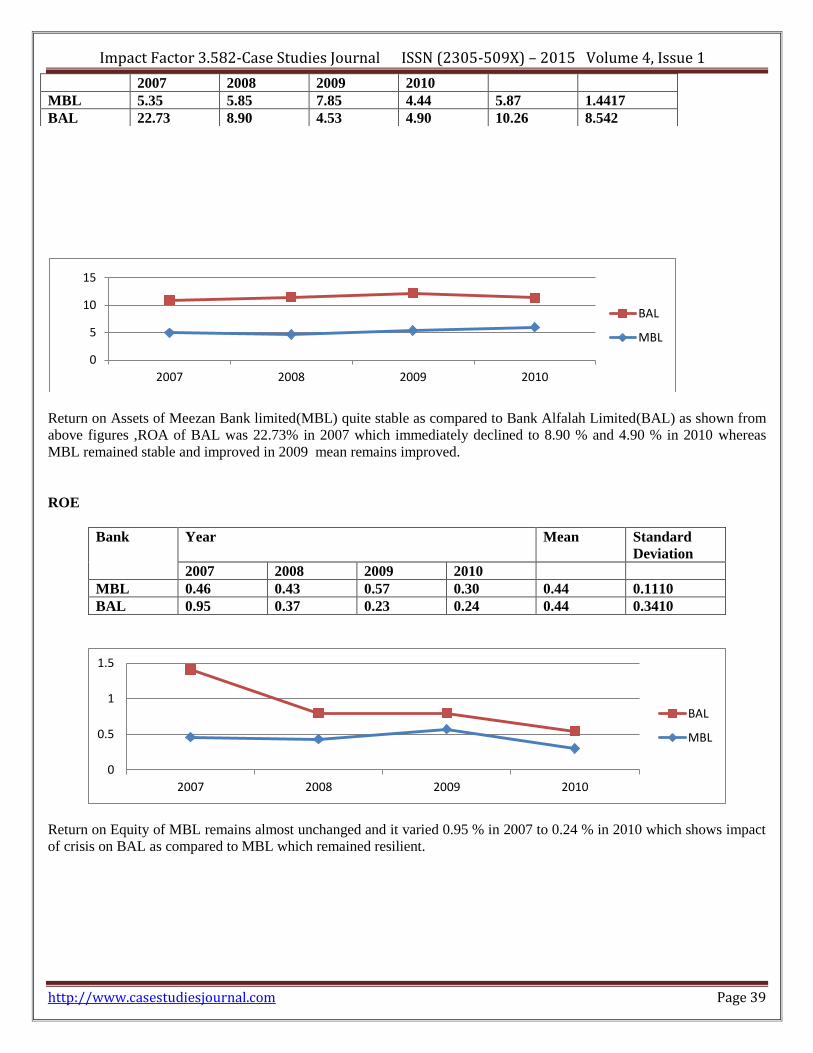
ROA
Bank Year Mean Standard
Deviation
Impact Factor 3.582-Case Studies Journal ISSN (2305-509X) – 2015 Volume 4, Issue 1
http://www.casestudiesjournal.com Page 39
Return on Assets of Meezan Bank limited(MBL) quite stable as compared to Bank Alfalah Limited(BAL) as shown from
above figures ,ROA of BAL was 22.73% in 2007 which immediately declined to 8.90 % and 4.90 % in 2010 whereas
MBL remained stable and improved in 2009 mean remains improved.
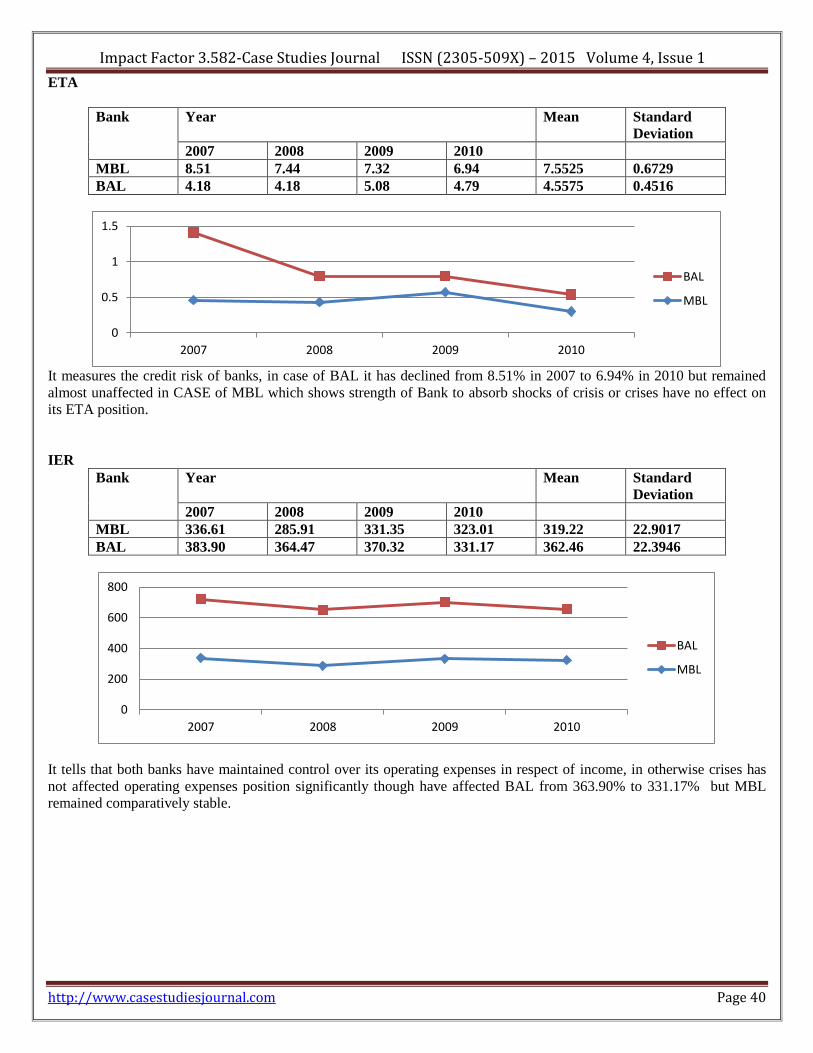
ROE
Bank Year Mean Standard
Deviation
2007 2008 2009 2010
MBL 0.46 0.43 0.57 0.30 0.44 0.1110
BAL 0.95 0.37 0.23 0.24 0.44 0.3410
Return on Equity of MBL remains almost unchanged and it varied 0.95 % in 2007 to 0.24 % in 2010 which shows impact
of crisis on BAL as compared to MBL which remained resilient.
0
5
10
15
2007 2008 2009 2010
BAL
MBL
0
0.5
1
1.5
2007 2008 2009 2010
BAL
MBL
2007 2008 2009 2010
MBL 5.35 5.85 7.85 4.44 5.87 1.4417
BAL 22.73 8.90 4.53 4.90 10.26 8.542
Impact Factor 3.582-Case Studies Journal ISSN (2305-509X) – 2015 Volume 4, Issue 1
http://www.casestudiesjournal.com Page 40
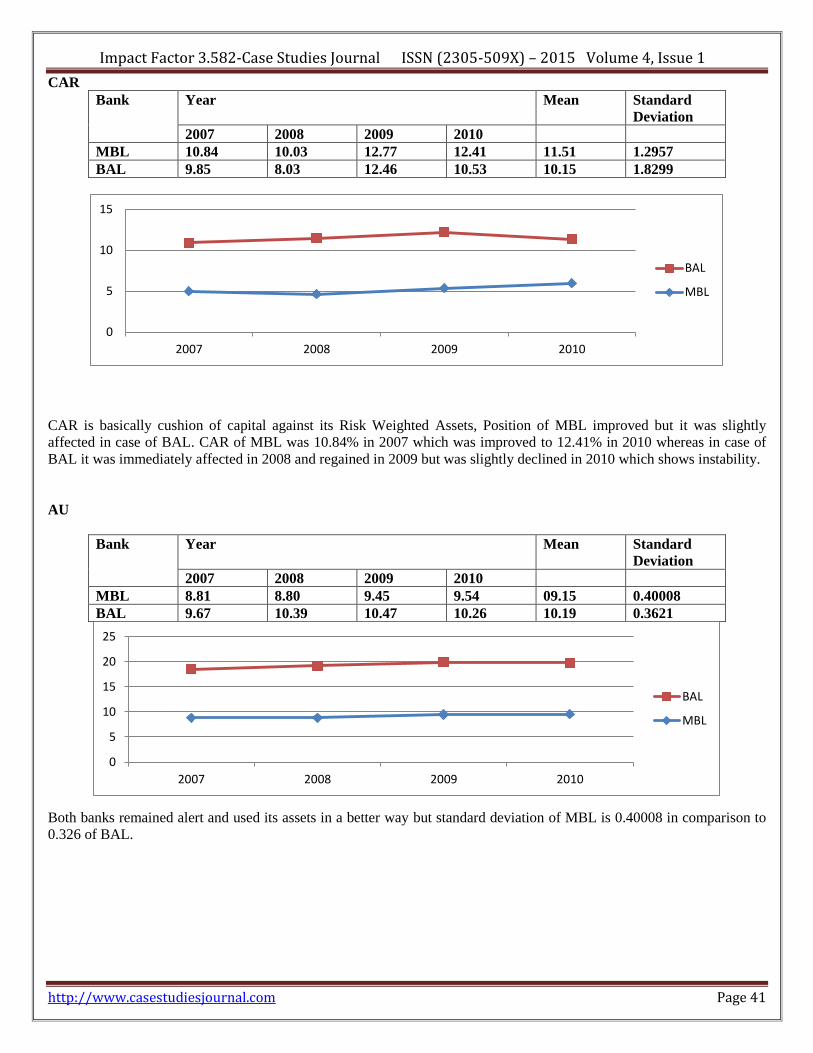
ETA
Bank Year Mean Standard
Deviation
2007 2008 2009 2010
MBL 8.51 7.44 7.32 6.94 7.5525 0.6729
BAL 4.18 4.18 5.08 4.79 4.5575 0.4516
It measures the credit risk of banks, in case of BAL it has declined from 8.51% in 2007 to 6.94% in 2010 but remained
almost unaffected in CASE of MBL which shows strength of Bank to absorb shocks of crisis or crises have no effect on
its ETA position.
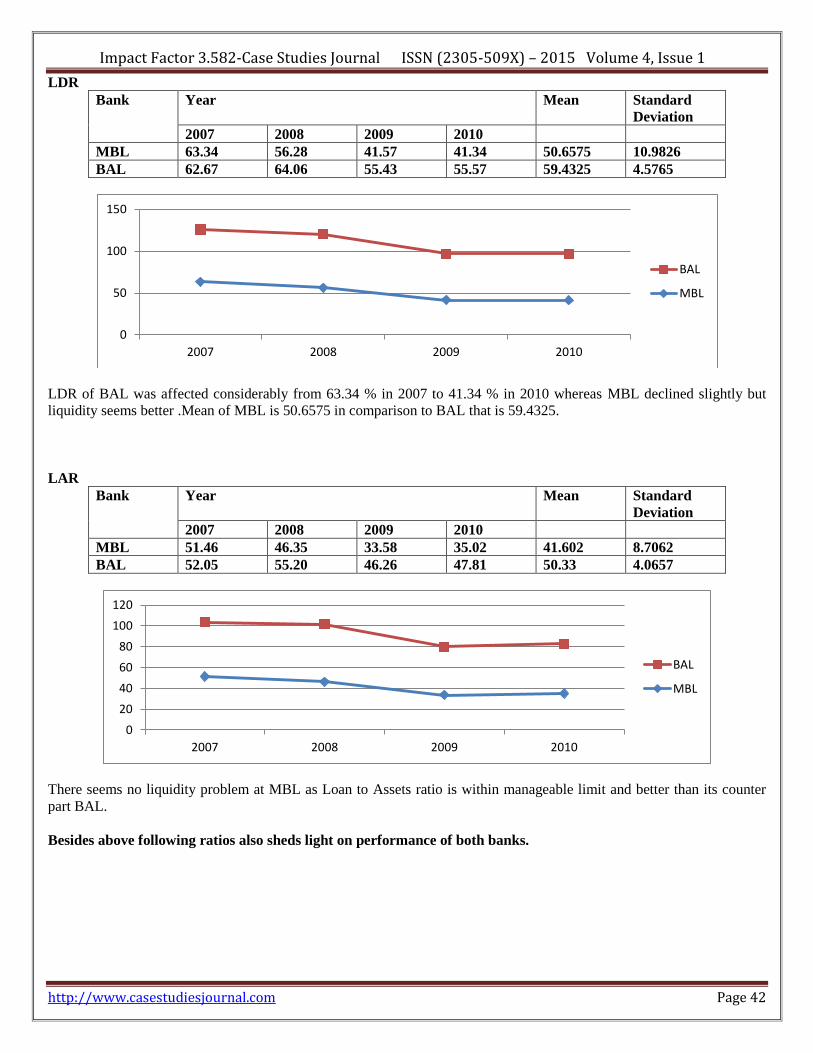
IER
Bank Year Mean Standard
Deviation
2007 2008 2009 2010
MBL 336.61 285.91 331.35 323.01 319.22 22.9017
BAL 383.90 364.47 370.32 331.17 362.46 22.3946
It tells that both banks have maintained control over its operating expenses in respect of income, in otherwise crises has
not affected operating expenses position significantly though have affected BAL from 363.90% to 331.17% but MBL
remained comparatively stable.
0
0.5
1
1.5
2007 2008 2009 2010
BAL
MBL
0
200
400
600
800
2007 2008 2009 2010
BAL
MBL
Impact Factor 3.582-Case Studies Journal ISSN (2305-509X) – 2015 Volume 4, Issue 1
http://www.casestudiesjournal.com Page 41
CAR
Bank Year Mean Standard
Deviation
2007 2008 2009 2010
MBL 10.84 10.03 12.77 12.41 11.51 1.2957
BAL 9.85 8.03 12.46 10.53 10.15 1.8299
CAR is basically cushion of capital against its Risk Weighted Assets, Position of MBL improved but it was slightly
affected in case of BAL. CAR of MBL was 10.84% in 2007 which was improved to 12.41% in 2010 whereas in case of
BAL it was immediately affected in 2008 and regained in 2009 but was slightly declined in 2010 which shows instability.
AU
Bank Year Mean Standard
Deviation
2007 2008 2009 2010
MBL 8.81 8.80 9.45 9.54 09.15 0.40008
BAL 9.67 10.39 10.47 10.26 10.19 0.3621
Both banks remained alert and used its assets in a better way but standard deviation of MBL is 0.40008 in comparison to
0.326 of BAL.
0
5
10
15
2007 2008 2009 2010
BAL
MBL
0
5
10
15
20
25
2007 2008 2009 2010
BAL
MBL
Impact Factor 3.582-Case Studies Journal ISSN (2305-509X) – 2015 Volume 4, Issue 1
http://www.casestudiesjournal.com Page 42
LDR
Bank Year Mean Standard
Deviation
2007 2008 2009 2010
MBL 63.34 56.28 41.57 41.34 50.6575 10.9826
BAL 62.67 64.06 55.43 55.57 59.4325 4.5765
LDR of BAL was affected considerably from 63.34 % in 2007 to 41.34 % in 2010 whereas MBL declined slightly but
liquidity seems better .Mean of MBL is 50.6575 in comparison to BAL that is 59.4325.
LAR
Bank Year Mean Standard
Deviation
2007 2008 2009 2010
MBL 51.46 46.35 33.58 35.02 41.602 8.7062
BAL 52.05 55.20 46.26 47.81 50.33 4.0657
There seems no liquidity problem at MBL as Loan to Assets ratio is within manageable limit and better than its counter
part BAL.
Besides above following ratios also sheds light on performance of both banks.
0
50
100
150
2007 2008 2009 2010
BAL
MBL
0
20
40
60
80
100
120
2007 2008 2009 2010
BAL
MBL
Impact Factor 3.582-Case Studies Journal ISSN (2305-509X) – 2015 Volume 4, Issue 1
http://www.casestudiesjournal.com Page 43
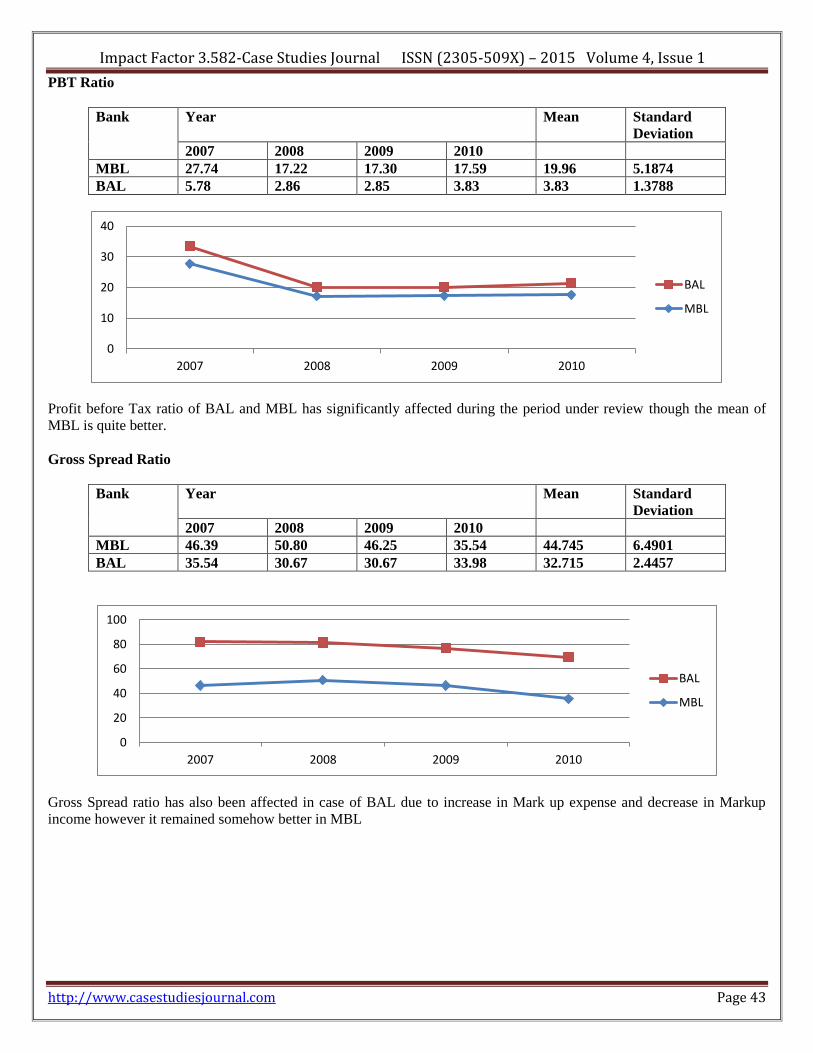
PBT Ratio
Bank Year Mean Standard
Deviation
2007 2008 2009 2010
MBL 27.74 17.22 17.30 17.59 19.96 5.1874
BAL 5.78 2.86 2.85 3.83 3.83 1.3788
Profit before Tax ratio of BAL and MBL has significantly affected during the period under review though the mean of
MBL is quite better.
Gross Spread Ratio
Bank Year Mean Standard
Deviation
2007 2008 2009 2010
MBL 46.39 50.80 46.25 35.54 44.745 6.4901
BAL 35.54 30.67 30.67 33.98 32.715 2.4457
Gross Spread ratio has also been affected in case of BAL due to increase in Mark up expense and decrease in Markup
income however it remained somehow better in MBL
0
10
20
30
40
2007 2008 2009 2010
BAL
MBL
0
20
40
60
80
100
2007 2008 2009 2010
BAL
MBL
Impact Factor 3.582-Case Studies Journal ISSN (2305-509X) – 2015 Volume 4, Issue 1
http://www.casestudiesjournal.com Page 44
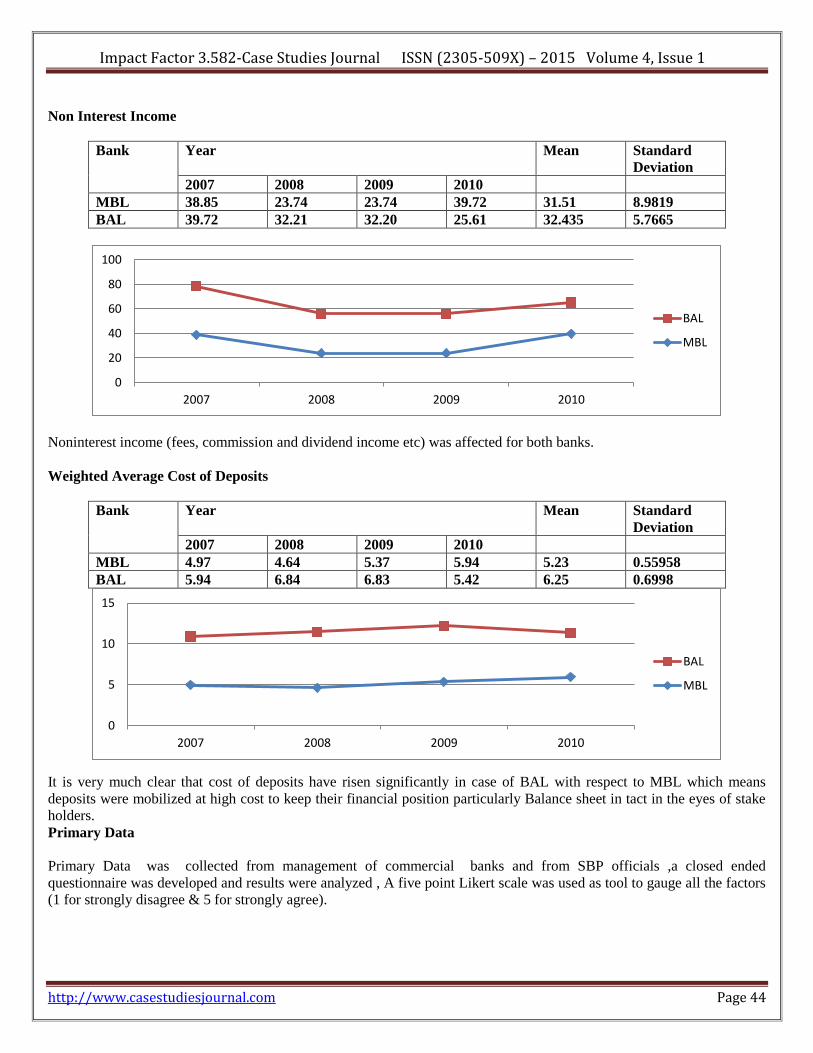
Non Interest Income
Bank Year Mean Standard
Deviation
2007 2008 2009 2010
MBL 38.85 23.74 23.74 39.72 31.51 8.9819
BAL 39.72 32.21 32.20 25.61 32.435 5.7665
Noninterest income (fees, commission and dividend income etc) was affected for both banks.
Weighted Average Cost of Deposits
Bank Year Mean Standard
Deviation
2007 2008 2009 2010
MBL 4.97 4.64 5.37 5.94 5.23 0.55958
BAL 5.94 6.84 6.83 5.42 6.25 0.6998
It is very much clear that cost of deposits have risen significantly in case of BAL with respect to MBL which means
deposits were mobilized at high cost to keep their financial position particularly Balance sheet in tact in the eyes of stake
holders.
Primary Data
Primary Data was collected from management of commercial banks and from SBP officials ,a closed ended
questionnaire was developed and results were analyzed , A five point Likert scale was used as tool to gauge all the factors
(1 for strongly disagree & 5 for strongly agree).
0
20
40
60
80
100
2007 2008 2009 2010
BAL
MBL
0
5
10
15
2007 2008 2009 2010
BAL
MBL
Impact Factor 3.582-Case Studies Journal ISSN (2305-509X) – 2015 Volume 4, Issue 1
http://www.casestudiesjournal.com Page 45
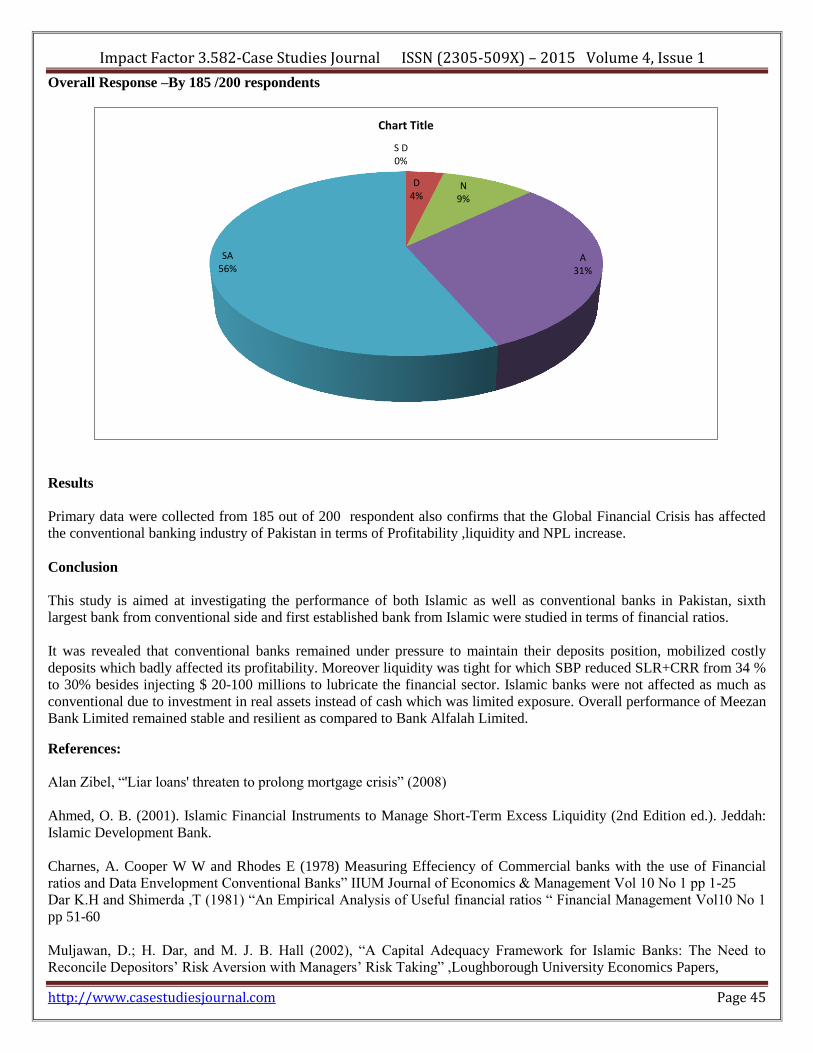
Overall Response –By 185 /200 respondents
Results
Primary data were collected from 185 out of 200 respondent also confirms that the Global Financial Crisis has affected
the conventional banking industry of Pakistan in terms of Profitability ,liquidity and NPL increase.
Conclusion
This study is aimed at investigating the performance of both Islamic as well as conventional banks in Pakistan, sixth
largest bank from conventional side and first established bank from Islamic were studied in terms of financial ratios.
It was revealed that conventional banks remained under pressure to maintain their deposits position, mobilized costly
deposits which badly affected its profitability. Moreover liquidity was tight for which SBP reduced SLR+CRR from 34 %
to 30% besides injecting $ 20-100 millions to lubricate the financial sector. Islamic banks were not affected as much as
conventional due to investment in real assets instead of cash which was limited exposure. Overall performance of Meezan
Bank Limited remained stable and resilient as compared to Bank Alfalah Limited.
References:
Alan Zibel, “'Liar loans' threaten to prolong mortgage crisis” (2008)
Ahmed, O. B. (2001). Islamic Financial Instruments to Manage Short-Term Excess Liquidity (2nd Edition ed.). Jeddah:
Islamic Development Bank.
Charnes, A. Cooper W W and Rhodes E (1978) Measuring Effeciency of Commercial banks with the use of Financial
ratios and Data Envelopment Conventional Banks” IIUM Journal of Economics & Management Vol 10 No 1 pp 1-25
Dar K.H and Shimerda ,T (1981) “An Empirical Analysis of Useful financial ratios “ Financial Management Vol10 No 1
pp 51-60
Muljawan, D.; H. Dar, and M. J. B. Hall (2002), “A Capital Adequacy Framework for Islamic Banks: The Need to
Reconcile Depositors’ Risk Aversion with Managers’ Risk Taking” ,Loughborough University Economics Papers,
S D 0%
D 4%
N 9%
A 31%
SA 56%
Chart Title

Impact Factor 3.582-Case Studies Journal ISSN (2305-509X) – 2015 Volume 4, Issue 1
http://www.casestudiesjournal.com Page 46
Tarawneh, M. (2006), A Comparison of Financial Performance in the Banking Sector: Some Evidence from Omani
Commercial Banks. International Research Journal of Finance and Economics, Issue (3). ISSN 1450-2887
Yue, P. (1992), “Data Envelopment Analysis and Commercial Bank Performance: A Prime rwith Applications to
Missouri Banks,” Working Papers, ICW Institute, University of Texas at Austin.
Zaman, R., & Movassaghi, H. (2001). Islamic Banking: A Performance Analysis. The Journal
of Global Business, 12(22), 31-38.