impact of chronic diseases on general healh in …
TRANSCRIPT

The Pennsylvania State University
The Graduate School
The Harold and Inge Marcus
Department of Industrial & Manufacturing Engineering
IMPACT OF CHRONIC DISEASES ON GENERAL HEALH IN AMERICAN ADULTS
A Thesis in
Industrial Engineering & Operations Research
by
Palaniappan Palaniappan Narayanan
2010 Palaniappan Palaniappan Narayanan
Submitted in Partial Fulfillment
of the Requirements
for the Degree of
Master of Science
December 2010

The thesis of Palaniappan Palaniappan Narayanan was reviewed and approved* by the following:
Paul Griffin
Professor of Industrial Engineering
Peter and Angela Dal Pezzo Department Head Chair
Thesis Advisor
Vittal Prabhu
Professor of Industrial Engineering
Thesis Reader
Jeya Chandra
Professor of Industrial Engineering
Chair of Graduate Program
*Signatures are on file in the Graduate School
iii
ABSTRACT
The goal of this thesis is to develop a multi-criteria weighting factor to highlight the
importance of the effect of various chronic diseases on the health of American adults. A
Multivariate logistic regression model is used to determine the odds ratio which represents the
impact of each of the chronic diseases considered, controlling for socio-demographic factors and
other conditions. The other criteria which is critical in establishing the effect of a chronic disease
is the prevalence of the disease. A normalized bi-criteria additive weighting scheme is developed
to show the importance of the chronic disease in terms of both prevalence and impact. The
motivation behind developing such a weighting factor is to aid decision makers in making
allocation decisions across several domains that influence health care needs, public policy, and
research priorities.

iv
TABLE OF CONTENTS
LIST OF FIGURES ................................................................................................................. v
LIST OF TABLES ................................................................................................................... vi
ACKNOWLEDGEMENTS ..................................................................................................... vii
Chapter 1 INTRODUCTION ........................................................................................................ 1
CHAPTER 2 LITERATURE SURVEY ........................................................................................... 4
2.1 Chronic Diseases and Quality of Life ........................................................................ 4 2.2 Measure of disease burden ......................................................................................... 13
2.2.1 Quality Adjusted Life Year ............................................................................. 13 2.2.2 Disability-Adjusted Life Year (DALY) .......................................................... 14
2.3 Weighting factor for Chronic Diseases ...................................................................... 14 2.4 Contribution of this Thesis ......................................................................................... 16
CHAPTER 3 PROBLEM DESCRIPTION AND METHODOLOGY ..................................................... 18
3.1 Problem Description .................................................................................................. 18 3.2 Data Set ...................................................................................................................... 19 3.3 Case Definitions for Chronic Conditions ................................................................... 20 3.4 Calculation of Prevalence .......................................................................................... 23 3.5 Logistic Regression Model ........................................................................................ 24 3.6 Process of choosing the methodology for Weighting Factor ..................................... 27
Chapter 4 RESULTS .................................................................................................................. 33
4.1 Discussion of prevalence results ................................................................................ 33 4.2 Odds Ratio along with 95% Confidence Interval ....................................................... 36 4.3 Correlation Analysis .................................................................................................. 39 4.4 Weighting factor ........................................................................................................ 40 4.5 Health conditions ranked in order of „Weighting Factor‟ .......................................... 43
Chapter 5 CONCLUSION ........................................................................................................... 47
REFERENCES ........................................................................................................................ 49
v
LIST OF FIGURES
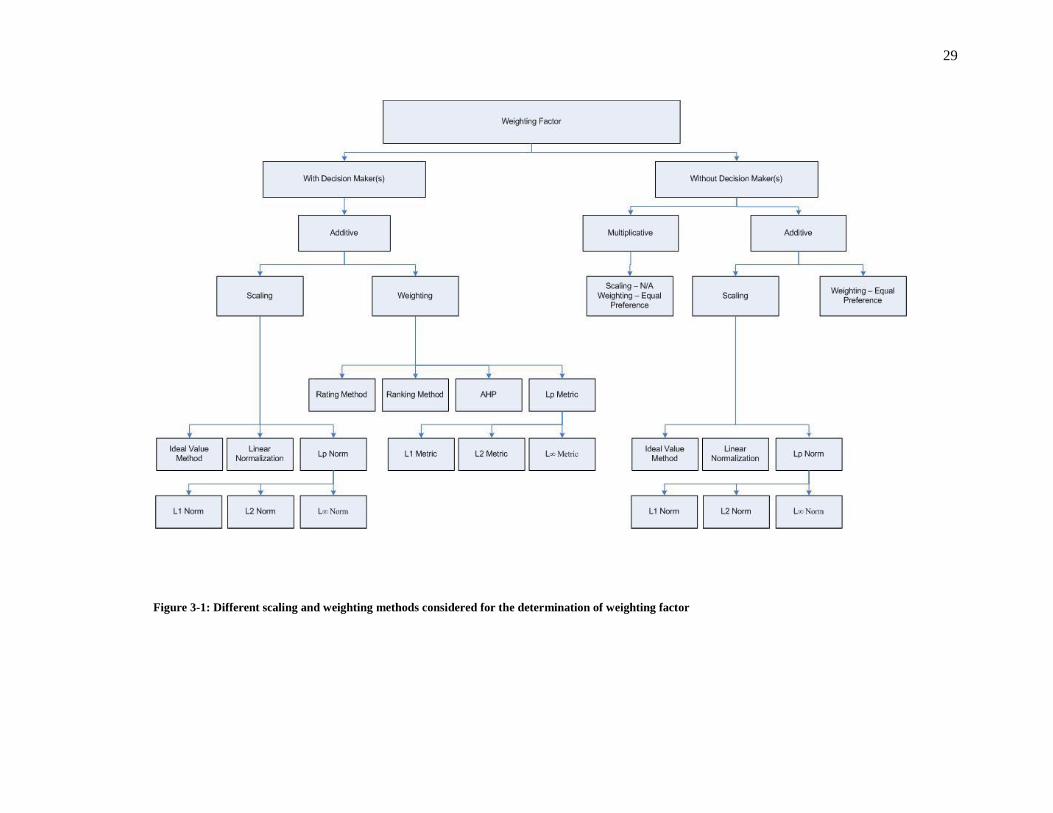
Figure 3-1: Different scaling and weighting methods considered for the determination of
weighting factor ............................................................................................................... 29
Figure 4-1: Prevalence of various health conditions ................................................................ 34
Figure 4-2: Odds Ratio of the various health conditions ......................................................... 37
Figure 4-3 : Weighting factor for chronic conditions .............................................................. 43
Figure 4-4 : Weighting factor ranked in order of importance .................................................. 44
Figure 4-5 : Share of the PIE ................................................................................................... 45

vi
LIST OF TABLES
Table 2-1: Summary of section 2.1 literature survey ............................................................... 12
Table 3-1: Case definitions for chronic conditions .................................................................. 22
Table 4-1: Prevalence percentages of chronic diseases among adults for various
sociodemographic factors................................................................................................. 35
Table 4-2: Odds Ratio from logistics regression model........................................................... 38
Table 4-3 : Correlation between various chronic conditions ................................................... 39
Table 4-4 : L infinity scaled values of odds ratio and prevalence ........................................... 40
Table 4-5 : Scores of various chronic conditions ..................................................................... 41
Table 4-6 : Normalized weighting factors for chronic conditions ........................................... 42
Table 4-7 : Weighting factors of chronic conditions ranked in order of importance ............... 46
vii
ACKNOWLEDGEMENTS
I would like to thank Dr.Griffin for his continued support, guidance, advice and patience
through the course of this thesis. I thank Bristol Myers Squibb Company for their assistance in
providing awareness and information about prevalence and impact of chronic diseases and the
current research priorities within the industry. It greatly contributed towards the research. Last but
not least, I would like to thank my family and friends for their help and support throughout my
education.
Chapter 1 INTRODUCTION
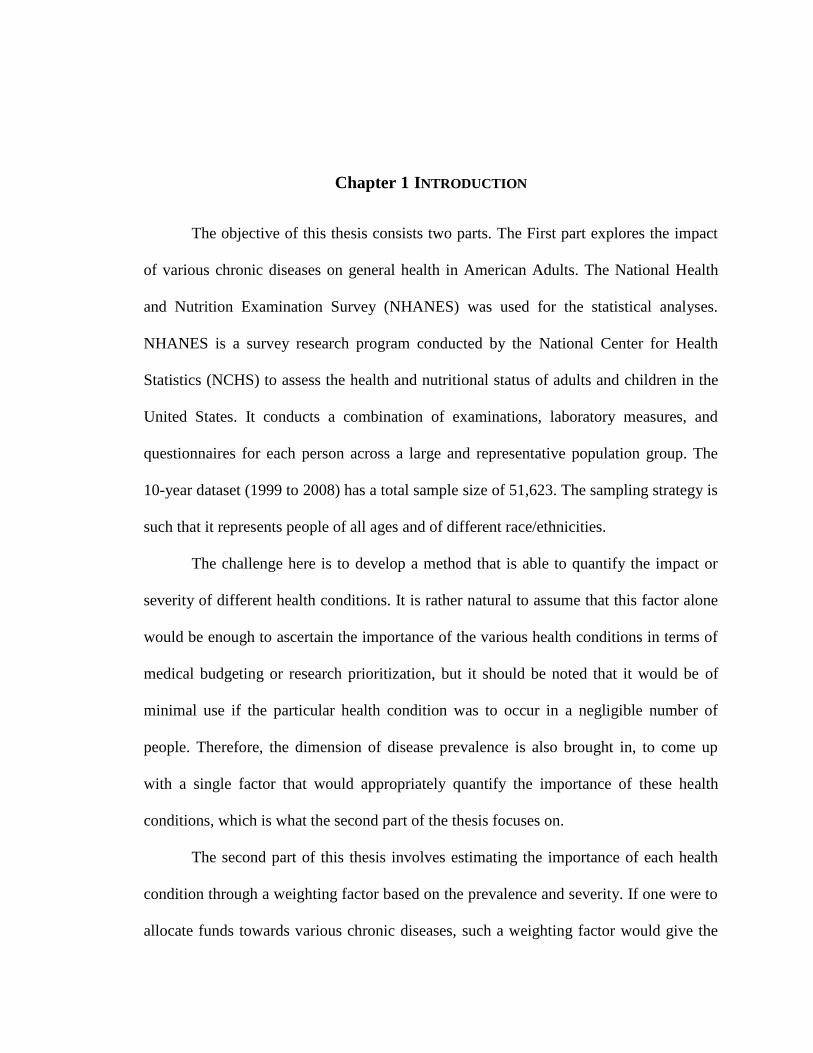
The objective of this thesis consists two parts. The First part explores the impact
of various chronic diseases on general health in American Adults. The National Health
and Nutrition Examination Survey (NHANES) was used for the statistical analyses.
NHANES is a survey research program conducted by the National Center for Health
Statistics (NCHS) to assess the health and nutritional status of adults and children in the
United States. It conducts a combination of examinations, laboratory measures, and
questionnaires for each person across a large and representative population group. The
10-year dataset (1999 to 2008) has a total sample size of 51,623. The sampling strategy is
such that it represents people of all ages and of different race/ethnicities.
The challenge here is to develop a method that is able to quantify the impact or
severity of different health conditions. It is rather natural to assume that this factor alone
would be enough to ascertain the importance of the various health conditions in terms of
medical budgeting or research prioritization, but it should be noted that it would be of
minimal use if the particular health condition was to occur in a negligible number of
people. Therefore, the dimension of disease prevalence is also brought in, to come up
with a single factor that would appropriately quantify the importance of these health
conditions, which is what the second part of the thesis focuses on.
The second part of this thesis involves estimating the importance of each health
condition through a weighting factor based on the prevalence and severity. If one were to
allocate funds towards various chronic diseases, such a weighting factor would give the
2
person allocating the funds a clearer picture as to which conditions need more attention
and which ones need less. Also, during optimal allocation of medical resources, these
weights could be strategically used, subject to various risk factors in a portfolio
optimization framework. The overall results will aid decision makers in making
productive decisions in several domains influencing health care needs, public policy, and
research priorities.
The thesis is organized in four discrete chapters, namely, literature survey,
problem description and Methodology, results, and conclusions. The literature survey
discusses the state of research pertaining to various aspects associated with the thesis
topic. It has four sections out of which the first three synthesize the three critical aspects
of this thesis and the fourth one explains the contribution of this thesis. The First section
“Chronic Diseases and Quality of Life” presents a thorough review of all previous
research that touches upon the impact of one or more chronic diseases one or more
dimensions of life. The second section “Measure of disease burden” describes the
different methods that were used to measure the impact of diseases on human health. The
third section “Weighting factor for Chronic Diseases” outlines the several methodologies
used in developing a weighting factor to represent the severity of chronic diseases.
Problem description and methodology is divided into two parts. The first one is
the Problem description which indicates the objectives of this thesis in a specific sense
and the second part explains in detail the methodology used in developing the results.
This section explains the data set used, the case definition for each chronic disease
considered, calculation of prevalence, and the quantitative methods used in determining
the weighting factor.
3
The results section presents all the results of this research in a clear and succinct
way. The conclusion section summarizes all the different results obtained through this
research while discussing some of the possible applications and also presents the future
research opportunities in this area.
4
Chapter 2 LITERATURE SURVEY
2.1 Chronic Diseases and Quality of Life
Research in the area of chronic diseases and their impact on quality of life
(QOL) has been performed extensively across sample sets from various countries. Many
common and uncommon chronic diseases have been considered and their impact on the
multiple dimensions associated with general health and quality of life has been examined.
Early researchers (1980s) devoted most of their time and effort in analyzing the impact of
chronic diseases on general health within a small sample set that only covered a few
regions or at most a few countries. Therefore, it is quite difficult to generalize the results.
Also, most previous research did not adjust for co-morbidities or other risk factors such
as social income or race/ethnicity.
A very critical part of assessing the health of a person is a tool to measure the
quality of life or well-being of an individual. Many tools have been developed over the
years to measure what is commonly called in literature as “Health Related Quality of
Life”, abbreviated in most cases as HRQoL and in some cases as just HRQL. Initially,
many of the researchers used their own form of assessing the quality of life of a person,
by developing their own set of questions. In time, as researchers started to realize the
importance of assessment tools, many standard HRQoL tools started to emerge. These are
most often than not, simply patient questionnaires, which try to cover physical,
psychological, emotional, cognitive, social, work or role related aspects. They also collect
the disease related symptoms, side effects, financial impact etc. The most common
5
HRQoL measures which are currently used are the Short-Form Health Survey (SF-36),
SF-12, Manchester Short Assessment of Quality of Life (MANSA), EQ 5D and EQ 15D.
The numbers observed in the names of the questionnaire often indicate the number of
questions. SF-36 is a widely-used questionnaire assessing physical, social, and mental
HRQoL, used in clinical trials. The SF-12 is a shorter form of the SF-36. Manchester
Short Assessment of Quality of Life is used for psychiatric populations andEQ-5D& EQ-
15D are all simple quality of life questionnaires. Interestingly, most of the HRQoL
measures found in literature are directed towards adults and the lesser age group, namely
children and infants, has not been looked at in detail. The reason behind this is that, there
are not many well developed quality of life assessment tools like those available for
adults.
The impact of chronic diseases on general health is often analyzed using the
common statistical methods such as a student‟s t-test, analysis of variance, and
multivariate regression. Since general health or the variables associated with health are
mostly dichotomous or in some cases polychotomous, logistic regression models are
employed to find the impact through a parameter called an odds ratio. The predictor or
independent variables used in these models were the various chronic conditions along
with the risk factors if any, while the dependent variable were the ones associated to
quality of life.
Deyo et al. [1982] examined the impact of rheumatoid arthritis on physical and
psychosocial behavior1. Sickness Impact Profile (SIP) was introduced as a QOL
assessment tool and was self-administered on 79 patients with rheumatoid arthritis.1
There was significant impact observed in both physical and psychosocial aspects. Mason
6
et al. [1983] conducted a research study to find out the effects of mainly rheumatoid
arthritis along with hypertension, cancer, diabetes, cardiac disease and pulmonary
disease.2 A self-administered survey examining 11 different aspects of health was used
and the results they found were not in complete agreement with those of Deyo et al.
[1982] Rheumatoid arthritis and pulmonary diseases had serious negative impact on the
„physical functioning and pain‟ aspect of QOL, but there was not much impact found in
the anxiety and depression aspect.
Cassileth et al. [1984] compared the psychological status of 758 patients with
arthritis, cancer, diabetes, renal disease, dermatological disorders, and depression.3 No
significant differences in the psychological status were observed in the patients with these
chronic conditions when compared to those without these conditions. However, these
results were in contradiction to the report published by Stewart et al. [1989].4 In fact, the
results showed that there is a severe negative impact in physical, psychological and
general well-being of the patients with these conditions.
One of the few research studies conducted for the elderly (sometimes classified as
retired) age group was by Kempen et al. [1997]. They analyzed the impact of eight
chronic diseases on HRQoL among 5279 „community-based Dutch Elderly‟.5 The
chronic conditions considered were asthma/chronic bronchitis, heart condition,
hypertension, diabetes, Back problem, Rheumatoid arthritis, Migraine and dermatological
disorders and QOL aspects considered were physical functioning, social role functioning,
somatic sensation and subjective well-being. The impact of these chronic conditions on
HRQoL was analyzed by means of a student‟s t-tests, analysis of variance, and multiple
regression analyses. The results show that Rheumatoid arthritis and Back problems were

7
the two chronic conditions that affected HRQoL most and Mental health was the QOL
aspect that was least affected by these chronic conditions.
Ferrer et al. [1997] examined the effect of chronic obstructive pulmonary disease
(COPD) and self-reported co-morbid conditions on physical, social and psychosocial
dimensions of HRQoL.6 The sample set included was 321 consecutive male patients with
COPD. Statistical analysis involved the use of Kruskal-Wallis test to compare HRQoL
scores with clinical and functional aspects of COPD. The Spearman correlation
coefficient was calculated to assess the association between HRQoL scores and clinical
or functional variables. The differences in HRQoL scores and other continuous variables
according to the presence of co-morbid conditions were tested by using the student‟s t-
test. The results showed that even patients with mild disease showed substantially
compromised HRQoL.
Following extensive research on common chronic conditions, Schlenk et al.
[1998], came up with research finding on chronic conditions such as urinary
incontinence, prostate cancer, AIDS, fibromyalgia, hyperlipidaemia and COPD.7 They
used the SF-36 HRQoL questionnaire to assess the impact of these conditions on
HRQoL. Prostate cancer and hyperlipidaemia had the lowest HRQoL score for physical
functioning when compared to normal patients. AIDS had the lowest HRQoL score
general health and social functioning while COPD was the lowest for bodily pain and
vitality.
While in adults quality of life assessment tools were well developed, QOL
measurement tools in children was a relatively new research field. Sieberer and Bullinger
[1998] developed a German generic quality of life instrument for children (KINDL)
8
which was used to assess the HRQoL in chronically ill children.8 The research work
describes the application of KINDL in a group of 45 chronically ill children suffering
from asthma and diabetes. The results interestingly showed that there were no significant
differences in impact of asthma and diabetes on children with and without these
conditions. But, the results were inconclusive due to many reasons such as small sample
set, selection bias, etc. The main aim of this paper was to develop a QOL tool for
children.
Lam and Lauder [1999] investigated the effects of chronic diseases on HRQoL on
760 Chinese patients who were in a clinic under primary care.9 The questionnaire given
to the patients consisted of questions in demographic and morbidity data and the Chinese
version of Functional health assessment charts. The scores obtained for each disease
group were compared to patients without any chronic conditions and the difference in
proportion between them was tested by the chi-square test. The effects of gender, age,
social class, marital status, education and diagnosis on the scores were analyzed using a
multivariate forward logistic regression model. Depression was observed to be the most
disabling condition while osteoarthritis of the knee had the most impact on HRQoL. A
result which was a bit contrary to those observed previously in literature was that diabetes
and heart diseases did not have too much impact on overall health.
Sprangers et al [2000] employed the SF-36 to compare the QOL across a wide
range of patients with chronic conditions.10
The data included over 15,000 patients from
all over Netherlands and the chronic conditions considered were cancer, cardiovascular
disease (CVD), cerebrovascular, endocrinologic, gastrointestinal, musculoskeletal
conditions and psychiatric disorders. The analysis was controlled for Age, Sex, Education
9
level, marital status and prevalence of co-morbid conditions. Hearing was not impacted
too much due to the presence of chronic conditions, while cerebrovascular, renal and
musculoskeletal conditions were the ones which had the maximum impact on QOL.
Cancer, CVD, endocrinologic conditions, visual impairment and chronic respiratory
diseases had an intermediary impact on QOL.
Obesity research started to proliferate in the early 2000s in health services and
health care policy. Sturm [2002] compared the effects of obesity, smoking, and drinking
on health care use and health status after controlling for gender, race, household income,
and education.11
The data set had 10,000 individuals from a national survey data, Health
Care for Communities (HCC). The analysis only included adults within the age group of
18 to 65. The dependent variables used were two measures for health status and two
measures for health care use. Measures for health care use take into account inpatient and
outpatient spending while the health status is measured using he scores from the SF-12.
The results indicate a 36% increase in inpatient and outpatient spending for obese people
and a 21% increase for the smoking segment. Also a startling 77% increase in
medications was observed for obese people while there was only a 28% increase for
smokers. There were relatively smaller effects observed for drinkers.
Very few studies have set out to explore the effects of chronic diseases on
HRQoL across a general population in a global framework. The International Quality of
life assessment (IQOLA) project began in 1991 with the goal of translating and validating
the SF-36 Health Survey for international use.12
Alonso et al. [2004] utilized the data
from the IQOLA project to compare the impact of seven chronic diseases (allergies,
arthritis, chronic lung disease, hypertension, is- chemic heart disease, congestive heart
10
failure, and diabetes) in eight countries (Denmark, France, Germany, Italy, Japan, the
Netherlands, Norway and the United States) on HRQoL.13
To test whether there were
differences in the prevalence of reported chronic conditions by country, multivariate
logistic models were built and adjusted for age, gender, education, and marital status.
Arthritis had the most negative impact on HRQoL in the general population of countries.
Ischemic heart disease and diabetes followed arthritis in terms of negative impact.
The inconsistent research findings of the impact of chronic medical conditions on
different aspects of quality of life has driven researchers to come up with creditable and
conclusive research findings. Within the last 5 years plenty of research has gone into
finding the impact of patients with chronic conditions on HRQoL. Erica Lubetkin et al.
[2005] investigated the influence of demographic and socioeconomic and chronic
conditions on the HRQoL of a representative U.S. sample consisting of 13,646 adults.14
Their study established the fact that socio demographic factors are strongly associated
with general health. Samuli Saarni et al. [2006] investigated the impact of 29 chronic
conditions on HRQoL in a representative sample of Finns.15
Both the aforementioned
studies utilized the EQ-5D. According to the study, Parkinson‟s disease had the largest
impact on HRQoL and was followed by anxiety disorders, depression and arthritis. This
study confidently emphasizes that musculoskeletal disorders impact general health the
most and is followed closely by psychiatric conditions.
Griffin et al. [2009] examined the oral health needs among US adults with chronic
diseases.16
They calculated the prevalence of untreated dental disease, number of missing
teeth and self-reported oral disease for US adults with chronic diseases (arthritis,
rheumatoid arthritis, asthma, obesity, bronchitis, cancer, CVD, diabetes, uncontrolled
11
diabetes, emphysema, HCV, HIV, liver condition, stroke, and thyroid condition).
Multivariate statistical analyses were performed to determine whether these conditions
were associated with indicators of dental disease after controlling for common risk
factors such as age, gender, race/ethnicity, income level and smoking status. Respondents
with rheumatoid arthritis, diabetes and liver conditions were twice as likely to have dental
needs when compared to those who did not have these conditions. The study clearly
established the fact that chronic diseases increase the risk of developing dental diseases.

12
Table 2-1: Summary of section 2.1 literature survey
13
2.2 Measure of disease burden
2.2.1 Quality Adjusted Life Year
A quality adjusted life year (QALY) is a measure of disease burden taking
into accounts both the quality and quantity of life. It was originally used to measure the
effectiveness of a health care intervention and also for cost-effectiveness analysis. It was
created with an intention to aid decision-makers for resource allocation.17-19
Both the US
Panel on Cost-Effectiveness in Health and Medicine and Britain‟s National Institute of
Health and Clinical Excellence (NICE) has approved the QALY concept. A perfect
health is quantified as 1 and death is quantified as 0.20
Therefore, when some medical
intervention extends a person life by 2 years, and the person has perfect health for those
two years, then we say the person has obtained two additional QALYs due to the
intervention. If say, his life was extended by two years with average quality of life, then
the QALY associated with the intervention could be estimated as (2*0.5) =1.
Many argue that there are some conditions worse than death and so QALYs
should have a negative range as well. Notwithstanding such arguments, QALYs are still
commonly used in cost utility analysis to calculate the ratio of cost to QALYs saved for a
particular health care intervention.21
The ratio is also made use for health care resource
allocation.
14
2.2.2 Disability-Adjusted Life Year (DALY)
Disability-Adjusted Life Year or DALYs were initially developed by the World
Health Organization (WHO) in order to represent the global burden of disease.23-24
Ata
very high level, one could understand one DALY as one lost year of health life. This
quantity of measure is rapidly becoming popular in the field of public health and health
impact assessment.
DALY is a measure of the overall disease burden, expressed as the number of
years lost due to ill-health, disability or early death. The overall burden of disease is
assessed using the disability-adjusted life year (DALY), a time-based measure that
combines years of life lost due to premature mortality and years of life lost due to time
lived in states of less than full health.
DALYs for a disease or health condition are calculated as the sum of the Years of
Life Lost (YLL) due to premature mortality in the population and the Years Lost due to
Disability (YLD) for incident cases of the health condition.28
2.3 Weighting factor for Chronic Diseases
Limited research has been done towards finding a weighting factor for each
chronic disease which could add more perspective to the chronic condition in terms of
both health care policy decisions and medical resource allocation. Mossey and Roos
[1987] were one of the first who came up with a scoring scale for illness severity.29
It was
based on the use of insurance claims data over a 1-year period. The Illness Scale score
increased with „age‟ and was associated with „probability of dying in the following year‟,
15
„self-rated health‟, „number of chronic conditions‟, „activities of daily living‟, and „days
in bed‟ in the prior year.
Von Korff et al. [1992] developed the well-known „Chronic Disease Score‟
(CDS) whose modifications and extensions are still in use today.30
They utilized
population-based automated pharmacy data and patterns of use of selected prescription
medications during a 1 year time period to construct a measure of chronic disease status
known as the Chronic Disease Score. A multidisciplinary expert panel applied predefined
scoring rules for various medication use patterns to 1 year of dispensing records, creating
a summary measure of an individual's burden of chronic disease. Johnson et al. [1994]
replicated the CDS for validation purposed, with a different set of data and recommended
that CDS could be used as a readily accessible low cost measure for health status.31
Clark et al. [1995] developed a revised chronic disease score to predict health care
utilization, costs, hospitalization, and mortality and compared it to the original CDS that
was derived through clinical judgments of disease severity.32
The revised CDS weighting
scheme introduced three sets of scoring weights, one for each of the following outcomes:
total health care costs, outpatient care costs, and primary care visits. Empirical weights
were derived from linear regression models of age, gender, and medication use on each of
these outcomes. The resulting scores were more predictive of utilization outcomes and of
following year hospitalizations than the original CDS.
Fishman et al. [2003] modified the CDS in such a way that it could be used in
different health care settings.33
To differentiate from CDS they called their model
RxRisk. It is an all-ages and market segment pharmacy-based risk assessment model that
can be easily replicated in multiple health care settings. It produces estimates of future
16
health care cost based on an individual's age, sex, and chronic condition profile measured
by pharmacy dispenses linked to chronic conditions or clinically homogenous groups.
Kathleen Putnam et al. [2002] compared the original CDS, revised CDS and RxRisk
models and commented that all models performed similarly in predicting health care
costs with the „revised CDS‟ slightly better than the others.34
2.4 Contribution of this Thesis
The impact of liver condition and poor vision along with the regular chronic
conditions has not been examined in most of the previous research. Although both these
conditions have been extensively researched at an individual level by medical
practitioners and researchers, their impact along with all the other chronic diseases on
general health subject to various risk factors is yet to be seen. Also, poor hearing,
Hepatitis-C (HCV) and emphysema have not been commonly considered. This thesis will
include 20 chronic conditions viz., arthritis, asthma, cancer, chronic bronchitis, obesity,
kidney disease, congestive heart failure, coronary heart disease, angina pectoris, heart
attack, diabetes, emphysema, HCV, liver condition, stroke, thyroid condition, poor
vision, poor hearing, anxiety and poor oral health.
It is very intuitive that when a disease is quite prevalent and its impact on health is
severe, there has to be more importance given to that disease while making health-care
policy decisions or allocating medical resources. This calls for a weighting factor that
takes into consideration both prevalence and impact of the chronic condition. Based on
the above literature survey (Section 2.2), it is evident that there is no work which

17
provides us with such a weighting factor combining both „prevalence‟ and „impact‟ of a
chronic condition. This thesis will help to address this need.
18
Chapter 3 PROBLEM DESCRIPTION AND METHODOLOGY
3.1 Problem Description
This thesis attempts to achieve two important goals. First, we investigate the
influences of chronic conditions and socio-demographic factors on self-reported general
health among general American Adults 18 years and older. Data from National Health
and Nutrition Examination Survey (NHANES) is used to report the impact of 20 chronic
conditions controlled for age, gender, social status, and race/ethnicity on self-reported
general health. Second, we develop a weighting factor which represents both impact and
prevalence of a chronic condition. This weighting factor is developed keeping in mind the
needs of health care policy makers for medical resource allocation.
NHANES uses a weighted sampling scheme, namely oversampling of minority
populations, in order to get full representation. NHANES assigns a sample weight to each
sample person. It is a measure of the number of people in the population represented by
that sample person reflecting the unequal probability of selection, non-response
adjustment, and adjustment to independent population controls. By “unweighting” the
provided data, unbiased national estimates may be obtained.
The chronic diseases considered are Diabetes, Kidney Problem, Asthma,
Overweight, Arthritis, Stroke, Thyroid Disease, Chronic Bronchitis, Liver Condition,
Cancer, Congestive Heart Failure, Coronary Heart Disease, Angina Pectoris, Heart
Attack, Emphysema, Hepatitis C, Poor Vision, Poor Oral Health, Poor Hearing, and
Anxiety. The criteria used for selecting these chronic conditions was based on their
19
overall prevalence being greater than 1% for the sample size considered. This is justified
because prevalence greater than 1% means that a good number people have the disease
and the effects of it are worth analyzing.
The race/ethnicity groups considered here are Hispanic, Non-Hispanic White,
Non-Hispanic Black, and Others. The poverty income ratio (PIR) is the ratio of income to
the family's appropriate poverty threshold (US Census Bureau, 2003a).The official
poverty definition counts money income before taxes and excludes capital gains and
noncash benefits (such as public housing, Medicaid, and food stamps). PIR values below
1 are below the official poverty threshold while PIR values of 1 or greater indicate
income above the poverty level (US Census Bureau, 2003b). For this thesis work, a
person is considered to be”poor” only if PIR is less than 2. The age levels considered are
„Adults‟ (between age 18 and 65) and „Retired‟ (above the age of 65).
3.2 Data Set
NHANES is a survey research program conducted by the National Center for
Health Statistics (NCHS) to assess the health and nutritional status of adults and children
in the United States. It conducts a combination of examination, laboratory, and
questionnaire for each person across a large and representative population group.
Questionnaires are administered to NHANES participants both at home and in the trailers
after an initial screening. The examination component consists of medical, dental, and
physiological measurements, as well as laboratory tests administered by highly trained
20
medical personnel. To produce reliable statistics, NHANES over-samples persons 60 and
older, African Americans, and Hispanics.
This thesis utilizes a 10-year NHANES dataset (from 1999 to 2008) with a total
sample size of 51,623 representing 303.8 million (US population as per July 2008
estimate) Americans. This represents people from all ages and race/ethnicities. As only
adults are considered, the sample set reduces to 28,852 out of which 22,159 are between
the age of 18 and 65 while 6,659 are over 65.
3.3 Case Definitions for Chronic Conditions
Table 3.1shows each chronic condition and how it is defined. The source of this
data is from NHANES through a combination of examinations, laboratory tests, and
questionnaires. But, this information is not used directly in this research. The rationale
behind each case definition is presented below. In most cases if the condition is self-
reported, a “Yes” is sufficient to decide upon the presence of the condition. For Obesity
we choose that the subject is obese if his/her BMI is greater than 30 kg/m2as per The
World Health Organization (WHO) which defines "overweight" as a BMI equal to or
more than 25, and "obesity" as a BMI equal to or more than 30. The nine forms of cancer
that were considered were, Breast , Colon and Rectal (Combined), Endometrial, Kidney
(Renal Cell) Cancer, Leukemia, Lung (Including Bronchus), Melanoma, Non-Hodgkin
Lymphoma, Pancreatic, Prostate and Thyroid cancer. The reason behind considering only
these cancer types were because they were the most prevalent cancer forms as indicated
by the American cancer society. The specimen is considered to be Hepatitis C positive if
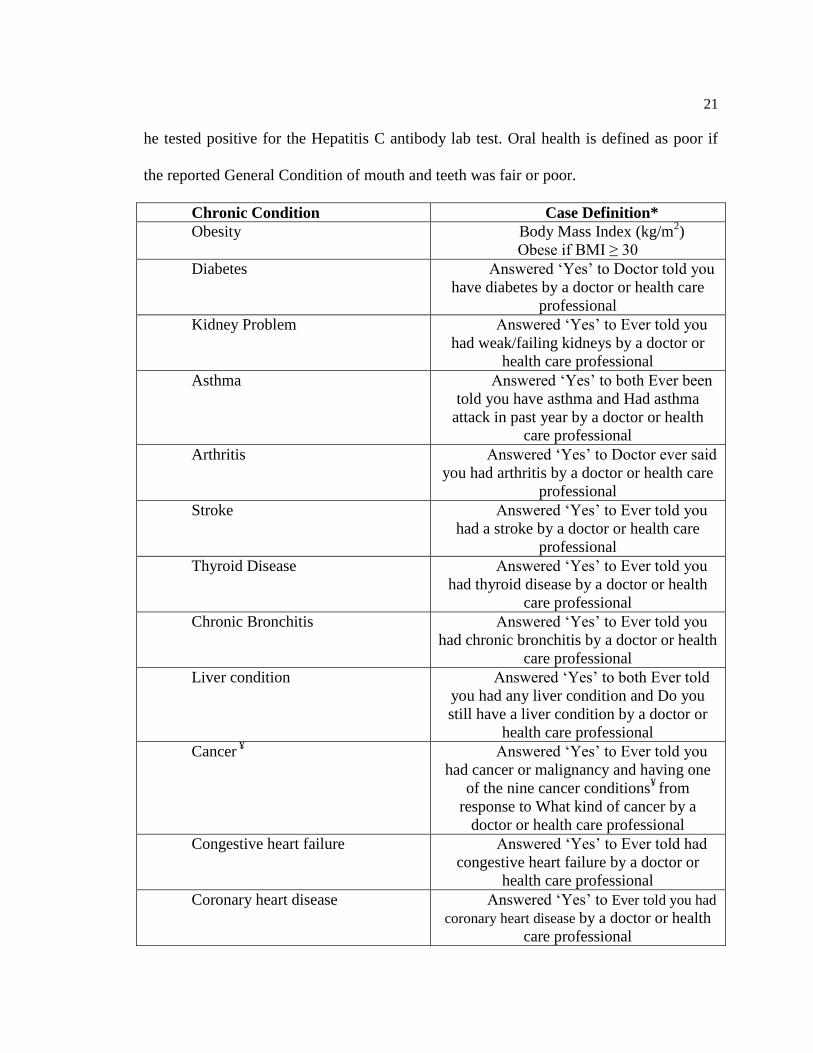
21
he tested positive for the Hepatitis C antibody lab test. Oral health is defined as poor if
the reported General Condition of mouth and teeth was fair or poor.
Chronic Condition Case Definition*
Obesity Body Mass Index (kg/m2)
Obese if BMI ≥ 30
Diabetes Answered „Yes‟ to Doctor told you
have diabetes by a doctor or health care
professional
Kidney Problem Answered „Yes‟ to Ever told you
had weak/failing kidneys by a doctor or
health care professional
Asthma Answered „Yes‟ to both Ever been
told you have asthma and Had asthma
attack in past year by a doctor or health
care professional
Arthritis Answered „Yes‟ to Doctor ever said
you had arthritis by a doctor or health care
professional
Stroke Answered „Yes‟ to Ever told you
had a stroke by a doctor or health care
professional
Thyroid Disease Answered „Yes‟ to Ever told you
had thyroid disease by a doctor or health
care professional
Chronic Bronchitis Answered „Yes‟ to Ever told you
had chronic bronchitis by a doctor or health
care professional
Liver condition Answered „Yes‟ to both Ever told
you had any liver condition and Do you
still have a liver condition by a doctor or
health care professional
Cancer ¥
Answered „Yes‟ to Ever told you
had cancer or malignancy and having one
of the nine cancer conditions¥
from
response to What kind of cancer by a
doctor or health care professional
Congestive heart failure Answered „Yes‟ to Ever told had
congestive heart failure by a doctor or
health care professional
Coronary heart disease Answered „Yes‟ to Ever told you had
coronary heart disease by a doctor or health
care professional
22
Angina Pectoris Answered „Yes‟ to Ever told you
had angina/angina pectoris by a doctor or
health care professional
Heart Attack Answered „Yes‟ to Ever told you had
heart attack by a doctor or health care
professional
Emphysema Answered „Yes‟ to Ever told you
had emphysema by a doctor or health care
professional
Hepatitis C Hepatitis C antibody (confirmed)
„Positive‟ in medical examination
conducted by a doctor or health care
professional
Poor Vision Answered „Yes‟ to Trouble seeing
even with glass/contacts by a doctor or
health care professional
Poor hearing Answered „Yes‟ to General
condition of hearing by a doctor or health
care professional
Anxiety Answered „Yes‟ to Seen mental
health professional /past yr by a doctor or
health care professional
Oral health Reported General Condition of
mouth and teeth as fair or poor versus good
or very good
* „Yes‟ answer indicates that the condition was self reported ¥The nine cancers considered were Bladder, Breast, Colon, Kidney, Leukemia, Lung,
Melanoma, Prostate and Thyroid Cancer
Table 3-1: Case definitions for chronic conditions
Self-reported general health was coded into two response categories namely good
health (if the participant described his health in general was either Excellent, very good
or good) and bad health (if the participant described his health in general was either fair
or poor).
Gender was coded into male and female and Age was coded into two levels
namely „Adults‟ (if participant‟s age is between 18 and 65) and „Retired‟ (if participant‟s
23
age is above 65). Race was coded into four response levels namely Hispanic (If the
participant responded to his race/ethnicity as either Mexican American or other
Hispanics), Non-Hispanic White (If the participant responded to his race/ethnicity as
Non-Hispanic White), Non-Hispanic Black (If the participant responded to his
race/ethnicity as Non-Hispanic Black) and Others (If the participant responded to his
race/ethnicity as Other Race). Poverty was coded into two response levels namely below
poverty (if participant‟s Family PIR was ≤ 2) and Above Poverty (if participant‟s Family
PIR was > 2).
The primary reason behind reclassifying multiple levels into two levels is because
there would be sufficient data for all the groupings. In addition to that, it is also simpler
to interpret the results obtained from the logistics regression model. For example, if the
number of levels from NHANES were to be used directly, Health would have 5 levels
(Excellent, very good, good, fair and poor) and information gets dispersed into multiple
levels.
3.4 Calculation of Prevalence
Prevalence is ratio of the number of people who had the condition to the total
number of people examined. In NHANES, some respondents may not submit their
response for certain questions, some may refuse to answer, and some may not know the
answer to the question. So, many responses may be classified as missing, don‟t know or
refused. In the calculation of prevalence, missing data is not considered.
24
3.5 Logistic Regression Model
Logistic Regression is used to assess the likelihood of a disease or health
condition as a function of a risk factor. Logistic regression assesses the association
between independent variable(s) (Xi) - sometimes called exposure or predictor variables
and a dichotomous dependent variable (Y) - sometimes called the outcome or response
variable. It tells you how much an increment in a given exposure variable affects the odds
of the outcome.
Simple logistic regression is used to obtain the associations between one
(dichotomous) outcome and one (continuous, ordinal, or categorical) exposure variable
while multiple logistic regression is used to explore associations between one
(dichotomous) outcome variable and two or more exposure variables.
The main reason behind using multiple logistic regression in this thesis is that it
can provide us with the association between the exposure variable and the outcome
variable after isolating it from the effects of one or more other variables (i.e.,
covariates). The process of accounting for covariates is called adjustment. This isolated
association or relationship between the exposure variable and outcome variable is
expressed in terms of an odds ratio.
The odds ratio is a measure of effect size, describing the strength of association or
non-independence between two binary data values. It is the ratio of the odds of an event
occurring in one group to the odds of it occurring in another group. The odds ratio was
used to see how much association some of the chronic diseases had, controlling for risk
factors.

25
A logistic regression model has been built in order to find the impact of chronic
diseases on general health in American Adults (age >=18). The variable, „General
health‟, in NHANES has different levels of response viz., excellent, very good, good,
fair, poor. These levels are grouped into simply two discrete levels namely good and bad.
So, the model was built with general health as the dependent variable and the various
chronic diseases and risk factors as independent variables.
E Y = [1 + exp(−XI ∗ β)]−1..............................................................................3.1
A first order multiple regression model with 24 predictor variables was
considered a priori to be reasonable:
where,
𝛽 =
𝛽0
𝛽1
𝛽2
⋮𝛽24
𝑎𝑛𝑑 𝑋 =
1𝑋1
𝑋2
⋮𝑋24
this can be looked at as,
(XI ∗ β) = β0 + (𝛽𝑗24𝑗=1 ∗ Xj)..........................................................................3.2
The multiple logistic regression model can therefore be stated as follows:-
Yi are the independent random variable with expected value, E {Yi} and,
E Yi = [1 + exp(−XiI ∗ β)]−1.............................................................................3.3
where,
Yi is the dependent/outcome variable representing self-reported general health
X1iis the independent/predictor variable representing Obesity
X2iis the independent/predictor variable representing Diabetes
X3iis the independent/predictor variable representing Kidney Problem

26
X4iis the independent/predictor variable representing Asthma
X5iis the independent/predictor variable representing Arthritis
X6iis the independent/predictor variable representing Stroke
X7iis the independent/predictor variable representing Thyroid Disease
X8iis the independent/predictor variable representing Chronic Bronchitis
X9iis the independent/predictor variable representing Liver Condition
X10iis the independent/predictor variable representing Cancer
X11iis the independent/predictor variable representing Congestive Heart Failure
X12iis the independent/predictor variable representing Coronary Heart Disease
X13iis the independent/predictor variable representing Angina Pectoris
X14iis the independent/predictor variable representing Heart Attack
X15iis the independent/predictor variable representing Emphysema
X16iis the independent/predictor variable representing Hepatitis C
X17iis the independent/predictor variable representing Poor Vision
X18iis the independent/predictor variable representing Poor Oral Health
X19iis the independent/predictor variable representing Poor Hearing
X20iis the independent/predictor variable representing Anxiety
X21iis the independent/predictor variable representing risk factor gender
X22iis the independent/predictor variable representing risk factor age
X23iis the independent/predictor variable representing risk factor poverty
X24iis the independent/predictor variable representing risk factor race/ethnicity
βji represents the intercepts of the respective independent variables from j = 1 to
24.
The odds ratio is found out by simply taking the exponent of the estimated
regression co-efficient (β1 … β24) in the fitted logistic response function (3.1).
With input data of the dependent and independent variables, the logistic model is
built and solved using SAS which gives estimated regression coefficients and odds ratios
in the output window.
27
3.6 Process of choosing the methodology for Weighting Factor
While coming up with a weighting factor combining multiple criteria, there are
several methods to choose from depending on whether a decision maker(s) is/are
available or not. There are two basic approaches towards forming a weighting factor, one
is the additive scheme and the second is the multiplicative scheme (See Fig 3.1 to view
the various methods considered).
In a multiplicative scheme, there is no concept of scaling because when we scale
each of the criteria and then normalize each criterion to a fraction of 1, the scaling factor
gets annulled. This is evident by the following mathematical proof.
Let WFi represents the weighting factor of chronic disease i
ori represent the odds ratio of chronic disease i
pi represent the prevalence of chronic disease i
SF1i represent the scaling factor of odds ratio of chronic disease i
SF2i represent the scaling factor of prevalence of chronic disease i
ORi represent the scaled odds ratio of chronic disease i
ORi = (ori/ SF1i).....................................................................................................3.4
Pi represent the scaled prevalence of chronic disease i
Pi = (pi/ SF2i).........................................................................................................3.5
Weighting factor is defined as the product of ORi and Pi.
WFi = (ORi * Pi)....................................................................................................3.6
Now,
28
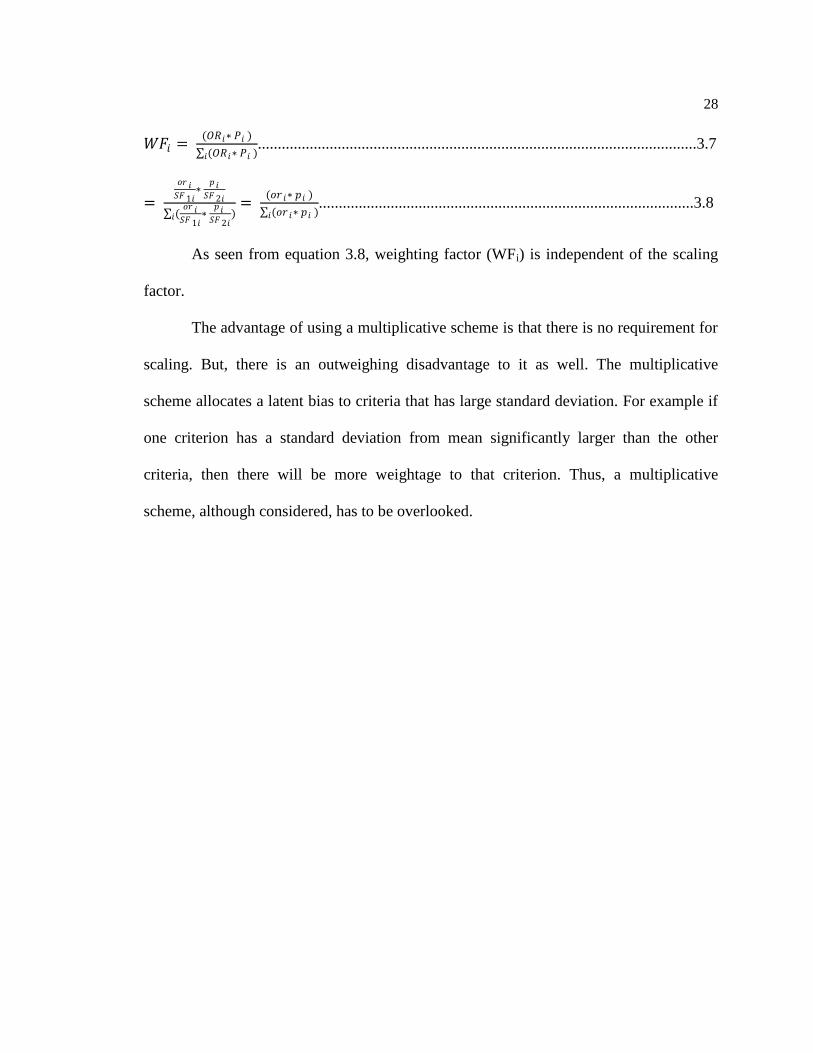
𝑊𝐹𝑖 = (𝑂𝑅𝑖∗ 𝑃𝑖 )
(𝑂𝑅𝑖∗ 𝑃𝑖 )𝑖..............................................................................................................3.7
=
𝑜𝑟 𝑖𝑆𝐹 1𝑖
∗ 𝑝 𝑖
𝑆𝐹 2𝑖
(𝑜𝑟 𝑖𝑆𝐹 1𝑖
∗ 𝑝 𝑖
𝑆𝐹 2𝑖)𝑖
= (𝑜𝑟 𝑖∗ 𝑝𝑖 )
(𝑜𝑟 𝑖∗ 𝑝𝑖 )𝑖..............................................................................................3.8
As seen from equation 3.8, weighting factor (WFi) is independent of the scaling
factor.
The advantage of using a multiplicative scheme is that there is no requirement for
scaling. But, there is an outweighing disadvantage to it as well. The multiplicative
scheme allocates a latent bias to criteria that has large standard deviation. For example if
one criterion has a standard deviation from mean significantly larger than the other
criteria, then there will be more weightage to that criterion. Thus, a multiplicative
scheme, although considered, has to be overlooked.
29
Figure 3-1: Different scaling and weighting methods considered for the determination of weighting factor
That leaves us with an additive scheme based approach. In an additive scheme,
there are several steps that have to be followed. First, each criteria has to be scaled by a
particular scaling method and consequently a weighting factor is allocated to each criteria
based on the various weighting methods. So, now the probing question is which scaling
method works best with which weighting method. Velazquez et al. [2010] thoroughly
analyzed what is the best combination of weighting–scaling methods for single and
multiple decision makers using the weighted sum decision making model.35
The result of
the research states, “Overall, considering both single and group decision making, the best
method was vector scaling L∞ Norm with ranking which outperformed all other
combinations of methods. The worst method was the combination of vector scaling L∞
Norm with L∞ Metric”. So, In the event of having several decision makers trying to do a
medical budgeting or any policy making, a vector scaling „L∞ Norm‟ with a „ranking‟
weighting methodology is the best option.
Step 1: Scaling the elements
In vector normalization, each criterion is divided by the Lp norm36
and is defined
below:
Let ori represent the odds ratio of chronic disease i
pi represent the prevalence of chronic disease i
ORi represent the scaled odds ratio of chronic disease i
ORi = (ori/ Lp1)......................................................................................................3.9
Pi represent the scaled prevalence of chronic disease i
Pi = (pi/ Lp2).........................................................................................................3.10

31
Since, L∞ Norm is chosen; p takes on the value ∞ and L∞ is defined as36
L∞1 = Max { | ori |, i = 1,2,3,…24}......................................................................3.11
L∞2 = Max { | pi |, i = 1,2,3,…24}.......................................................................3.12
Thus, the L∞ scaled criteria are:-
ORi = ( ori/ L∞1 ) = ( ori/ Max |ori| ).....................................................................3.13
Pi = ( pi/ L∞2 ) = ( pi/ Max |pi| )............................................................................3.14
Step 2: Ranking to determine weights
The Decision maker ranks all the criteria in order of increasing relative importance and
the highest criterion gets the rank of one.37
Let ri represent the rank of the ith
criterion,
λi represent the weight of the ith
criterion
k represent the number of alternatives
λi = (k- ri + 1)/{( ∑j (k – rj +1) where j = 1 to k}.................................................3.15
Step 3: Arriving at the Score
Utilizing the weight of the criterion and the scaled values of every element, we can come
up with the score for each alternative.
Si = ∑j {(λi * ORi) where i = 1 to 24}...................................................................3.16
Step 4: Normalizing the Score – Weighting Factor (WF)
In order to represent each score as a fraction of 1, we need to normalize the final score.
WFi = Si / {∑i Si where i = 1 to 24} ...................................................................3.17
32
As far as this thesis work is concerned, there are two criteria which need to be
accounted for while forming the weighting factor. Since there are no decision makers, it
is assumed that both prevalence and impact have equal importance. That rules out the
scope for any weighting methods and of course L∞ Norm is selected as the scaling
method.
Thus, λ1 = λ2 = 0.5, which reduces Si = 0.5 (ORi + Pi).........................................3.18
Since, 0.5 in equation 3.18 is just a plain constant and will not contribute towards
the weighting factor, we could drop it off and we would have a weighting factor which is
the L∞ scaled sum of the two criteria. This of course is consequently converted to a
fraction of 1.
33
Chapter 4 RESULTS
The aim of the model discussed in chapter 3 was to come up with a single weighting
factor that could quantify the importance of the various chronic conditions considered. In this
section, all the actual results after running the model at each level are shown and the results are
relevantly discussed.
4.1 Discussion of prevalence results
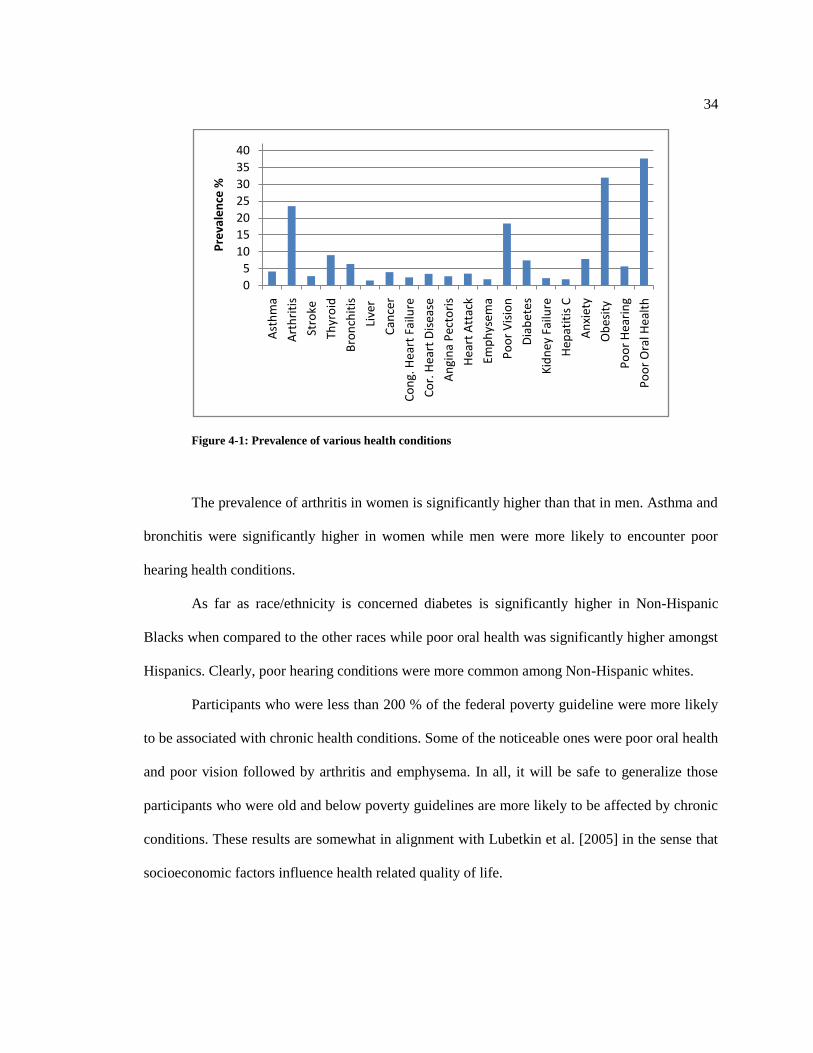
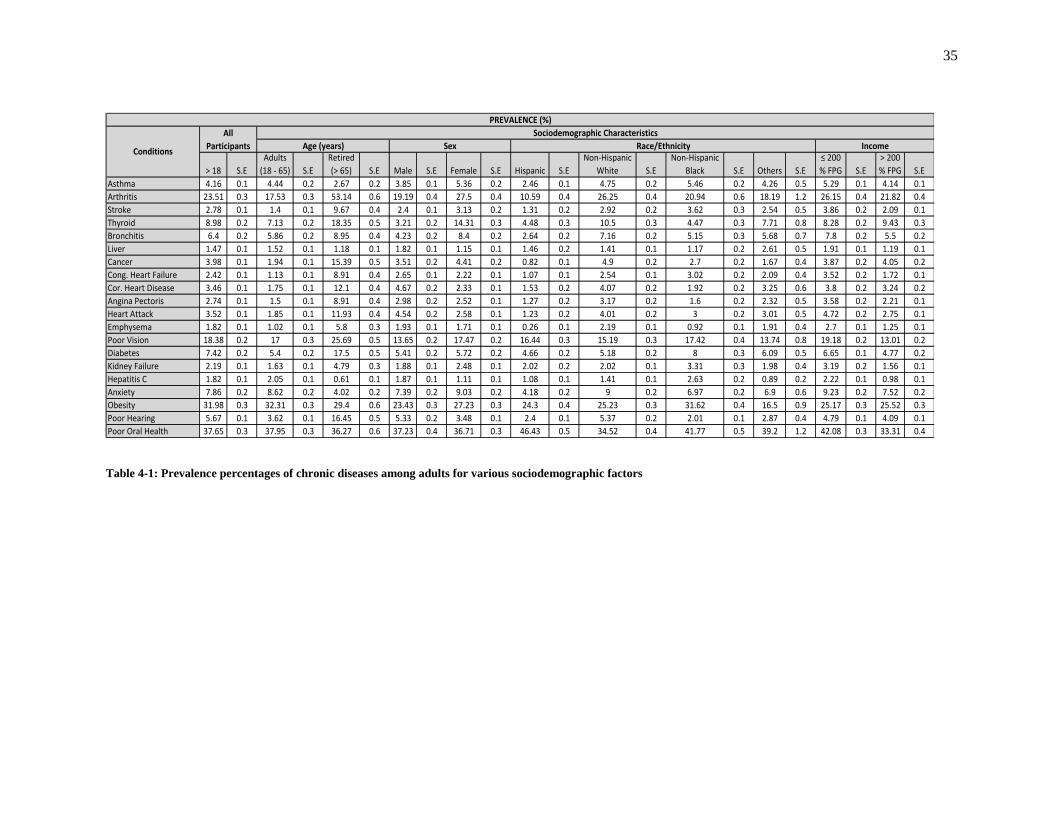
Prevalence as discussed in chapter 3 is calculated as the ratio of the number of
people who had the condition to the total number of people examined. Table 4.1 shows the
prevalence percentages along with the standard errors for the various chronic conditions
categorized by the sociodemographic characteristics. Most of the prevalence results were in
alignment with the national prevalence percentages. The most prevalent health conditions among
American adults are Poor Oral health, obesity, arthritis, poor vision and thyroid diseases. This has
been touched upon by several of the prior research.1-16
It is quite evident that participants from the
“retired” (greater than 65 years) age group, quite understandably so, had significantly higher
prevalence percentages in many of the chronic conditions. Some of the percentages that were
significantly higher when compared to the “adults” (between 18 and 65 years) age group were for
the chronic conditions Arthritis, Thyroid, Cancer and Cardiovascular diseases. But, one condition
that was significantly lower among the retired age group when compared to other age groups was
anxiety.
34
Figure 4-1: Prevalence of various health conditions
The prevalence of arthritis in women is significantly higher than that in men. Asthma and
bronchitis were significantly higher in women while men were more likely to encounter poor
hearing health conditions.
As far as race/ethnicity is concerned diabetes is significantly higher in Non-Hispanic
Blacks when compared to the other races while poor oral health was significantly higher amongst
Hispanics. Clearly, poor hearing conditions were more common among Non-Hispanic whites.
Participants who were less than 200 % of the federal poverty guideline were more likely
to be associated with chronic health conditions. Some of the noticeable ones were poor oral health
and poor vision followed by arthritis and emphysema. In all, it will be safe to generalize those
participants who were old and below poverty guidelines are more likely to be affected by chronic
conditions. These results are somewhat in alignment with Lubetkin et al. [2005] in the sense that
socioeconomic factors influence health related quality of life.
0
5
10
15
20
25
30
35
40
Ast
hm
a
Art
hri
tis
Stro
ke
Thyr
oid
Bro
nch
itis
Live
r
Can
cer
Co
ng.
Hea
rt F
ailu
re
Co
r. H
eart
Dis
ease
An
gin
a P
ecto
ris
Hea
rt A
ttac
k
Emp
hys
ema
Po
or
Vis
ion
Dia
bet
es
Kid
ney
Fai
lure
Hep
atit
is C
An
xiet
y
Ob
esit
y
Po
or
Hea
rin
g
Po
or
Ora
l Hea
lth
Pre
vale
nce
%
35
> 18 S.E
Adults
(18 - 65) S.E
Retired
(> 65) S.E Male S.E Female S.E Hispanic S.E
Non-Hispanic
White S.E
Non-Hispanic
Black S.E Others S.E
≤ 200
% FPG S.E
> 200
% FPG S.E
Asthma 4.16 0.1 4.44 0.2 2.67 0.2 3.85 0.1 5.36 0.2 2.46 0.1 4.75 0.2 5.46 0.2 4.26 0.5 5.29 0.1 4.14 0.1
Arthritis 23.51 0.3 17.53 0.3 53.14 0.6 19.19 0.4 27.5 0.4 10.59 0.4 26.25 0.4 20.94 0.6 18.19 1.2 26.15 0.4 21.82 0.4
Stroke 2.78 0.1 1.4 0.1 9.67 0.4 2.4 0.1 3.13 0.2 1.31 0.2 2.92 0.2 3.62 0.3 2.54 0.5 3.86 0.2 2.09 0.1
Thyroid 8.98 0.2 7.13 0.2 18.35 0.5 3.21 0.2 14.31 0.3 4.48 0.3 10.5 0.3 4.47 0.3 7.71 0.8 8.28 0.2 9.43 0.3
Bronchitis 6.4 0.2 5.86 0.2 8.95 0.4 4.23 0.2 8.4 0.2 2.64 0.2 7.16 0.2 5.15 0.3 5.68 0.7 7.8 0.2 5.5 0.2
Liver 1.47 0.1 1.52 0.1 1.18 0.1 1.82 0.1 1.15 0.1 1.46 0.2 1.41 0.1 1.17 0.2 2.61 0.5 1.91 0.1 1.19 0.1
Cancer 3.98 0.1 1.94 0.1 15.39 0.5 3.51 0.2 4.41 0.2 0.82 0.1 4.9 0.2 2.7 0.2 1.67 0.4 3.87 0.2 4.05 0.2
Cong. Heart Failure 2.42 0.1 1.13 0.1 8.91 0.4 2.65 0.1 2.22 0.1 1.07 0.1 2.54 0.1 3.02 0.2 2.09 0.4 3.52 0.2 1.72 0.1
Cor. Heart Disease 3.46 0.1 1.75 0.1 12.1 0.4 4.67 0.2 2.33 0.1 1.53 0.2 4.07 0.2 1.92 0.2 3.25 0.6 3.8 0.2 3.24 0.2
Angina Pectoris 2.74 0.1 1.5 0.1 8.91 0.4 2.98 0.2 2.52 0.1 1.27 0.2 3.17 0.2 1.6 0.2 2.32 0.5 3.58 0.2 2.21 0.1
Heart Attack 3.52 0.1 1.85 0.1 11.93 0.4 4.54 0.2 2.58 0.1 1.23 0.2 4.01 0.2 3 0.2 3.01 0.5 4.72 0.2 2.75 0.1
Emphysema 1.82 0.1 1.02 0.1 5.8 0.3 1.93 0.1 1.71 0.1 0.26 0.1 2.19 0.1 0.92 0.1 1.91 0.4 2.7 0.1 1.25 0.1
Poor Vision 18.38 0.2 17 0.3 25.69 0.5 13.65 0.2 17.47 0.2 16.44 0.3 15.19 0.3 17.42 0.4 13.74 0.8 19.18 0.2 13.01 0.2
Diabetes 7.42 0.2 5.4 0.2 17.5 0.5 5.41 0.2 5.72 0.2 4.66 0.2 5.18 0.2 8 0.3 6.09 0.5 6.65 0.1 4.77 0.2
Kidney Failure 2.19 0.1 1.63 0.1 4.79 0.3 1.88 0.1 2.48 0.1 2.02 0.2 2.02 0.1 3.31 0.3 1.98 0.4 3.19 0.2 1.56 0.1
Hepatitis C 1.82 0.1 2.05 0.1 0.61 0.1 1.87 0.1 1.11 0.1 1.08 0.1 1.41 0.1 2.63 0.2 0.89 0.2 2.22 0.1 0.98 0.1
Anxiety 7.86 0.2 8.62 0.2 4.02 0.2 7.39 0.2 9.03 0.2 4.18 0.2 9 0.2 6.97 0.2 6.9 0.6 9.23 0.2 7.52 0.2
Obesity 31.98 0.3 32.31 0.3 29.4 0.6 23.43 0.3 27.23 0.3 24.3 0.4 25.23 0.3 31.62 0.4 16.5 0.9 25.17 0.3 25.52 0.3
Poor Hearing 5.67 0.1 3.62 0.1 16.45 0.5 5.33 0.2 3.48 0.1 2.4 0.1 5.37 0.2 2.01 0.1 2.87 0.4 4.79 0.1 4.09 0.1
Poor Oral Health 37.65 0.3 37.95 0.3 36.27 0.6 37.23 0.4 36.71 0.3 46.43 0.5 34.52 0.4 41.77 0.5 39.2 1.2 42.08 0.3 33.31 0.4
Conditions
All
Participants Age (years) Sex Race/Ethnicity Income
PREVALENCE (%)
Sociodemographic Characteristics
Table 4-1: Prevalence percentages of chronic diseases among adults for various sociodemographic factors
36
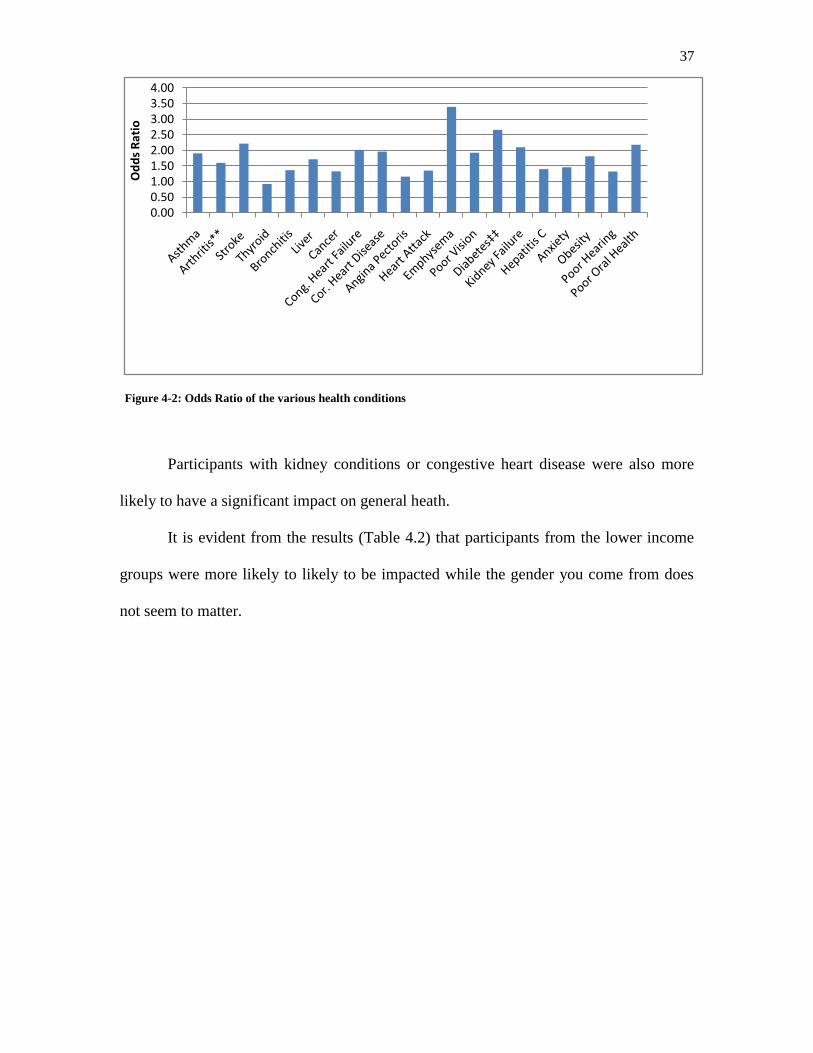
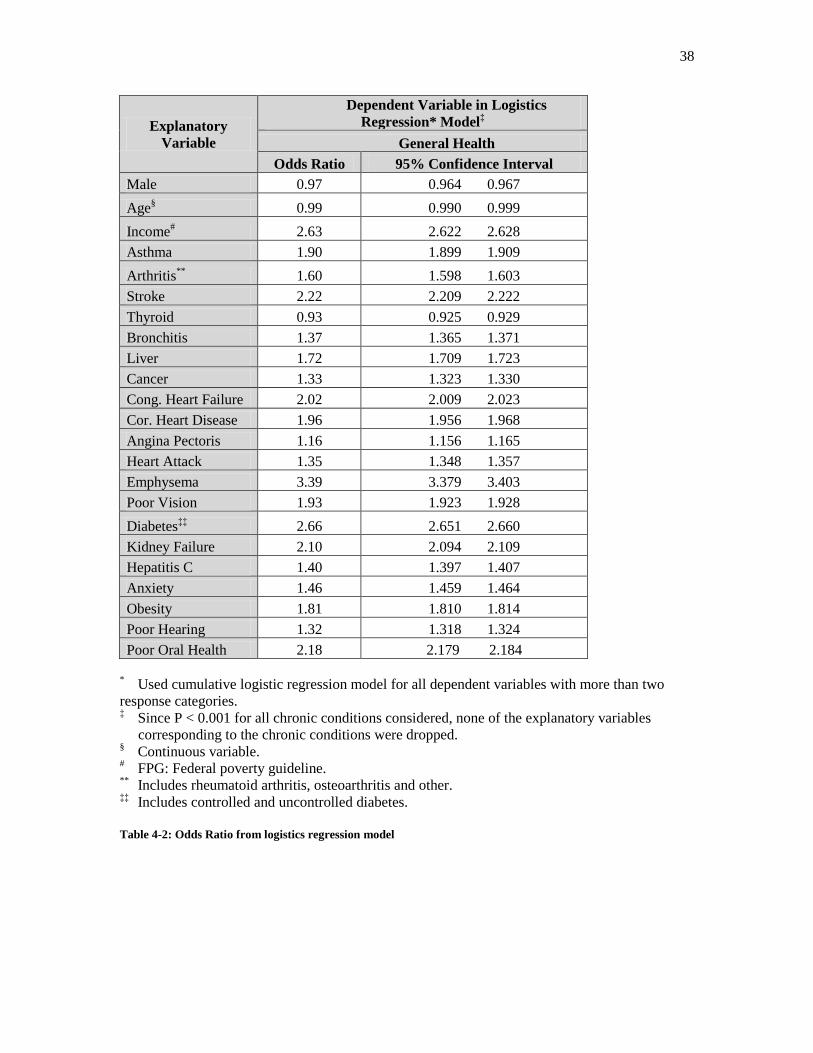
4.2 Odds Ratio along with 95% Confidence Interval
As described in detail in chapter 3, a logistic regression model is utilized to explore
the impact of chronic diseases on general health in American Adults (age >=18) after
controlling for common risk factors (i.e., age, sex, race or ethnicity and income levels).
The variable, „General health‟, in NHANES has different levels of response viz.,
excellent, very good, good, fair, poor. These levels are grouped into simply two discrete
levels namely good and bad. So, the model was built with general health as the dependent
variable and the various chronic diseases and risk factors as independent variables.
Some of the very noticeable chronic conditions that have a severe impact on
health are emphysema, diabetes, stroke and poor oral health. These results when
compared to what was found in earlier research have both similarities and differences too.
It has been clearly established3, 13
that diabetes influences quality of life and what is found
here only complements that fact. But, the findings which are related to emphysema is
quite different from what is found in literature. In an isolated study in COPD, it has been
shown that patients with COPD have a substantial compromise on quality of life.6
Although emphysema has been considered in many research efforts 6-7, 9, 14-15
, not many
have reported emphysema as a condition that affects the quality of life by much. But, the
top finding (through the odds ratio) is that emphysema has a significant impact on general
health. Stroke and more so poor oral health, historically, have never been highlighted as
chronic conditions which can influence health. Fig 4.2 shows the impact of various
chronic conditions on general health adjusted for risk factors.
37
Participants with kidney conditions or congestive heart disease were also more
likely to have a significant impact on general heath.
It is evident from the results (Table 4.2) that participants from the lower income
groups were more likely to likely to be impacted while the gender you come from does
not seem to matter.
0.000.501.001.502.002.503.003.504.00
Od
ds
Rat
io
Figure 4-2: Odds Ratio of the various health conditions
38
Explanatory
Variable
Dependent Variable in Logistics
Regression* Model‡
General Health
Odds Ratio 95% Confidence Interval
Male 0.97 0.964 0.967
Age§ 0.99 0.990 0.999
Income# 2.63 2.622 2.628
Asthma 1.90 1.899 1.909
Arthritis**
1.60 1.598 1.603
Stroke 2.22 2.209 2.222
Thyroid 0.93 0.925 0.929
Bronchitis 1.37 1.365 1.371
Liver 1.72 1.709 1.723
Cancer 1.33 1.323 1.330
Cong. Heart Failure 2.02 2.009 2.023
Cor. Heart Disease 1.96 1.956 1.968
Angina Pectoris 1.16 1.156 1.165
Heart Attack 1.35 1.348 1.357
Emphysema 3.39 3.379 3.403
Poor Vision 1.93 1.923 1.928
Diabetes‡‡
2.66 2.651 2.660
Kidney Failure 2.10 2.094 2.109
Hepatitis C 1.40 1.397 1.407
Anxiety 1.46 1.459 1.464
Obesity 1.81 1.810 1.814
Poor Hearing 1.32 1.318 1.324
Poor Oral Health 2.18 2.179 2.184
* Used cumulative logistic regression model for all dependent variables with more than two
response categories. ‡ Since P < 0.001 for all chronic conditions considered, none of the explanatory variables
corresponding to the chronic conditions were dropped. § Continuous variable.
# FPG: Federal poverty guideline.
** Includes rheumatoid arthritis, osteoarthritis and other.
‡‡ Includes controlled and uncontrolled diabetes.
Table 4-2: Odds Ratio from logistics regression model
39
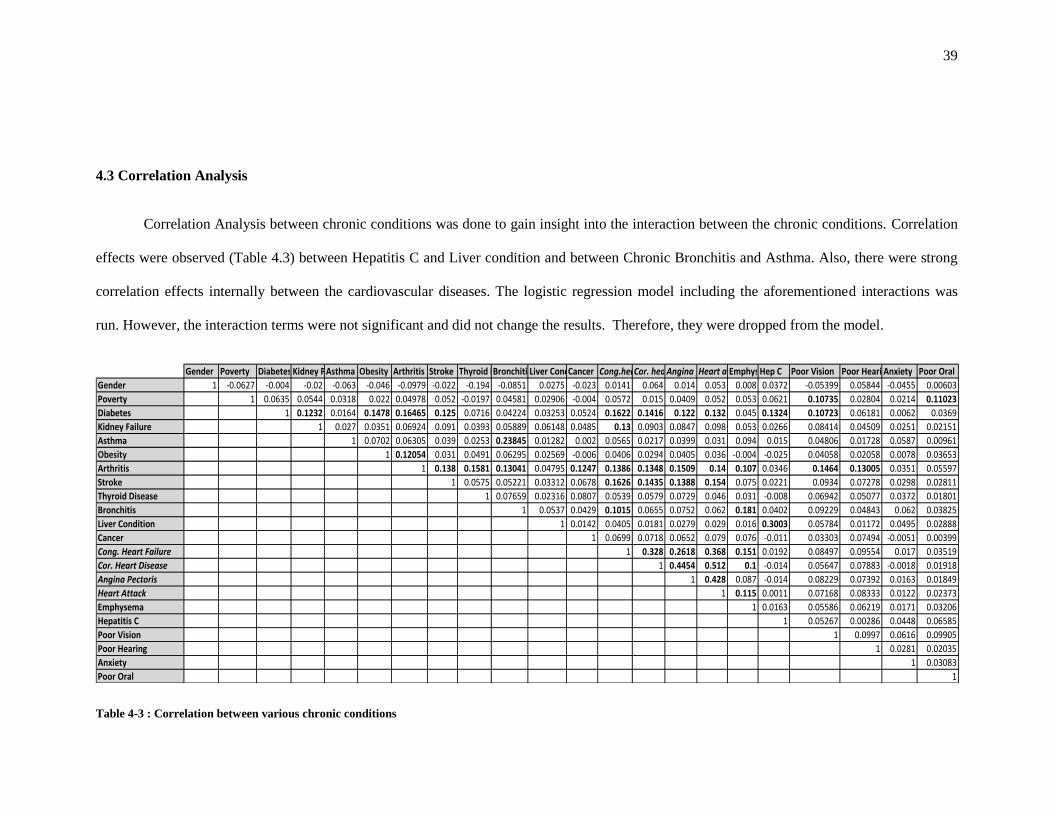
4.3 Correlation Analysis
Correlation Analysis between chronic conditions was done to gain insight into the interaction between the chronic conditions. Correlation
effects were observed (Table 4.3) between Hepatitis C and Liver condition and between Chronic Bronchitis and Asthma. Also, there were strong
correlation effects internally between the cardiovascular diseases. The logistic regression model including the aforementioned interactions was
run. However, the interaction terms were not significant and did not change the results. Therefore, they were dropped from the model.
Gender Poverty Diabetes Kidney ProblemAsthma Obesity Arthritis Stroke Thyroid DiseaseBronchitisLiver ConditionCancer Cong.heart failureCor. heart diseaseAngina pectorisHeart attackEmphysemaHep C Poor Vision Poor HearingAnxiety Poor Oral
Gender 1 -0.0627 -0.004 -0.02 -0.063 -0.046 -0.0979 -0.022 -0.194 -0.0851 0.0275 -0.023 0.0141 0.064 0.014 0.053 0.008 0.0372 -0.05399 0.05844 -0.0455 0.00603
Poverty 1 0.0635 0.0544 0.0318 0.022 0.04978 0.052 -0.0197 0.04581 0.02906 -0.004 0.0572 0.015 0.0409 0.052 0.053 0.0621 0.10735 0.02804 0.0214 0.11023
Diabetes 1 0.1232 0.0164 0.1478 0.16465 0.125 0.0716 0.04224 0.03253 0.0524 0.1622 0.1416 0.122 0.132 0.045 0.1324 0.10723 0.06181 0.0062 0.0369
Kidney Failure 1 0.027 0.0351 0.06924 0.091 0.0393 0.05889 0.06148 0.0485 0.13 0.0903 0.0847 0.098 0.053 0.0266 0.08414 0.04509 0.0251 0.02151
Asthma 1 0.0702 0.06305 0.039 0.0253 0.23845 0.01282 0.002 0.0565 0.0217 0.0399 0.031 0.094 0.015 0.04806 0.01728 0.0587 0.00961
Obesity 1 0.12054 0.031 0.0491 0.06295 0.02569 -0.006 0.0406 0.0294 0.0405 0.036 -0.004 -0.025 0.04058 0.02058 0.0078 0.03653
Arthritis 1 0.138 0.1581 0.13041 0.04795 0.1247 0.1386 0.1348 0.1509 0.14 0.107 0.0346 0.1464 0.13005 0.0351 0.05597
Stroke 1 0.0575 0.05221 0.03312 0.0678 0.1626 0.1435 0.1388 0.154 0.075 0.0221 0.0934 0.07278 0.0298 0.02811
Thyroid Disease 1 0.07659 0.02316 0.0807 0.0539 0.0579 0.0729 0.046 0.031 -0.008 0.06942 0.05077 0.0372 0.01801
Bronchitis 1 0.0537 0.0429 0.1015 0.0655 0.0752 0.062 0.181 0.0402 0.09229 0.04843 0.062 0.03825
Liver Condition 1 0.0142 0.0405 0.0181 0.0279 0.029 0.016 0.3003 0.05784 0.01172 0.0495 0.02888
Cancer 1 0.0699 0.0718 0.0652 0.079 0.076 -0.011 0.03303 0.07494 -0.0051 0.00399
Cong. Heart Failure 1 0.328 0.2618 0.368 0.151 0.0192 0.08497 0.09554 0.017 0.03519
Cor. Heart Disease 1 0.4454 0.512 0.1 -0.014 0.05647 0.07883 -0.0018 0.01918
Angina Pectoris 1 0.428 0.087 -0.014 0.08229 0.07392 0.0163 0.01849
Heart Attack 1 0.115 0.0011 0.07168 0.08333 0.0122 0.02373
Emphysema 1 0.0163 0.05586 0.06219 0.0171 0.03206
Hepatitis C 1 0.05267 0.00286 0.0448 0.06585
Poor Vision 1 0.0997 0.0616 0.09905
Poor Hearing 1 0.0281 0.02035
Anxiety 1 0.03083
Poor Oral 1
Table 4-3 : Correlation between various chronic conditions
4.4 Weighting factor
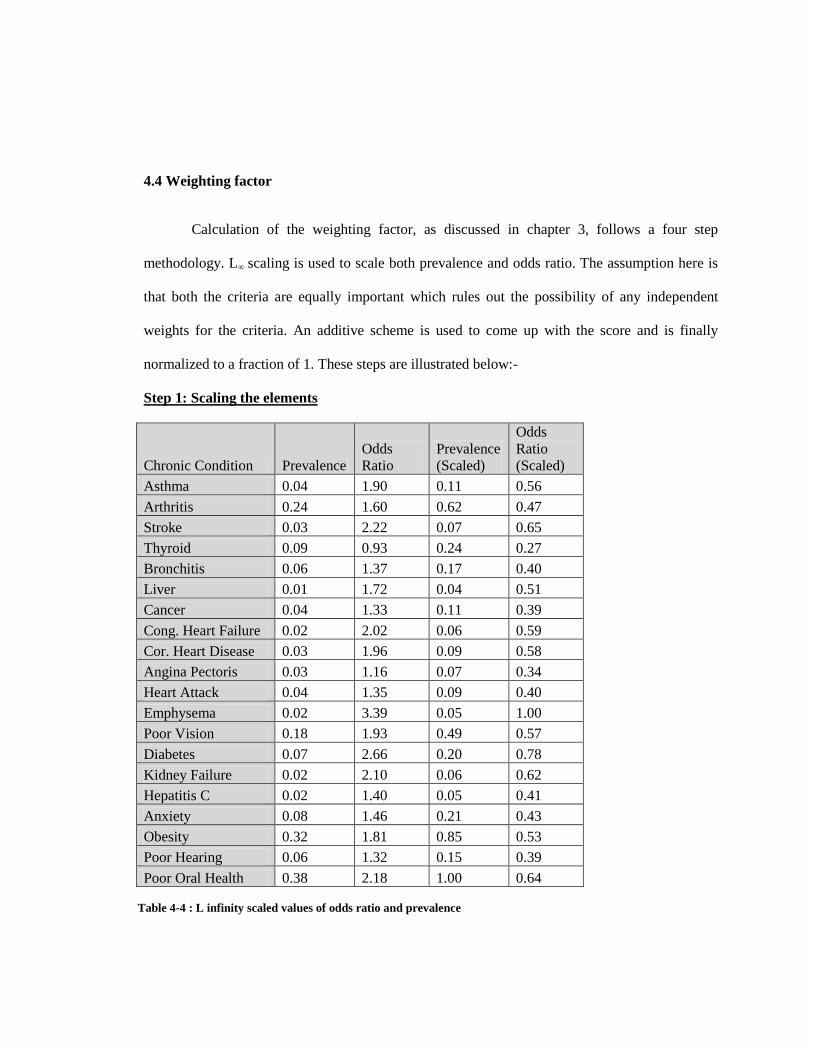
Calculation of the weighting factor, as discussed in chapter 3, follows a four step
methodology. L∞ scaling is used to scale both prevalence and odds ratio. The assumption here is
that both the criteria are equally important which rules out the possibility of any independent
weights for the criteria. An additive scheme is used to come up with the score and is finally
normalized to a fraction of 1. These steps are illustrated below:-
Step 1: Scaling the elements
Chronic Condition Prevalence
Odds
Ratio
Prevalence
(Scaled)
Odds
Ratio
(Scaled)
Asthma 0.04 1.90 0.11 0.56
Arthritis 0.24 1.60 0.62 0.47
Stroke 0.03 2.22 0.07 0.65
Thyroid 0.09 0.93 0.24 0.27
Bronchitis 0.06 1.37 0.17 0.40
Liver 0.01 1.72 0.04 0.51
Cancer 0.04 1.33 0.11 0.39
Cong. Heart Failure 0.02 2.02 0.06 0.59
Cor. Heart Disease 0.03 1.96 0.09 0.58
Angina Pectoris 0.03 1.16 0.07 0.34
Heart Attack 0.04 1.35 0.09 0.40
Emphysema 0.02 3.39 0.05 1.00
Poor Vision 0.18 1.93 0.49 0.57
Diabetes 0.07 2.66 0.20 0.78
Kidney Failure 0.02 2.10 0.06 0.62
Hepatitis C 0.02 1.40 0.05 0.41
Anxiety 0.08 1.46 0.21 0.43
Obesity 0.32 1.81 0.85 0.53
Poor Hearing 0.06 1.32 0.15 0.39
Poor Oral Health 0.38 2.18 1.00 0.64
Table 4-4 : L infinity scaled values of odds ratio and prevalence
41
Step 2: Ranking to determine weights of the criteria
Since, we assume that both impact and prevalence are of equal importance, both
of them have equal preference.
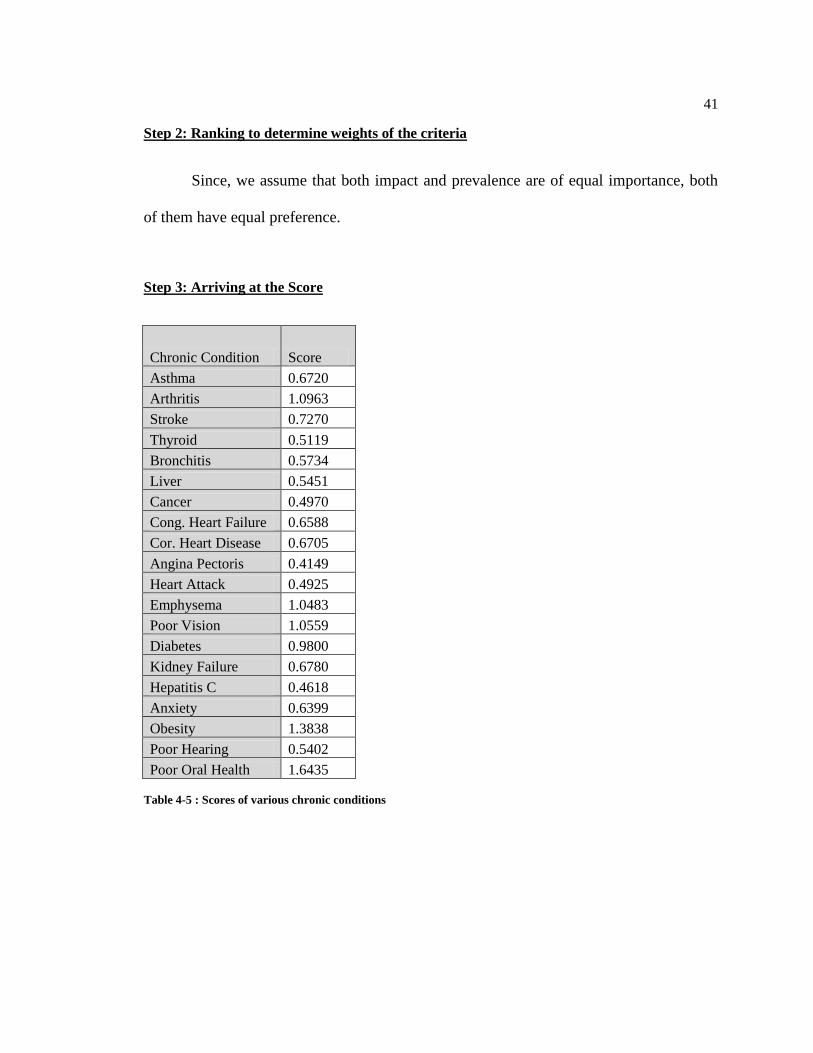
Step 3: Arriving at the Score
Chronic Condition Score
Asthma 0.6720
Arthritis 1.0963
Stroke 0.7270
Thyroid 0.5119
Bronchitis 0.5734
Liver 0.5451
Cancer 0.4970
Cong. Heart Failure 0.6588
Cor. Heart Disease 0.6705
Angina Pectoris 0.4149
Heart Attack 0.4925
Emphysema 1.0483
Poor Vision 1.0559
Diabetes 0.9800
Kidney Failure 0.6780
Hepatitis C 0.4618
Anxiety 0.6399
Obesity 1.3838
Poor Hearing 0.5402
Poor Oral Health 1.6435
Table 4-5 : Scores of various chronic conditions
42
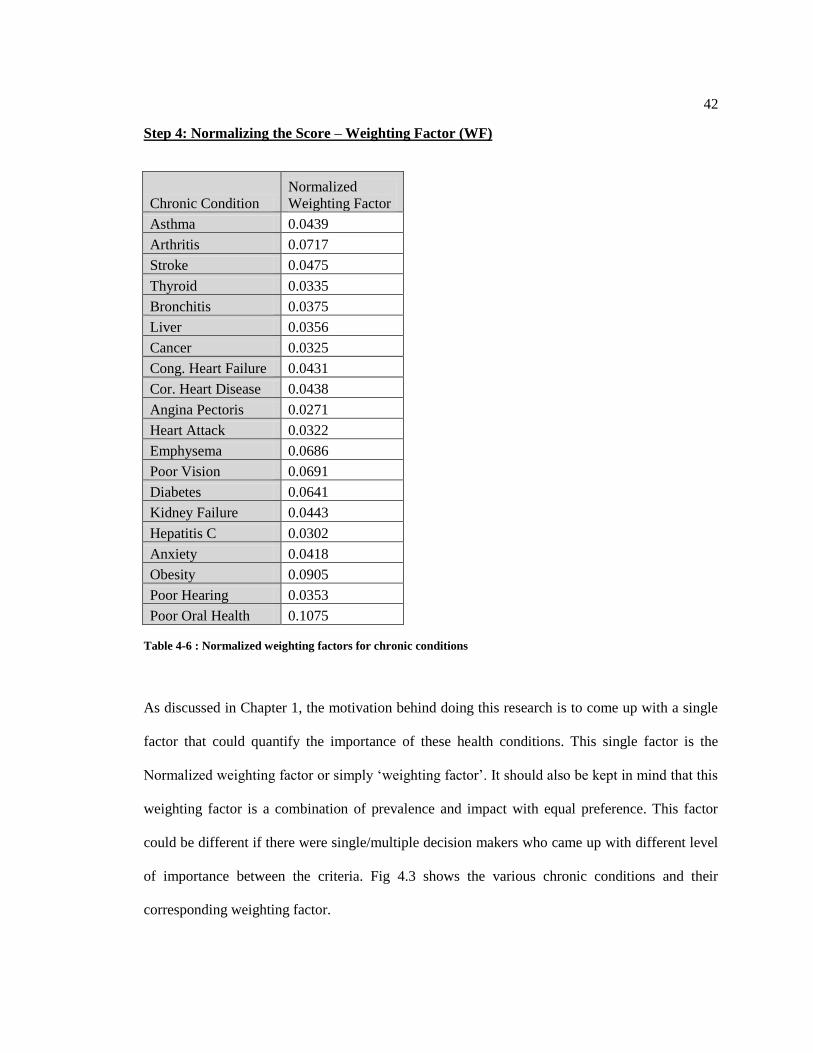
Step 4: Normalizing the Score – Weighting Factor (WF)
Chronic Condition
Normalized
Weighting Factor
Asthma 0.0439
Arthritis 0.0717
Stroke 0.0475
Thyroid 0.0335
Bronchitis 0.0375
Liver 0.0356
Cancer 0.0325
Cong. Heart Failure 0.0431
Cor. Heart Disease 0.0438
Angina Pectoris 0.0271
Heart Attack 0.0322
Emphysema 0.0686
Poor Vision 0.0691
Diabetes 0.0641
Kidney Failure 0.0443
Hepatitis C 0.0302
Anxiety 0.0418
Obesity 0.0905
Poor Hearing 0.0353
Poor Oral Health 0.1075
Table 4-6 : Normalized weighting factors for chronic conditions
As discussed in Chapter 1, the motivation behind doing this research is to come up with a single
factor that could quantify the importance of these health conditions. This single factor is the
Normalized weighting factor or simply „weighting factor‟. It should also be kept in mind that this
weighting factor is a combination of prevalence and impact with equal preference. This factor
could be different if there were single/multiple decision makers who came up with different level
of importance between the criteria. Fig 4.3 shows the various chronic conditions and their
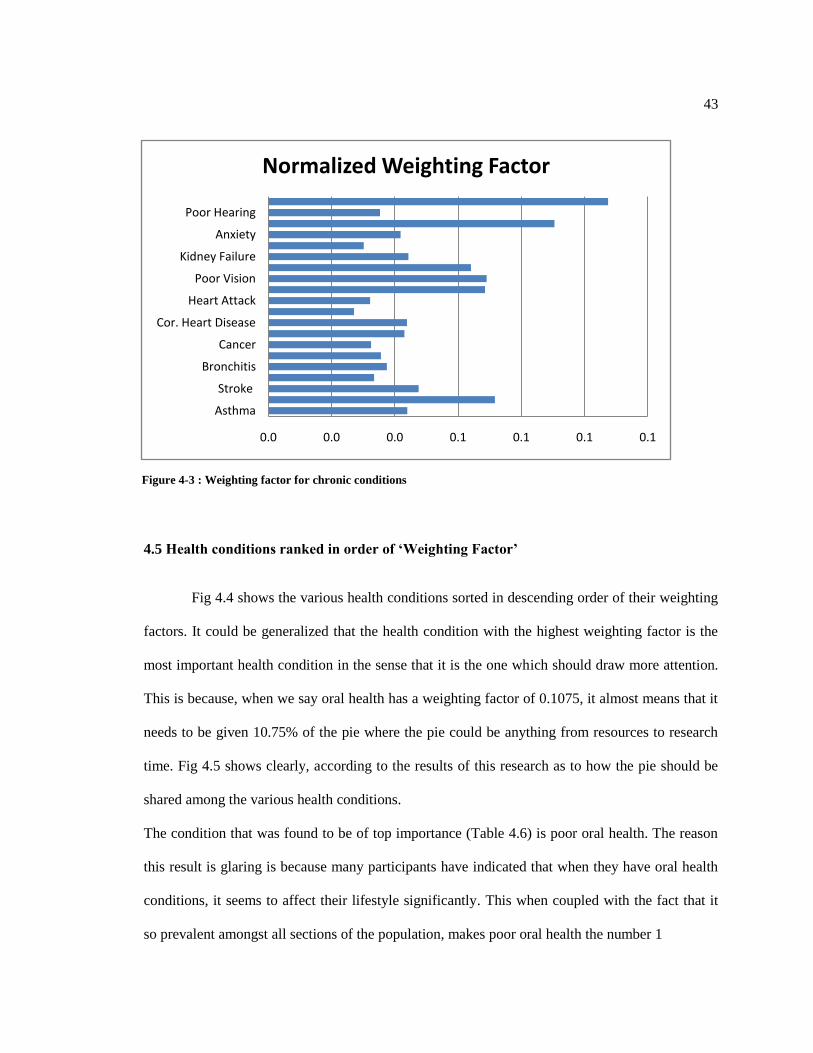
corresponding weighting factor.
43
0.0 0.0 0.0 0.1 0.1 0.1 0.1
Asthma
Stroke
Bronchitis
Cancer
Cor. Heart Disease
Heart Attack
Poor Vision
Kidney Failure
Anxiety
Poor Hearing
Normalized Weighting Factor
4.5 Health conditions ranked in order of ‘Weighting Factor’
Fig 4.4 shows the various health conditions sorted in descending order of their weighting
factors. It could be generalized that the health condition with the highest weighting factor is the
most important health condition in the sense that it is the one which should draw more attention.
This is because, when we say oral health has a weighting factor of 0.1075, it almost means that it
needs to be given 10.75% of the pie where the pie could be anything from resources to research
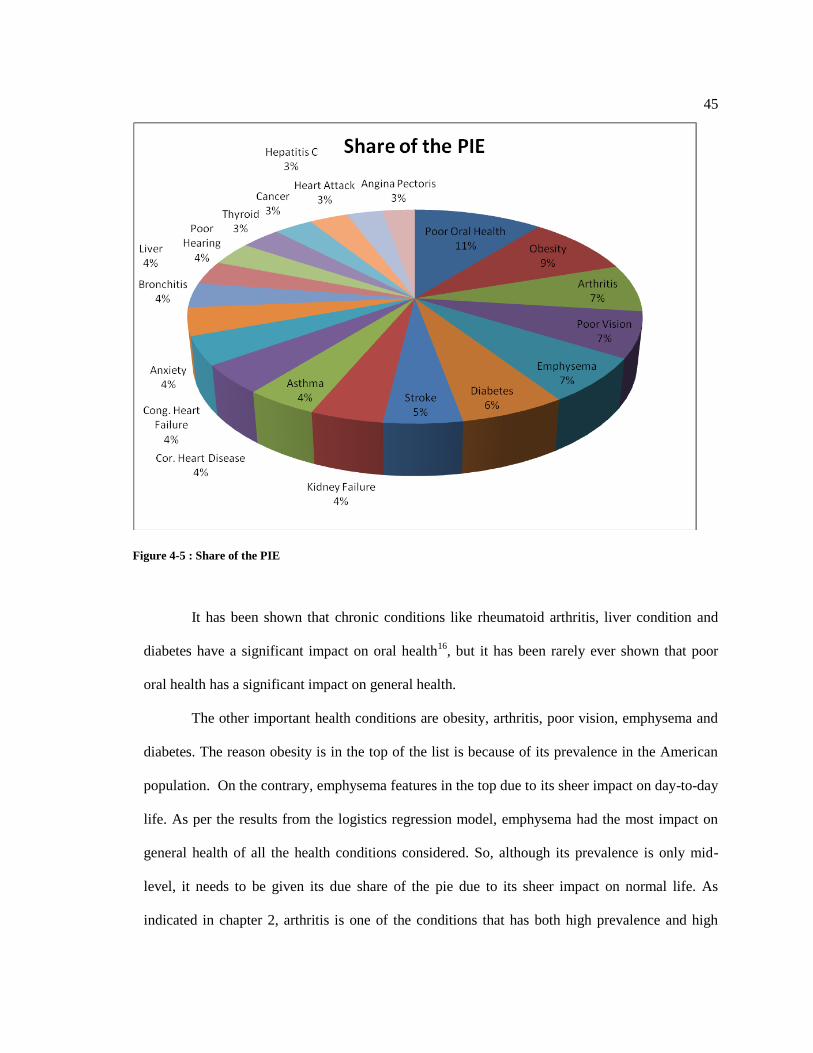
time. Fig 4.5 shows clearly, according to the results of this research as to how the pie should be
shared among the various health conditions.
The condition that was found to be of top importance (Table 4.6) is poor oral health. The reason
this result is glaring is because many participants have indicated that when they have oral health
conditions, it seems to affect their lifestyle significantly. This when coupled with the fact that it
so prevalent amongst all sections of the population, makes poor oral health the number 1
Figure 4-3 : Weighting factor for chronic conditions
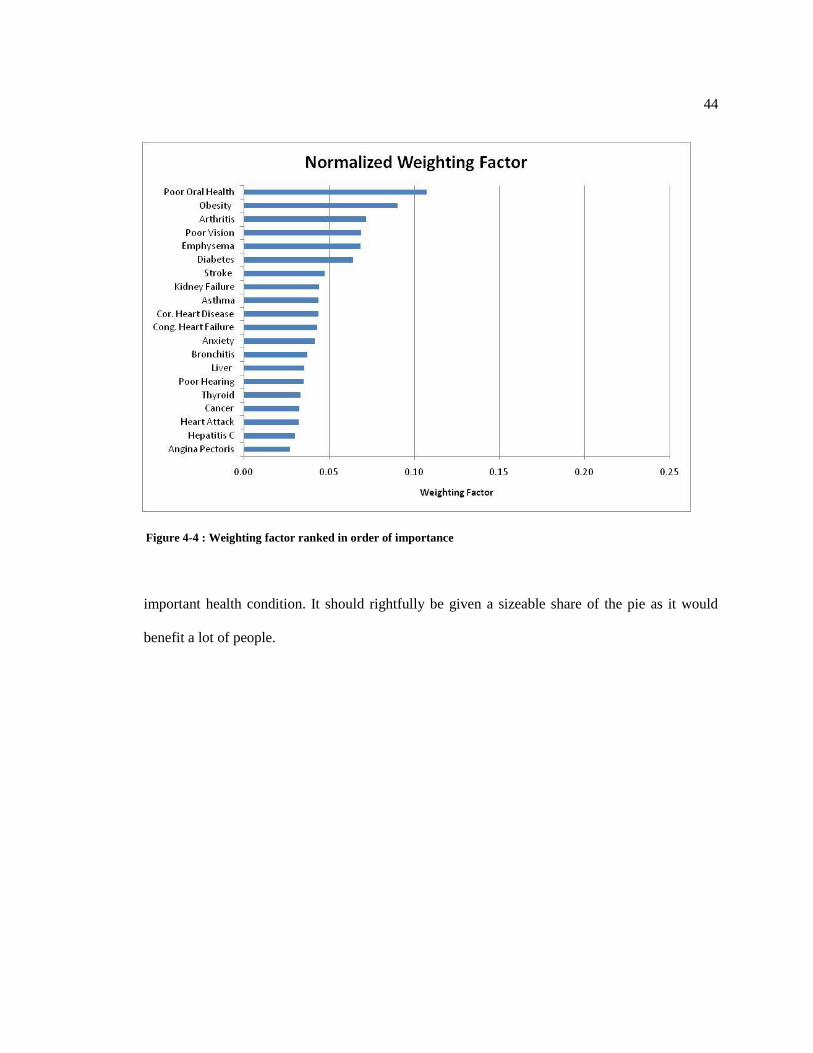
44
important health condition. It should rightfully be given a sizeable share of the pie as it would
benefit a lot of people.
Figure 4-4 : Weighting factor ranked in order of importance
45
It has been shown that chronic conditions like rheumatoid arthritis, liver condition and
diabetes have a significant impact on oral health16
, but it has been rarely ever shown that poor
oral health has a significant impact on general health.
The other important health conditions are obesity, arthritis, poor vision, emphysema and
diabetes. The reason obesity is in the top of the list is because of its prevalence in the American
population. On the contrary, emphysema features in the top due to its sheer impact on day-to-day
life. As per the results from the logistics regression model, emphysema had the most impact on
general health of all the health conditions considered. So, although its prevalence is only mid-
level, it needs to be given its due share of the pie due to its sheer impact on normal life. As
indicated in chapter 2, arthritis is one of the conditions that has both high prevalence and high
Figure 4-5 : Share of the PIE

46
impact on general health. Poor vision and diabetes are the other two health conditions which call
for a good share of the pie.
Chronic
Condition Prevalence
Odds
Ratio
Prevalence
(Scaled)
Odds
Ratio
(Scaled) Score
Normalized
Weighting
Factor
Poor Oral
Health 0.38 2.18 1.00 0.64 1.6435 0.1075
Obesity 0.32 1.81 0.85 0.53 1.3838 0.0905
Arthritis 0.24 1.60 0.62 0.47 1.0963 0.0717
Poor Vision 0.18 1.93 0.49 0.57 1.0559 0.0691
Emphysema 0.02 3.39 0.05 1.00 1.0483 0.0686
Diabetes 0.07 2.66 0.20 0.78 0.9800 0.0641
Stroke 0.03 2.22 0.07 0.65 0.7270 0.0475
Kidney
Failure 0.02 2.10 0.06 0.62 0.6780 0.0443
Asthma 0.04 1.90 0.11 0.56 0.6720 0.0439
Cor. Heart
Disease 0.03 1.96 0.09 0.58 0.6705 0.0438
Cong. Heart
Failure 0.02 2.02 0.06 0.59 0.6588 0.0431
Anxiety 0.08 1.46 0.21 0.43 0.6399 0.0418
Bronchitis 0.06 1.37 0.17 0.40 0.5734 0.0375
Liver 0.01 1.72 0.04 0.51 0.5451 0.0356
Poor Hearing 0.06 1.32 0.15 0.39 0.5402 0.0353
Thyroid 0.09 0.93 0.24 0.27 0.5119 0.0335
Cancer 0.04 1.33 0.11 0.39 0.4970 0.0325
Heart Attack 0.04 1.35 0.09 0.40 0.4925 0.0322
Hepatitis C 0.02 1.40 0.05 0.41 0.4618 0.0302
Angina
Pectoris 0.03 1.16 0.07 0.34 0.4149 0.0271
Table 4-7 : Weighting factors of chronic conditions ranked in order of importance
47
Chapter 5 CONCLUSION
The impact of chronic health conditions on general health is an important topic due to the
indecision surrounding, which health conditions should draw more attention by decision makers
who influence health care needs, public policy making, and research priorities. This thesis
focused on analyzing the individual impact of chronic diseases along with their prevalence and
more importantly developing a single factor that quantified the importance of the various health
conditions.
In this thesis, we investigated the influences of chronic conditions subject to different
socio-demographic factors on self-reported general health among general American Adults 18
years and older. Data from NHANES was used for the analysis to report the impact of 20 chronic
conditions controlled for age, gender, social status and race/ethnicity on self-reported general
health. A weighting factor was developed to represent both impact and prevalence as a single
factor that could quantify the importance, or in a sense, the severity of the different health
conditions.
A multivariate statistical analyses was performed to determine the association of several
chronic conditions with self reported general health after controlling for common risk factors.
Towards this, a multivariate logistics regression model was used to come up with the odds ratio
that represented the impact of chronic diseases on general health. A four step bi-criteria additive
scheme was used to come up with the weighting factor.
It was found that the most prevalent health conditions among American adults are Poor
Oral health, Obesity, Arthritis, Poor Vision and Thyroid diseases. It was evident that age groups
that were classified as retired (i.e. older than 65 years) and those with low income levels are more
likely to be affected by chronic conditions. Also, the prevalence of arthritis in women was found
to be significantly higher than that in men. Asthma and Bronchitis were found to be significantly
48
higher in women while poor hearing health conditions were more prevalent in men. Some of the
very noticeable chronic conditions that had severe impact on health were emphysema, diabetes,
stroke and poor oral health.
From the final weighting factor, the condition that was found to be of top importance
(Table 4.6) or in other words the health condition that should receive top share of the pie was
poor oral health. It was also found that obesity had high importance. This result in coordination
with the fact that there was 77% increase in medication intake by obese people11
should help
illustrate the greater danger obese people are in compared to others. The other important health
conditions were arthritis, poor vision, emphysema and diabetes.
Some of the limitations of this research were that we combined all the types of arthritis,
diabetes and cancer into individual variables due to insufficient data to represent all of them
separately. It might be interesting to see what will happen if these conditions are separated. Also,
it was assumed that the two criteria, prevalence and impact had equal weightage which may not
be the case in an actual setting.
For future research, one could consider analyzing the effects other critical health
conditions which are not considered here. This research has assumed equal preference of the two
decision making criteria while quantifying the weighting factor. There are many possible
extensions to this model that could be considered. One could extend the number of decision
making criteria to greater than two and also incorporate decision makers to come up with the
weights for each of those criteria.

49
REFERENCES
1. Deyo RA, Inui TS, Leininger J, Overman S. Physical and psychosocial function in
rheumatoid arthritis: clinical use of a self-administered health status instrument.
Arch Intern Med. 1982;142:879-882.
2. Mason JH-, Weener JL, Gertman PM, Meenan RE. Health status in chronic
diseases: a comparative study of rheumatoid arthritis. J Rheumatol. 1983;10:763-
768.
3. B.R. Cassileth, E.J. Lusk and B.A. Strouse et al., Psychological status in chronic
illness, New Engl. J. Med. 311 (1984), pp. 506–511
4. KB Wells, A Stewart, RD Hays, MA Burnam, The functioning and well-being of
depressed patients: results from the Medical Outcomes Study, Jama, 1989 - Am
Med Association (1989)
5. Adaptive Responses among Dutch Elderly: The Impact of Eight Chronic Medical
Conditions on Health-Related Quality of Life; Gertrdis J. M. Kempen,Johan
Ormel, Els I. Brilman, and John Relyveld;American Journal of public health,
January 1997, Vol. 87,
6. Montserrat Ferrer, Jordi Alonso, Josep Morera, Ramon M. Marrades, Ahmad
Khalaf, Carmen Aguar, ; Vicente Plaza and Luis Prieto, Josep M. Anto, Chronic
Obstructive Pulmonary Disease Stage and Health-Related Quality of Life, Ann
Intern Med. 1997;127:1072-1079.
7. Health-Related Quality of Life in Chronic Disorders: A Comparison across
Studies Using the MOS SF-36; Elizabeth A. Schlenk, Judith Erlen, Jacqueline,
50
Joan McDowell, Sandra Engberg, Susan M. Sereika, Jeffrey M. Rohay, Mary
Jane Bernier; Quality of Life Research, Vol. 7, No. 1 (Jan., 1998), pp. 57-65
8. Assessing Health-Related Quality of Life in Chronically Ill Children with the
German KINDL: First Psychometric and Content Analytical Results Author(s): U.
Ravens-Sieberer and M. Bullinger Source: Quality of Life Research, Vol. 7, No. 5
(Jul., 1998), pp. 399-407
9. Lam CLK and Lauder IJ. The impact of chronic diseases on the health-related
quality of life (HRQOL) of Chinese patients in primary care. Family Practice
2000; 17: 159–166.
10. Which chronic conditions are associated with better or poorer quality of life?;
Mirjam A.G. Sprangers, Ellen B. de Regt, Frank Andries, Heleen M.E. van Agt,
Rob V. Bijl, Josien B. de Boer, Marleen Foets, Nancy Hoeymans, Annelies E.
Jacobs, Gertrudis I.J.M. Kempen, Harold S. Miedema, Marja A.R. Tijhuis,
Hanneke C.J.M. de Haes, Journal of Clinical Epidemiology 53 (2000) 895–907
11. The Effects Of Obesity, Smoking, And Drinking On Medical Problems And
Costs; by Roland Sturm; HEALTH AFFAIRS ~ March / April 2002
12. International Quality of life assessment (IQOLA) project 1991
13. Health-Related Quality of Life Associated with Chronic Conditions in Eight
Countries: Results from the International Quality of Life Assessment (IQOLA)
Project Author(s): Jordi Alonso, Montserrat Ferrer, Barbara Gandek, John E.
Ware, Jr., Neil K. Aaronson, Paola Mosconi, Niels K. Rasmussen, Monika
Bullinger, Shunichi Fukuhara, Stein Kaasa, Alain Leplège, The IQOLA Project
Group Source: Quality of Life Research, Vol. 13, No. 2 (Mar., 2004), pp. 283-298
51
14. Relationship among Sociodemographic Factors, Clinical Conditions, and Health-
Related Quality of Life: Examining the EQ-5D in the U.S. General Population;
Erica Lubetkin, Haomiao Jia, Peter Franks, Marthe Gold; Quality of Life
Research, Vol.14, No. 10 (Dec., 2005), pp. 2187-2196
15. The impact of 29 chronic conditions on health-related quality of life: A general
population survey in Finland using 15D and EQ-5D, Samuli I. Saarni1, Tommi,
Harri Sintonen3, Jaana Suvisaari1, Seppo Koskinen2, Arpo Aromaa2 & Jouko,
Quality of Life Research (2006) 15: 1403–141
16. Oral health needs among adults in the United States with chronic diseases; Susan
O. Griffin, Laurie K. Barker, Paul Griffin, Jennifer L. Cleveland, William Kohn;
JADA, Vol. 140, Oct 2009
17. Fanshel S, Bush JW. A health status index and its application to health services
outcomes. Oper Res 1970;18:1021–66.
18. Torrance GW, Thomas WH, Sackett DL. A utility maximization model for
evaluation of health care programs. Health Serv Res 1972;7:118–33.
19. Weinstein MC, Stason WB. Foundations of cost-effectiveness analysis for health
and medical practices. N Engl J Med 1977;296:716–21.
20. National Institute for Health and Clinical Excellence – Measuring effectiveness
and cost effectiveness: the QALY
21. Ceri Phillips and Guy Thompson. 2001. "What is a QALY?". Health Economics
supported by Sanofi-Aventis.
52
22. Pliskin, Joseph]; Shepard, D; Weinstein, M (1980). "Utility Functions for Life
Years and Health Status". Operations Research (Operations Research Society of
America) 28 (1): 206–224. doi:10.1287/opre.28.1.206.
23. Murray, C.J.L., and Lopez, A.D.. The global burden of disease. The global burden
of disease and injury. 1, Harvard School of Public Health, Boston (1996a).
24. Murray, C.J.L., and Lopez, A.D.. The global burden of disease. The global burden
of disease and injury. 2, Harvard School of Public Health, Boston (1996b).
25. "WHO Disease and injury country estimates". World Health Organization. 2009.
http://www.who.int/healthinfo/global_burden_disease/estimates_country/en/index
.html. Retrieved Nov. 11, 2009.
26. "Death and DALY estimates for 2004 by cause for WHO Member States:
Persons, all ages". World Health Organization. 2002.
27. "Disability weights, discounting and age weighting of DALYs". WHO.
http://www.who.int/healthinfo/global_burden_disease/daly_disability_weight/en/i
ndex.html.
28. "The Global Burden of Disease concept". WHO.
http://www.who.int/quantifying_ehimpacts/publications/en/9241546204chap3.pdf
29. Jana M. Mossey, Leslie L. Roos Jr, Using insurance claims to measure health
status: The illness scale, Journal of Chronic Diseases, Volume 40, Supplement 1,
1987, Pages 41S-50S, ISSN 0021-9681, DOI: 10.1016/S0021-9681(87)80031-0.
30. Michael Von Korff, Edward H. Wagner, Kathleen Saunders, A chronic disease
score from automated pharmacy data, Journal of Clinical Epidemiology, Volume
45, Issue 2, February 1992, Pages 197-203
53
31. Richard E. Johnson, Mark C. Hornbrook, Gregory A. Nichols, Replicating the
chronic disease score (CDS) from automated pharmacy data, Journal of Clinical
Epidemiology, Volume 47, Issue 10, October 1994, Pages 1191-1199
32. Clark DO, Von Korff M, Saunders K, Baluch WM, Simon GE. A chronic disease
score with empirically derived weights. Med Care 1995;33:783–95.
33. Fishman P, Goodman M, Hornbrook M, Meenan RT, Bachman DJ, O‟Keefe
Rosetti MC: Risk adjustment using automated pharmacy data: the Rx Risk Model.
Med Care 41:84–99, 2003
34. Putnam KG, Buist DS, Fishman P, Andrade SE, Boles M, Chase G, et al. Chronic
disease score as a predictor of hospitalization. Epidemiology 2002;13:340–6
35. American Cancer Society: Cancer Facts and Figures 2010. Atlanta, Ga: American
Cancer Society, 2010
36. Interpretation of Changes in Health-Related Quality of Life: The Remarkable
Universality of Half a Standard Deviation Author(s): Geoffrey R. Norman, Jeff A.
Sloan, Kathleen W. Wyrwich Source: Medical Care, Vol. 41, No. 5 (May, 2003),
pp. 582-592
37. Measuring Health-related Quality of Life , Gordon H. Guyatt, MD; David H.
Feeny, PhD; and Donald L. Patrick, PhD, MSPH, Annals of Internal Medicine.
1993;118:622-629