impact of climate change on the indian...
TRANSCRIPT

IMPACT OF CLIMATE CHANGE ON THE INDIAN ECONOMY:EVIDENCE FROM FOOD GRAIN YIELDS
SHREEKANT GUPTA*,†,¶, PARTHA SEN‡
and SUCHITA SRINIVASAN§
*Department of EconomicsDelhi School of Economics
University of DelhiDelhi 110007, India¶[email protected]
†LKY School of Public Policy‡Centre for Development Economics
Delhi School of EconomicsUniversity of DelhiDelhi 110007, India
§Graduate Institute of Internationaland Development StudiesChemin Eug�ene-Rigot 21211 Genev�e, Switzerland
Published 1 September 2014
We analyse the effects of rainfall and temperature on yields of paddy and millets (pearl milletand sorghum) in India for the period 1966–1999, at the district level. Unlike other studies, wecontrol for fertiliser use and irrigation. We find that paddy (India’s leading food crop) issensitive to the climate variables but also to fertiliser use and irrigation. Millets are less affectedby climate variables although sorghum shows some sensitivity to temperature. Our results haveimportant implications for how India’s agriculture will adapt to climate change.
Keywords: Climate change; agricultural impacts; developing countries.
JEL Codes: O13, Q54, R11
1. Introduction
Meteorological data compiled over the past century suggest the earth is warming. Inkeeping with this, for India as a whole, mean annual temperature shows a significantwarming trend of 0.51�C per 100 years during the period 1901–2007 (Kothawaleet al., 2010). Similarly, global projections of temperature and for precipitation augur awarmer and wetter world, on average. Simulations with regional climate models
¶Corresponding author.
Climate Change Economics, Vol. 5, No. 2 (2014) 1450001 (29 pages)© World Scientific Publishing CompanyDOI: 10.1142/S2010007814500018
1450001-1

(RCM) project similar trends for both variables for India — by 2030s annual meantemperatures and summer monsoon rainfall are both expected to increase on average(GoI, 2010). But for a country of sub-continental proportions there are, as expected,significant regional variations in past and future trends. Both these facts have signif-icant implications for the Indian economy in terms of the impact of climate change andalso its regional incidence.
This is particularly true for the agricultural sector where climate is a direct input intoproduction. While the salience of this sector in India has declined over the years, it stillremains important in the socio-economic fabric of the country. Though agriculturealone (other than forestry and fisheries) accounts for only about 15% of GDP, it stillemploys 55% of the workforce. Moreover, according to the 2011 census, 69% of thepopulation (which is growing) remains rural and intimately connected to this sector.There are also important forward and backward linkages to agriculture from the rest ofthe economy.
Our primary interest in this sector, however, is from the perspective of povertywhich remains widespread despite significant progress in reducing it — the country isstill estimated to have one-third of the world’s poor. According to some estimates,32.7% of the population is below the international poverty line of US$ 1.25 per day(PPP) while 68.7% live on less than US$ 2 per day (World Bank, 2010).1 A key aspectof poverty is its incidence which is rural and concentrated among agricultural labor.Thus, according to the Indian Planning Commission, in the year 2009–2010 more thanone in three of the rural population was poor (33.8%) whereas the figure for urbanareas was about one in five (20.9%). Equally important for our analysis, nearly 50% ofagricultural laborers were below the poverty line in rural areas (GoI, 2012).
Within agriculture, we focus on three key food crops, namely, rice and pearl millet(bajra) and sorghum ( jowar). Using district level panel data on annual yields (outputper unit hectare), inputs, and climate variables for 1966–1999, we find significantimpacts of rainfall and temperature on yields of these crops.
Our methodology is based on estimating an agricultural production function withexogenous climate variables, namely, precipitation, and temperature. Thus, we eschewcrop simulation approaches that rely on experimental data.2 We do not also estimatereduced form relationships between economic variables such as profits or the monetaryvalue of yield and various forms of weather measures.
1The definition and measurement of poverty in India is controversial and politically charged and somewhat of anobsession with Indian economists. We do not enter into this area other than providing illustrative numbers for purposesof our argument.2This approach is interestingly referred to as “production function” approach a la Deschênes and Greenstone (2007)and Guiteras (2009). A comprehensive discussion of the pros and cons of this approach is found in Schlenker andRoberts (2009). For examples of the hedonic approach (also known as the Ricardian approach) which focuses onvariations in land prices or profits see the seminal paper by Mendelsohn et al. (1994). This paper has spawned anextensive literature across several countries. Early applications of the Ricardian approach to India are Dinar et al. (1998)and Kumar and Parikh (2001). A recent application to Africa (Ethiopia) is Deressa and Hassan (2009).
S. Gupta, P. Sen & S. Srinivasan
1450001-2

Our focus on rice and millets is deliberate. The former is the most important cerealfood crop in India accounting for 23.3% of gross cropped area and about 43% of totalfood grain production as well as 46% of cereal production (Singh, 2009). In economicterms, rice (including paddy) was ranked highest by value among all agriculturalproducts in India with a total output of about $38.4 billion in 2010 (FAO, 2011a). Indiais considered to be one of the original centers of rice cultivation covering 44 millionhectares. Its rice harvesting area is the largest in the world. Around 65% of the totalpopulation in India eats rice and it provides the main source of income and employ-ment for more than 50 million households (IRRI).
From our perspective of rural poverty in particular, we note rice (actually paddy)3 ascultivated in most parts of India, is a highly labor-intensive crop. Also, much of thislabor especially during sowing and transplanting is provided by women. Thus, there isan important gender dimension as well (FAO, 2004, 2011b).4
Millets on the other hand are traditional “coarse cereals” whose importance is morein terms of their role as a staple crop consumed by the poor.5 In terms of food grainproduction, millets ranked fourth in India behind rice, wheat and maize (FAO, 2011a)6
Within millets we concentrate on the two key varieties, namely, pearl millet (bajra) andsorghum ( jowar). Post Green Revolution, millets have lost ground to other food crops,especially wheat and rice — the production of millets has more or less remainedconstant between 1966–2006, whereas that of rice and wheat has increased by 125%and 285%, respectively (MNI, 2009).
Table A.1 provides normal (averaged over 2005–2006 to 2009–2010) area, pro-duction and yield of food crops in India. As the table shows, rice and wheat nowaccount for more than three fourths of food grain output in India with “coarse cereals”contributing only about one sixth (16%). But, as late as 1970, the picture was quitedifferent — the contribution to food grain output of rice, wheat and “coarse cereals” in1970–1971 was respectively, 39%, 22%, and 28.2%. As we discuss later and antici-pating our empirical results, this has important policy implications vis-à-vis climatechange — we find millets in particular to be much less sensitive to temperature andrainfall than rice and by corollary more climate resilient.
3Paddy (Oryza sativa) is the rice grain with husk (which is also known as rice hull). In this paper, rice cultivationactually refers to paddy. Paddy becomes rice after the removal of husk by threshing. In 2010, India produced approx.143 million tons of paddy and about 95 million tons of rice (FAO, 2012). Rice husk is mainly used as fuel in boilers inrice mills.4Conversely, in Asia (and in sub-Saharan Africa), women who are employed are more likely to be employed in agriculturethan in other sectors — almost 70% of employed women in Southern Asia work in agriculture (FAO, 2011b)5In India, “coarse cereals” (a loaded and highly normative term) comprise millets, barley andmaize (Table A.1). Millets inturn primarily comprise pearl millet (bajra) and sorghum ( jowar) which dominate in area and production. This is followedby finger millet (ragi) and small millets.Bajra, jowar andmaize together account for over 90% each of area and productionof ‘coarse cereals’ in India (Table A.1).6This was a distant fourth rank, however — production of these four crops in 2010 was, respectively, 95, 81, 14.1 and 13.3million tons (FAO, 2011a). By value too, millet output was about $2.3 billion for the same year (compared to $38.4 billionfor rice).
Impact of Climate Change on the Indian Economy: Evidence from Food Grain Yields
1450001-3

Again, from a poverty perspective both rice and millets are largely grown by smalland marginal farmers (i.e., those with holdings less than 2 hectares) and with much lessirrigation as compared to wheat which is almost entirely irrigated and cultivated byrelatively bigger farmers. Table A.2 shows 57% of area under rice is cultivated bymarginal and small farmers compared to 44% for wheat. At the other end of thespectrum, large wheat farmers (holdings of 10 hectares or more) account for more than10% of the area under their crop compared to similar large rice farmers who account foronly about 5.5% of the area under rice. Finally, 90% of area under wheat is irrigatedcompared to 59% for rice and only 29% for other cereals (coarse cereals).
The plan of the paper is as follows. The following section provides the context interms of projected trends and regional variation in climate variables (rainfall andtemperature) for India. It also provides further details on how, when and where ourthree crops are grown in the country and the potential role of climate variables.Section 3 presents our conceptual framework and situates it in the literature on theimpact of climate on agriculture, particularly with regard to India. Section 4 describesthe data and econometric methodology. Section 5 presents and interprets the results ofour analysis. Section 6 concludes the paper.
2. Climate Change and Agriculture in India
2.1. Trends and regional variation in climate variables
India’s climate system has unique features. It is dominated by the summer or South-west monsoon (and to a lesser extent the winter or Northeast monsoon) and by thecountry’s physiological features such as the Western and Eastern Ghats, the centralplateau and the Himalayas. The summer monsoon and the rains that it brings are amajor weather phenomenon in the Indian subcontinent and deeply influences the livesof its inhabitants. It is a four-month period (June–September) when massive convectivethunderstorms dominate India’s weather, and is the Earth’s most productive wet season(Collier and Webb, 2002). This season provides over 80% of India’s rainfall (Bagla,2006, 2012). Thus the quantity, temporal and spatial distribution of the precipitation(rainfall) accompanying the monsoon is its most monitored component and is par-ticularly important for agriculture. The summer monsoon is also the most economi-cally important weather pattern to the extent that then Indian Finance Minister (PranabMukherjee) called it “the real finance minister” (Hindustan Times, 2010). More re-cently, the Governor of India’s central bank (Reserve Bank of India or RBI) was alsoquoted as saying “(A)nd most importantly we also chase monsoon like millions offarmers across the country. So, the monsoon outlook, the monsoon performance isgoing to be the important factor in determining the RBI policy in the next threemonths” (Economic Times, 2013). Yet the Indian monsoon is “only partially under-stood and notoriously difficult to predict” (Wikipedia, 2012).
Though the dependence of agriculture on the summer monsoon has reducedsomewhat lately due to increased irrigation and better drought management, Fig. A.1
S. Gupta, P. Sen & S. Srinivasan
1450001-4

shows clearly how the two have marched in lockstep. This is not surprising since, outof the total net sown area of 141.0 million hectares (Mha) in India, rain-fed areaaccounts for 85.0Mha spreadover 177 districts. This constitutes approximately 60% ofthe total farming area in the country. Rain-fed agriculture contributes 44% of the totalfood grain production of the country and produces 75% of pulses and more than 90%of sorghum, millet and groundnut from arid and semi-arid regions. Even after half acentury of lopsided policies that have focused on pockets of the country and specificcrops, rain-fed regions provide livelihood to nearly 50% of the total rural workforceand sustain 60% of cattle population of the country (MNI et al., 2009).
Keeping in view the peculiarities of India’s climate and of the summer monsoon inparticular, in a recent exercise a RCM with 50 km resolution, namely, PRECIS wasdeployed to dynamically downscale global model simulations and superimpose re-gional details from India (GoI, 2010). This exercise coupled with long instrumentalrecords allows us to capture past trends and also make projections for key climatevariables such as temperature and rainfall within the country at a disaggregated level.
As mentioned earlier, for India as a whole, mean annual temperature shows a sig-nificant warming trend of 0.51�C per 100 years during the period 1901–2007 (Kothawaleet al., 2010). More important, accelerated warming has been observed in the last ap-proximately 40 years (1971–2007), mainly due to intense warming in the recent decade1998–2007.7 Increases in the mean have been accompanied by a rise in both maximumand minimum temperatures at the all India level — by 0.71 and 0.27�C, respectively, per100 years during the period 1901–2007. Also, as with mean temperature, there has beenacceleration in trends of both maximum and minimum temperatures during 1971–2007.At the regional level, the homogenous regions8 of East coast, West coast and the pen-insula show an increasing trend in the frequency9 of hot days but Northern India (Northof 22� N) does not. With respect to the frequency of cold days, however, all sevenhomogenous regions show a decreasing trend (in the frequency of cold days).
With regard to precipitation, Indian monsoon rainfall from 1871–2009 shows only aslight negative trend. But there is significant spatial variation in these trends over thisperiod. Also, there is an increase in extreme rainfall events and their intensities (GoI,2010; Sen Roy and Balling, 2004).
Projections for climate in the medium-run for India seem to indicate it will bewarmer and wetter but with significant regional variation. Overall there will be (i) anincrease in average surface temperature by 2–4�C, (ii) changes in the distribution ofrainfall (inter-temporal and spatial) during both monsoon and non-monsoon months,(iii) decrease in the number of rainy days by more than 15 days, (iv) an increase in the
7All four major Indian seasons, namely, summer/pre-monsoon, monsoon, post-monsoon and winter contribute to thistrend. But the increase in winter and post-monsoon temperatures is most marked — by 0.80�C and 0.82�C, respectivelyover the last hundred years (GoI, 2010). This has significant implications for rice yields as noted below.8A uniform or homogenous region is an area in which everyone shares in one or more distinctive characteristics, in thiscase climate.9Defined as days per decade.
Impact of Climate Change on the Indian Economy: Evidence from Food Grain Yields
1450001-5
intensity of rainfall by 1–4mm/day, and (v) an increase in the frequency and intensityof cyclonic storms (Ranuzzi and Srivastava, 2012).
2.2. Rice and millets in India: key issues
Rice is the most important food crop in India.10 It accounts for 23.3% of gross croppedarea and 43% of total food grain production as well as 46% of cereal production(Singh, 2009). In economic terms, rice (including paddy) was ranked highest by valueamong all agricultural products in India with a total output of about $38.4 billion in2010 (FAO, 2011a). The production of rice alone has more than quadrupled fromaround 21 million tons in 1950 to 95 million tons in 2010.
There are three seasons for growing rice in India — autumn (pre-kharif), winter(kharif) and summer (rabi) — named according to the season of harvest (though allcrops are not grown in all regions). Winter or kharif rice (sown during June–July andharvested in November–December) is the main growing season and accounts for 84%of the country’s rice crop.11 This is followed by summer rice (sown during November–February and harvested in March–June) at 9% and autumn rice (sown during May–August and harvested in September–October) which accounts for 7% of the rice crop.
Among millets, pearl millet (bajra) is the most widely grown type of millet fol-lowed by sorghum ( jowar).12 Because of their tolerance to difficult growing conditionssuch as drought, low soil fertility and high temperature, they can be grown in areaswhere other cereal crops, such as maize or wheat would not survive (Basavaraj et al.,2010). Pearl millet in India is grown as a single season crop. Cultivation predominantlytakes place on marginal lands and un-irrigated lands. It is also grown in a small area assummer crop under irrigation particularly in the Northwestern states of India mainly asa fodder crop. Area trends of pearl millet in India are constantly declining. Between1972–1973 and 2004–2005, nearly 3 million hectares has been diverted from pearlmillet cultivation to other crops. Pearl millet production is concentrated in Gujarat,Maharashtra, and Rajasthan which account for 70% of production in India. Thesestates also have the highest concentration of pearl millet consumers since bulk of theconsumption for food use takes place in the areas where it is grown.
3. Framework and Relevant Literature
Our methodology is based on estimating an agricultural production function withexogenous climate variables, namely, precipitation and temperature. Our analysis is atthe district level using a panel dataset for physical yield (output divided by grosscropped area) for rice and pearl millet.
Several studies have looked at the impact of climate-related variables on crop yieldsspecifically for India. Lahiri and Roy (1985) (LR) look at the supply response of rice
10This discussion is based on Singh (2009).11As can be noted, sowing and transplanting of winter rice is during the summer monsoon (June–September).12This discussion is based on Basavaraj et al. (2010).
S. Gupta, P. Sen & S. Srinivasan
1450001-6

yields at the all-India level and also include monthly rainfall (either in the sowingseason or in the growing season). The paper is in the agricultural economics traditionof acreage and yield response to price (and also to “supply shifters” such as rainfall)and models this response in a Nerlovian partial adjustment framework (for which theyactually do not find evidence). Lahiri and Roy postulate a gamma distribution for theeffect of rainfall on yield (right skewed and bounded at zero), i.e., less rainfall(droughts) is worse than too much (floods). For yield, they find the optimal monthlyaverage rainfall is about 293mm for the months of July and August. They also arguethat with the spread of HYVs post-mid 1960s (1965 onwards) Indian agriculture hasbecome more rainfall-dependent, especially since water requirement has gone up andthe spread of irrigation has not kept pace with it.
Kanwar (2006) extends this line of research to several food grains. He looks atsupply response using a state-level panel dataset and again finds rainfall mattersconsiderably for supply response (it’s a “supply shifter”).13 Also using state-level paneldata, Auffhammer et al. (2012) extend Auffhammer et al. (2006) and explicitly look atthe impact of too little/too much rainfall (akin to gamma rainfall) on rice yields.Whereas their earlier work looked at crop output (with area as an explanatory variable)the latter paper looks at yield per hectare. They too find significant climate impacts.
A problem with state- or national-level analysis is the need to aggregate rainfall andother weather data (there are several observation stations in a state) to one value at thestate- or national-level. This is problematic since several Indian states are large, oftenbigger than countries in Europe and elsewhere.14 Given the variation in rainfall andother weather variables for a state, the resulting measurement error may bias thecoefficients on weather variables downward (Auffhammer et al., 2012). Moreover, ourpaper is more comprehensive in its scope, since it looks at the impact of both tem-perature and rainfall on yields, at the district-level.
As in this paper, district-level panel data for India has been used in this context byseveral other studies starting with Dinar et al. (1998), Kumar and Parikh (2001), Sanghiand Mendelsohn (2008), Kumar (2009), Guiteras (2009), and recently by Fishman(2011) and Krishnamurthy (2012). The first four are variants of the Ricardian approachin that they estimate the impact of climatic variables on net agricultural revenues perunit area at the district level. For instance, Kumar and Parikh (2001) and Kumar (2009)estimate the impact of climate change on net agricultural revenue per hectare (revenueminus cost of labor and fertilizer, normalized by area).15 For various reasons, they use
13“In other words, rainfall is the single most important factor determining supply response even today. Despite decadesof massive irrigation schemes, the food crops continue to be rainfall-dependent.” (Basavaraj et al., 2010, p. 80)14For instance, the five biggest states of India, namely, Rajasthan, Madhya Pradesh (MP), Maharashtra, AndhraPradesh (AP) and Uttar Pradesh (UP) range from 342,000 sq km to 241,000 sq km. The biggest state, Rajasthan, isalmost as big as Germany, whereas the next two (MP and Maharashtra) are almost the size of Poland and bigger thanItaly and the Philippines each. Andhra Pradesh and Uttar Pradesh, respectively are bigger than or the same size asUnited Kingdom.15Kumar (2009), inter alia, extends the temporal coverage of the dataset used in the earlier study using the samemethodology.
Impact of Climate Change on the Indian Economy: Evidence from Food Grain Yields
1450001-7

net revenue instead of land prices as is the norm for the Ricardian approach. This is notsufficient to distinguish between the responses of different crops to climate change,which our paper manages to capture. While both papers use district-level data tomeasure the impact of temperature and rainfall changes, the dependent variable and thecontrols are different. Our paper controls for fertilizer and irrigation which are criticalinputs in the agricultural process. Kumar and Parikh find that a 2�C temperature riseand 7% increase in rainfall would lead to almost 8% loss in farm level net revenue(much lower than what agronomic studies predict since they do not account for ad-aptation). Using a similar approach to Kumar and Parikh (2001), Sanghi and Men-delsohn (2008) find that agricultural net revenue in India may fall by 12% in (and morebroadly within an interval of 4% to 26%). Our paper finds a positive effect of higherrainfall, on all three crops, while the effect of temperature differs from crop to crop.The results may differ due to the difference in approaches adopted.
Among more recent studies, a well cited one by Guiteras (2009) examines theimpact of temperature and rainfall on combined yield (in money terms) for five majorfood and one cash crop, namely, rice, wheat, jowar, bajra, maize, and sugarcane. Theprecipitation variables have been defined both as total monthly rainfall (for the growingseason months of June–September), as well as total growing season rainfall. Fordefining the temperature variable, he adopts two approaches: the first is “degree-days”,where it is acknowledged that crops do not absorb heat below a temperature of 8�C,and then absorb heat linearly till a threshold of 32�C. This captures the cumulativeheat exposure of the crop. The second method he adopts is useful in capturing non-linear temperature effects. He counts the number of growing season days in each 1�Cinterval, and includes these totals as separate regressors.
Guiteras finds climate change could reduce yields by 4.5% to 9% in the medium-run(2010–2039) and by as much as 25% in the long-run (2070–2099) in the absence of long-run adaptation. The main drawback of Guiteras as highlighted by Sarker et al. (2012) andby Krishnamurthy (2012) is combining different crops which are impacted differently byclimate change. The dependent variable is akin to district income (from six crops)16
normalizedby area to arrive at gross revenue per hectare, and is difficult to interpret.Fishman (2011) also uses a district-level panel and shows the impact of intra-
seasonal variability of rainfall on yields. By using daily-level data on weather, irrigationand crop yields for some of the main crops (rice, wheat, maize, barley, groundnuts,sorghum, pearl millet, pigeon pea, chickpea, cotton and sugarcane) from districts overfour decades, the paper aims to capture the adaptation, by means of expansion ofirrigation, to climate change. Precipitation is incorporated into the model in differentways — total monsoon rainfall (in the months of June–September), monthly rainfall foreach of the four months, frequency of rainy days (precipitation over 0.1mm), durationof the longest dry spell, and the shape parameter of the gamma distribution fitted to the
16As stated by Guiteras (2009) “these comprise roughly 75% of total revenues.” ( p. 9 footnote 6).
S. Gupta, P. Sen & S. Srinivasan
1450001-8

distribution of daily rainfall. Temperature has been introduced in the form of “growingseason degree-days”, which is a measure of heat exposure used to predict crop yield.
Fishman finds that irrigated yields tend to be higher than purely rain-fed yields, andthat irrigation acts as an effective buffer against the irregularities of rainfall, especiallyfor the rainy-season crops. Irrigation, however, is not useful in protecting yields againsthigher temperatures which limits its efficacy as an adaptation mechanism.17 Fishmanonly uses irrigation as a control, whereas we also control for fertilizer consumption.
Krishnamurthy (2012) also uses a panel data quantile regression methodology toestimate the impact of climate change on yields of rice and wheat. He suggests thatboth the Ricardian and panel data approaches used to study the impact of climatechange on agriculture are inadequate, because they assume that the covariates (weathervariables, agricultural controls, etc.) only affect the mean yield, and not the conditionaldistribution of the yield, i.e., only the mean agricultural outcomes changes, with nochanges in the underlying relationship between the outcomes and the climatic vari-ables. In the paper, he regresses yield on temperature (measured in growing seasondegree-days a la Guiteras) and seasonal and monthly rainfall, for every quantile of thepopulation (like Fishman, only a control for irrigation is used). This methodology isuseful to estimate other features of the conditional distribution, other than the mean.The results reveal a significant decline in the yield of wheat across quantiles, while forrice, a moderate decline is seen in the most productive areas, and in the other areas theeffects of warming lead to a slight increase in yield.
4. Data and Methodology
4.1. Data sources
4.1.1. Agricultural data
The data on the agricultural variables span the time period 1966–1999, and have beencollected from the ICRISAT VDSA (Village Dynamics in South Asia) ApportionedMeso database. This is a district-level database that includes information on cultivatedarea, production and area irrigated for different crops, land use, farm harvest prices,rainfall, livestock and agricultural implements, operational holdings, and populationcensus data for 19 states of the country. The boundaries of the districts included in thisdatabase are defined as of 1966, i.e., any data on districts that were created after 1966are given “back” to the parent districts from which the newer districts were created.The final database thus includes data on the parent districts only, which is inclusive ofthe data “apportioned” amongst the districts created later.
The variables of interest in this database include the area under, and productionof, rice, pearl millet and sorghum (measured in hectares and tons respectively),
17Inter alia, he uses a quadratic time trend fs(t) which is state specific — it reflects technological progressand productivity gains, which are allowed to differ from state to state because of the large variance in agriculturalperformance across India.
Impact of Climate Change on the Indian Economy: Evidence from Food Grain Yields
1450001-9
district-wise consumption of fertilizers (tons of nitrogen, phosphate and potash fer-tilizers used), total gross cropped area in each district (measured in hectares, andaccounting for multiple cropping), and gross irrigated area under each of the threecrops (measured in hectares, again accounting for multiple cropping). While the dataon the area and production have been compiled into the ICRISAT database from theStatistical Abstracts of India, State Statistical Abstracts and the State Season and Cropreports, the data on fertilizer consumption has been obtained from the FertilizerStatistics for India. Barring data gaps for a few variables in some districts, the area,input and output-related data is available at an annual frequency for all three crops.
The dependent variable considered is the logarithm of yield (tons of output perhectare), for each of the three crops. The two independent variables created from thelist of ICRISAT variables are fertilizer consumption and irrigation. The fertilizervariable was created by dividing district-level fertilizer consumption by the grosscropped area of land devoted to all the crops grown in that district. In the absence ofdata on crop-specific fertilizer consumption this variable is identical for all three crops.The irrigation variable has been defined as the area irrigated for a particular crop in adistrict, divided by the gross cropped area (for that particular crop). This variable isuseful in capturing the intensity of irrigation in determining the yield of a crop.
4.1.2. Climate data
The climatic data has been taken from the IndiaWater Portal (www.indiawaterportal.org)which contains 102 years of district-level data on rainfall, temperature, cloud cover,humidity, ground frost frequency and other variables. The database that is used tocompile this meteorological dataset is the publicly available Climate Research Unit(CRU) TS2.1 dataset, out of the Tyndall Centre for Climate Change Research, School ofEnvironmental Sciences, University of East Anglia in Norwich, UK. This dataset con-sists of interpolated (on 0.5� latitude-longitude grid) global monthly data on variablessuch as rainfall and temperature from 1901 to 2002. The CRU data was transformed tothe district level by simple linear averaging from the gridded data of the CRU dataset.
Two independent variables have been created using this database, i.e., rainfall andtemperature. For all three crops, the rainfall variable has been defined as the natural logof annual rainfall (to account for the fact that the distribution of the annual rainfallvariable is positively skewed for all crops).18 The temperature variable has been de-fined as the 12-month average of the monthly average temperatures. A quadratic termfor temperature has also been included to examine the incremental impact of tem-perature on the yield of all three crops. Table A.3 provides summary statistics of themain variables used in the analysis.
18Since growing season rainfall accounts for roughly 70% of total annual rainfall in the districts we have considered forrice (the proportion is 73% for pearl millet and 75% for sorghum), we find that the results are not significantly differentif growing season rainfall (total rainfall in the months of June, July, August, and September) was used instead of totalannual rainfall.
S. Gupta, P. Sen & S. Srinivasan
1450001-10
4.2. Methodology
The numbers of districts selected for each of the crops are 153 for rice, 80 for pearlmillet and 88 for sorghum. These districts cut across the agriculturally-importantstates of the country (rather than being selected from certain states). For the criteriaused in selection of districts, refer to the data appendix. Table A.4 lists the districtsconsidered in each state, for every crop. As previously mentioned, the districts in-cluded in the ICRISAT database are those that existed as of 1966. However, theclimatic dataset has been created taking into account the district boundaries as of2002, which are remarkably different from those of 1966. The districts that comprisethe panel-sample have been selected on the basis of the districts that existed in theICRISAT database, and the climatic variables for these districts have been approxi-mated from the district to which the largest area of the parent district was allocated19
(provided that it is more than 50% of the total area of the parent district) (Kumar andSomanathan, 2009).
In the presence of AR cross-sectional dependence (the outcomes are correlatedacross districts in a given year), along with heteroscedasticity, FGLS (feasible gen-eralized least squares) with fixed effects was found to be an appropriate method ofestimation. However, one of the drawbacks of FGLS estimation is that it producesoverly optimistic standard error estimates. Moreover, the estimates are only feasible ifN < T, i.e., the number of observations are less than the number of time period, whichis not the case for any of the three crops. To correct this, panel-corrected standarderror (PCSE) estimates are obtained, where the parameters are estimated using aPrais–Winsten (or OLS) regression. Equations have been estimated with district andyear fixed effects, district fixed effects and district-by-year fixed effects.
For each of the crops, it was observed that the errors exhibited the presence ofheteroscedasticity, and contemporaneous correlation. A Prais–Winsten regression wasthus estimated, under two different assumptions on correlation:
(1) Within panels, there is AR (1) autocorrelation and the coefficient of the AR (1)process is common to all of the panels, and
(2) Within panels, there is AR (1) autocorrelation and that the coefficient of the AR (1)process is specific to each panel (i.e., panel-specific AR (1) autocorrelation)(Cameron and Trivedi, 2009)
The regression equation which is estimated for all three crops is as follows:
Ln(YIELDit) ¼ �i þ �t þ X0it� þ
X"*f (Wit)þ �it,
where �i refers to the district-level fixed effects, which are quite useful in capturingunobserved heterogeneity across districts and �t refers to the year-specific dummies
19Kumar and Somanathan (2009) give the change in district boundaries across four census periods (1971, 1981, 1991and 2001).
Impact of Climate Change on the Indian Economy: Evidence from Food Grain Yields
1450001-11

which control for annual differences in yield, common to all the districts (Deschênesand Greenstone, 2007).20 The Xit refers to the district and year-specific agriculturalvariables, whereas the Wit refers to the climatic variables (namely rainfall and tem-perature). State and year fixed effects were not estimated, given that the sample sizewould be too small to run a robust panel-data estimation.
5. Results
5.1. Rice
Tables 1 and A.5 give the results of the regression estimation for rice, taking thetemperature variable as the 12-month average of the monthly average temperatures,and defining the rainfall variable as the total annual rainfall. Table 1 gives the re-gression results with district and year fixed effects, while Table A.5 gives the resultsusing panel-specific errors. The results are robust, even if panel-specific AR (1) serialautocorrelation is assumed. The coefficients on the district and year fixed effects havebeen suppressed.
Table 1 reveals that with district year fixed effects, both the rainfall and maximumtemperature variables are found to be significant, even at the 1% level of significance.Higher rainfall leads to higher yield of rice, whereas higher temperatures lower theyield. Interestingly, the coefficient on the quadratic term for temperature is positive:higher temperatures would mean lower yield rates, but higher temperatures have asmaller harmful effect. Both the irrigation and fertilizer consumption variables arehighly significant, which is expected given that rice production is highly input-drivenin large parts of the country, and the signs are intuitive (higher the proportion of landunder rice irrigated, higher is the yield, and higher the fertilizer consumption used forrice, higher is the yield of rice). These results also hold once panel-specific errors aretaken into account (Table A.5).
Table 1. Rice with district and year fixed effects.Number of obs ¼ 5185 R-squared ¼ 0:8154Wald chi2 (190) ¼ 28462:47 Prob > chi2 ¼ 0:0000
Ln yield Coeff. Panel correctedstd. errors
z p > jzj 95% Confidence interval
Log (rainfall) 0.2115207 0.0200441 10.55 0.000 0.172235 0.250806Average temperature �0.6837534 0.2009669 �3.40 0.001 �1.077641 �0.289865(Average temperature)2 0.0134426 0.0038944 3.45 0.001 0.0058098 0.021075Fertiliser 0.0012841 0.0001478 8.69 0.000 0.0009945 0.001574Irrigation 0.5507108 0.0280250 19.65 0.000 0.4957827 0.605639Intercept 6.8290360 2.6206870 2.61 0.009 1.692585 11.96549
20Dell et al. (2009), Deschênes and Greenstone (2007), and Guiteras (2009) all use the fixed-effects formulation.
S. Gupta, P. Sen & S. Srinivasan
1450001-12

5.2. Pearl millet (bajra)
Tables 2 and A.6 produce similar results for pearl millet as for rice. The errors areassumed to be (serially) independent in this case as well. Table 2 gives the results fordistrict and year fixed effects, while Table A.6 gives results using panel-specific errors.The coefficients on fixed effects have been suppressed.
Table 2 reveals a similar impact of higher rainfall on pearl millet production, as inthe case of rice (greater the rainfall, higher the yield). The variable is also found to behighly significant. While the average temperature variable is (highly) insignificant, thesign is positive, suggesting the possible hardiness of bajra to increasing temperatures.The sign of the temperature quadratic is negative: higher temperatures are beneficialbut have a decreasing beneficial effect with further higher temperatures. It is alsohighly insignificant. The impact of the fertilizer variable appears to be significantlydiluted in the case of pearl millet: it is highly insignificant. Irrigation has a positive(and significant) impact on the yield of bajra, just as in the case of rice. Table A.6gives similar results to Table 2, in terms of the signs and significance of the climacticvariables.
5.3. Sorghum ( jowar)
Tables 3 and A.7 present the results for sorghum, assuming the same dependentvariable and climatic variables as for the other two crops. Since there is a lack of serialcorrelation in the data, the errors are assumed to be independent. Table 3 gives theresults for district and year fixed effects, whereas Table A.7 gives results using panel-specific errors. The coefficients on the fixed effects have been suppressed.
According to Table 3, higher rainfall means higher the yield, higher the averagetemperature, lower the yield. Higher the temperature, lower the rate of decrease ofyield with temperature (as was the case with rice). Moreover, the fertilizer variableseems to have a counter-intuitive sign, i.e., higher the fertilizer consumption, lesser isthe yield of sorghum; however it is also insignificant at the 5% level of significance.Table A.7 also gives similar results, with respect to the signs of the variables, other
Table 2. Pearl millet with district and year fixed effects.Number of obs ¼ 2656 R-squared ¼ 0:6911Wald chi2 (117) ¼ 6396:79 Prob > chi2 ¼ 0:0000
Ln yield Coeff. Panel correctedstd. errors
z p > jzj 95% Confidence interval
Log (rainfall) 0.4860142 0.0501995 9.68 0.000 0.3876249 0.5844035Average Temperature 0.1927766 0.5366864 0.36 0.719 �0.859109 1.244663Average Temperature2 �0.0048134 0.0102908 �0.47 0.640 �0.024983 0.0153563Fertiliser consumption �0.0000939 0.0005254 �0.18 0.858 �0.001124 0.0009358Irrigation 0.6060767 0.1354882 4.47 0.000 0.3405247 0.8716286Intercept �5.295802 7.051081 �0.75 0.453 �19.11567 8.524062
Impact of Climate Change on the Indian Economy: Evidence from Food Grain Yields
1450001-13

than the fact that both agricultural controls become insignificant (much like pearlmillet).
5.4. Interpretation of regression results
In the case of rice, the results reveal the strong positive effect of rainfall on its yield,across different specifications of the regression equation. The direction of impact ofmaximum temperature on the yield of rice is as expected — as temperatures increase,the yield of rice declines but at a decreasing rate. Inputs such as irrigation and fertilizerhave positive and strong impact on the yields. These results point to the strongdependence of rice yields on both climatic factors, and agricultural inputs and isconsistent with other studies for India (both at the state and at the district level) thatrice yields are most likely to be affected by climate change.
The results for millets (pearl millet and sorghum) are more nuanced — as with ricehigher rainfall leads to higher yields of both crops. But the effect of higher (average)temperature differs — for pearl millet it is insignificant, whereas for sorghum it issimilar to rice (i.e., higher temperatures affect yield negatively though at a decreasingrate). These results corroborate with agronomic studies which suggest the pearl milletgrain is resistant to drought and it is also considered more efficient in the utilization ofsoil moisture. It has a higher level of heat tolerance than sorghum, and is a cereal whichis most resistant to high temperatures — in fact it needs slightly hotter conditions forharvest. The literature also seems to suggest sorghum is better adapted to dry and coolconditions, whereas pearl millet is better adapted to dry and hot conditions (Leder,2009).21
The agricultural controls however exhibit interesting effects: Irrigation has a posi-tive (and significant) effect on both crops. This is important from a policy perspective.
21Also see ICRISAT VASAT (Virtual Academy for the Semi-Arid Tropics) (http://vasat.icrisat.org/crops/pearl millet/pm production/html/m4 4.2/index.html) and School of Forest Resources and Environmental Science, MichiganTechnological University (http://forest.mtu.edu/pcforestry/resources/studentprojects/jon/Millet.html).
Table 3. Sorghum with district and year fixed effects.Number of obs ¼ 2976 R-squared ¼ 0:7075Wald chi2 (125) ¼ 6027:59 Prob > chi2 ¼ 0:0000
Ln yield Coeff. Panel correctedstandard errors
z p > jzj 95% Confidence interval
Log (rainfall) 0.3484967 0.0535765 6.5 0.000 0.243489 0.453505Average Temperature �1.534204 0.5299387 �2.9 0.004 �2.572864 �0.495543Average Temperature2 0.028572 0.0099 2.89 0.004 0.009168 0.047976Fertiliser consumption �0.0005637 0.0003567 �1.58 0.114 �0.001263 0.000135Irrigation 0.415893 0.1805376 2.3 0.021 0.062046 0.76974Intercept 17.30694 7.136662 2.43 0.015 3.319338 31.29454
S. Gupta, P. Sen & S. Srinivasan
1450001-14

Fertilizer consumption, however, is insignificant for pearl millet and sorghum. Thismight be attributed to the fact that given the data limitations, the fertilizer variable isnot crop-specific. However, it can be postulated that pearl millet yields are onlyaffected by rainfall (and irrigation), whereas sorghum seems to be more sensitive tohigher temperatures as well (compared to pearl millet).
6. Concluding Remarks
As mentioned in the introduction, in this paper we wanted to look at the possi-ble effects of climate change on certain crops in India. We have looked at rice andmillets — the former is the leading food grain in terms of output and area sown,while the latter (group) is a hardy crop that can withstand the vicissitudes ofweather.
For rice, the evidence is overwhelming that both rainfall and temperature (thetwo climate variables) matter. Thus, a warmer India with more erratic rainfall asprojected by climate models does not portend well for rice yields. But for rice otherinputs also matter, viz. fertilizer and irrigation. For millets, on the other hand,rainfall is the main determinant and either temperature does not seem to affect them(as with pearl millet) or does so marginally (sorghum). Other inputs, especiallyfertilizer, do not seem to matter reinforcing the notion millets grow pretty much ontheir own.
There are now a number of recent studies that address the issues dealt with inthis paper for India and other countries, for example (but not limited to) Deschênesand Greenstone (2007), Guiteras (2009), Fishman (2011), Auffhammer et al. (2012,2006), and Krishnamurthy (2012). Our study has an annual district-wise focus. Weare able to analyze fixed effects emanating from district and state specific char-acteristics. Also unlike some studies (e.g., Auffhammer et al., 2006; Schlenker andRoberts, 2009; Poudel and Kotani, 2012; Sarker et al., 2012), where only tem-perature and/or rainfall appear on the right-hand side, we have other inputs (con-trols) on the right hand side. These can give us some idea of the trade-offs involvedin the process of climate change — if the temperatures rise, causing yields ofpaddy to fall, can it be compensated for by the use of more fertilizer?22 Our focusis also deliberately crop-based. There are studies where temperature is seen to causechanges in income (in a multi-crop setting). The interpretation of these can beproblematic ( joint outputs, no input variation, the use of prices). We set ourselvesthe limited task of tracking (carefully) the changing yields over a large panel. Inthat the crops of interest matter to the lives of some of the world’s poorest people,who would be affected by climate change, this analysis seems worthwhile.
22This presupposes that the past is a good guide to the future, and no tipping points or other nonlinearities have been setin motion.
Impact of Climate Change on the Indian Economy: Evidence from Food Grain Yields
1450001-15

Acknowledgments
We thank the Centre for Development Economics, Delhi School of Economics forfinancial support through UK Department of International Development (DfID)Purchase Order No. 40048622. We alone are responsible for the findings andconclusions.
Data Appendix
Agricultural data. The data on agricultural variables span the time period 1966–1999, and have been collected from the ICRISAT VDSA (Village Dynamics in SouthAsia) Apportioned Meso database. This is a district-level database that includes in-formation on cultivated area, production and area irrigated for different crops, landuse, farm harvest prices, rainfall, livestock and agricultural implements, operationalholdings, and population census data for 19 states of the country. The boundaries ofthe districts included in this database are defined as of 1966, i.e. any data on districtsthat were created after 1966 are given ‘back’ to the parent districts from which thenewer districts were created. The final database thus includes data on the parentdistricts only, which is inclusive of the data ‘apportioned’ amongst the districtscreated later.
The variables of interest in this database include the area under, and productionof, rice, pearl millet and sorghum (measured in hectares and tons respectively),district-wise consumption of fertilizers (tons of nitrogen, phosphate and potashfertilizers used), total gross cropped area in each district (measured in hectares, andaccounting for multiple cropping), and gross irrigated area under each of the threecrops (measured in hectares, again accounting for multiple cropping). While thedata on the area and production have been compiled into the ICRISAT databasefrom the Statistical Abstracts of India, State Statistical Abstracts and the StateSeason and Crop reports, the data on fertilizer consumption has been obtained fromthe Fertilizer Statistics for India. Barring data gaps for a few variables in somedistricts, the area, input and output-related data is available at an annual frequencyfor all crops.
The dependent variable considered is the logarithm of yield (tons of output perhectare), for each of the three crops. The two main independent variables createdfrom the list of ICRISAT variables are fertilizer consumption, and irrigation. Thefertilizer consumption variable is defined as the district-wise consumption of fer-tilizer per unit of gross cropped area, hence it is identically defined for all threecrops.
We define the irrigation variable as the area irrigated for a particular crop ina district, divided by the gross cropped area (for that particular crop). Thisvariable is useful in capturing the intensity of irrigation in determining the yield ofa crop.
S. Gupta, P. Sen & S. Srinivasan
1450001-16

Climate data. The climatic data has been taken from the India Water Portal (www.indiawaterportal.org) which contains 102 years of district level data on rainfall,temperature, cloud cover, humidity, ground frost frequency and other variables. Thedatabase that is used to compile this meteorological dataset is the publicly availableClimate Research Unit (CRU) TS2.1 dataset, out of the Tyndall Centre for Climatechange Research, School of Environmental Sciences, University of East Anglia inNorwich, UK. This dataset consists of interpolated (on 0.5 degree latitude-longitudegrid) global monthly data on variables such as rainfall and temperature from 1901 to2002. The CRU data was transformed to the district level by simple linear averagingfrom the gridded data of the CRU dataset.
Two explanatory variables have been created using this database, namely, tem-perature and rainfall. We define these identically across all three crops. Temperature isthe annual average temperature for a district. We also include a quadratic term for thisvariable. Our results do not change significantly when we use annual average maxi-mum temperature. Rainfall is the natural log of annual rainfall in a district. In our dataset, rainfall during the main growing season (June, July, August and September)accounts for roughly 70% of the annual rainfall in the case of rice and 73% and 75%for pearl millet and sorghum, respectively. Since the results are not significantly dif-ferent using either growing season or annual rainfall, we use the latter. Further, sincethe distribution of our rainfall variable is positively skewed for all three crops, we takeits natural log.
Choice of districts. The number of districts selected for each of the three crops are153 (rice), 80 (pearl millet), and 88 (sorghum). These districts cut across all agri-culturally important states of the country.
Our choice of districts is not exhaustive but accounts for the bulk of the output ofthe three crops. For rice, we use a threshold output of 50,000 tons on average. Forpearl millet and for sorghum this figure is 25,000 tons. Thus, the districts includedin our analysis account for about 95% of the total production of rice and for 98%and 97% of the production of pearl millet and sorghum, respectively. We findadding more districts does not change our results significantly.
Impact of Climate Change on the Indian Economy: Evidence from Food Grain Yields
1450001-17

Appendix
**Percentage deviation from long-run average.Source: Cagliarini and Rush (2011).
A.1. India-rainfall and agricultural production.
S. Gupta, P. Sen & S. Srinivasan
1450001-18

Table A.1. Normal (average of 2005–2006 to 2009–2010) area, production, and yield of food cropsin India. (Area — Million Hectares, Production — Million Tonnes, Yield — Kg./Hectare)
Season Area (% oftotal)
Production (% of total) (% of total asof 1970–1971)
Yield
Rice Kharif 39.36 80.38Rabi 4.41 13.64Total 43.77 35.7 94.02 42.4 (39) 2148
Wheat Rabi 27.75 22.6 77.04 34.7 (22) 2777Jowar Kharif 3.43 3.54
Rabi 4.62 3.79Total 8.05 6.6 7.33 3.3 911
Bajra Kharif 9.26 7.5 8.29 3.7 895Maize Kharif 6.96 13.04
Rabi 1.05 4.00Total 8.01 6.5 17.04 7.7 2128
Coarse Cereals* Kharif 21.97 27.32Rabi 6.31 9.14Total 28.28 23.0 36.46 16.4 (28.2) 1290
Pulses Kharif 10.65 4.99Rabi 12.27 9.32Total 22.92 18.7 14.31 6.5 625
Foodgrains Kharif 71.97 112.70Rabi 50.74 109.15Total 122.71 100.0 221.85 100.0 1808
*Jowar, Bajra, Ragi, Small Millets, Barley and Maize.Note: Figures in parentheses are shares in total food grain production in 1970–1971.Source: Agricultural Statistics at a Glance, Directorate of Economics and Statistics, Department ofAgriculture and Cooperation, Government of India (Adapted from Table 4.3).
Impact of Climate Change on the Indian Economy: Evidence from Food Grain Yields
1450001-19

TableA.2.Irrigatedandun
-irrigated
area
bysize
classesun
derdifferentfood
crop
s,20
05–20
06.(’00
0hectares)
Irrigated
Un-irrigated
Marginal
Small
Sem
i-medium
Medium
Large
Total
Marginal
Small
Sem
i-medium
Medium
Large
Total
Padd
y8,32
5.5
5,70
7.5
5,11
7.2
3,98
0.8
1,52
2.0
24,653
.05,16
0.7
4,45
8.6
4,07
1.9
2,65
5.7
820.8
17,168
Wheat
5,36
2.5
4,07
1.2
4,69
6.2
4,98
5.1
2,26
9.8
21,384
.844
4.0
528.0
620.8
585.0
205.0
2,38
2.9
Other
cereals
40.7
28.7
28.9
18.7
6.6
123.6
46.3
63.2
73.2
75.2
44.4
302.3
TotalCereal
14,346
.210
,502
.810
,757
.59,96
6.4
4,23
3.9
49,806
.88,63
2.7
8,79
0.9
9,35
0.1
8,10
6.6
4,04
1.7
38,922
Marginal
less
than
1hectare
Small
1—
less
than
2hectares
Sem
i-medium
2—
less
than
4hectares
Medium
4—
less
than
10hectares
Large
10hectares
ormore
Crop
%area
marginalandsm
all
%area
large
%area
irrigated
Padd
y56
.6%
5.6%
58.9%
Wheat
43.8%
10.4%
90.0%
Source:Departm
entof
Agriculture
and
Coo
peratio
n,Agricultural
CensusDivision.
S. Gupta, P. Sen & S. Srinivasan
1450001-20

TableA.3.Sum
marystatistics.
Variable/crop
Unit
Rice
Pearlmillet
(Bajra)
Sorgh
um(Jow
ar)
Mean
Std.dev.
Min
Max
Mean
Std.dev.
Min
Max
Mean
Std.dev.
Min
Max
Rainfall
mm
1094
.347
0.55
192.2
3663
.878
2.5
347.02
48.5
2531
.993
6.2
430.33
48.5
3595
.8Temperature
� C25
.82
1.44
20.49
32.69
26.09
1.13
20.98
29.17
26.22
1.38
20.49
29.17
Area
000hectares
185.4
159.76
0.7
1106
.65
119.94
151.77
011
7414
7.62
140.36
083
6.7
Produ
ction
000tons
288.4
299.12
024
18.9
59.2
66.35
045
610
0.1
98.95
069
2.2
Fertiliser
consum
ption
tons/hectare
57.53
55.33
040
8.22
43.51
44.24
024
5.81
42.58
45.45
0.04
301.6
Irrigatio
nprop
ortio
n(0
to1)
0.53
0.39
01
0.09
0.17
01
0.04
0.08
00.89
Yield
(Produ
ction/area)
tons/hectare
1.58
0.84
05.54
0.65
0.40
02.36
0.73
0.41
04.20
Impact of Climate Change on the Indian Economy: Evidence from Food Grain Yields
1450001-21
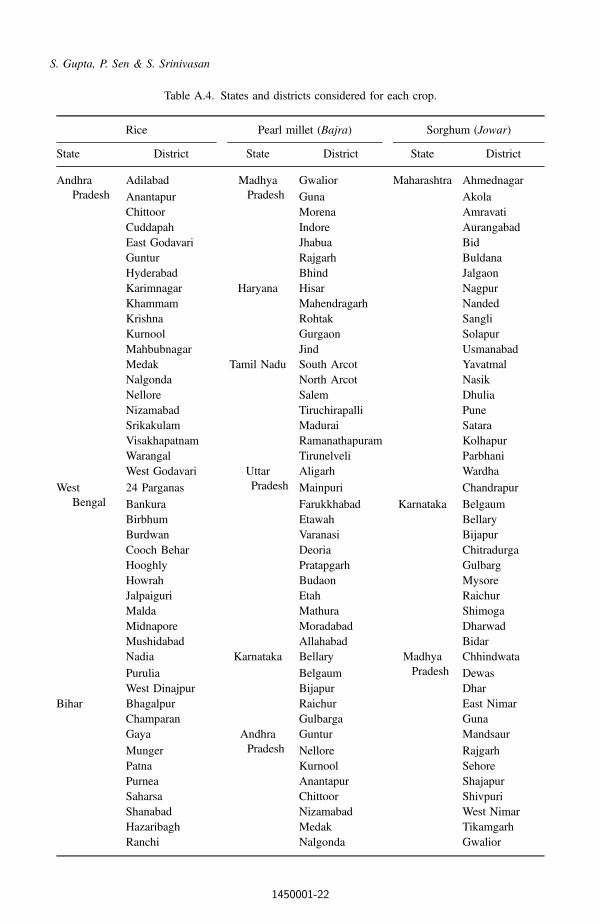
Table A.4. States and districts considered for each crop.
Rice Pearl millet (Bajra) Sorghum (Jowar)
State District State District State District
AndhraPradesh
Adilabad MadhyaPradesh
Gwalior Maharashtra Ahmednagar
Anantapur Guna AkolaChittoor Morena AmravatiCuddapah Indore AurangabadEast Godavari Jhabua BidGuntur Rajgarh BuldanaHyderabad Bhind JalgaonKarimnagar Haryana Hisar NagpurKhammam Mahendragarh NandedKrishna Rohtak SangliKurnool Gurgaon SolapurMahbubnagar Jind UsmanabadMedak Tamil Nadu South Arcot YavatmalNalgonda North Arcot NasikNellore Salem DhuliaNizamabad Tiruchirapalli PuneSrikakulam Madurai SataraVisakhapatnam Ramanathapuram KolhapurWarangal Tirunelveli ParbhaniWest Godavari Uttar
PradeshAligarh Wardha
WestBengal
24 Parganas Mainpuri Chandrapur
Bankura Farukkhabad Karnataka BelgaumBirbhum Etawah BellaryBurdwan Varanasi BijapurCooch Behar Deoria ChitradurgaHooghly Pratapgarh GulbargHowrah Budaon MysoreJalpaiguri Etah RaichurMalda Mathura ShimogaMidnapore Moradabad DharwadMushidabad Allahabad BidarNadia Karnataka Bellary Madhya
PradeshChhindwata
Purulia Belgaum DewasWest Dinajpur Bijapur Dhar
Bihar Bhagalpur Raichur East NimarChamparan Gulbarga GunaGaya Andhra
PradeshGuntur Mandsaur
Munger Nellore RajgarhPatna Kurnool SehorePurnea Anantapur ShajapurSaharsa Chittoor ShivpuriShanabad Nizamabad West NimarHazaribagh Medak TikamgarhRanchi Nalgonda Gwalior
S. Gupta, P. Sen & S. Srinivasan
1450001-22

Table A.4. (Continued )
Rice Pearl millet (Bajra) Sorghum (Jowar)
State District State District State District
Singhbhum Vishakhapatnam IndoreKarnataka Bangalore Gujarat Ahmedabad Ratlam
Belgaum BanasKantha UjjainBellary Bhavnagar VidishaChikmagalur Kheda BetulChitradurga Kachch Andhra
PradeshAdilabad
Coorg Mehasana AnantapurDakshina Kannada Rajkot HyderabadGulbarga SabarKantha KhammamHassan Junagarh KurnoolKolar Surendranagar MahbubnagarMandya Rajasthan Alwar MedakMysore Barmer NalgondaRaichur Bikaner NizamabadShimoga Churu WarangalTumkur Jaipur GunturUttara Kannada Jalore Nellore
MadhyaPradesh
Balaghat Jhunjhunun Cuddapah
Chattarpur Jodhpur KarimnagarChhindwata Nagaur Tamil Nadu CoimbatoreDamoh Sikar MaduraiJabalpur Pali TiruchirapalliMandla Bharatpur South ArcotNarsimhapur SawaiMadhopur North ArcotPanna Ganganagar SalemRewa Maharashtra Nasik TirunelveliSagar Dhule Gujarat BharuchSatna Jalgaon KachchSeoni Ahmadnagar SuratShahdol Pune SurendranagarSidhi Satara VadodaraTikamgarh Sangli BanasKanthaDurg Solapur MehsanaRaigarh Aurangabad Rajasthan AjmerRaipur Parbhani BundiSurguja Beed Jaipur
Orissa Balangir Osmanabad JhalawarBalasore Buldana JodhpurDhenkanal Akola KotaGanjam Amravati NagaurKalahandi Punjab Bhatinda PaliKandhamal TonkKeonjhar Sawai MadhopurMayurbhanj ChittorgarhSundargarh
Impact of Climate Change on the Indian Economy: Evidence from Food Grain Yields
1450001-23
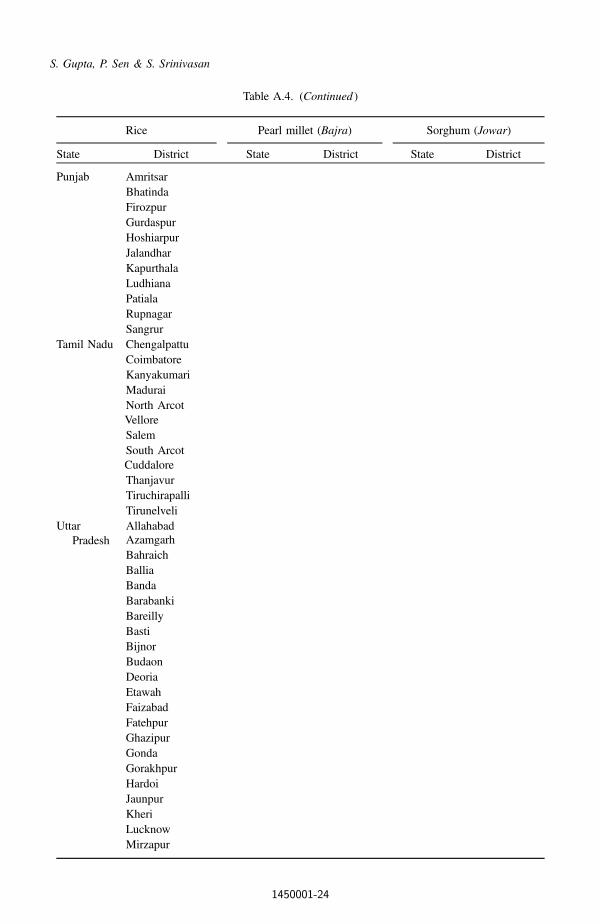
Table A.4. (Continued )
Rice Pearl millet (Bajra) Sorghum (Jowar)
State District State District State District
Punjab AmritsarBhatindaFirozpurGurdaspurHoshiarpurJalandharKapurthalaLudhianaPatialaRupnagarSangrur
Tamil Nadu ChengalpattuCoimbatoreKanyakumariMaduraiNorth ArcotVelloreSalemSouth ArcotCuddaloreThanjavurTiruchirapalliTirunelveli
UttarPradesh
AllahabadAzamgarhBahraichBalliaBandaBarabankiBareillyBastiBijnorBudaonDeoriaEtawahFaizabadFatehpurGhazipurGondaGorakhpurHardoiJaunpurKheriLucknowMirzapur
S. Gupta, P. Sen & S. Srinivasan
1450001-24

Table A.4. (Continued )
Rice Pearl millet (Bajra) Sorghum (Jowar)
State District State District State District
MoradabadMuzaffarnagarPilibhitPratapgarhRae BareillyRampurSaharanpurShahjahanpurSitapurSultanpurUnnaoVaranasi
Gujarat AhmedabadBulsarKaira/KhedaSuratPanchMahals
Haryana HissarJindAmbalaKarnalRohtak
Maharashtra ThaneRaigad/KolabaRatnagiriPuneSataraKolhapurBhandaraChandrapur
Impact of Climate Change on the Indian Economy: Evidence from Food Grain Yields
1450001-25

Table A.6. Pearl millet with district and year fixed effects, and panel-specific errors.Number of obs ¼ 2656 R-squared ¼ 0:6842Wald chi2 (117) ¼ 5762:80 Prob > chi2 ¼ 0:0000
Lnyield Coeff. Panel correctedstandard errors
z p > jzj 95% Confidence interval
Log (rainfall) 0.4856686 0.0477349 10.17 0.000 0.3921099 0.5792274Average Temperature 0.5113752 0.5587276 0.92 0.360 �0.583711 1.606461Average Temperature2 �0.0112851 0.0107241 �1.05 0.293 �0.032304 0.0097338Fertiliser consumption 0.0006407 0.0005577 1.15 0.251 �0.000452 0.0017338Irrigation 0.5679651 0.1374566 4.13 0.000 0.298555 0.837375Intercept �9.175211 7.322669 �1.25 0.210 �23.52738 5.176956
Table A.5. Rice with district and year fixed effects, and panel-specific errors.Number of obs ¼ 5185 R-squared ¼ 0:7778Wald chi2 (190) ¼ 22192:76 Prob > chi2 ¼ 0:0000
Lnyield Coeff. Panel correctedstandard errors
z p > jzj 95% Confidence interval
Log (rainfall) 0.2357468 0.0179538 13.13 0.000 0.20058 0.270935Average temperature �0.5838474 0.2023554 �2.89 0.004 �0.98046 �0.18723(Average temperature)2 0.0114678 0.0039342 2.91 0.004 0.00376 0.019178Fertiliser 0.0013451 0.0001646 8.17 0.000 0.00102 0.001667Irrigation 0.4976373 0.0334035 14.90 0.000 0.43216 0.563107Intercept 5.410467 2.624947 2.06 0.039 0.265665 10.55527
Table A.7. Sorghum with district and year fixed effects, and panel-specific errors.Number of obs ¼ 2976 R-squared ¼ 0:6959Wald chi2 (125) ¼ 4673:75 Prob > chi2 ¼ 0:0000
Lnyield Coeff. Panel correctedstandard errors
z p > jzj 95% Confidence Interval
Log (rainfall) 0.3417012 0.0487404 7.01 0.000 0.246172 0.437231Average Temperature �1.699692 0.5261875 �3.23 0.001 �2.731001 �0.668383Average Temperature2 0.0319681 0.0098312 3.25 0.001 0.012699 0.051237Fertiliser consumption �0.0002169 0.0003833 �0.57 0.571 �0.000968 0.000534Irrigation 0.2691421 0.1948928 1.38 0.167 �0.112841 0.651125Intercept 19.37152 7.076383 2.74 0.006 5.502063 33.24098
S. Gupta, P. Sen & S. Srinivasan
1450001-26

References
Auffhammer, M, V Ramanathan and JRVincent (2012). Climate change, the monsoon, and riceyields in India. Climatic Change, 111, 411–424.
Auffhammer, M, V Ramanathan and JR Vincent (2006). Integrated model shows that atmo-spheric brown clouds and greenhouse gases have reduced rice harvests in India. Proceedingsof the National Academy of Sciences (PNAS), 103(52), 19668–19672.
Bagla, P (2012). Drawing a bead on India’s enigmatic monsoon. Science, 335(6071), 910.Bagla, P (2006). Controversial rivers project aims to turn India’s fierce monsoon into a friend.
Science, 313(5790), 1036–1037.Barrios, S, L Bertinelli and E Strobl (2006). Climatic change and rural-urban migration: The
case of sub-Saharan Africa. Journal of Urban Economics, 60(3), 357–371.Basavaraj, G, PP Rao, S Bhagavatula and WAhmed (2010). Availability and utilization of pearl
millet in India. SAT eJournal (ejournal.icrisat.org), 8, 1–6.Cagliarini, A and A Rush (2011). Economic development and agriculture in India. Reserve
Bank of Australia Bulletin, June Quarter, 15–22.Cameron, CA and PK Trivedi (2009). Microeconometrics Using Stata. College Station, Texas:
StataCorp LP.Collier, M and RH Webb (2002). Floods, Droughts, and Climate Change. Tucson, AZ:
University of Arizona Press (published 1 November 2002).Dell, M, BF Jones and BA Olken (2009). Temperature and income: Reconciling new cross-
sectional and panel estimates. American Economic Review: Papers and Proceedings, 99(2),198–204.
Deressa, TT and RM Hassan (2009). Economic impact of climate change on crop productionin Ethiopia: Evidence from cross-section measures. Journal of African Economies, 18(4),529–554.
Deschênes, O and M Greenstone (2007). The economic impacts of climate change: Evidencefrom agricultural output and random fluctuations in weather. American Economic Review,97(1), 354–385.
Dinar, A, R Mendelsohn, R Evenson, J Parikh, A Sanghi, K Kumar, J McKinsey andS Lonergan (1998). Measuring the imapct of climate change on Indian agriculture, TechnicalPaper 402, World Bank, Washington, D.C.
Fishman, RM (2011). Climate change, rainfall variability, and adaptation through irrigation:Evidence from Indian agriculture, Working Paper, Columbia University.
Food and Agriculture Organization (FAO) (2012). Rice Market Monitor, XV(1), Trade andMarkets Division, FAO.
Food and Agriculture Organization (FAO) (2011a). FAOSTAT (FAO Statistical Database).Available at http://faostat.fao.org/DesktopDefault.aspx?PageID¼ 339&lang¼ en&country¼100 (Accessed on September 29, 2012).
Food and Agriculture Organization (FAO) (2011b). The state of food and agriculture (2010–2011), Women in agriculture: Closing the gender gap for development, Rome.
Food and Agriculture Organization (FAO) (2004). Report of Regional consultation on genderdimensions in Asian rice livelihood systems in the changing milieu of technologies andeconomy held on March 9–12. Regional Office for Asia and the Pacific, Bangkok. RAPPublication 2004/13.
Government of India (GoI) (2012). Press note on poverty estimates, 2009–2010. PlanningCommission.
Impact of Climate Change on the Indian Economy: Evidence from Food Grain Yields
1450001-27

Government of India (GoI) (2010). Climate change and India: A 4 � 4 assessment— a sectoraland regional analysis for 2030s. Indian Network for Climate Change Assessment (INCCA),Ministry of Environment and Forests.
Guiteras, R (2009). The impact of climate change on Indian agriculture, Mimeo, University ofMaryland, College Park.
ICRISAT Village Dynamics in South Asia (VDSA). Macro-Mesoapportioned database.Available at http://www.icrisat.org/vdsa/vdsa-database.htm (Accessed on August 10, 2012).
ICRISAT Virtual Academy for the Semi-Arid Tropics (VASAT). Pearl Millet production andpractices — Climatic requirements for Pearl Millet. Available at http://vasat.icrisat.org/crops/pearl millet/pm production/html/m4 4.2/index.html (Accessed on March 10, 2013)
India Water Portal. Meteorologicaldatasets. Available at http://www.indiawaterportal.org/met-data (Accessed on April 30, 2012).
International Rice Research Institute (IRRI). Rice in India. Available at http://irri.org/index.php?option¼com k2&view¼item&id¼8744:rice-in-india&lang¼en (Accessed on Septem-ber 30, 2012).
Kalra, S and P Sodsriwiboon (2010). Growth convergence and spillovers among Indian states:what matters? What does not?, IMF Working Paper, WP/10/96 (April).
Kanwar, S (2006). Relative profitability, supply shifters and dynamic output response, in adeveloping economy. Journal of Policy Modeling, 28, 67–88.
Kothawale, DR, AA Munot and K Krishna Kumar (2010). Surface air temperature variabilityover India during 1901–2007, and its association with ENSO. Climate Research, 42,89–104.
Krishnamurthy, CKB (2012). The distributional impacts of climate change on Indian agri-culture: A quantile regression approach. Madras School of Economics Working Paper 69/2012 (May).
Kumar, H and R Somanathan (2009). Mapping Indian districts across census years, 1971–2001, Centre for Development Economics (Department of Economics, Delhi School ofEconomics) Working Paper No. 176 (April).
Kumar, KSK (2009). Climate sensitivity of Indian agriculture, Madras School of EconomicsWorking Paper 43/2009 (April).
Kumar, KSK and J Parikh (2001). Indian agriculture and climate sensitivity. Global Envi-ronmental Change, 11(2), 147–154.
Kumar, KK, RK Kolli, RG Ashrit, NR Deshpande and JW Hansen (2004). Climate impacts onIndian agriculture. International Journal of Climatology, 24, 1375–1393.
Lahiri, A and PL Roy (1985). Rainfall and supply response: A study of rice in India. Journal ofDevelopment Economics, 18(2–3), 315–334.
Lal, M, T Nozawa, S Emori, H Harasawa, K Takahashi, M Kimoto, A Abe-Ouchi, T Nakajima,T Takemura and A Numaguti (2001). Future climate change: Implications for Indiansummer monsoon and its variability. Current Science, 81(9), 1196–1207.
Leder, I (2009). Sorghum and Millet. In Cultivated Plants, Primarily as Food Sources: v.1,G Fuleky (ed.), EOLSS (Encyclopedia of Life Support Systems) Publishers Co Ltd.
Mall, RK, R Singh, A Gupta, G Srinivasan and LS Rathore (2006). Impact of climate changeon Indian agriculture: A review. Climatic Change, 78, 445–478.
Mendelsohn, R, W Nordhaus and D Shaw (1994). The impact of global warming on agri-culture: A Ricardiananalysis. American Economic Review, 84(4), 753–771.
Michigan Technological University. School of Forest Resources and Environmental Science.Pearl Millet and Sorghum: The Cereals of Subsistence. Available at http://forest.mtu.edu/pcforestry/resources/studentprojects/jon/Millet.html (Accessed on March 10, 2013).
S. Gupta, P. Sen & S. Srinivasan
1450001-28

Mitchell, TD and PD Jones (2005). An improved method of constructing a database of monthlyclimate observations and associated high-resolution grids. International Journal of Clima-tology, 25, 693–712.
MNI (Millet Network of India), Deccan Development Society and FIAN (FoodFirst Infor-mation and Action Network), India (2009). Millets: Future of food and farming.
News Service, Indo-Asian (2010). India cheers as monsoon arrives; hope of better farm outputraised, Hindustan Times, 31 May.
Peng, S, J Huang, JE Sheehy, RC Laza, RM Visperas, X Zhong, GS Centeno, GS Khush andKGCassman (2004). Rice yields decline with higher night temperature from global warm-ing. Proceedings of the National Academy of Sciences (PNAS), 101(27), 9971–9975.
Poudel, S and K Kotani (2012). Climatic impacts on crop yield and its variability in Nepal: Dothey vary across seasons and altitudes? Climatic Change, published online May 23 (DOI10.1007/s10584-012-0491-8).
Purfield, C (2006). Mind the Gap — is economic growth in India leaving some states behind?,IMF Working Paper, WP/06/103 (April).
Ranuzzi, A and R Srivastava (2012). Impact of climate change on agriculture and food securityin India. ICRIER Policy Series, No. 16 (May). Indian Council for Research on InternationalEconomic Relations (ICRIER), New Delhi.
RBI (2013). Monsoon outlook to determine policy actions: Subbarao, Economic Times, 7 June.Sanghi, A and R Mendelsohn (2008). The impacts of global warming on farmers in Brazil and
India. Global Environmental Change, 18(4), 655–665.Sarker, Md. AR, K Alam and J Gow (2012). A comparison of the effects of climate change on
Aus, Aman and Boro rice yields in Bangladesh: Evidence from panel data, Paper presentedat the 41st Australian Conference of Economists (ACE), Victoria University, Melbourne,July 8–12.
Schlenker, W and MJ Roberts (2009). Nonlinear temperature effects indicate severe damages toU.S. crop yields under climate change. Proceedings of the National Academy of Sciences(PNAS), 106(37), 15594–15598.
Sen Roy, S and RC Balling Jr. (2004). Trends in extreme daily precipitation indices in India.International Journal of Climatology, 24(4), 457–466.
Singh, MP (2009). Rice productivity in India under variable climates, Paper presented atMARCO Monsoon Asia Agro-Environmental Research Consortium) Symposium, October6–9, Tsukuba, Japan. Workshop 2 (October 6).
Tyndall Centre for Climate Change Research, School of Environmental Sciences, University ofEast Anglia in Norwich, UK. Climate Research Unit (CRU) TS2.1 dataset. Available athttp://www.cru.uea.ac.uk/.
Wikipedia. Monsoon of Indian subcontinent. Available at http://en.wikipedia.org/wiki/Mon-soon of Indian subcontinent (Accessed on September 30, 2012).
World Bank. Poverty & equity databank and PovcalNet. Available at http://povertydata.worldbank.org/poverty/country/IND (Accessed on September 30, 2012).
Impact of Climate Change on the Indian Economy: Evidence from Food Grain Yields
1450001-29