impact of earthquakes on the central usa - cusec · mid-america earthquake center impact of...
TRANSCRIPT

Mid-America Earthquake Center
Impact of Earthquakeson the Central USAImpact of Earthquakeson the Central USA
Amr S. ElnashaiLisa J. ClevelandTheresa JeffersonJohn Harrald
Mid-America Earthquake Center Report 08-02
Project funded byFederal Emergency Management AgencyManaged byUS Army Corps of Engineers ERDC-CERL

New Madrid Seismic Zone Catastrophic Earthquake Response Planning Project
Final Phase I Report
Impact of Earthquakes on the Central USA
MAE Center Report No. 08-02
September 2008
Principal Investigator, University of Illinois Amr S. Elnashai Co-Investigator; George Washington University Theresa Jefferson
Technical Project Manager, University of Illinois Lisa Johanna Cleveland Administrative Project Manager, University of Illinois Timothy Gress
Mid-America Earthquake Center Civil and Environmental Engineering Department University of Illinois Urbana, Illinois 61801, USA Tel.: +1 217 244 6302, [email protected]

i
Contributions Mid-America Earthquake Center at the University of Illinois
Amr S. Elnashai, Project Principal Investigator Billie F. Spencer, Co-Principal Investigator Arif Masud, Co-Principal Investigator Tim Gress, Administration Manager Lisa Johanna Cleveland, Technical Manager Omar Pineda, Technical Investigator Rob Suarez, Analyst Liang Chang, Analyst Can Unen, Analyst Bora Gencturk, Analyst Thomas Frankie, Analyst Jong Sung Lee, GIS Analyst Dan Barbuto, Analyst Sarah Challand, Administrator Jessica Vlna, Administrator Sindhura Mekala, Finance Coordinator Nasiba Alrawi, Information Technology Coordinator
Institute for Crisis, Disaster & Risk Management at George Washington University
Theresa Jefferson, Principal Investigator (GW Sub-contract) John Harrald, Co-Principal Investigator Frank Fiedrich, Co-Principal Investigator Tay Johannes, Research Associate Ashutosh Madhukar, Research Associate Clinton Mexted-Freeman, Research Associate Sebnem Sener, Research Associate
Project Partners
Central U.S. Earthquake Consortium – Communication with Stakeholders Innovative Emergency Management (IEM) – Overall Project Coordination Army Corps of Engineers – Project Management
Other Contributors Robert Bauer (Illinois State Geological Survey) – Hazard Douglass Bausch (FEMA Region VIII) – HAZUS
Kirk Chesla (previously with IEM) – Inventory Eduardo Escalona (previously with FEMA Region VIII) – Inventory Image Acknowledgements The images used on the cover have been done so courtesy of the United States Air Force, the U.S. Geological Survey, and the Association of Southeast Asian Nations.

ii
Project Funded by
Federal Emergency Management Agency (FEMA)
Through a Grant from the
U.S. Army Corp of Engineers (Army W9132T-06-2)
Disclaimer
The assessments, comments and opinions in this report are those of the authors and do not necessarily represent the opinions of the Federal Emergency Management Agency or the US Army Corps of Engineers.
iii
Scenario Disclaimer The scenarios employed in this report have been selected following discussions with regional and local experts, and recommendations from the Scenario Development Workgroup formed in March 2007. These scenarios are intended to provide credible worst case impacts for individual states. They are not meant to negate or diminish the relevance of previous or future scenarios used in other studies. The Central United States is vulnerable to a number of possible credible scenarios, and it is likely that the damage and loss estimates presented in this report are different from other credible scenarios in the New Madrid Seismic Zone (NMSZ), the Wabash Valley Seismic Zone (WVSZ) and the East Tennessee Seismic Zone (ETSZ). Neither these scenarios, nor others, should be considered definitive. They represent only possible earthquakes and corresponding damage and loss for the eight states considered hereafter. Various models and methods of representing damage to infrastructure, shelter requirements, casualties, and economic losses are employed in the simulated earthquake impact process and lead to different results according to different modeling assumptions. Also, the social impact models used throughout this study have not been calibrated to observations from catastrophic events, but rather damaging earthquakes, solely in California. Furthermore, the availability of datasets to characterize state infrastructure changes with time. For example, population estimates and numbers of buildings are likely to be different based on the year in which the scenario is created and the access allowed by owners of datasets to the detailed inventory. The sensitivity (vulnerability) of assets to earthquake shaking may be evaluated in many different ways, and different methods are likely to lead to different levels of vulnerability. Finally, seismological (hazard) and geotechnical (site soil) effects, such as liquefaction, significantly affect the estimated impact. Characterizing seismological hazard and soil effects is non-unique; hence, assumptions concerning such effects made in other studies may lead to impact estimates that are different from those presented hereafter. When considering the above sources of uncertainty in the development of scenarios (inventory, vulnerability and hazard, respectively) no single scenario should be considered to be an exact depiction of impacts in a state but rather as a plausible estimate of a state’s damage and loss. Additional scenarios outside of the NMSZ are considered for the States of Alabama and Indiana. An ETSZ earthquake is employed for Alabama and a WVSZ event is employed for Indiana and Illinois. The ETSZ hazard was approved by the State of Alabama Geological Survey while the hazard data for the WVSZ scenario was provided by the U.S. Geological Survey (USGS). These additional scenarios represent possible events in the two seismic zones, and others may be investigated. Other scenarios are expected to provide different damage and loss estimates based on the aforementioned factors in seismic impact assessment modeling; i.e., inventory, vulnerability, and hazard. Finally, all numbers in this report should be viewed as indicative of the possible impact provided for the purposes of emergency response planning rather than as definitive figures of expected impact. The uncertainty associated with all numbers provided in this and other earthquake impact assessment reports is considerable. At the current state of knowledge of hazard, fragility, inventory and aggregation of losses, it is not possible to quantify the level of uncertainty associated with the impacts provided in this report.

iv
Executive Summary The region of potential impact due to earthquake activity in the New Madrid Seismic Zone (NMSZ) is comprised of eight states: Alabama, Arkansas, Illinois, Indiana, Kentucky, Mississippi, Missouri and Tennessee. Moreover, the Wabash Valley Seismic Zone (WVSZ) in southern Illinois and southeast Indiana and the East Tennessee Seismic Zone in eastern Tennessee and northeastern Alabama constitute significant risk of moderate-to-severe earthquakes throughout the central region of the USA. The investigation summarized in this report includes earthquake impact assessment scenarios completed using HAZUS-MH MR2 for several potential earthquake scenarios affecting the aforementioned eight-state region. The NMSZ includes eight scenarios - one for each state - whilst the WVSZ scenario in Indiana and the ETSZ scenario in Alabama complete the suite of ten total scenarios. These ten scenarios are designed to provide scientifically-credible, worst case damage and loss estimates for the purposes of emergency planning, response and recovery. The earthquake impact assessments presented in this report employ an analysis methodology comprising three major components; namely hazard, inventory and fragility (or vulnerability). The hazard characterizes not only the shaking of the ground but also the consequential transient and permanent deformation of the ground due to strong ground shaking. The inventory comprises all assets in a specified region, including the built environment and population data. Fragility or vulnerability functions relate the severity of shaking to the likelihood of reaching or exceeding damage states (light, moderate, extensive and near-collapse, for example). Social impact models are also included in the current assessment methodology and employ infrastructure damage results to estimate the effects on populations subjected to the earthquake. Whereas the modeling software used (HAZUS-MH MR2, FEMA-NIBS, 2006) provides default values for all of the above, most of these default values were replaced by components of traceable provenance and higher reliability than the default data, as described below. The hazard employed in this investigation includes ground shaking for three seismic zones and various events within those zones. The NMSZ consists of three fault segments: the northeast segment, the reelfoot thrust or central segment, and the southwest segment. Each segment comprises a deterministic, magnitude 7.7 (Mw7.7) earthquake caused by a rupture over the entire length of the segment. The employed magnitude was provided by US Geological Survey (USGS). The NMSZ represents the first of three hazard events utilized in this report. Two deterministic events are also included, namely a magnitude Mw7.1 in the Wabash Valley Seismic Zone (WVSZ) and a magnitude Mw5.9 in the East Tennessee Seismic Zone (ETSZ) earthquakes. Permanent ground deformation is characterized by a liquefaction susceptibility map that provides data for part of the eight states. Full liquefaction susceptibility maps for the entire region are still under development and will be utilized in subsequent phases of the current project. Inventory is enhanced through the use of the Homeland Security Infrastructure Program (HSIP) 2007 Gold Dataset (NGA Office of America, 2007). This dataset contains various

v
types of critical infrastructure that are key inventory components for earthquake impact assessment. Transportation and utility facility inventories are improved while regional natural gas and oil pipelines are added to the inventory, alongside some high potential loss facility inventories. Additional essential facilities data were used for the State of Illinois via another impact assessment project at the Mid-America Earthquake Center, funded by FEMA and the Illinois Emergency Management Agency. Existing HAZUS-MH MR2 fragility functions are utilized in this study and default values are used to determine damage likelihoods for all infrastructure components. The results indicate that the State of Tennessee incurs the highest level of damage and social impacts. Over 250,000 buildings are moderately or more severely damaged, over 260,000 people are displaced and well over 60,000 casualties (injuries and fatalities) are expected. Total direct economic losses surpass $56 billion. The State of Missouri also incurs substantial damage and loss, though estimates are less than those in Tennessee. Well over 80,000 buildings are damaged leaving more than 120,000 people displaced and causing over 15,000 casualties. Total direct economic losses in Missouri reach nearly $40 billion. Kentucky and Illinois also incur significant losses with total direct economic losses reaching approximately $45 and $35 billion, respectively. The State of Arkansas incurs nearly $19 billion in direct economic loss while the State of Mississippi incurs $9.5 billion in direct economic losses. States such as Indiana and Alabama experience limited damage and loss from NMSZ events with approximately $1.5 and $1.0 billion, respectively. Noting that experience confirms that the indirect economic loss due to business interpretation and loss of market share, amongst other features, is at least as high if not much higher than the direct economic losses, the total economic impact of a series of NMSZ earthquakes is likely to constitute by far the highest economic loss due to a natural disaster in the USA. The contents of this report provide the various assumptions used to arrive at the impact estimates, detailed background to the above figures, and a breakdown of the figures per sector at the county and state levels. The main body of the report gives state-level impact assessments, whilst the Appendices give earthquake impact modeling results at the county level. The results are designed to provide emergency managers and agencies with information required to establish response plans based on likely impacts of plausible earthquakes in the central USA.

vi
Table of Contents
CONTRIBUTIONS ............................................................................................................. i
SCENARIO DISCLAIMER .............................................................................................. iii
EXECUTIVE SUMMARY ............................................................................................... iv
TABLE OF CONTENTS................................................................................................... vi
LIST OF FIGURES ......................................................................................................... viii
LIST OF TABLES............................................................................................................. ix
INTRODUCTION .............................................................................................................. 1
EARTHQUAKE IMPACT ASSESSMENT OVERVIEW ................................................ 1
Hazard......................................................................................................................... 2 Inventory ..................................................................................................................... 3 Fragility ...................................................................................................................... 4 Social Impacts............................................................................................................. 4
PHASE I EARTHQUAKE HAZARD................................................................................ 5
PHASE I INVENTORY ................................................................................................... 14
PHASE I FRAGILITY ..................................................................................................... 25
RESULTS OF THE EARTHQUAKE IMPACT ASSESSMENTS ................................. 25
State-Level Direct Damage & Functionality ............................................................ 26 Regional Direct Damage & Functionality................................................................ 57 Comparison with Other Published Studies ............................................................... 58
SOCIAL IMPACT AND DIRECT ECONOMIC LOSS.................................................. 60
State-Level Social Impact & Economic Loss ............................................................ 60 Regional Social Impact and Economic Loss............................................................. 85 Comparison with Other Published Studies ............................................................... 85
DISCUSSION AND CONCLUSIONS ............................................................................ 88
IMPLICATIONS ON RESEARCH AND DEVELOPMENT ......................................... 89
ACKNOWLEDGEMENTS.............................................................................................. 91
REFERENCES ................................................................................................................. 92
APPENDIX I: SHAKING MAPS....…………………………………………………….95
APPENDIX II: INVENTORY………………………………………………………….173
APPENDIX III: FRAGILITY RELATIONSHIPS……………………………………..183
APPENDIX IV: EARTHQUAKE IMPACT ASSESSMENT METHODOLOGY...….192

vii
APPENDIX V: DETAILED EARTHQUAKE IMPACT ASSESSMENT RESULTS...205
APPENDIX VI: SOCIAL IMPACTS AND ECONOMIC LOSSES…………………..432
APPENDIX VII: GUIDE FOR IMPACT ASSESSMENT TERMINOLOGY………...516
APPENDIX VIII: DAMAGE AND LOSS MAPS……………………………………..573
APPENDIX IX: COMPARISON WITH CUSEC EARTHQUAKE IMPACT
ASSESSMENT………………………………………………………912
.. Appendices I through IX are in the accompanying DVD ..

viii
List of Figures FIGURE 1: NEW MADRID SEISMIC ZONE FAULT SEGMENTS ............................................................................ 7 FIGURE 2: NORTHEAST SEGMENT OF MIDDLE FAULT PGA (G) ....................................................................... 8 FIGURE 3: CENTRAL SEGMENT OF MIDDLE FAULT PGA (G) ........................................................................... 8 FIGURE 4: SOUTHWEST SEGMENT OF MIDDLE FAULT PGA (G)....................................................................... 9 FIGURE 5: WABASH VALLEY SEISMIC ZONE AND FAULT LOCATION ............................................................ 10 FIGURE 6: WABASH VALLEY SEISMIC ZONE PGA ........................................................................................ 10 FIGURE 7: EAST TENNESSEE SEISMIC ZONE EVENT, M5.9 ............................................................................ 11 FIGURE 8: EAST TENNESSEE SEISMIC ZONE PGA ......................................................................................... 12 FIGURE 9: LIQUEFACTION SUSCEPTIBILITY MAP........................................................................................... 13 FIGURE 10: LIQUEFACTION SUSCEPTIBILITY FOR ETSZ SCENARIO............................................................... 14 FIGURE 11: POPULATION DISTRIBUTION FOR THE STATE OF ALABAMA ........................................................ 15 FIGURE 12: POPULATION DISTRIBUTION FOR THE STATE OF ARKANSAS....................................................... 16 FIGURE 13: POPULATION DISTRIBUTION FOR THE STATE OF ILLINOIS ........................................................... 17 FIGURE 14: POPULATION DISTRIBUTION FOR THE STATE OF INDIANA........................................................... 18 FIGURE 15: POPULATION DISTRIBUTION FOR THE STATE OF KENTUCKY....................................................... 19 FIGURE 16: POPULATION DISTRIBUTION FOR THE STATE OF MISSISSIPPI ...................................................... 20 FIGURE 17: POPULATION DISTRIBUTION FOR THE STATE OF MISSOURI......................................................... 21 FIGURE 18: POPULATION DISTRIBUTION FOR THE STATE OF TENESSEE......................................................... 22 FIGURE 19: NMSZ EVENT LOSS RATIO (% OF TOTAL BUILDING ASSETS) FOR THE STATE OF ALABAMA .... 75 FIGURE 20: ETSZ EVENT LOSS RATIO (% OF TOTAL BUILDING ASSETS) FOR THE STATE OF ALABAMA...... 76 FIGURE 21: NMSZ EVENT LOSS RATIO (% OF TOTAL BUILDING ASSETS) FOR THE STATE OF ARKANSAS ... 77 FIGURE 22: NMSZ EVENT LOSS RATIO (% OF TOTAL BUILDING ASSETS) FOR THE STATE OF ILLINOIS ....... 78 FIGURE 23: NMSZ EVENT LOSS RATIO (% OF TOTAL BUILDING ASSETS) FOR THE STATE OF INDIANA ....... 79 FIGURE 24: WVSZ EVENT LOSS RATIO (% OF TOTAL BUILDING ASSETS) FOR THE STATE OF INDIANA ....... 80 FIGURE 25: NMSZ EVENT LOSS RATIO (% OF TOTAL BUILDING ASSETS) FOR THE STATE OF KENTUCKY ... 81 FIGURE 26: NMSZ EVENT LOSS RATIO (% OF TOTAL BUILDING ASSETS) FOR THE STATE OF MISSISSIPPI... 82 FIGURE 27: NMSZ EVENT LOSS RATIO (% OF TOTAL BUILDING ASSETS) FOR THE STATE OF MISSOURI ..... 83 FIGURE 28: NMSZ EVENT LOSS RATIO (% OF TOTAL BUILDING ASSETS) FOR THE STATE OF TENNESSEE... 84

ix
List of Tables TABLE 1: LIQUEFACTION SUSCEPTIBILITY PROXY ........................................................................................ 12 TABLE 2: TOTAL POPULATION OF EIGHT-STATE REGION (YEAR 2000 CENSUS)........................................... 23 TABLE 3: INVENTORY VALUE IN EIGHT-STATE REGION ($ MILLIONS) .......................................................... 23 TABLE 4: NMSZ EVENT BUILDING DAMAGE BY OCCUPANCY TYPE FOR STATE OF ALABAMA .................... 27 TABLE 5: NMSZ EVENT DAMAGE BY BUILDING TYPE FOR STATE OF ALABAMA ......................................... 27 TABLE 6: ESSENTIAL FACILITIES DAMAGE AND FUNCTIONALITY FOR NMSZ EVENT IN THE STATE OF
ALABAMA............................................................................................................................................ 27 TABLE 7: NMSZ EVENT DAMAGE TO HIGHWAY BRIDGES IN THE STATE OF ALABAMA ............................... 28 TABLE 8: NMSZ EVENT DAMAGE TO PIPELINES IN THE STATE OF ALABAMA .............................................. 28 TABLE 9: ETSZ EVENT BUILDING DAMAGE BY OCCUPANCY TYPE FOR THE STATE OF ALABAMA............... 29 TABLE 10: ETSZ EVENT BUILDING DAMAGE BY BUILDING TYPE FOR THE STATE OF ALABAMA................. 30 TABLE 11: ETSZ EVENT ESSENTIAL FACILITIES DAMAGE FOR THE STATE OF ALABAMA ............................ 30 TABLE 12: ETSZ EVENT HIGHWAY BRIDGE DAMAGE FOR THE STATE OF ALABAMA................................... 31 TABLE 13: ETSZ EVENT COMMUNICATION FACILITIES DAMAGE FOR THE STATE OF ALABAMA ................. 31 TABLE 14: ETSZ EVENT SERVICE INTERRUPTIONS FOR THE STATE OF ALABAMA........................................ 31 TABLE 15: NMSZ EVENT BUILDING DAMAGE BY OCCUPANCY TYPE FOR THE STATE OF ARKANSAS .......... 32 TABLE 16: NMSZ EVENT BUILDING DAMAGE BY BUILDING TYPE FOR THE STATE OF ARKANSAS .............. 33 TABLE 17: NMSZ EVENT ESSENTIAL FACILITIES DAMAGE FOR THE STATE OF ARKANSAS.......................... 33 TABLE 18: NMSZ EVENT HIGHWAY BRIDGE DAMAGE FOR THE STATE OF ARKANSAS ................................ 34 TABLE 19: NMSZ EVENT ELECTRIC POWER FACILITY DAMAGE FOR THE STATE OF ARKANSAS.................. 34 TABLE 20: NMSZ EVENT UTILITY SERVICE INTERRUPTIONS FOR THE STATE OF ARKANSAS ....................... 34 TABLE 21: NMSZ EVENT BUILDING DAMAGE BY OCCUPANCY TYPE FOR THE STATE OF ILLINOIS .............. 36 TABLE 22: NMSZ EVENT BUILDING DAMAGE BY BUILDING TYPE FOR THE STATE OF ILLINOIS .................. 36 TABLE 23: NMSZ EVENT ESSENTIAL FACILITIES DAMAGE FOR THE STATE OF ILLINOIS.............................. 37 TABLE 24: NMSZ EVENT HIGHWAY BRIDGE DAMAGE FOR THE STATE OF ILLINOIS .................................... 37 TABLE 25: NMSZ EVENT WASTE WATER FACILITIES DAMAGE FOR THE STATE OF ILLINOIS....................... 37 TABLE 26: NMSZ EVENT UTILITY SERVICE INTERRUPTIONS FOR THE STATE OF ILLINOIS ........................... 38 TABLE 27: NMSZ EVENT BUILDING DAMAGE BY OCCUPANCY CLASS IN THE STATE OF INDIANA............... 39 TABLE 28: NMSZ EVENT BUILDING DAMAGE BY BUILDING TYPE FOR THE STATE OF INDIANA .................. 39 TABLE 29: NMSZ EVENT ESSENTIAL FACILITIES DAMAGE FOR THE STATE OF INDIANA.............................. 40 TABLE 30: NMSZ EVENT PIPELINE DAMAGE FOR THE STATE OF INDIANA ................................................... 40 TABLE 31: NMSZ EVENT UTILITY SERVICE INTERRUPTIONS FOR THE STATE OF INDIANA........................... 40 TABLE 32: WVSZ EVENT BUILDING DAMAGE BY OCCUPANCY CLASS FOR THE STATE OF INDIANA............ 42 TABLE 33: WVSZ EVENT BUILDING DAMAGE BY BUILDING TYPE FOR THE STATE OF INDIANA.................. 42 TABLE 34: WVSZ EVENT ESSENTIAL FACILITIES DAMAGE FOR THE STATE OF INDIANA ............................. 42 TABLE 35: WVSZ EVENT COMMUNICATION FACILITIES DAMAGE FOR THE STATE OF INDIANA .................. 43 TABLE 36: WVSZ EVENT UTILITY SERVICE INTERRUPTIONS FOR THE STATE OF INDIANA........................... 43 TABLE 37: NMSZ EVENT BUILDING DAMAGE BY OCCUPANCY TYPE FOR THE STATE OF KENTUCKY.......... 44 TABLE 38: NMSZ EVENT BUILDING DAMAGE BY BUILDING TYPE FOR THE STATE OF KENTUCKY .............. 45 TABLE 39: NMSZ EVENT ESSENTIAL FACILITIES DAMAGE FOR THE STATE OF KENTUCKY ......................... 45 TABLE 40: NMSZ EVENT HIGHWAY BRIDGE DAMAGE FOR THE STATE OF KENTUCKY................................ 46 TABLE 41: NMSZ EVENT WASTE WATER FACILITIES DAMAGE FOR THE STATE OF KENTUCKY .................. 46 TABLE 42: NMSZ EVENT UTILITY SERVICE INTERRUPTIONS FOR THE STATE OF KENTUCKY....................... 47 TABLE 43: NMSZ EVENT BUILDING DAMAGE BY OCCUPANCY TYPE FOR THE STATE OF MISSISSIPPI ......... 48 TABLE 44: NMSZ EVENT BUILDING DAMAGE BY BUILDING TYPE FOR THE STATE OF MISSISSIPPI.............. 48 TABLE 45: NMSZ EVENT ESSENTIAL FACILITIES DAMAGE FOR THE STATE OF MISSISSIPPI ......................... 49 TABLE 46: NMSZ EVENT HIGHWAY BRIDGE DAMAGE FOR THE STATE OF MISSISSIPPI ............................... 49 TABLE 47: NMSZ EVENT COMMUNICATION FACILITIES DAMAGE FOR THE STATE OF MISSISSIPPI .............. 49 TABLE 48: NMSZ EVENT UTILITY SERVICE INTERRUPTIONS FOR THE STATE OF MISSISSIPPI ...................... 50 TABLE 49: NMSZ EVENT BUILDING DAMAGE BY OCCUPANCY TYPE FOR THE STATE OF MISSOURI............ 51 TABLE 50: NMSZ EVENT BUILDING DAMAGE BY BUILDING TYPE FOR THE STATE OF MISSOURI ................ 51 TABLE 51: NMSZ EVENT ESSENTIAL FACILITIES DAMAGE FOR THE STATE OF MISSOURI ........................... 52

x
TABLE 52: NMSZ EVENT HIGHWAY BRIDGE DAMAGE FOR THE STATE OF MISSOURI.................................. 52 TABLE 53: NMSZ EVENT POTABLE WATER FACILITY DAMAGE FOR THE STATE OF MISSOURI.................... 53 TABLE 54: NMSZ EVENT UTILITY SERVICE INTERRUPTIONS FOR THE STATE OF MISSOURI ......................... 53 TABLE 55: NMSZ EVENT BUILDING DAMAGE BY OCCUPANCY TYPE FOR THE STATE OF TENNESSEE ......... 54 TABLE 56: NMSZ EVENT BUILDING DAMAGE BY BUILDING TYPE FOR THE STATE OF TENNESSEE.............. 54 TABLE 57: NMSZ EVENT ESSENTIAL FACILITIES DAMAGE FOR THE STATE OF TENNESSEE ......................... 55 TABLE 58: NMSZ EVENT HIGHWAY BRIDGE DAMAGE FOR THE STATE OF TENNESSEE ............................... 56 TABLE 59: NMSZ EVENT COMMUNICATION FACILITIES DAMAGE FOR THE STATE OF TENNESSEE .............. 57 TABLE 60: NMSZ EVENT UTILITY SERVICE INTERRUPTIONS FOR THE STATE OF TENNESSEE ...................... 57 TABLE 61: NMSZ EVENT SHELTER REQUIREMENTS FOR THE STATE OF ALABAMA ..................................... 61 TABLE 62: NMSZ EVENT CASUALTIES FOR THE STATE OF ALABAMA.......................................................... 61 TABLE 63: NMSZ EVENT TOTAL DIRECT ECONOMIC LOSS FOR THE STATE OF ALABAMA........................... 61 TABLE 64: ETSZ EVENT SHELTER REQUIREMENTS FOR THE STATE OF ALABAMA ....................................... 62 TABLE 65: ETSZ EVENT CASUALTIES FOR THE STATE OF ALABAMA ........................................................... 62 TABLE 66: ETSZ EVENT TOTAL DIRECT ECONOMIC LOSSES FOR THE STATE OF ALABAMA ........................ 63 TABLE 67: NMSZ EVENT SHELTER REQUIREMENTS FOR THE STATE OF ARKANSAS .................................... 63 TABLE 68: NMSZ EVENT CASUALTIES FOR THE STATE OF ARKANSAS......................................................... 63 TABLE 69: NMSZ EVENT TOTAL DIRECT ECONOMIC LOSSES FOR THE STATE OF ARKANSAS...................... 64 TABLE 70: NMSZ EVENT SHELTER REQUIREMENTS FOR THE STATE OF ILLINOIS ........................................ 64 TABLE 71: NMSZ EVENT CASUALTIES FOR THE STATE OF ILLINOIS............................................................. 65 TABLE 72: NMSZ EVENT TOTAL DIRECT ECONOMIC LOSSES FOR THE STATE OF ILLINOIS .......................... 65 TABLE 73: NMSZ EVENT SHELTER REQUIREMENTS FOR THE STATE OF INDIANA ........................................ 66 TABLE 74: NMSZ EVENT CASUALTIES FOR THE STATE OF INDIANA ............................................................ 66 TABLE 75: NMSZ EVENT TOTAL DIRECT ECONOMIC LOSSES FOR THE STATE OF INDIANA.......................... 66 TABLE 76: WVSZ EVENT SHELTER REQUIREMENTS FOR THE STATE OF INDIANA ........................................ 67 TABLE 77: WVSZ EVENT CASUALTIES FOR THE STATE OF INDIANA ............................................................ 67 TABLE 78: WVSZ EVENT TOTAL DIRECT ECONOMIC LOSSES FOR THE STATE OF INDIANA.......................... 68 TABLE 79: NMSZ EVENT SHELTER REQUIREMENTS FOR THE STATE OF KENTUCKY .................................... 68 TABLE 80: NMSZ EVENT CASUALTIES FOR THE STATE OF KENTUCKY ........................................................ 69 TABLE 81: NMSZ EVENT TOTAL DIRECT ECONOMIC LOSSES FOR THE STATE OF KENTUCKY...................... 69 TABLE 82: NMSZ EVENT SHELTER REQUIREMENTS FOR THE STATE OF MISSISSIPPI.................................... 70 TABLE 83: NMSZ EVENT CASUALTIES FOR THE STATE OF MISSISSIPPI ........................................................ 70 TABLE 84: NMSZ EVENT TOTAL DIRECT ECONOMIC LOSSES FOR THE STATE OF MISSISSIPPI ..................... 71 TABLE 85: NMSZ EVENT SHELTER REQUIREMENTS FOR THE STATE OF MISSOURI ...................................... 71 TABLE 86: NMSZ EVENT CASUALTIES FOR THE STATE OF MISSOURI .......................................................... 71 TABLE 87: NMSZ EVENT TOTAL DIRECT ECONOMIC LOSSES FOR THE STATE OF MISSOURI........................ 72 TABLE 88: NMSZ EVENT SHELTER REQUIREMENTS FOR THE STATE OF TENNESSEE.................................... 73 TABLE 89: NMSZ EVENT CASUALTIES FOR THE STATE OF TENNESSEE ........................................................ 73 TABLE 90: NMSZ EVENT TOTAL DIRECT ECONOMIC LOSSES FOR THE STATE OF TENNESSEE ..................... 73

1
Introduction Catastrophic event response planning assessments are underway, led by the Federal Emergency Management Agency (FEMA). The effort focuses on plausible natural disasters that could impact the nation. Examples of these catastrophic events include a significant earthquake in Los Angeles, California, a Category V hurricane in Miami, Florida, and a magnitude 7.7 earthquake in the New Madrid Seismic Zone (NMSZ). The Mid-America Earthquake Center (MAEC) at the University of Illinois and the Institute for Crisis, Disaster and Risk Management (ICDRM) at the George Washington University in Washington, D.C., were contracted by FEMA through the U.S. Army Corps of Engineers to study earthquake consequences in the Central USA. This project comprises a multi-phase investigation of possible earthquake scenarios, analytical earthquake impact assessments, and social impact estimates that will assist federal, state, and local governments to develop coordinated response plans for a catastrophic earthquake in Central USA. The primary objective of this multi-phase project is to provide scientifically defensible earthquake impact assessments with the most up-to-date hazard, inventory and fragility data in order to save lives and protect property. Current social impact modeling uses the earthquake impact assessment results to create the best available estimates of affected population and the various requirements for the care of displaced residents. The Project Team has concluded the first phase of the earthquake impact assessments which are the preliminary estimates of direct damage to infrastructure, social impacts and economic losses for the individual states (reference is made to the Scenario Disclaimer above). The results of this Phase were utilized in numerous earthquake response and recovery planning workshops at the local and state-level by the eight Central US Earthquake Consortium (CUSEC) member states. The CUSEC member states are: Alabama, Arkansas, Illinois, Indiana, Kentucky, Mississippi, Missouri and Tennessee. This report details components of impact for all analyses completed for response planning. The reported impact assessment estimates are compared with other limited impact assessment studies available for the NMSZ.
Earthquake Impact Assessment Overview Analytical earthquake impact assessments require three fundamental components; namely hazard, inventory and fragility. The hazard includes a definition of ground motion and consequential ground effects, such as large permanent ground deformation. Inventory is a compilation of assets in a specific region of interest, and may include numerous types of infrastructure in the built environment as well as population demographic data. Fragility relationships relate a certain level of ground shaking to the likelihood of a specified degree of damage. These three parameters are integrated to determine direct damage, direct economic loss and functionality of infrastructure components. The results of this direct damage assessment are then used to determine social impacts such as displaced population and sheltering requirements. The three primary components and social impacts are explained in further detail in the following sections of the report.

2
Hazard The earthquake hazard experienced by a certain region of interest, such as a state, may be defined by several methods and with varying degrees of detail. A minimum definition of hazard requires the level of shaking be quantified over the entire region of interest, expressed as peak ground motion parameters (acceleration, velocity and displacement). The hazard may also be expressed as peak response of simple structures (peak spectral values: peak spectral acceleration, velocity and displacement). One method to estimate shaking is through the use of attenuation functions. Regionally appropriate attenuation functions are available, such as attenuations for Europe (Ambraseys and Bommer, 1991; Ambraseys and Bommer, 1992; Ambraseys and Simpson, 1996), Japan (Fukushima et al., 1995; Kamiyama, 1995), the Western U.S. (WUS) (Abrahamson and Silva,1997; Atkinson and Boore, 2002; Campbell and Bozorgnia, 2003), and the Central and Eastern U.S. (CEUS) (Atkinson and Boore, 1995; Toro et al., 1997; Sommerville et al., 2001). Attenuations relationships, by definition, illustrate the propagation of shaking from a point source, commonly referred to as an epicenter (or in some cases, hypocenter1). More comprehensive source modeling is available to better characterize the ground shaking that results from an earthquake. Line-source modeling involves the rupture of an entire fault segment and may account for directionality of fault rupture in the estimation of ground motion. By including more aspects of ground motion, line-source modeling is preferred over a more simplified point-source model. Area source models also exist, and require considerable knowledge of the tectonic environment and mapping of fault geometry and likely mechanisms of rupture. Numerous additional components are required for a complete definition of hazard. Soil amplification is used to adjust the ground motion for local soil conditions since different soil type affect the surface shaking nature. For example soft soil deposits are likely to filter short period vibrations and amplify long period shaking, thus increasing the likelihood of damage to long-period structures such as high-rise buildings and long-span bridges. Liquefaction susceptibility refers to the change in phase of partially saturated soil deposits that may completely lose cohesion during prolonged shaking. This results in permanent ground deformations such as lateral spreading and settlement, both of which increase the likelihood of damage to infrastructure. Landslide susceptibility is included in earthquake impact assessments to define the likelihood of inclined deposits sliding during or shortly after earthquakes. Additional forms of hazard definition include surface fault rupture, though this is not discussed here. Hazard characterization for this project is mainly based on the U.S. Geological Survey studies, supported and augmented by information from the state geological surveys in the eight affected states. For more information on hazard definition in earthquake impact assessment, please refer to Appendix IV.
1 The hypocenter is the location in the earth where the source of rupture is located. The epicenter is the projection of the hypocenter on the Earth’s surface. Conversely, the hypocenter is located beneath the epicenter at a specific distance, called the ‘focal depth.’ For further information please reference the HAZUS-MH MR2 Technical Manual, Chapter 4, Figure 4.3 for an illustration of this concept.

3
Inventory Inventory includes all components of the built environment as well as demographic data. Demographic data includes estimates of total population, and various group classifications within the general population, broken down by income, ethnicity, education and age. Inventory, or assets, in the built environment includes a wide variety of infrastructure with commonly used inventory types listed below: Essential Facilities
o Schools and Hospitals o Police and Fire Stations o Emergency Operation Centers (EOCs)
Transportation Lifelines o Highway Bridges and Roads o Railway Bridges, Tracks and Facilities o Airport, Port, Bus and Ferry Facilities
Utility Lifelines o Potable Water Facilities and Networks o Waste Water Facilities and Networks o Natural Gas Facilities and Pipelines o Oil Facilities and Pipelines o Electric Power and Communication Facilities
High Potential-Loss Facilities o Dams and Levees o Hazardous Materials Plants o Nuclear Power Plants
Various types of information, or metadata, are required for a full assessment of these components. A description of building type, construction material, height, age, design level and soil condition is required to determine the response of the building to ground shaking. A replacement value must also be included if direct economic losses are to be determined. Many of the aforementioned infrastructure items are packaged with the impact assessment software, HAZUS-MH MR2, as default data. Updates to this baseline, or default, inventory will improve the accuracy of the impact assessment as more of the actual inventory is captured in the assessment. Additionally, new types of inventory may be added to address site-specific issues. Such inventory items can include high-rise buildings, long-span bridges, cell phone towers, arenas and stadiums, historical landmarks, and mass public transit such as subways and elevated rail systems, among others. The majority of the inventory data used for this project is taken primarily from the Homeland Security Infrastructure Program (HSIP) 2007 dataset, with additional inventory collected by the MAE Center for specific regions2. For more information on inventory for earthquake impact assessment, please refer to Appendix IV. 2 Many bridges are included in the default inventory provided by HAZUS-MH MR2, though these bridges do not include major river crossings, such as those over the Mississippi and Missouri Rivers. These bridges have unique structural configurations that require structure-specific analyses
4
Fragility Fragility functions are used to relate the intensity of ground shaking to the likelihood of a particular level of damage occurring. Fragility functions, sometimes referred to as vulnerability functions, when represented graphically plot a shaking intensity (or hazard) parameter against a probability that a given damage level (e.g. light, moderate or severe) will occur. In other words, if a certain level of shaking is experienced by a structure, a fragility function will estimate how likely it is that this particular structure will incur various levels of damage. Numerous parameters are used to quantify the level of shaking and may include peak ground acceleration (PGA), velocity (PGV) or displacement (PGD). Also, the maximum response of a simple structure, referred to as the spectral response quantity, may be used in the form of spectral acceleration, velocity or displacement. The use of a particular hazard parameter is specific to the infrastructure element being assessed. For example, damage to buildings is often related to the spectral displacement, whereas peak ground velocity is commonly used for pipelines. Furthermore, fragility curves are generally organized in sets for a specific infrastructure component. HAZUS-MH MR2 requires four fragility curves per infrastructure item - one per damage limit state. Damage limit states included in HAZUS-MH MR2 are slight, moderate, extensive, and complete (Kircher et al, 1997). Many fragility relationships for types or classes of structures exist in the literature (a brief description is provided in Elnashai (2003)). In this report, the default fragility relationships of HAZUS-MH MR2 are employed. In future phases, uniform reliability fragility relationships based on advances simulations will be used (Nielson and DesRoches, 2004, 2006a, 2006b; Gencturk et al, 2007). For further information on fragility relationships, reference is made to Appendices III and IV.
Social Impacts Social impacts include a wide variety of requirements associated with a population in a post-disaster environment. HAZUS-MH MR2 encompasses several estimates including displaced households (residences and families), short-term shelter population, and casualties. The number of displaced households is estimated based on the extent of damage to residential buildings along with building classification (single family, multi-family dwelling). In some cases, the number of displaced households may also include factors for the loss of utility services. Estimates for the number of people seeking shelter are calculated as a percentage of the displaced population, taking into consideration demographic composition factors including ethnicity, age, and income level. These demographic factors influence the number of families seeking shelter in a region. For example, those families with limited financial means are more likely to seek public shelter and require short-term housing. Additional social impact models include more detailed predictions for the displaced population. Food, refrigeration, sleeping and water requirements are determined as well

5
as space requirements for housing the shelter seeking population. Furthermore, the percentage of the displaced population requiring medical attention for chronic illnesses is estimated and can be included in response plans. Casualty estimates are also a critical element of social impact assessments. HAZUS-MH MR2 classifies all injuries and fatalities as casualties when reporting a total number, though severity level estimates are also provided. Four levels of casualties are reported in HAZUS-MH MR2, ranging from minor injuries not requiring hospitalization to fatalities. Examination of the outputs for both displaced populations and shelter seeking populations led to the conclusion that the calculations being performed within HAZUS-MH MR2 were incorrect due to errors in the software. This is currently being corrected in the next release of the software. To calculate these estimates for the scenarios discussed in this report, the project combined the damage estimates and population estimates from HAZUS-MH MR2 and utilized the HAZUS-MH MR2 methodology to derive the number of displaced people and the shelter seeking population. For further information on social impact methodology, please refer to Appendix III.
Consequence Assessment Software In this phase of the project, use is made exclusively of HAZUS-MH MR2 (FEMA, 2007). Earlier work using other versions of HAZUS was repeated after careful comparisons with the newer version. HAZUS provides extensive libraries of models and data that can be used in a default mode. Most HAZUS models were retained whilst almost all HAZUS data was over-written by more comprehensive information. Significant changes were made to the social impact model in HAZUS, as elaborated upon in this report. In phase II of the project, which is currently underway, HAZUS analyses are augmented by specialized analysis using MAEviz release 3.0 (MAEviz, 2008). Special emphasis is paid in MAEviz to the utility and transportation network disruption, and the optimized allocation of temporary housing to the displaced population. The architecture and application of MAEviz are described in Elnashai et al (2008, a and b), while the temporary housing model features are presented in El-Anwar et al (2008).
Phase I Earthquake Hazard The Central U.S. is not often thought of as a seismically active region, although the April, 2008 earthquake near Mt. Carmel, Illinois, brought a great deal of attention to this region and its potential seismic hazards. Though this particular event occurred on the Wabash Valley Fault in Southern Illinois, the larger and more active New Madrid Seismic Zone (NMSZ) is only a short distance away. Stretching from southwest Illinois to northeast Arkansas, the NMSZ is located in portions of five states in the Central U.S.: Illinois, Missouri, Kentucky, Tennessee and Arkansas.

6
This seismic region has produced some of the most major seismic events in U.S. history. During the winter of 1811 and 1812, a series of three earthquakes, with magnitudes of around 8, struck northeast Arkansas and southeast Missouri. These magnitudes were determined based on witness reports at the time of the events, liquefaction features dated to that period of time, and fault structure (Johnston & Schweig, 1996). At the time of these earthquakes, the Central U.S. was sparsely populated, with very few structures. Of the few buildings constructed in the region, many were likely for residential or agricultural use and of low quality. Currently, however, the Central U.S. is vastly populated with major population centers in Memphis, TN and St. Louis, MO. Both of these cities are likely to sustain damage from a NMSZ event, and particularly Memphis in particular could see severe damage. According to Hildenbrand et al. (1996), the chance of a magnitude 6 or 7 earthquake occurring within the next 50 years is roughly 90%. Additionally, more than 3,000 earthquakes have occurred in the NMSZ since 1974 (Johnston & Schweig, 1996). An earthquake of magnitude 7, as has been predicted, or a recurrence of the 1811-1812 series could have devastating impacts on the region, with considerable national repercussions, as transportation routes, natural gas and oil transmission pipelines are broken and services are interrupted. Preliminary estimates, including those completed by the Mid-America Earthquake Center (MAEC), found that economic losses from a magnitude 7.7 (Mw7.7) event in the NMSZ could reach $50-$80 billion dollars in direct losses alone. Additionally, there could be thousands of fatalities, tens of thousands of injured victims, and even hundreds of thousands left without homes. The first step in developing earthquake impact assessments is developing scientifically defensible ground motion for a NMSZ Mw7.7 event upon which earthquake impact assessment models are based. All ground motions employed in this study were developed by the U.S. Geological Survey. Three different events are considered, one for each presumed segment of the New Madrid Fault. Figure 1 illustrates the locations of each fault segment. The primary fault, shown in Figure 1, illustrates the three segments: northeast, central and southwest. The northeast and southwest segments are strike-slip faults while the central, or reelfoot segment, is a thrust fault. The presumed fault boundaries are not shown here, though they were used in the development of the national seismic hazard maps to account for the uncertainty of fault rupture (Frankel et al., 1996; Frankel et al., 2002). Figure 1 is similar to the single fault location shown in Johnston & Schweig (1996). The ground motion maps developed for the NMSZ are based on the rupture of a single segment, meaning the northeast, central and southwest segments are independent events which model the rupture of the entire fault segment length. Ground motion for each segment rupture is attenuated through rock and then propagated through the layer of soil on top of the bedrock layer. The specific procedure used to develop these three Mw7.7 deterministic events is similar to the method used for NMSZ probabilistic maps developed by the USGS. For further information on the method by which these maps were developed, please refer to Cramer (2006). Modeling in HAZUS-MH MR2 requires four ground shaking parameters to complete an earthquake impact assessment: peak ground acceleration (PGA), peak ground velocity (PGV), short-period spectral acceleration (Sa 0.3 sec.) and long-period spectral acceleration (Sa 1.0 sec.). Maps were developed for

7
each of these parameters. This means that each segment rupture requires a suite of four maps to fully define the ground motion for use in HAZUS-MH MR2.
Figure 1: New Madrid Seismic Zone Fault Segments
Earthquake impact assessments are completed for each of the eight states in the NMSZ. The maps developed by Cramer and the USGS did not cover the full extent of the eight state region, so shaking values are specified for the four shaking parameters. Parameters are specified in outlying areas as follows:
PGA = 0.05g PGV = 3 in./sec. Sa 0.3 sec. = 0.12g Sa 1.0 sec. = 0.11g
Original ground motion maps for PGA are shown in Figure 2 for the northeast segment, Figure 3 for the central segment, and Figure 4 for the southwest segment.

8
Figure 2: Northeast Segment of Middle Fault PGA (g)
Figure 3: Central Segment of Middle Fault PGA (g)

9
Figure 4: Southwest Segment of Middle Fault PGA (g)
Additionally, maps developed for the middle fault are shifted to the fault zone boundaries to determine the worst case event for all states except Arkansas. The MAEC was advised by the Arkansas State Geologic Survey to use the middle fault for the earthquake impact assessment in the State of Arkansas. As a result, each state’s worst case event is described by a fault segment and shifting direction, such as east, west, or middle fault. The ground motion is shifted according to the follow descriptions for each state:
Alabama: Southwest segment of eastern fault boundary line Arkansas: Southwest segment of middle fault line Illinois: Northeast segment of western fault boundary line Indiana: Northeast segment of eastern fault boundary line Kentucky: Northeast segment of the eastern fault boundary line Mississippi: Southwest segment of the eastern fault boundary line Missouri: Central segment of the western fault boundary line Tennessee: Southwest segment of the eastern fault boundary line
Two additional scenarios are considered for events outside the NMSZ. The first is a magnitude 7.1 (Mw7.1) earthquake in the Wabash Valley Seismic Zone (WVSZ) in Southern Illinois and Indiana. The ground motion maps for this event were also developed by the USGS and model the rupture of a length of fault. Figure 5 illustrates the location of the WVSZ and the Wabash Valley Fault. The PGA for the WVSZ event is illustrated in Figure 6. The procedure used to develop this map is similar to the method used to develop the NMSZ maps. Though a WVSZ event will impact the State of Illinois,

10
this scenario is only completed for the State of Indiana as the WVSZ produces greater damage than the NMSZ event.
Figure 5: Wabash Valley Seismic Zone and Fault Location
Figure 6: Wabash Valley Seismic Zone PGA

11
The final hazard scenario analyzed is a magnitude 5.9 (Mw5.9) event in the East Tennessee Seismic Zone (ETSZ). The Alabama Geologic Survey provided data to define this event, including the location of the epicenter and the depth. In contrast to the other scenarios, this ETSZ scenario ground motion is defined using a suite of attenuations. These attenuations, five in all, comprise the Central and Eastern U.S. (CEUS) Characteristic Event as specified in HAZUS-MH MR2. The attenuations employed are listed below with the weighting factor used:
Atkinson and Boore (1997) 0.250 Toro, Abrahamson and Schneider (1997) 0.250 Frankel, Mueller, Barnhard, Perkins et al. (1996) 0.250 Campbell (2002) 0.125 Sommerville, Collins, Abrahamson et al. (2002) 0.125
Figure 7: East Tennessee Seismic Zone Event, M5.9
The location of the ETSZ event is illustrated in Figure 7. The PGA that results from the suite of attenuations is illustrated in Figure 8. This event generates substantial ground motion in the northeastern portion of the state while the NMSZ event will generate the most intense shaking in the northwestern portion of the state. Comparing the hazard maps for the two scenario ground motions in Alabama, the ETSZ event generates significantly higher ground motion, particularly near the source. For additional information on all scenario ground motion maps including shifting parameters, please reference Appendix I.

12
Figure 8: East Tennessee Seismic Zone PGA
In this series of analyses, hazard characterization is also improved by the addition of liquefaction susceptibility which captures the effects of permanent ground deformation. All NMSZ scenarios, and the WVSZ scenario, utilized a liquefaction susceptibility map that was developed via a proxy that correlates a soil site class (based on National Earthquake Hazard Reduction Program [NEHRP] specifications) to a relative level of liquefaction susceptibility. It should be known that this method is not the most accurate method; rather, it was the only data of this type available at the time these earthquake impact assessment scenarios were completed. The use of this form of liquefaction data will capture the regional effects of ground deformation, but should not be used for smaller-scale, site-specific studies. The correlation between soil site class and relative level of liquefaction susceptibility is detailed below in Table 1:
Table 1: Liquefaction Susceptibility Proxy
Soil Class Description of Soil Liquefaction Susceptibility LevelA Hard Rock NONE B Rock NONE C Very Dense Soil & Soft Rock NONE D Stiff Soils LOW E Soil Soils MODERATE F Soils Requiring Site-Specific Evaluation VERY HIGH
The map of liquefaction susceptibility developed based on proxy information is illustrated in Figure 9. It is evident that a large portion of the region is not covered by the

13
liquefaction susceptibility map. Since no liquefaction susceptibility information is specified in these areas, permanent ground deformation is not included in the direct damage model, meaning damage determinations do not account for permanent ground deformations. Common liquefaction susceptibility levels are ‘very high,’ ‘moderate’ and ‘low.’ The ETSZ scenario was completed several months after the NMSZ and WVSZ scenarios, and by that time a new liquefaction susceptibility map was completed for the State of Alabama. This new map is employed in the earthquake impact assessment for the ETSZ scenario. Figure 10 illustrates the new liquefaction susceptibility map, which covers the entire State of Alabama.
Figure 9: Liquefaction Susceptibility Map

14
Figure 10: Liquefaction Susceptibility for ETSZ Scenario
The hazard in this region of the U.S. is a matter of vigorous debate, largely due to the lack of information from significant seismic events. The ground motion and liquefaction information utilized was the best available at the time these analyses were completed. Improvement of ground motion and liquefaction characterizations in the Central U.S. is an on-going effort and future phases of this project will include updated information. The changes made to the hazard in this investigation, however, are a substantial improvement over the default settings in HAZUS-MH MR2 and go a long way to representing the regional hazard.
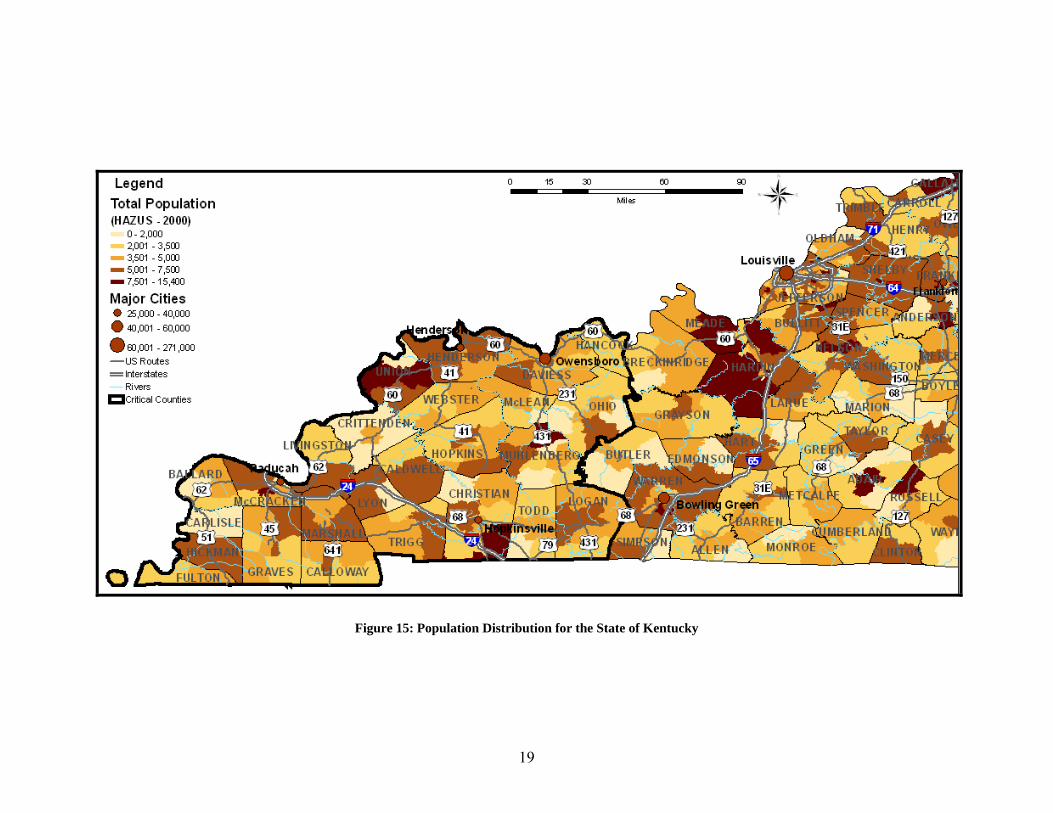
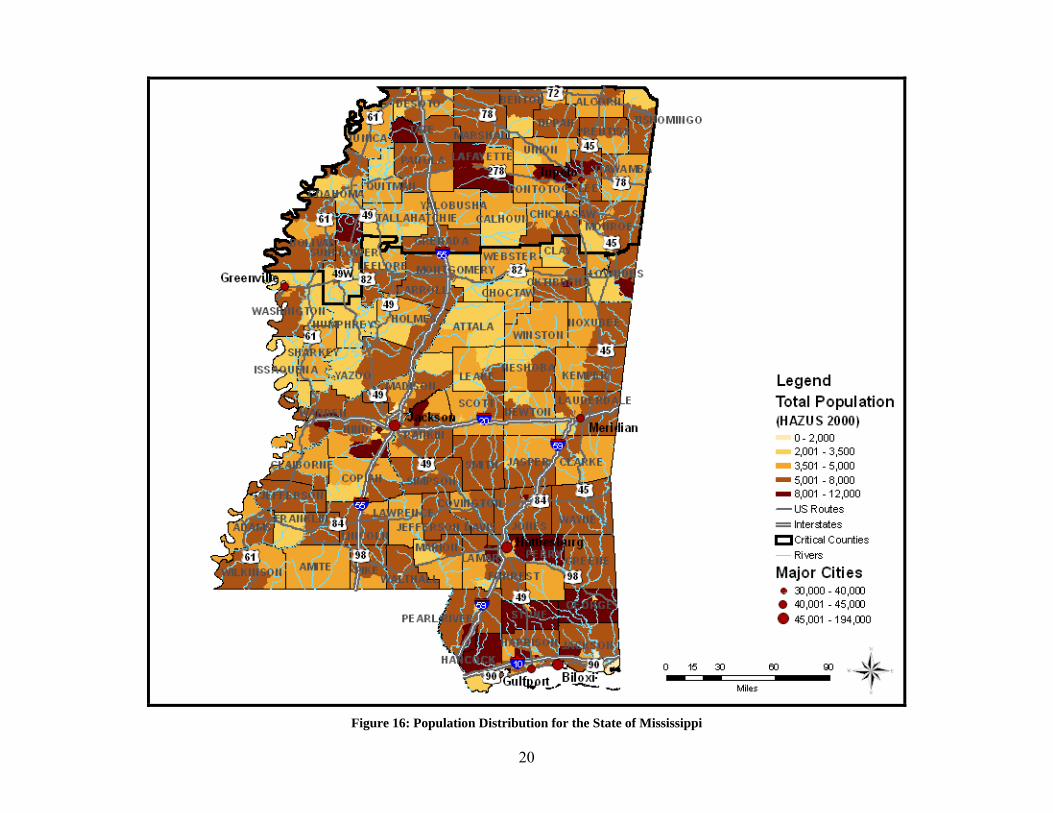
Phase I Inventory The inventory used in this series of earthquake impact assessments is classified into two major categories; population and infrastructure. The population is divided into various demographics which include age, gender, income level and numerous others. Income level is a critical factor when determining the number of people seeking public shelter in a post-disaster environment. The eight states included in this investigation have a total population of roughly 44 million people. Over 25% of the eight-state population resides in Illinois, with the City of Chicago alone contributing several million people. Tennessee and Missouri also contribute nearly six million residents each. Population totals for each state as of the year 2000 census are illustrated in Table 2. Additionally, population distributions of the eight states are shown in Figure 11 through Figure 18.

15
Figure 11: Population Distribution for the State of Alabama

16
Figure 12: Population Distribution for the State of Arkansas

17
Figure 13: Population Distribution for the State of Illinois

18
Figure 14: Population Distribution for the State of Indiana
19
Figure 15: Population Distribution for the State of Kentucky
20
Figure 16: Population Distribution for the State of Mississippi

21
Figure 17: Population Distribution for the State of Missouri

22
Figure 18: Population Distribution for the State of Tennessee

23
Table 2: Total Population of Eight-State Region (Year 2000 Census)
State Population Alabama 4,447,100 Arkansas 2,700,000 Illinois 12,400,000 Indiana 6,080,485 Kentucky 4,041,769 Mississippi 2,844,658 Missouri 5,595,211 Tennessee 5,689,283 TOTAL 43,798,506
All infrastructure and built environment is classified into three categories: buildings, transportation and utilities. The total value of all inventory, or assets, is quantified in Table 3. The entire eight-state region has a value of more than $6.7 trillion. The State of Illinois accounts for approximately 30% of that inventory value, while Kentucky and Missouri contribute roughly 15% each. Furthermore, utility lifelines represent nearly half of all inventory value in the eight states at nearly $3.2 trillion. Buildings account for $2.7 trillion and transportation lifelines contribute approximately $846 billion. This equates to 40% and 13%, respectively, of total inventory value.
Table 3: Inventory Value in Eight-State Region ($ millions)
State Building Value
Transportation Value
Utility Value
Total Value
Alabama $269,580 $108,231 $182,909 $559,720 Arkansas $157,602 $67,940 $47,659 $273,201 Illinois $837,682 $161,097 $1,001,676 $2,000,455 Indiana $380,969 $107,793 $142,909 $631,671 Kentucky $259,784 $128,036 $797,984 $1,185,804 Mississippi $131,314 $69,176 $266,440 $466,930 Missouri $334,877 $121,238 $564,861 $1,020,976 Tennessee $329,827 $82,456 $173,425 $585,708 TOTAL $2,701,635 $845,967 $3,177,863 $6,724,465
There are numerous subsets of inventory within the broad category of infrastructure. As shown in Table 3, the built environment can be broken down into the three major subcategories: buildings, transportation lifelines and utility lifelines. HAZUS-MH MR2 provides basic inventory data for all three of these subcategories, though improving upon this default data is highly recommended for a high-quality earthquake impact assessment. Due to the time required to update all inventory over the entire eight-state region, only select infrastructure categories are updated. Building inventory is one of the most time-consuming forms of data to update and as a result was not done in this investigation. The default building data is classified in two ways: by building/construction type and occupancy or building use type. There are 33 occupancy types, such as residential, commercial, industrial, government, educational, agricultural and religion. These are
24
considered general building types and within these general types are specific building types which can be found in Chapter 4 of the HAZUS-MH MR2 Technical Manual. There are 36 total building types which classify building by the type of structure and material used in construction. Such building types include wood frame, concrete, steel, precast concrete, unreinforced masonry, reinforced masonry and mobile homes. As with occupancy type, there are numerous specific building types which can also be found in Chapter 4 of the HAZUS-MH MR2 Technical Manual (FEMA-NIBS, 2006). Transportation and utility lifelines are updated with information from the Homeland Security Infrastructure Program (HSIP) 2007 Gold Dataset (NGA Office of America, 2007) for critical infrastructure. In order to capture the most complete datasets possible HSIP and HAZUS-MH MR2 default data were combined and the duplicate inventory items removed. The infrastructure compone nts that are supplemented with HSIP data are listed below: Essential Facilities
o Schools o Hospitals o Emergency Operation Centers (EOCs) o Police Stations o Fire Stations
Transportation Lifelines o Highway Bridges o Railway Bridges o Airport Facilities o Ferry Facilities o Bus Facilities o Port Facilities
Utility Lifelines o Natural Gas Facilities o Oil Facilities o Electric Power Facilities o Communication Facilities o Water Treatment Facilities (typically considered Waste Water Facilities) o Natural Gas Major Transmission Pipelines o Oil Major Transmission Pipelines
High Potential-Loss Facilities o Hazardous Material Facilities o Dams o Levees o Prisons
Natural gas and oil major transmission pipelines are not part of the HAZUS-MH MR2 default inventory and are added as a new type of inventory. Adding these pipelines will not only supplement some local distribution networks already present in HAZUS-MH MR2, but will also provide information on the functionality of pipelines carrying critical

25
products to regions outside the NMSZ zone. For more information on the inventory used in this investigation please refer to Appendix II where infrastructure is quantified by state.
Phase I Fragility The fragility curves provided in HAZUS-MH MR2 are intended for use throughout the USA. Using these provided—or default—fragilities for damage estimates means that building damage will not be determined for structural characteristics specific to the Central U.S., where the design and construction practice of all assets (e.g. bridges and buildings) are specific to the region. Additionally, in general, HAZUS-MH MR2 default fragilities are based on expert judgment and do not directly use observed or simulated structural responses. The published technical literature reports many different methods for the derivation of fragility relationships, based on observations, experimental testing, computer simulations, or combinations thereof. The advantage of using the HAZUS-MH MR2 default fragilities is that they provide relatively uniform and often conservative estimates of damage. They are therefore suitable for the regional assessment reported herein. Building fragilities in HAZUS-MH MR2, for example, rely on the Capacity Spectrum Method (CSM) with empirical pushover curves to determine the capacity of the structure, while the demand is characterized by a single smoothed design spectrum. The general building inventory in HAZUS-MH MR2 is divided into 36 building types, each with a different set of fragility curves, which are further distinguished on the basis of found seismic design level (none, low, moderate and high). Transportation and utility lifelines have individual sets of fragility curves which define their performance during a seismic event as well. HAZUS-MH MR2 employs 28 bridge types, for example, to categorize the performance of all bridges in a region’s inventory. Many of these transportation (NIBS, 1999) and utility fragility curves (O’Rourke and Ayala, 1993) are based on expert opinion, due largely to the lack of research in these areas. All HAZUS-MH MR2 default fragility curves are employed in the Phase I scenarios in this report. Updating fragilities will be undertaken in the next phase of the New Madrid Seismic Zone Catastrophic Planning project with a focus on buildings (Gencturk et al, 2007; Gencturk et al, 2008) and bridges (Nielson and DesRoches, 2004, 2006a, 2006b) using MAE Center derived fragility relationships that are specific to the Central USA.
Results of the Earthquake Impact Assessments This section focuses on direct damage to infrastructure in the eight-state region around the NMSZ. Specifically, damage to buildings as well as damage and functionality of critical infrastructure (essential facilities, transportation and utility lifelines) are highlighted and presented by scenario. As mentioned earlier, there are ten total scenarios
26
completed in this phase of the NMSZ earthquake impact assessment project and brief discussions of impact assessment results are given here. At the conclusion of this section, general regional damage trends are identified and comparisons made with other published scenarios for a NMSZ event. In addition, each scenario identifies a set of counties that are expected to incur the greatest amount of damage. These counties are taken from a study completed at FEMA Region VIII. For more detailed explanations of results from each scenario, please refer to Appendix V.
State-Level Direct Damage & Functionality
Alabama New Madrid Seismic Zone Scenario Each scenario completed in this investigation focuses on the critical counties, which are identified as counties in each state where shaking is most intense. Though shaking is less intense in Alabama than most other states, there are 12 counties identified in northwest Alabama that are expected to experience the majority of the damage in the state. These counties are illustrated in Figure 11 and are listed below: Colbert Cullman Fayette Franklin
Lamar Lauderdale Lawrence Limestone
Marion Morgan Walker Winston
The NMSZ Mw7.7 scenario for the State of Alabama generates the greatest amount of damage when the earthquake occurs in the southwest extension of the eastern fault. Building damage resulting from this event is detailed in Table 4 and Table 5. There are nearly 1.7 million buildings in the State of Alabama, most of which are not impacted by the NMSZ earthquake. “Moderate” damage is much more common at the low levels of shaking experienced across the majority of the state. Residential buildings, which include single family homes and other residential structures, incur nearly 98% of all building damage in Alabama. Commercial structures experience over 100 cases of moderate damage, though that pales in comparison with the number of residential structures damaged. Though the distribution of damage in the critical counties is not shown here, only 2,900 cases of damage occur in the critical counties. This is less than 50% of all building damage, indicating that a large portion of damage occurs in the north-central portion of Alabama. Damage to buildings is further classified by building type. The majority of moderate and extensive damage cases are incurred by mobile homes and unreinforced masonry buildings. Mobile homes and unreinforced masonry buildings are vulnerable to the moderate and low level of shaking (< 0.25g) in northern Alabama, hence the large percentage of damage cases occurring there. Two-thirds of the extensive damage and over 85% of moderate damage is experienced by mobile homes alone. Despite the large

27
proportion of damage incurred by mobile homes and unreinforced masonry buildings only 0.4% of Alabama buildings experience moderate and extensive damage, indicating that most of Alabama is undamaged by the earthquake.
Table 4: NMSZ Event Building Damage by Occupancy Type for State of Alabama
General Occupancy Type Damage General Occupancy
Type Total No. Buildings
Moderate to Severe Damage Complete Damage
Single Family 1,303,224 539 0 Other Residential 354,031 5,581 0 Commercial 18,249 119 0 Industrial 2,048 20 0 Other 2,014 9 0 Total 1,679,566 6,268 0
Table 5: NMSZ Event Damage by Building Type for State of Alabama
Building Damage by Building Type
Building Type None Slight Moderate Extensive Complete
Wood 1,258,071 6,679 120 0 0 Steel 11,399 439 97 3 0 Concrete 3,156 100 23 0 0 Precast 857 28 10 1 0 Reinforced Masonry 5,178 70 24 1 0 Unreinforced Masonry 74,050 3,436 506 18 0 Mobile Home 278,809 31,026 5,417 48 0 Total 1,631,520 41,778 6,197 71 0
Table 6: Essential Facilities Damage and Functionality for NMSZ Event in the State of Alabama3
Essential Facilities Damage & Functionality
Essential Facility Type
Total No. Facilities
(State)
Total No. Facilities
(12 Critical Counties)
At Least Moderate Damage
(Damage >50%)
Complete Damage
(Damage > 50%)
Functionality >50% at Day 1
Hospitals 137 19 0 0 137 Schools 1,870 270 0 0 1,870 EOCs 27 3 0 0 27 Police Stations 496 78 0 0 496 Fire Stations 1,388 250 0 0 1,388
3 For Tables in this section the following method is used to determine the number of facilities in a damage category. HAZUS-MH MR2 assigns each facility a probability of reaching a specific damage level (at least moderate, complete, etc.). In order to provide quantities of facilities at various damage levels, all those facilities that experience a damage probability of 50% or greater for a given damage level are counted as ‘damaged.’ Therefore, the facilities that are not 50% likely to incur damage at a specific damage level are deemed ‘undamaged.’

28
There are thousands of essential facilities in the State of Alabama and over 500 in the 12 critical counties alone. Table 6 highlights the damage and functionality of those facilities. Due to the low level of shaking and lack of liquefaction information employed in the NMSZ run for Alabama, no damage and loss of functionality is estimated, even in the critical counties. Continued functionality of all essential facilities will be critical as Alabama is likely to provide support for other states with more severe impacts from a NMSZ event. Highway bridges are very similar to essential facilities in that moderate or more severe damage is unlikely and the loss of functionality is minimal. All other transportation lifelines are similar as well, with all facilities operational the day after the earthquake. This will permit emergency vehicles and aircraft to access the State of Alabama easily, where many displaced people may be housed.
Table 7: NMSZ Event Damage to Highway Bridges in the State of Alabama4
Highway Bridge Damage Assessments
Total No. of Bridges
At Least Moderate Damage
(Damage > 50%)
Complete Damage
(Damage > 50%) Functionality >50% at Day 1
12 Critical Counties 2,366 0 0 2,366 Remaining Counties 12,231 0 0 12,231 Total State 14,597 0 0 14,597
Table 8: NMSZ Event Damage to Pipelines in the State of Alabama
Pipeline Damage System Total Pipelines (mi) No. Leaks No. Breaks Potable Water – Local 200,893 722 180 Waste Water – Local 120,536 571 143 Natural Gas – Regional 8,558 3 1 Natural Gas – Local 50,705 610 152 Oil – Regional 2,913 1 0
Damage to all utility facilities is similar to damage estimates shown for transportation and essential facilities, and is not shown here. All utility facilities are expected to remain functional in the immediate aftermath of the earthquake. Furthermore, no facilities are anticipated to incur moderate or more severe damage. Minor damage may occur in the critical counties, though occurrences would be infrequent. Pipeline damage in local distribution networks is likely, however. Table 8 illustrates the level of damage predicted for local and regional pipeline networks in the State of Alabama. Regional natural gas and oil pipelines are not expected to incur much damage with minimal breaks and leaks, as shown in Table 8. This is critical because these are major transmission lines that carry critical supplies to the east coast and northeast U.S. Local networks incur substantially more damage with several hundred leaks and breaks throughout the state. Despite the cases of damage to local pipeline networks, potable water service is expected to be 4 See footnote (3).

29
retained for all residences the day after the scenario earthquake. These estimates are calculated from a formula that uses the damage to the distribution system to determine the repair rate. Additional information on this formula is available in the HAZUS-MH MR2 Technical Manual that accompanies the program. Though the number of leaks and breaks may appear to be large, they are spread across many miles of pipeline, resulting in no interruptions in service. For additional information on NMSZ Event damage in Alabama please refer to Appendix V.
Alabama East Tennessee Seismic Zone Scenario The scenario for the East Tennessee Seismic Zone is located in northeastern Alabama and thus a new set of critical counties is required. There are 13 counties that experience the most intense shaking from the ETSZ event and though they are not highlighted in Figure 11, they are visible in the northeast corner of the state. These 13 critical counties are as follows: Blount Calhoun Cherokee Dekalb Etowah
Jackson Jefferson Limestone Madison Marshall
Morgan Saint Clair Talladega
Table 9: ETSZ Event Building Damage by Occupancy Type for the State of Alabama
General Occupancy Type Damage General Occupancy
Type Total No. Buildings
At Least Moderate Damage Complete Damage
Single Family 1,303,224 2,431 410 Other Residential 354,031 3,241 127 Commercial 18,249 61 5 Industrial 2,048 48 2 Other 2,014 5 0 Total 1,679,566 5,786 544
The ETSZ event generates several thousand damaged structures, most of which occur in the 13 critical counties. Of the 544 “completely” damaged structures, all buildings are in the critical counties. Furthermore, all but 30 of the “at least moderately” damaged buildings are in the critical counties. Residential structures incur most of damage, with 98% of residential structures incurring at least moderate damage. Table 9 illustrates the distribution of damage by occupancy type for the ETSZ scenario event. The higher peak ground accelerations in northeast Alabama produce several thousand cases of damage to wood frame buildings, in addition to the damage incurred by unreinforced masonry buildings and mobile homes. The addition of new liquefaction information to this scenario for Alabama is a major factor contributing to the number of complete damage cases. Over 70% of all complete damage cases occur in wood frame

30
buildings with another 20% coming from mobile homes. Additional information on building type damage is shown in Table 10. The ESTZ event produces numerous cases of damage to critical facilities. Several fire stations, all near the epicenter in northeast Alabama, incur moderate or more severe damage. A total of 22 fire stations in that same region are not operational immediately after the earthquake and will inhibit the ability of those firefighters to respond to emergency calls. The same is true for non-operational police stations in northeast Alabama. Table 11 illustrates the damage and functionality loss expected for the ETSZ event in Alabama. Transportation lifeline damage to bridges is representative of all transportation infrastructure. Cases of damage and functionality loss are limited and located within miles of the epicenter. Table 12 highlights the damage and functionality estimates for the ETSZ event.
Table 10: ETSZ Event Building Damage by Building Type for the State of Alabama
Building Damage by Building Type Building Type None Slight Moderate Extensive Complete Wood 1,255,446 7,365 1,596 69 392 Steel 11,814 64 42 14 4 Concrete 3,247 16 11 4 2 Precast 879 8 5 2 0 Reinforced Masonry 5,234 19 14 5 3 Unreinforced Masonry 76,394 1,127 371 81 38 Mobile Home 305,185 6,983 2,676 352 105 Total 1,658,199 15,582 4,715 527 544
Table 11: ETSZ Event Essential Facilities Damage for the State of Alabama5
Essential Facilities Damage & Functionality
Essential Facility Type
Total No. Facilities
At Least Moderate Damage
(Damage >50%)
Complete Damage
(Damage >50%) Functionality >50% at Day 1
Hospitals 137 1 0 136 Schools 1,870 8 0 1,856 EOCs 27 0 0 27 Police Stations 496 6 0 485 Fire Stations 1,388 12 0 1,366
5 See footnote (3).

31
Table 12: ETSZ Event Highway Bridge Damage for the State of Alabama6
Highway Bridge Damage Assessments
Total No. of Bridges
At Least Moderate Damage
(Damage >50%) Complete Damage
(Damage >50%) Functionality > 50% at Day 1
13 Critical Counties 4,014 1 0 4,013 Remaining Counties 10,583 0 0 10,583 Total State 14,597 1 0 14,596 There are over 15,000 communication facilities in the State of Alabama and over 160 of those are expected to incur at least moderate damage from the ETSZ event (see Table 13). All damage is confined to the critical counties in northeast Alabama. Though no other utility facilities damage estimates are shown, other facility types follow the same distribution trends as communication facilities. For more detailed results on utility damage and functionality, please refer to Appendix V. Damage and functionality maps can be found in Appendix VIII.
Table 13: ETSZ Event Communication Facilities Damage for the State of Alabama7
Communication Damage Assessments
Total No. Facilities
At Least Moderate Damage (Damage >50%)
Complete Damage (Damage >50%)
13 Critical Counties 5,180 162 0 Remaining Counties 10,161 0 0 Total State 15,341 162 0 Damage to pipelines is limited, with less than 500 total leaks and 200 total breaks throughout the state. All leaks and breaks occur along local distribution lines, which indicates that all major transmission lines remain intact and will continue transporting product in the days immediately after the earthquake. Service interruptions are shown in Table 14 for electric power facilities only, since no service interruptions are expected for potable water facilities. The day after the earthquake nearly 7,400 households are without power, with over 1,700 households still without power after one week. These service outages will prevent residents from remaining in their homes, resulting in some seeking temporary public shelter.
Table 14: ETSZ Event Service Interruptions for the State of Alabama
Utility Service Interruptions Number of Households without Service No. Households Day 1 Day 3 Day 7 Day 30 Day 90
Electric Power 1,737,080 7,389 4,367 1,715 349 10
6 See footnote (3). 7 See footnote (3).

32
Arkansas New Madrid Seismic Zone Scenario The NMSZ event generates substantial shaking in northeastern Arkansas counties. There are 34 critical counties identified in this portion of the state that are expected to incur the majority of all damage. These critical counties are illustrated in Figure 12 and are also listed below: Arkansas Baxter Clay Cleburne Cleveland Craighead Crittenden Cross Desha
Faulkner Fulton Grant Greene Independence Izard Jackson Jefferson Lawrence
Lee Lincoln Lonoke Mississippi Monroe Phillips Poinsett Prairie Pulaski
Randolph St. Francis Sharp Stone Van Buren White Woodruff
Buildings in Arkansas are heavily damaged by the NMSZ Mw7.7 event. Complete damage cases total over 50,000 while moderate and severe damage levels contribute another 61,500 cases. Table 15 quantifies damage estimates for various occupancy types. Of the over 1.2 million buildings in the State of Arkansas, more than 95% are residential buildings. Over 98% of all complete damage occurs in residential buildings, and the same is true of moderate and severe damage. All cases of complete damage occur in the 34 critical counties and approximately 59,700, or 97%, of moderate and severe damage occurs in the critical counties. Wood frame buildings are a substantial portion of Arkansas’ buildings and as a result many of these structures are damaged, as shown in Table 16. The significant shaking and highlight liquefiable soils in the critical counties are major factors contributing to the tens of thousands of cases of complete damage to wood frame buildings. While over 55% of all complete damage occurs to wood frame structures, unreinforced masonry structures and mobile homes account for 19% and 24% of all complete damage, respectively. All other buildings types comprise a much smaller portion of the building inventory and represent very small percentages of damaged structures.
Table 15: NMSZ Event Building Damage by Occupancy Type for the State of Arkansas
General Occupancy Type Damage General Occupancy
Type Total No. Buildings
Moderate to Severe Damage Complete Damage
Single Family 936,609 38,644 35,742 Other Residential 195,818 21,792 13,626 Commercial 8,078 796 555 Industrial 1,461 155 174 Other 1,169 102 62 Total 1,143,135 61,489 50,159

33
Table 16: NMSZ Event Building Damage by Building Type for the State of Arkansas
Building Damage by Building Type Building Type None Slight Moderate Extensive Complete Wood 718,424 58,893 22,688 6,744 28,425 Steel 2,398 295 218 152 332 Concrete 776 92 58 47 81 Precast 820 97 89 53 100 Reinforced Masonry 444 35 33 28 65 Unreinforced Masonry 96,398 13,474 7,340 4,011 9,334 Mobile Home 115,965 23,376 12,704 7,324 11,822 Total 935,225 96,262 43,130 18,359 50,159
Essential facilities in the State of Arkansas are also substantially damaged by the NMSZ event. Over 150 of the 1,330 fire stations in Arkansas are at least moderately damaged with 191 not operational the day after the earthquake. In addition, 94 schools are damaged with 117 not functioning immediately after the event, as shown in Table 17. The combination of non-operational fire and police services in the critical counties will severely inhibit the ability of emergency workers to respond to requests for assistance. Hospitals in the critical counties are also out of service. Forty of the 103 hospitals in Arkansas are not operational the day after the earthquake, meaning nearly all hospitals in the critical counties will not be able to care for those injured by the earthquake or maintain care for current patients. Counties in western Arkansas will likely need to provide support for those out-of-service facilities immediately after the earthquake.
Table 17: NMSZ Event Essential Facilities Damage for the State of Arkansas8
Essential Facilities Damage & Functionality
Essential Facility Type
Total No. Facilities
At Least Moderate Damage
(Damage >50%)
Complete Damage
(Damage >50%) Functionality >50% at Day 1
Hospitals 103 18 10 63 Schools 1,254 188 106 995 EOCs 11 1 1 10 Police Stations 515 94 43 398 Fire Stations 1,330 151 63 1,139 Transportation lifelines provide much-needed access to portions of the state that are severely damaged by the earthquake and damaged roads or airport runways will limit the assistance to these areas in the critical days after the event. Nearly 700 bridges, all in the critical counties, are damaged and not functioning (see Table 18) which limits the number of response workers, supplies and medical aid accessing northeast Arkansas. Though not shown here, several railway facilities, port facilities and airports are heavily damaged, further inhibiting the movement of people and supplies both into and out of the hardest hit areas. For more information on damage to the transportation infrastructure in Arkansas, please refer to Appendix V.
8 See footnote (3).

34
Table 18: NMSZ Event Highway Bridge Damage for the State of Arkansas9
Highway Bridge Damage Assessments
Total No. Of Bridges
At Least Moderate Damage
(Damage >50%)
Complete Damage
(Damage >50%) Functionality >50% at Day 1
34 Critical Counties 2,883 688 290 2,197 Remaining Counties 2,751 0 0 2,751 Total State 5,634 688 290 4,948 The damage to electric power facilities shown in Table 19 is representative of all utility facility damage in the State of Arkansas. Of the 29 electric power facilities in the critical counties eight are at least moderately damaged with one being completely damaged. Furthermore, eleven facilities are not operational the day after the earthquake, which greatly reduces the number of customers receiving services. Additionally, 66 waste water and 59 communication facilities are at least moderately damaged in the critical counties. Nearly half of the 229 waste water facilities in the critical counties are not operational the day after the earthquake.
Table 19: NMSZ Event Electric Power Facility Damage for the State of Arkansas10
Electric Power Facilities Damage Assessments
Total No. of
Electric Power Facilities
At Least Moderate Damage
(Damage >50%)
Complete Damage
(Damage >50%) Functionality >50% at Day 1
34 Critical Counties 29 8 1 18 Remaining Counties 27 0 0 27 Total State 56 8 1 45
Table 20: NMSZ Event Utility Service Interruptions for the State of Arkansas
Utility Service Interruptions Number of Households without Service No. Households Day 1 Day 3 Day 7 Day 30 Day 90
Potable Water 175,565 174,382 171,216 132,672 79,737 Electric Power
1,042,696 95,309 68,561 39,398 13,541 112
With extensive damage and functionality loss to critical utility facilities in the 34 critical counties, it then follows that utility service outages will be extensive. Table 20 illustrates the loss of utility service in the State of Arkansas. The day after the earthquake, over 175,000 of the one million households in the state are without potable water and over 95,000 households are without electric power. After one week some households see renewed service, though hundreds of thousands of people are still without service. With no utilities available in their homes, many residents that did not experience severe structural damage to their homes may be displaced, dramatically increasing the number of people requiring public shelter. For more information on damage estimates for the
9 See footnote (3). 10 See footnote (3).

35
State of Arkansas, please refer to Appendix V for detailed impact assessment results and see Appendix VIII for maps of damage and functionality losses.
Illinois New Madrid Seismic Zone Scenario A rupture on the northeast extension of the New Madrid Fault produces intense shaking in southern Illinois. Forty counties near the source of seismic activity are identified as critical counties and are expected to incur high levels of damage. These counties are highlighted in Figure 13 and are listed below: Alexander Bond Calhoun Clark Clay Clinton Crawford Edwards Effingham Fayette
Franklin Gallatin Greene Hamilton Hardin Jackson Jasper Jefferson Jersey Johnson
Lawrence Macoupin Madison Marion Massac Monroe Montgomery Perry Pope Pulaski
Randolph Richland Saint Clair Saline Union Wabash Washington Wayne White Williamson
There are roughly 3.3 million buildings in the State of Illinois; far more than the other states in the eight-state region. This is in large part due to the substantial number of buildings in Chicago, Illinois, located in the northeastern portion of the state. These buildings are not likely to be damaged from an earthquake, however, and may skew perceptions of damaged building estimates. There are nearly 17,000 cases of complete damage and nearly 30,000 cases of at least moderate damage. No buildings incur complete damage, which is the rare collapse of a structure. More commonly, complete damage includes critical damage to structural connections, significant lateral displacement of structural systems and other damage that renders a building uninhabitable. In some cases damage is severe enough to cause collapse during aftershocks even if it does not occur during the main event. When compared to the 3.3 million buildings in Illinois, this is roughly 1% of all buildings. Though when considering the 26,000 cases of at least moderate damage in the 40 critical counties, which includes only 500,000 buildings, this equates to over 5% of all buildings. As with many other states, residential buildings experience the majority of building damage. Single family homes and other residential buildings account for all but 200 cases of complete damage and 98% of all at least moderate damage throughout the state, as shown in Table 21. Damage is further classified by building type in Table 22. Wood frame structures account for over 35% of all moderate, extensive and complete damage cases, while over 45% of all complete damage occurs with this building type. Several thousand unreinforced masonry buildings and mobile homes experience complete damage, though extensive and moderate damage levels occur even more.
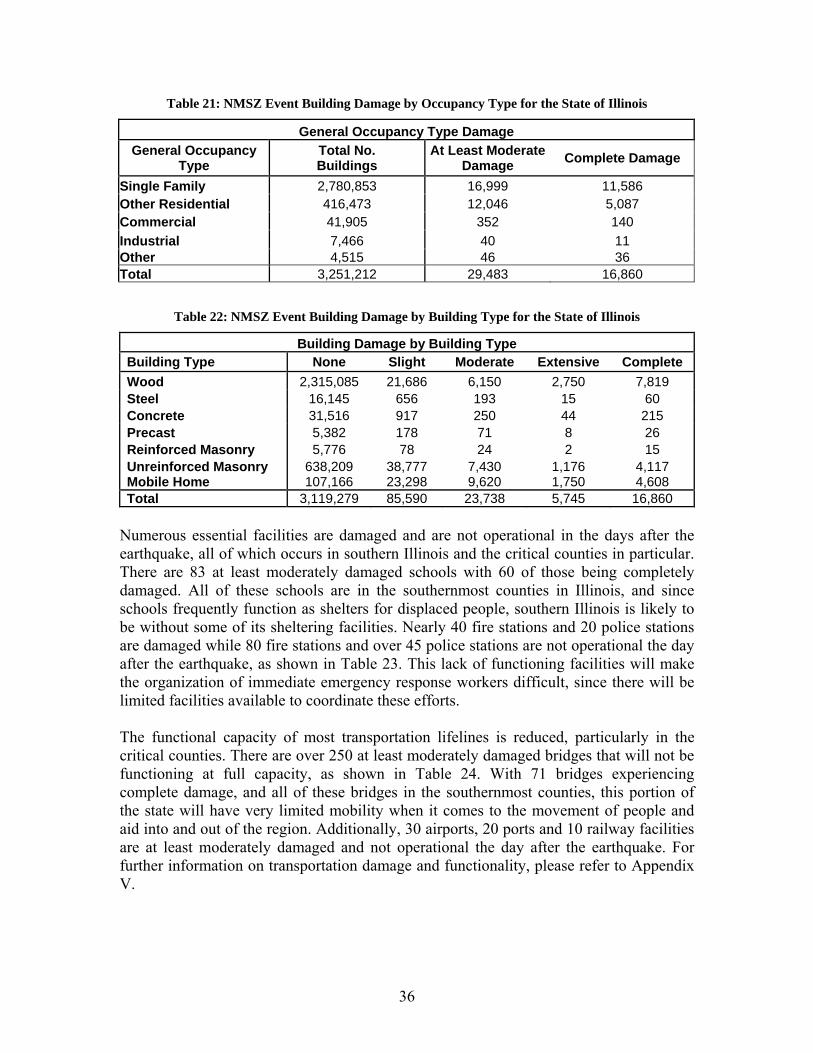
36
Table 21: NMSZ Event Building Damage by Occupancy Type for the State of Illinois
General Occupancy Type Damage General Occupancy
Type Total No. Buildings
At Least Moderate Damage Complete Damage
Single Family 2,780,853 16,999 11,586 Other Residential 416,473 12,046 5,087 Commercial 41,905 352 140 Industrial 7,466 40 11 Other 4,515 46 36 Total 3,251,212 29,483 16,860
Table 22: NMSZ Event Building Damage by Building Type for the State of Illinois
Building Damage by Building Type Building Type None Slight Moderate Extensive Complete Wood 2,315,085 21,686 6,150 2,750 7,819 Steel 16,145 656 193 15 60 Concrete 31,516 917 250 44 215 Precast 5,382 178 71 8 26 Reinforced Masonry 5,776 78 24 2 15 Unreinforced Masonry 638,209 38,777 7,430 1,176 4,117 Mobile Home 107,166 23,298 9,620 1,750 4,608 Total 3,119,279 85,590 23,738 5,745 16,860
Numerous essential facilities are damaged and are not operational in the days after the earthquake, all of which occurs in southern Illinois and the critical counties in particular. There are 83 at least moderately damaged schools with 60 of those being completely damaged. All of these schools are in the southernmost counties in Illinois, and since schools frequently function as shelters for displaced people, southern Illinois is likely to be without some of its sheltering facilities. Nearly 40 fire stations and 20 police stations are damaged while 80 fire stations and over 45 police stations are not operational the day after the earthquake, as shown in Table 23. This lack of functioning facilities will make the organization of immediate emergency response workers difficult, since there will be limited facilities available to coordinate these efforts. The functional capacity of most transportation lifelines is reduced, particularly in the critical counties. There are over 250 at least moderately damaged bridges that will not be functioning at full capacity, as shown in Table 24. With 71 bridges experiencing complete damage, and all of these bridges in the southernmost counties, this portion of the state will have very limited mobility when it comes to the movement of people and aid into and out of the region. Additionally, 30 airports, 20 ports and 10 railway facilities are at least moderately damaged and not operational the day after the earthquake. For further information on transportation damage and functionality, please refer to Appendix V.

37
Table 23: NMSZ Event Essential Facilities Damage for the State of Illinois11
Essential Facilities Damage & Functionality
Essential Facility Type
Total No. Facilities
At Least Moderate Damage
(Damage >50%)
Complete Damage
(Damage >50%)Functionality >50% at Day 1
Hospitals 249 3 1 217 Schools 5,722 83 60 5,464 EOCs 149 2 2 145 Police Stations 1,044 21 15 997 Fire Stations 1,725 38 32 1,645
Table 24: NMSZ Event Highway Bridge Damage for the State of Illinois12
Highway Bridge Damage Assessments
Total No. of Bridges
At Least Moderate Damage
(Damage>50%)
Complete Damage
(Damage>50%) Functionality >50% at Day 1
40 Critical Counties 6,554 264 71 6,293 Remaining Counties 16,300 0 0 16,300 Total State 22,854 264 71 22,593 Utility lifeline damage and functionality is exemplified by waste water facilities estimates in Table 25. There are thousands of waste water facilities in the State of Illinois and roughly 2,000 in the critical counties. Over 450 facilities are at least moderately damaged, which equates to 20% of all facilities in the critical counties. Nearly 1,000 facilities in this same area are not functioning the day after the earthquake which will substantially limit the service provided to customers in southern Illinois. Additionally, nearly 60 electric power facilities are damaged and approximately 130 non-operational at day 1. Communication facilities also show a high frequency of damage in the critical counties with 1,450 at least moderately damaged facilities, or which is roughly 20% of the 7,500 facilities in that area.
Table 25: NMSZ Event Waste Water Facilities Damage for the State of Illinois13
Waste Water Facilities Damage Assessments
Total No. of
Potable Water Facilities
At Least Moderate Damage
(Damage>50%)
Complete Damage
(Damage>50%) Functionality >50% at Day 1
40 Critical Counties 2,221 461 8 1,246 Remaining Counties 7,168 0 0 7,168 Total State 9,389 461 8 8,414 In addition to the significant damage to facilities, utility distribution lines show thousands of breaks and leaks as well. The local potable water distribution network incurs nearly
11 See footnote (3). 12 See footnote (3). 13 See footnote (3).
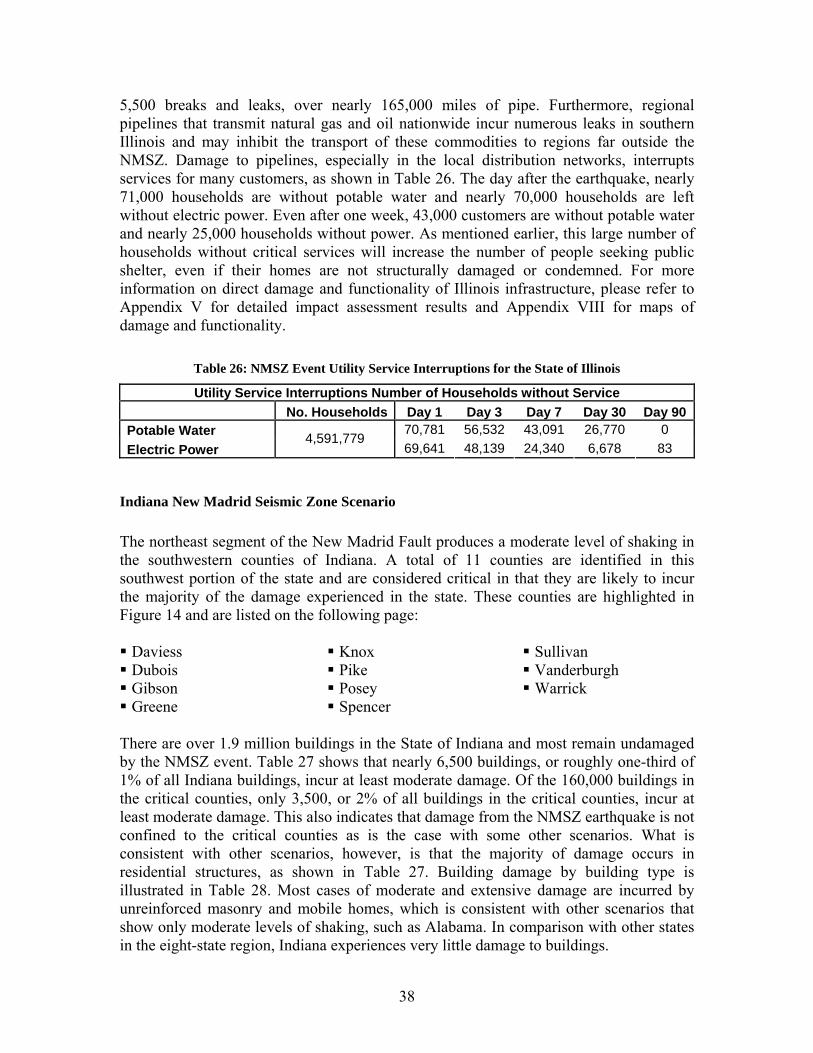
38
5,500 breaks and leaks, over nearly 165,000 miles of pipe. Furthermore, regional pipelines that transmit natural gas and oil nationwide incur numerous leaks in southern Illinois and may inhibit the transport of these commodities to regions far outside the NMSZ. Damage to pipelines, especially in the local distribution networks, interrupts services for many customers, as shown in Table 26. The day after the earthquake, nearly 71,000 households are without potable water and nearly 70,000 households are left without electric power. Even after one week, 43,000 customers are without potable water and nearly 25,000 households without power. As mentioned earlier, this large number of households without critical services will increase the number of people seeking public shelter, even if their homes are not structurally damaged or condemned. For more information on direct damage and functionality of Illinois infrastructure, please refer to Appendix V for detailed impact assessment results and Appendix VIII for maps of damage and functionality.
Table 26: NMSZ Event Utility Service Interruptions for the State of Illinois
Utility Service Interruptions Number of Households without Service No. Households Day 1 Day 3 Day 7 Day 30 Day 90
Potable Water 70,781 56,532 43,091 26,770 0 Electric Power
4,591,779 69,641 48,139 24,340 6,678 83
Indiana New Madrid Seismic Zone Scenario The northeast segment of the New Madrid Fault produces a moderate level of shaking in the southwestern counties of Indiana. A total of 11 counties are identified in this southwest portion of the state and are considered critical in that they are likely to incur the majority of the damage experienced in the state. These counties are highlighted in Figure 14 and are listed on the following page: Daviess Dubois Gibson Greene
Knox Pike Posey Spencer
Sullivan Vanderburgh Warrick
There are over 1.9 million buildings in the State of Indiana and most remain undamaged by the NMSZ event. Table 27 shows that nearly 6,500 buildings, or roughly one-third of 1% of all Indiana buildings, incur at least moderate damage. Of the 160,000 buildings in the critical counties, only 3,500, or 2% of all buildings in the critical counties, incur at least moderate damage. This also indicates that damage from the NMSZ earthquake is not confined to the critical counties as is the case with some other scenarios. What is consistent with other scenarios, however, is that the majority of damage occurs in residential structures, as shown in Table 27. Building damage by building type is illustrated in Table 28. Most cases of moderate and extensive damage are incurred by unreinforced masonry and mobile homes, which is consistent with other scenarios that show only moderate levels of shaking, such as Alabama. In comparison with other states in the eight-state region, Indiana experiences very little damage to buildings.

39
Table 27: NMSZ Event Building Damage by Occupancy Class in the State of Indiana
General Occupancy Type Damage General Occupancy
Type Total No. Buildings
Moderate to Severe Damage Complete Damage
Single Family 1,675,434 2,814 2 Other Residential 229,169 3,189 0 Commercial 19,034 154 0 Industrial 4,317 37 0 Other 4,102 266 0 Total 1,932,056 6,460 2
Table 28: NMSZ Event Building Damage by Building Type for the State of Indiana
Building Damage by Building Type Building Type None Slight Moderate Extensive Complete Wood 1,388,618 7,908 150 0 0 Steel 8,288 463 191 13 0 Concrete 2,618 126 39 1 0 Precast 2,862 158 90 7 0 Reinforced Masonry 1,737 35 14 1 0 Unreinforced Masonry 337,716 18,051 2,823 109 2 Mobile Home 140,340 16,674 2,994 28 0 Total 1,882,179 43,415 6,301 159 2
Damage to essential facilities and transportation lifelines show similar results, in so far as damage and functionality losses are very uncommon or nonexistent. As shown in Table 29, no facilities are expected to incur at least moderate damage, though less severe damage forms are possible. Such forms of damage may include minor cracking to concrete and masonry structures. There is some loss of functionality, all of which occurs in the 11 critical counties. Schools show the greatest loss of functionality, with 56 schools not operational the day after the earthquake. Another nine hospitals, 18 fire stations and six police stations are also not functioning at this same point in time. Transportation lifeline infrastructure items are similar in that there are no cases of moderate damage. In contrast to essential facilities functionality, transportation components show no loss of functionality. Utility facilities do not show any cases of moderate or more severe damage, as is the case with essential facilities and transportation lifelines. Furthermore, there is no loss of functionality, even immediately after the earthquake. While utility facilities show very little damage, utility pipelines show numerous cases of breaks and leaks, as shown in Table 30. Regional and local natural gas networks are represented separately and damage is estimated for each. Potable water lines show the greatest amount of both breaks and leaks at 728 and 753, respectively. Local natural gas lines, however, show the greatest break and leak rates per length of pipe at roughly 0.014 leaks/mile and breaks/mile (roughly 1 leak/break every 70 miles). In addition, local and regional damage to natural

40
gas lines can be combined for a total state damage estimate of 650 leaks and 652 breaks over the combined length of 54,746 miles of natural gas pipeline.
Table 29: NMSZ Event Essential Facilities Damage for the State of Indiana14
Essential Facilities Damage & Functionality
Essential Facility Type
Total No. Facilities
At Least Moderate Damage
(Damage >50%)
Complete Damage
(Damage >50%)
Functionality >50% at Day 1
Hospitals 175 0 0 166 Schools 2,686 0 0 2,630 EOCs 51 0 0 50 Police Stations 474 0 0 468 Fire Stations 1,210 0 0 1,192
Table 30: NMSZ Event Pipeline Damage for the State of Indiana
Pipeline Damage System Total Pipelines (mi) No. Leaks No. Breaks Potable Water - Local 111,394 753 728 Waste Water - Local 66,836 596 576 Natural Gas - Regional 10,188 13 36 Natural Gas - Local 44,558 637 616 Oil - Regional 4,625 17 60
Table 31: NMSZ Event Utility Service Interruptions for the State of Indiana
Utility Service Interruptions Number of Households without Service No. Households Day 1 Day 3 Day 7 Day 30 Day 90
Potable Water 44,115 34,798 11,075 0 0 Electric Power
2,336,306 0 0 0 0 0
The damage to local distribution networks cuts off service for tens of thousands of customers. Table 31 illustrates that over 44,000 households are without potable water service the day after the earthquake, while all electric power service is retained throughout the state. Electric power lines are presumed to be above ground and less likely to incur damage from moderate ground shaking, unlike buried pipelines that are vulnerable to damage from liquefaction and ground deformation. As a result of the low level of shaking, electric power service is not likely to be interrupted for residences in Indiana, even in the first few days following the earthquake. For further information on the earthquake impact assessment results for direct damage in the State of Indiana, please refer to Appendix V. Additional maps showing the distribution of damage can be found in Appendix VIII.
14 See footnote (3).

41
Indiana Wabash Valley Seismic Zone Scenario The WVSZ scenario in the State of Indiana employs the same set of critical counties as the NMSZ scenario. The southwestern-most counties in Indiana experience the most intense shaking for both scenario events, thus the same set of counties is used. For more information on the shaking generated by these to events in the State of Indiana, please refer to Appendix I. The critical counties for the State of Indiana are illustrated in Figure 14 and are listed below: Daviess Dubois Gibson Greene
Knox Pike Posey Spencer
Sullivan Vanderburgh Warrick
The WVSZ event causes several thousand cases of complete damage, as well as moderate and severe damage, to the more than 1.9 million buildings in Indiana. Of the roughly 9,000 completely damaged structures, 96% are residential, with over 85% of these being single family homes. Table 32 illustrates the distribution of building damage by occupancy type. Furthermore, more than 8,600 completely damaged buildings are located in the 11 critical counties in southwest Indiana. Moderate and severe damage is incurred by another 8,000 structures, though only 1,500 of these damage cases occur in the critical counties. This indicates that damage is not confined to the southwestern tip of Indiana, but occurs in counties outside that area, such as Perry, Crawford, Orange, Lawrence, Martin, Monroe, Owen, Clay, Vigo and others. The WVSZ event produces higher levels of shaking than the NMSZ event, and as a result causes thousands of more cases of damage, particularly complete damage. The combination of liquefaction data and more intense shaking contributes significantly to the large number of wood frame building complete damage cases. Approximately 70% of all complete damage is experienced by wood frame structures, while another 20% can be attributed to unreinforced masonry buildings. Moderate and extensive damage states show large numbers of damaged unreinforced masonry structures and mobile homes, though very little wood frame damage is estimated. Of the more than 7,600 cases of moderate and extensive damage, greater than 6,600 cases, or 87%, of the damage, can be attributed to unreinforced masonry and mobile homes. Table 33 shows the distribution of building damage by building type. Though thousands of buildings are damaged by a WVSZ event, essential facilities incur very little damage. Table 34 shows that no essential facilities experience at least moderate damage, though it is likely that some of these facilities will incur some form of minor damage from the WVSZ event. This may include minor cracking of concrete and masonry or minor joint damage, though nothing severe enough to compromise the operational capabilities of the facilities. While estimates show no moderate damage, the functionality of some facilities, particularly in the critical counties, is reduced from this event. There are 20 schools, 15 fire stations, eight police stations and one hospital that are not functional the day after the earthquake. This is likely to limit the emergency response

42
capabilities of such services in the hours immediately after the event, especially in the extreme southwestern counties of Indiana.
Table 32: WVSZ Event Building Damage by Occupancy Class for the State of Indiana
General Occupancy Type Damage General Occupancy
Type Total No. Buildings
Moderate to Severe Damage Complete Damage
Single Family 1,675,434 5,315 7,464 Other Residential 229,169 2,068 1,161 Commercial 19,034 200 90 Industrial 4,317 30 15 Other 4,102 31 224 Total 1,932,056 7,644 8,954
Table 33: WVSZ Event Building Damage by Building Type for the State of Indiana
Building Damage by Building Type Building Type None Slight Moderate Extensive Complete Wood 1,370,489 19,342 515 24 6,305 Steel 8,545 222 83 4 101 Concrete 2,655 72 13 0 44 Precast 2,912 107 46 2 51 Reinforced Masonry 1,717 41 15 0 14 Unreinforced Masonry 330,681 21,176 4,936 227 1,683 Mobile Home 148,359 9,140 1,767 13 756 Total 1,865,358 50,100 7,374 270 8,954
Table 34: WVSZ Event Essential Facilities Damage for the State of Indiana15
Essential Facilities Damage & Functionality
Essential Facility Type
Total No. Facilities
At Least Moderate Damage
(Damage >50%)
Complete Damage
(Damage >50%)Functionality >50% at Day 1
Hospitals 175 0 0 174 Schools 2,686 0 0 2,666 EOCs 51 0 0 49 Police Stations 474 0 0 466 Fire Stations 1,210 0 0 1,195 Despite the moderate level of shaking in several southwestern Indiana counties, most transportation lifeline components remain largely undamaged by the WVSZ event. All highway bridges remain functional even in the days immediately after the earthquake and none of these bridges incur moderate or more severe damage. All railway bridges, as well as railway and port facilities, remain undamaged and operational. Five airports in southwestern Indiana, however, incur moderate damage, which leaves two airports non-
15 See footnote (3).

43
operational in the days immediately after the event. These estimates are not shown here but can be found in Appendix V. Numerous types of utility lifelines incur damage, including hundreds of communication facilities, as shown in Table 35. There are nearly 2,500 communication facilities in the 11 critical counties and 432 of these facilities experience at least moderate damage. Three facilities outside the area in Vigo County also incur at least moderate damage. Of these 435 damaged facilities, only 131 are not functioning the day after the event. In addition to communication facilities damage, 23 electric power facilities experience at least moderate damage, and 53 of these facilities are not operational the day after the event. Furthermore, 22 waste water facilities are not functioning immediately after the earthquake.
Table 35: WVSZ Event Communication Facilities Damage for the State of Indiana16
Communication Damage Assessments
Total No. of
Communication Facilities
At Least Moderate Damage
(Damage >50%) Complete Damage
(Damage >50%) Functionality >50% at Day 1
11 Critical Counties 2,490 432 0 2,359 Remaining Counties 19,189 3 0 19,189 Total State 21,679 435 0 21,548 This dramatic loss of functionality in the southwestern counties of Indiana will severely limit service to area customers. As illustrated in Table 36, tens of thousands of people are without critical utility services in the days and weeks following the WVSZ event. Over 42,000 households are without potable water the day after the earthquake, while nearly 27,000 are still without water after one week. Electric power is cut off for nearly 15,000 people immediately after the event with over 4,000 still without power after a week. A lack of these services will likely prevent residents from staying in their homes and increase the number of people seeking public shelter. For more information on WSVZ impact assessment results, please refer to Appendix V.
Table 36: WVSZ Event Utility Service Interruptions for the State of Indiana
Utility Service Interruptions Number of Households without Service No. Households Day 1 Day 3 Day 7 Day 30 Day 90
Potable Water 42,022 31,248 26,786 18,504 0 Electric Power
2,336,306 14,994 9,419 4,185 1,169 19
16 See footnote (3).

44
Kentucky New Madrid Seismic Zone Scenario The northeast fault segment generates substantial shaking in western Kentucky. As a result 25 counties are identified in that area and are expected to incur the majority of the damage from a NMSZ earthquake. These critical counties are highlighted in Figure 15 and are also listed below: Ballard Caldwell Calloway Carlisle Christian Crittenden Daviess
Fulton Graves Hancock Henderson Hickman Hopkins Livingston
Logan Lyon McCracken McLean Marshall Muhlenberg Ohio
Todd Trigg Union Webster
The State of Kentucky experiences substantial damage to its building stock of nearly 1.5 million buildings, most of which is confined to the western half of the state. Table 37 illustrates the number of building damaged by the NMSZ event. Nearly 30,000 buildings are completely damaged and another 53,000 buildings experience moderate or severe damage. All but roughly 150 cases of complete damage occur in the critical counties and approximately 95% of all moderate and severe damage occurs in these counties. As with many other scenarios, residential structures comprise the majority of the damage. Nearly 98% of all complete damage and over 99% of all moderate and severe damage occurs to single family homes and other residential buildings. This percentage of damage is proportional to the inventory; however, roughly 98% of the building stock is residential construction. As mentioned earlier, other residential structures are most commonly multi-unit dwellings.
Table 37: NMSZ Event Building Damage by Occupancy Type for the State of Kentucky
General Occupancy Type Damage General Occupancy
Type Total No. Buildings
Moderate to Severe Damage Complete Damage
Single Family 1,159,114 39,150 18,768 Other Residential 292,873 13,050 9,673 Commercial 16,431 306 475 Industrial 3,002 48 53 Other 1,900 34 60 Total 1,473,320 52,588 29,029 Building damage by building type is shown in Table 38. Nearly half of all complete damage occurs in wood frame structures, with mobile homes comprising 30% of complete damage and unreinforced masonry (URM) representing slightly less than 30%. Though nearly 14,000 cases of complete damage occur to wood frame structures, this only represents 1.3% of all wood frame buildings in Kentucky. The roughly 6,200 URMs and 8,800 mobile homes that are completely damaged represent a much higher portion of
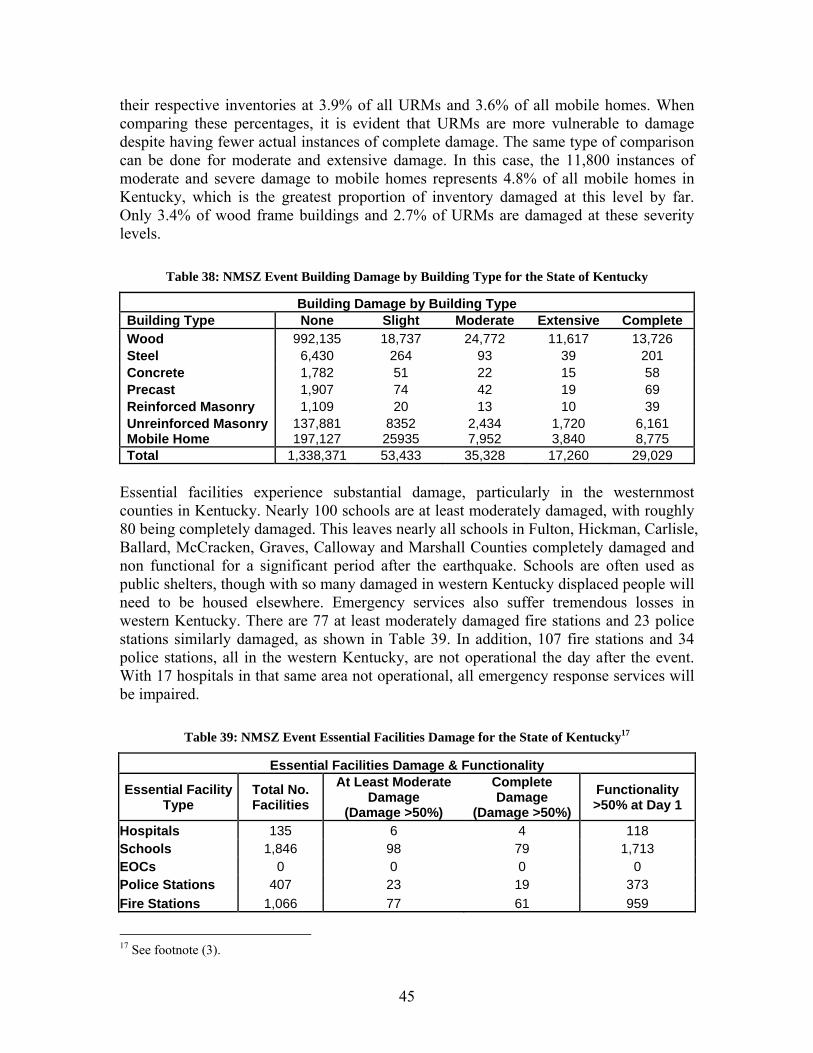
45
their respective inventories at 3.9% of all URMs and 3.6% of all mobile homes. When comparing these percentages, it is evident that URMs are more vulnerable to damage despite having fewer actual instances of complete damage. The same type of comparison can be done for moderate and extensive damage. In this case, the 11,800 instances of moderate and severe damage to mobile homes represents 4.8% of all mobile homes in Kentucky, which is the greatest proportion of inventory damaged at this level by far. Only 3.4% of wood frame buildings and 2.7% of URMs are damaged at these severity levels.
Table 38: NMSZ Event Building Damage by Building Type for the State of Kentucky
Building Damage by Building Type Building Type None Slight Moderate Extensive Complete Wood 992,135 18,737 24,772 11,617 13,726 Steel 6,430 264 93 39 201 Concrete 1,782 51 22 15 58 Precast 1,907 74 42 19 69 Reinforced Masonry 1,109 20 13 10 39 Unreinforced Masonry 137,881 8352 2,434 1,720 6,161 Mobile Home 197,127 25935 7,952 3,840 8,775 Total 1,338,371 53,433 35,328 17,260 29,029
Essential facilities experience substantial damage, particularly in the westernmost counties in Kentucky. Nearly 100 schools are at least moderately damaged, with roughly 80 being completely damaged. This leaves nearly all schools in Fulton, Hickman, Carlisle, Ballard, McCracken, Graves, Calloway and Marshall Counties completely damaged and non functional for a significant period after the earthquake. Schools are often used as public shelters, though with so many damaged in western Kentucky displaced people will need to be housed elsewhere. Emergency services also suffer tremendous losses in western Kentucky. There are 77 at least moderately damaged fire stations and 23 police stations similarly damaged, as shown in Table 39. In addition, 107 fire stations and 34 police stations, all in the western Kentucky, are not operational the day after the event. With 17 hospitals in that same area not operational, all emergency response services will be impaired.
Table 39: NMSZ Event Essential Facilities Damage for the State of Kentucky17
Essential Facilities Damage & Functionality
Essential Facility Type
Total No. Facilities
At Least Moderate Damage
(Damage >50%)
Complete Damage
(Damage >50%) Functionality >50% at Day 1
Hospitals 135 6 4 118 Schools 1,846 98 79 1,713 EOCs 0 0 0 0 Police Stations 407 23 19 373 Fire Stations 1,066 77 61 959
17 See footnote (3).

46
Transportation lifelines in the critical counties incur substantial damage and are likely to make travel within the region and access to the region from the outside difficult. There are approximately 200 damaged bridges in western Kentucky and nearly 50 of those are completely damaged, indicating they will not regain functionality for a significant period of time (see Table 40). The majority of these completely damaged bridges are in Fulton, Hickman, Carlisle, Ballard, McCracken and Graves Counties. In addition, there are 14 completely damaged port facilities, with roughly half on the Mississippi and half on the Ohio Rivers. Also, 19 airports are moderately or more severely damaged with 13 non operational immediately after the earthquake.
Table 40: NMSZ Event Highway Bridge Damage for the State of Kentucky18
Highway Bridge Damage Assessments
Total No. of Bridges
At Least Moderate Damage
(Damage >50%)
Complete Damage
(Damage >50%) Functionality >50% at Day 1
25 Critical Counties 2,173 197 46 1,974 Remaining Counties 4,632 0 0 4,630 Total State 6,805 197 46 6,604
Table 41: NMSZ Event Waste Water Facilities Damage for the State of Kentucky19
Waste Water Facilities Damage Assessments
Total No. of
Waste Water Facilities
At Least Moderate Damage
(Damage >50%) Complete Damage
(Damage >50%) Functionality >50% at Day 1
25 Critical Counties 1,561 523 81 764 Remaining Counties 7,530 0 0 7,530 Total State 9,081 523 81 8,294 In addition, numerous utility lifelines are damaged and not functioning in the critical counties. As shown in Table 41 more than 500 waste water facilities incur at least moderate damage and 81 of those facilities are completely damaged. In the days immediately after the earthquake, approximately 800 waste water facilities in the critical counties are not functioning, which will severely limit service to many residents in western Kentucky. Electric power facilities in the critical counties are also heavily damaged with 132 facilities incurring at least moderate damage and 232 of the 463 electric power facilities not operational immediately after the event. In addition, 850 communication facilities are out of service in the days after the earthquake. With such extensive functional losses in the critical counties, tens of thousands of households are without crucial services. Table 42 illustrates the numbers of households without potable water and electric power in the days and weeks after the NMSZ earthquake. The day after the event, nearly 109,000 households are without water and 77,000 are without electricity. A large portion of households regain service within the
18 See footnote (3). 19 See footnote (3).

47
first week, but there are still 67,000 households without water in the most heavily damaged areas. With such extended service losses in western Kentucky, some residents whose homes are not heavily damaged may be forced to leave due to a lack of drinking water and electricity. For more information on direct damage and functional losses in the State of Kentucky, please refer to Appendix V for detailed assessment results and to Appendix VIII for damage and functionality maps.
Table 42: NMSZ Event Utility Service Interruptions for the State of Kentucky
Utility Service Interruptions Number of Households without Service No. Households Day 1 Day 3 Day 7 Day 30 Day 90
Potable Water 108,556 92,742 66,608 38,964 0 Electric Power
1,590,647 77,263 60,273 36,450 11,464 86
Mississippi New Madrid Seismic Zone Scenario The NMSZ event on the southwest segment of the fault generates intense shaking in Mississippi’s northern counties. As a result, 25 counties are identified as critical and most of the damage incurred by the State of Mississippi is expected to occur in this set of counties. These 25 critical counties are highlighted in Figure 16 and are listed below: Alcorn Benton Bolivar Calhoun Chickasaw Coahoma Desoto
Grenada Itawamba Lafayette Lee Marshall Monroe Panola
Pontotoc Prentiss Quitman Sunflower Tallahatchie Tate Tippah
Tishomingo Tunica Union Yalobusha
Buildings in Mississippi are expected to incur moderate damage in the northern portion of the state, with limited cases of complete damage which are limited to the critical counties. There are 7,300 buildings that are estimated to incur complete damage, all of which are in the 25 critical counties. Approximately 35,000 of the 39,000 moderate and severe damage cases occur in the critical counties. Table 43 illustrates the distribution of building damage by occupancy type. Nearly all complete and moderate/severe damage is experienced by residential construction, leaving 45,000 of the one million residential structures in Mississippi damaged. As with many other NMSZ states, wood frame buildings and mobile homes are the most common structural systems. What is uncommon, however, is the small percentage of building inventory belonging to URMs. In Mississippi, approximately 5% of the total building inventory is URM construction. Nearly half of all complete damage occurs in wood frame buildings even though only 25% of moderate damage is incurred by this type of construction. Approximately 60% of all moderate damage is attributed to mobile homes, as shown in Table 44. It is also relevant to note that while steel, concrete and

48
precast (concrete) structures are a much smaller portion of the building stock in Mississippi, approximately 15% of each of these building types experiences at least moderate damage, while only 1.4% of all wood frame buildings incurs at least moderate damage.
Table 43: NMSZ Event Building Damage by Occupancy Type for the State of Mississippi
General Occupancy Type Damage General Occupancy
Type Total No. Buildings
Moderate to Severe Damage Complete Damage
Single Family 793,953 11,343 3,881 Other Residential 212,185 26,741 3,094 Commercial 8,062 705 190 Industrial 1,657 466 112 Other 1,478 127 23 Total 1,017,335 39,382 7,300
Table 44: NMSZ Event Building Damage by Building Type for the State of Mississippi
Building Damage by Building Type Building Type None Slight Moderate Extensive Complete Wood 703,568 50807 7,092 189 3,335 Steel 2,512 297 296 269 181 Concrete 906 102 84 63 30 Precast 955 104 113 78 40 Reinforced Masonry 494 39 36 21 12 Unreinforced Masonry 44,187 6104 3,553 1,531 764 Mobile Home 133,149 27429 16,731 9,326 2,938 Total 885,771 84,882 27,905 11,477 7,300
The northernmost counties in Mississippi are greatly affected by damage and functional losses to essential facilities. Over 100 schools experience at least moderate damage and over 150 are not functioning the day after the earthquake, as shown in Table 45. Nearly all of these damaged schools are located in Desoto, Tunica, Tate, Marshall and Benton Counties. Additionally, Lafayette, Union, Tippah, Alcorn, and Prentiss Counties experience substantial functional loss to schools immediately after the earthquake. There are 81 at least moderately damaged fire stations and nearly 130 not functioning the day after the earthquake. Hospitals in northwest Mississippi are not functioning as well, with 34 facilities in the critical counties along with Leflore, Montgomery, Webster, Lowndes and Oktibbeha Counties. Not only will this region be without medical care services for those injured by the earthquake, but care for current patients will likely require transport to fully functioning facilities outside the critical counties. Transportation lifelines experience damage primarily in northwestern Mississippi. Table 46 illustrates that over 70 highway bridges are damaged and 65 are not functioning the day after the earthquake. Most of these non-functioning bridges are in Desoto, Tunica, Tate and Marshall Counties. Five airports in northwest Mississippi incur at least
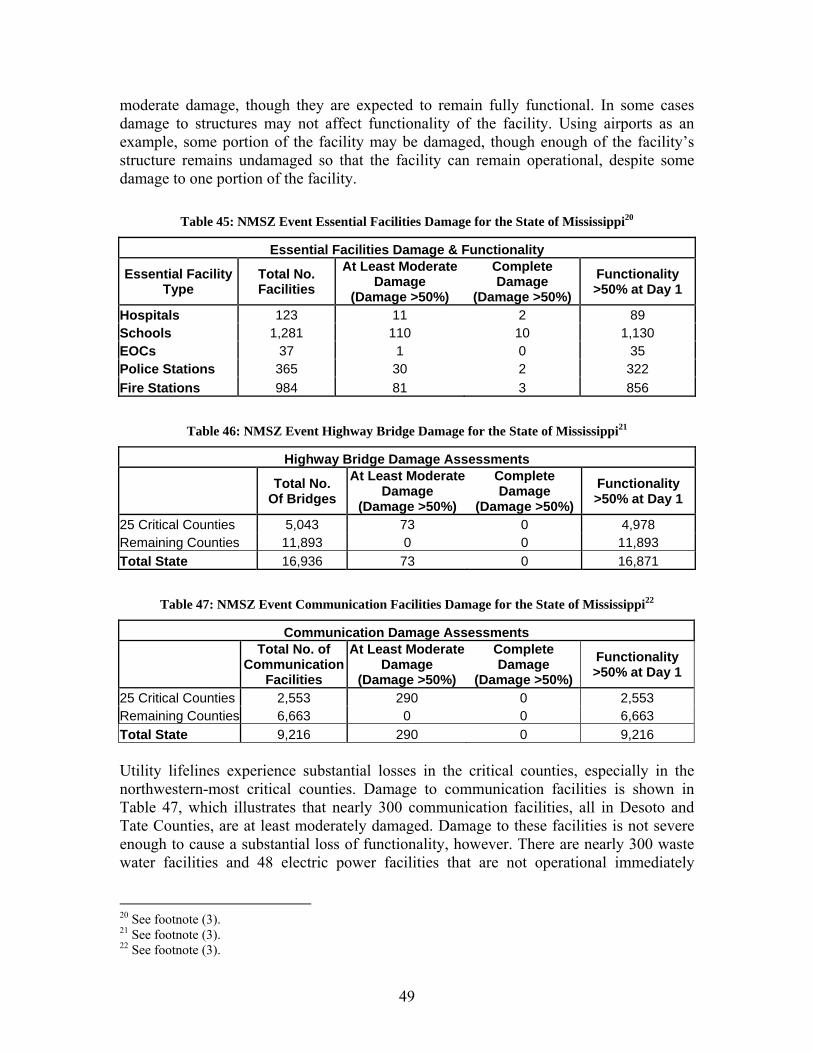
49
moderate damage, though they are expected to remain fully functional. In some cases damage to structures may not affect functionality of the facility. Using airports as an example, some portion of the facility may be damaged, though enough of the facility’s structure remains undamaged so that the facility can remain operational, despite some damage to one portion of the facility.
Table 45: NMSZ Event Essential Facilities Damage for the State of Mississippi20
Essential Facilities Damage & Functionality
Essential Facility Type
Total No. Facilities
At Least Moderate Damage
(Damage >50%)
Complete Damage
(Damage >50%) Functionality >50% at Day 1
Hospitals 123 11 2 89 Schools 1,281 110 10 1,130 EOCs 37 1 0 35 Police Stations 365 30 2 322 Fire Stations 984 81 3 856
Table 46: NMSZ Event Highway Bridge Damage for the State of Mississippi21
Highway Bridge Damage Assessments
Total No. Of Bridges
At Least Moderate Damage
(Damage >50%)
Complete Damage
(Damage >50%) Functionality >50% at Day 1
25 Critical Counties 5,043 73 0 4,978 Remaining Counties 11,893 0 0 11,893 Total State 16,936 73 0 16,871
Table 47: NMSZ Event Communication Facilities Damage for the State of Mississippi22
Communication Damage Assessments
Total No. of
Communication Facilities
At Least Moderate Damage
(Damage >50%)
Complete Damage
(Damage >50%) Functionality >50% at Day 1
25 Critical Counties 2,553 290 0 2,553 Remaining Counties 6,663 0 0 6,663 Total State 9,216 290 0 9,216 Utility lifelines experience substantial losses in the critical counties, especially in the northwestern-most critical counties. Damage to communication facilities is shown in Table 47, which illustrates that nearly 300 communication facilities, all in Desoto and Tate Counties, are at least moderately damaged. Damage to these facilities is not severe enough to cause a substantial loss of functionality, however. There are nearly 300 waste water facilities and 48 electric power facilities that are not operational immediately
20 See footnote (3). 21 See footnote (3). 22 See footnote (3).

50
following the earthquake. Most of these facilities are located in Desoto, Tate, Tunica and the surrounding counties. There are approximately one million households, or residences, in the State of Mississippi and nearly 42,000 of those are without potable water the day after the earthquake. In addition, 33,000 are without electricity. Only 2,000 households have potable water service restored after a week, though 26,000 have electricity restored in that same period of time. A lack of potable water service for an extended period of time, as shown in Table 48, may force some families to leave their homes, even if the home is not significantly damaged. For more information on direct damage and functional losses in the State of Mississippi, please refer to Appendix V for detailed assessment results and to Appendix VIII for damage and functionality maps.
Table 48: NMSZ Event Utility Service Interruptions for the State of Mississippi
Utility Service Interruptions Number of Households without Service No. Households Day 1 Day 3 Day 7 Day 30 Day 90
Potable Water 41,790 40,256 39,752 28,749 0 Electric Power
1,046,434 32,601 18,416 6,452 1,276 44
Missouri New Madrid Seismic Zone Scenario The NMSZ event on the central thrust fault produces substantial shaking in southeast Missouri. The counties that experience the most significant shaking are designated as critical counties and much of the damage incurred is anticipated to occur in that set of counties. There are a total of 45 critical counties in addition to the City of St. Louis in Missouri, which are highlighted in Figure 17 and listed below: Audrain Bollinger Boone Butler Callaway Cape Girardeau Carter Cole Crawford Dent Douglas Dunklin
Franklin Gasconade Howell Iron Jefferson Lincoln Madison Maries Miller Mississippi Montgomery New Madrid
Oregon Osage Ozark Pemiscot Perry Phelps Pike Pulaski Reynolds Ripley St. Charles Ste. Genevieve
St. Francois St. Louis St. Louis City Scott Shannon Stoddard Texas Warren Washington Wayne
The City of St. Louis is considered independently of St. Louis County. This distinction means that there are only 45 critical counties in the State of Missouri and one critical city. For the purposes of this report, however, all critical areas will be referred to as critical counties, with St. Louis City as its own county for a total of 46, rather than 45, critical counties.
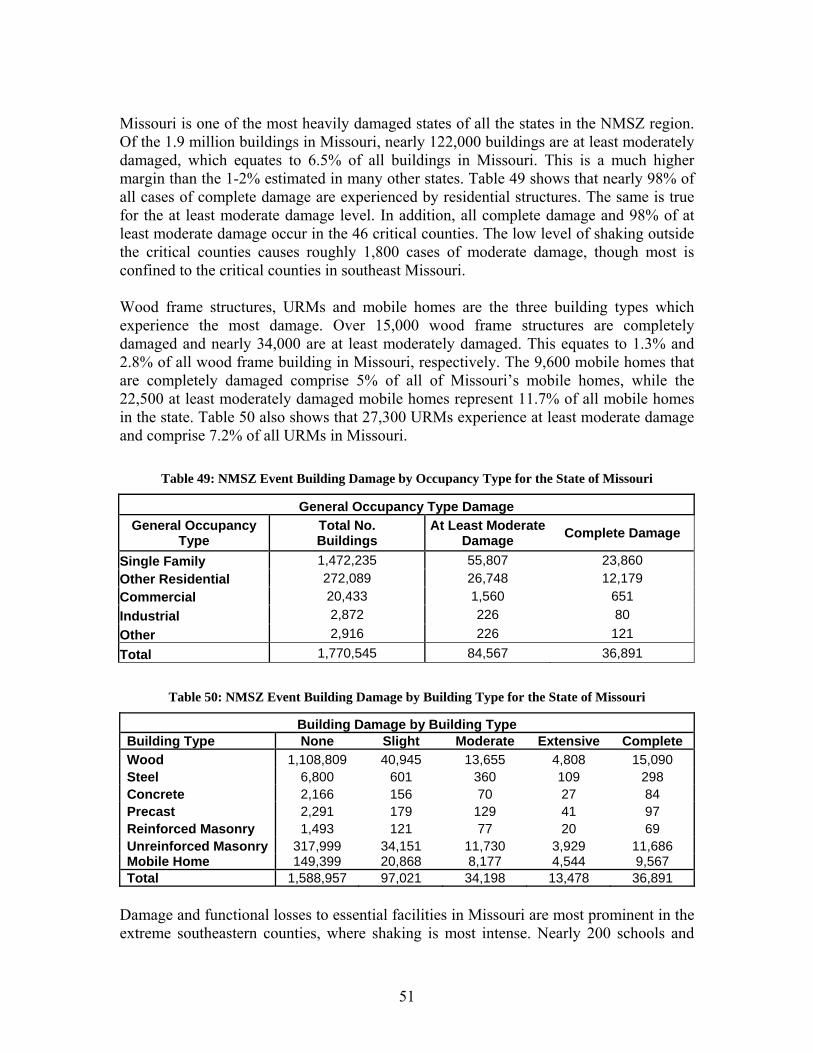
51
Missouri is one of the most heavily damaged states of all the states in the NMSZ region. Of the 1.9 million buildings in Missouri, nearly 122,000 buildings are at least moderately damaged, which equates to 6.5% of all buildings in Missouri. This is a much higher margin than the 1-2% estimated in many other states. Table 49 shows that nearly 98% of all cases of complete damage are experienced by residential structures. The same is true for the at least moderate damage level. In addition, all complete damage and 98% of at least moderate damage occur in the 46 critical counties. The low level of shaking outside the critical counties causes roughly 1,800 cases of moderate damage, though most is confined to the critical counties in southeast Missouri. Wood frame structures, URMs and mobile homes are the three building types which experience the most damage. Over 15,000 wood frame structures are completely damaged and nearly 34,000 are at least moderately damaged. This equates to 1.3% and 2.8% of all wood frame building in Missouri, respectively. The 9,600 mobile homes that are completely damaged comprise 5% of all of Missouri’s mobile homes, while the 22,500 at least moderately damaged mobile homes represent 11.7% of all mobile homes in the state. Table 50 also shows that 27,300 URMs experience at least moderate damage and comprise 7.2% of all URMs in Missouri.
Table 49: NMSZ Event Building Damage by Occupancy Type for the State of Missouri
General Occupancy Type Damage General Occupancy
Type Total No. Buildings
At Least Moderate Damage Complete Damage
Single Family 1,472,235 55,807 23,860 Other Residential 272,089 26,748 12,179 Commercial 20,433 1,560 651 Industrial 2,872 226 80 Other 2,916 226 121 Total 1,770,545 84,567 36,891
Table 50: NMSZ Event Building Damage by Building Type for the State of Missouri
Building Damage by Building Type Building Type None Slight Moderate Extensive Complete Wood 1,108,809 40,945 13,655 4,808 15,090 Steel 6,800 601 360 109 298 Concrete 2,166 156 70 27 84 Precast 2,291 179 129 41 97 Reinforced Masonry 1,493 121 77 20 69 Unreinforced Masonry 317,999 34,151 11,730 3,929 11,686 Mobile Home 149,399 20,868 8,177 4,544 9,567 Total 1,588,957 97,021 34,198 13,478 36,891
Damage and functional losses to essential facilities in Missouri are most prominent in the extreme southeastern counties, where shaking is most intense. Nearly 200 schools and

52
over 100 fire stations are at least moderately damaged. In addition, numerous facilities are completely damaged and will not be operational for an extended period of time. The day after the earthquake, 37 hospitals, nearly 300 schools, 67 police stations and 135 fire stations are not functioning. The majority of these facilities are located in Dunklin, Pemiscot, New Madrid, Butler, Stoddard, Mississippi, Ripley, Wayne and Cape Girardeau Counties, as well as the St. Louis area. Much of southeast Missouri is without local emergency response services and medical care, since a majority of the essential facilities are non-operational in the days following the earthquake. The extensive damage to transportation lifelines makes traveling within southeast Missouri incredibly difficult. As shown in Table 52, over 650 highway bridges are completely damaged and over 1,350 bridges are not operational immediately after the earthquake. Most bridges are in the counties that experience substantial, essential facilities functional losses and these counties were listed previously. Numerous railway, port and airport facilities are also damaged. This level of damage leads to 26 airports, 25 ports and 16 railway facilities out of service in the days immediately following the event. With much of this damage and functional loss occurring in southeast Missouri, not only will it be difficult to travel within this area, but it will be much harder to get relief workers and aid into the area and injured or displaced families out of the area.
Table 51: NMSZ Event Essential Facilities Damage for the State of Missouri23
Essential Facilities Damage & Functionality
Essential Facility Type
Total No. Facilities
At Least Moderate Damage
(Damage >50%)
Complete Damage
(Damage >50%) Functionality >50% at Day 1
Hospitals 160 8 3 123 Schools 2,817 185 85 2,530 EOCs 33 7 4 25 Police Stations 654 61 32 587 Fire Stations 1,399 116 48 1,264
Table 52: NMSZ Event Highway Bridge Damage for the State of Missouri24
Highway Bridge Damage Assessments
Total No. Of Bridges
At Least Moderate Damage
(Damage >50%) Complete Damage
(Damage >50%) Functionality >50% at Day 1
46 Critical Counties 7,803 1,363 659 6,447 Remaining Counties 13,962 0 0 13,962 Total State 21,765 1,363 659 20,409
23 See footnote (3). 24 See footnote (3).

53
Table 53: NMSZ Event Potable Water Facility Damage for the State of Missouri25
Potable Water Facilities Damage Assessments
Total No. of Facilities
At Least Moderate Damage
(Damage >50%) Complete Damage
(Damage >50%) Functionality >50% at Day 1
46 Critical Counties 3,413 758 48 2,756 Remaining Counties 5,186 0 0 5,186 Total State 8,599 758 48 7,942 Utility lifelines are heavily damaged as well, particularly in southeast Missouri. Table 53 illustrates the damage and functional loss of potable water facilities. Approximately 50 potable water facilities are completely damaged and over 650 facilities are not operating the day after the event. Communication facilities also incur major damage, with nearly 1,600 at least moderately damaged facilities and 865 non-functioning facilities immediately after the earthquake. In addition, over 100 electric power facilities are down and 63 natural gas facilities are not operating. Most of southeast Missouri is so heavily damaged that nearly all utility services are down in the days after the event. This massive loss of functionality in utility lifelines leads to hundreds of thousands of service interruptions, as shown in Table 54. Nearly 150,000 households are without potable water and 100,000 without electricity immediately after the earthquake. After one week, many customers will see service restored, though 80,000 households are still without water and 40,000 without electricity. Even after one month, tens of thousands of customers are without water, electricity or both. Such major lapses in service will most likely prevent people from remaining in their homes causing them to seek temporary, or even long-term, shelter at public sheltering locations. For more information on direct damage and functional losses in the State of Missouri, please refer to Appendix V for detailed assessment results and to Appendix VIII for damage and functionality maps.
Table 54: NMSZ Event Utility Service Interruptions for the State of Missouri
Utility Service Interruptions Number of Households without Service No. Households Day 1 Day 3 Day 7 Day 30 Day 90
Potable Water 146,368 115,391 79,848 77,818 38,426 Electric Power
2,194,594 100,141 70,720 39,499 12,955 121
Tennessee New Madrid Seismic Zone Scenario An event on the southwest segment of the eastern fault in the NMSZ produces significant shaking in western Tennessee. As a result, 37 critical counties in that region are identified as being are likely to incur the most damage of all counties throughout the state. These 37 critical counties are highlighted in Figure 18 and are also listed below:
25 See footnote (3).

54
Benton Carroll Cheatham Chester Crockett Davidson Decatur Dickson Dyer Fayette
Gibson Giles Hardeman Hardin Haywood Henderson Henry Hickman Houston Humphreys
Lake Lauderdale Lawrence Lewis McNairy Madison Maury Montgomery Obion Perry
Robertson Shelby Stewart Tipton Wayne Weakley Williamson
The State of Tennessee experiences the most damage of all of the states in the NMSZ region. There are nearly 82,000 completely damaged buildings and another 176,000 moderately or severely damaged buildings for a total of approximately 258,000 damaged buildings. This represents over 12% of all the buildings in the State of Tennessee and the largest percentage of damaged building stock by far, when compared to the other seven NMSZ states. As shown in Table 55, approximately 95% of complete damage occurs in residential buildings. Over 98% of all moderate and severe damage is experienced by residential buildings. It is also relevant to note that while damage to commercial structures comprises a very small portion of overall damage, the 5,300 at least moderately damaged commercial structures represent 25% of all commercial buildings in the State of Tennessee. Additionally, all complete damage occurs in the 37 critical counties and nearly 99% of moderate and severe damage occurs there as well.
Table 55: NMSZ Event Building Damage by Occupancy Type for the State of Tennessee
General Occupancy Type Damage General Occupancy
Type Total No. Buildings
Moderate to Severe Damage Complete Damage
Single Family 1,720,196 142,729 58,255 Other Residential 330,518 31,012 19,340 Commercial 20,582 1,882 3,461 Industrial 3,553 286 520 Other 2,337 170 331 Total 2,077,186 176,079 81,907
Table 56: NMSZ Event Building Damage by Building Type for the State of Tennessee
Building Damage by Building Type Building Type None Slight Moderate Extensive Complete Wood 1,255,670 180,779 112,188 19,319 34,888 Steel 6,045 222 171 353 1,610 Concrete 1,786 39 68 135 417 Precast 1,934 57 66 139 497 Reinforced Masonry 1,125 15 36 84 312 Unreinforced Masonry 138,979 7,893 7,597 11,117 29,385 Mobile Home 199,367 25,289 13,577 11,229 14,797 Total 1,604,906 214,294 133,703 42,376 81,907

55
Of the 2.1 million buildings in the State of Tennessee, 1.6 million, or 77%, are of wood frame construction. Mobile homes and URMs comprise 13% and 9%, respectively. The city of Memphis, TN, is a major urban center in the Central U.S., and includes many unreinforced masonry buildings. Memphis, TN, is near the course of seismic activity and is heavily damaged as a result. Many URMs in Memphis are damaged and contribute to the large number of URM damage cases. Approximately 25% of all URMs in the State of Tennessee are at least moderately damaged, while only 14% of mobile homes and 10% of wood frame buildings reach that same damage state. Nearly 50,000 URMs, 167,000 wood frame buildings and 37,000 mobile homes are at least moderately damaged in Tennessee, as shown in Table 56. This is the most building damage experienced by any state in the NMSZ region. Damage and functional losses to essential facilities substantially impact the ability to provide emergency services immediately after the earthquake. Table 57 shows that eight hospitals are completely damaged by the NMSZ event and nearly 50 are not operational the day after the earthquake. Of the 2,309 schools in Tennessee, 635 are not functioning the day after the earthquake and all are located in the critical counties. A total of nearly 300 fire stations and 150 police stations are also not operational. These massive functional losses indicate that nearly all essential facilities in Shelby, Tipton, Lauderdale, Dyer, Lake, Obion, Fayette, Haywood, Crockett, Gibson, Weakley, Hardeman, Madison, McNairy, Chester, Henderson, Carroll, Henry, Hardin, Decatur, and Benton Counties are not functioning. These 21 counties comprise the entire western portion of Tennessee, indicating that a large portion of the state will be without emergency services and medical care immediately after the earthquake.
Table 57: NMSZ Event Essential Facilities Damage for the State of Tennessee26
Essential Facilities Damage & Functionality
Essential Facility Type
Total No. Facilities
At Least Moderate Damage
(Damage >50%)
Complete Damage
(Damage >50%) Functionality >50% at Day 1
Hospitals 180 43 8 132 Schools 2,309 602 404 1,674 EOCs 0 0 0 0 Police Stations 423 124 78 289 Fire Stations 1,110 256 117 815 Transportation lifelines are also severely impacted by a NMSZ event and limit mobility into and out of western Tennessee in the aftermath of the earthquake. Nearly 900 bridges are at least moderately damaged, 330 completely damaged, and over 875 not functioning in the critical counties. Even if roads are passable, bridges are estimated to be damaged and will prevent displaced residents from leaving and response teams from entering western Tennessee. Railway facilities are also damaged, with 54 facilities experiencing at least moderate damage and over 50 not functioning the day after the event. Furthermore, 71 ports and 37 airports are non-operational immediately after the earthquake. The
26 See footnote (3).

56
majority of these facilities are in Shelby, Tipton, Lauderdale, Dyer, Haywood, Crockett, Obion, Weakley and Gibson Counties in western Tennessee.
Table 58: NMSZ Event Highway Bridge Damage for the State of Tennessee27
Highway Bridge Damage Assessments
Total No. Of Bridges
At Least Moderate Damage
(Damage >50%)
Complete Damage
(Damage >50%) Functionality >50% at Day 1
37 Critical Counties 3,815 877 330 2,937 Remaining Counties 3,400 1 0 3,400 Total State 7,215 878 330 6,337 The intense shaking from the southwest segment rupture affects the performance of utility lifelines significantly. Communication facilities, as illustrated in Table 59, indicate that nearly 3,500 structures are at least moderately damaged and nearly 2,000 are not functioning the day after the earthquake. With so many communication facilities down, it will be difficult to coordinate response efforts and determine which areas are heavily damaged and in need of assistance. Of the 153 electric power facilities in the 37 critical counties, 92 are not functioning the day after the earthquake. Half the oil facilities in the critical counties are shut down at day 1 (32 of 65) and nearly 500 of the 750 waste water facilities in the critical counties are not operating. This indicates that nearly all utility services in western Tennessee are moderately to substantially reduced for the first few days after the earthquake. The lack of utility service is evident in Table 60. Of the 2.2 million households in the State of Tennessee, nearly 450,000 are without potable water the day after the event. This equates to approximately 20% of all households in the State of Tennessee. Over 425,000 households are without power at this time as well. After one week, nearly 300,000 households will have their electricity restored though more than 400,000 households, all in western Tennessee, are still without water. With more than 350,000 households without potable water for a month or more, many will leave their homes and many may seek public shelter. For more information on direct damage and functional losses in the State of Tennessee, please refer to Appendix V for detailed assessment results and to Appendix VIII for damage and functionality maps.
27 See footnote (3).

57
Table 59: NMSZ Event Communication Facilities Damage for the State of Tennessee28
Communication Damage Assessments
Total No. of
Communication Facilities
At Least Moderate Damage
(Damage >50%) Complete Damage
(Damage >50%) Functionality >50% at Day 1
37 Critical Counties 6,969 3,468 48 5,018 Remaining Counties 9,161 0 0 9,161 Total State 16,130 3,468 48 14,179
Table 60: NMSZ Event Utility Service Interruptions for the State of Tennessee
Utility Service Interruptions Number of Households without Service No. Households Day 1 Day 3 Day 7 Day 30 Day 90
Potable Water 446,891 433,647 408,112 360,553 164,750 Electric Power
2,232,905 426,573 296,249 146,276 37,717 508
Regional Direct Damage & Functionality Each of the ten earthquake impact assessments completed in this investigation is based on a different scenario event. Eight scenarios employ a NMSZ hazard event, one employs a WVSZ hazard event and the last scenario utilizes an ETSZ hazard event. Since each scenario is based on a different hazard, it is unrealistic to add damage estimates together for a regional damage total. Even the NMSZ scenarios employ events on differing fault segments and fault lines, meaning east or west fault lines in the New Madrid Seismic Zone. Though damage and functionality estimates should not be added for a region, total general observations of regional impacts can be made. Building damage in all states, for all scenarios, indicate that residential buildings incur more damage than any other building use group/occupancy. In addition, wood frame structures are the most prevalent building type in the NMSZ and comprise a large portion of all building damage. Unreinforced masonry buildings comprise a much smaller portion of the regional building inventory, though damage estimates show a much higher percentage of these structures are damaged from moderate and severe shaking. The Tennessee earthquake impact assessment alone shows nearly 50,000 at least moderately damaged URMs, so it is reasonable to suggest that over 100,000 URMs could be damaged from a rupture of the southwest extension and several hundred thousand URMs could be damaged in the eight states if successive ruptures of the three segments occur, as in the 1811-1812 series of earthquakes. Estimates of transportation damage and functionality indicate that counties nearest the source of seismic activity are heavily damaged and do not function in the days and weeks after the earthquake. Several hundred highway bridges near the source of seismic activity will make travel in counties near the source fault very difficult. Many airports and ports
28 See footnote (3).

58
will not be operational making it more difficult to get supplies and rescue teams into the most heavily damaged areas. Utility lifelines show substantial damage, particularly to communication facilities. The improved communication facilities inventories for each state include thousands or tens of thousands of facilities in some states. The rupture of a single segment could damage 10,000 communication facilities, some of which service cell phones, severely reducing communication capabilities, even wireless communication. Electric power facilities also show hundreds of cases of damage and exhibit severely reduced functionality in the critical counties near the fault segments. The same is true of waste water facilities, as they have reduced functionality in the critical counties. Reduced functionality and extensive pipeline damage near the faults leads to hundreds of thousands of households with potable water and electricity immediately after the event. With nearly 450,000 households without potable water in Tennessee alone, a southwest segment event could cut off service for 750,000 households, or more, immediately after the event. Similar estimates of service outages for electricity may occur as well.
Comparison with Other Published Studies There are few earthquake impact assessments to compare with as the NMSZ is a largely unstudied region. In recent years, however, at least one regionally comprehensive impact assessment has been completed. The Central U.S. Earthquake Consortium (CUSEC) completed scenarios29 for each NMSZ state using the southwest segment ground motion produced by the USGS, referred to earlier in this report. The following discussion compares the results of this study with the results obtained by CUSEC. Each study utilized various impact assessment parameters, including the location of the rupture within the fault boundaries, liquefaction susceptibility, and seismic design level, among others. Many damage estimates are based on the HAZUS-MH MR2 methodology of averaging damage at the county level, though there are other methods of determining damage. Another common method of identifying levels of damage is highlighted in Appendix V and is compared with the method of averaging damage at the county level. Finally, all CUSEC analyses included only a portion of the counties in the state scenarios. The counties identified in this study as critical counties correspond to the counties in the CUSEC study. As a result all comparisons in this section are for the critical counties only. The State of Tennessee shows some of the greatest damage estimates of all the states in this investigation. Herein, nearly 82,000 buildings are expected to be completely damaged, though the CUSEC study predicts over 115,000 buildings in that same damage state. Estimates from CUSEC indicate that 67,000 buildings are moderately damaged while this investigation predicts over 131,000 moderately damaged buildings. This difference is likely due to the different liquefaction susceptibility maps used in each study. The CUSEC study utilized a liquefaction map with very high susceptibilities in Tennessee, leading to thousands more completely damaged buildings, as opposed to the 29 The study completed by CUSEC is also known as the SONS 07 study due to the conference where it was first presented.
59
less severe liquefaction susceptibility in this study that leads to fewer completely damaged buildings and more moderately damaged buildings. Utility lifelines frequently exhibit more damage and greatest services losses in the CUSEC study than in this study. The day after the earthquake, CUSEC estimates that nearly 534,000 households are without potable water while this investigation shows 446,000 without water. In addition, the CUSEC study reports more damaged facilities than this study. Again, this is likely due to the difference in liquefaction susceptibility data used. The State of Missouri, which utilized the central extension event in this investigation, reports much greater damage estimates than the CUSEC study. This investigation shows over 83,000 at least moderately damaged buildings while CUSEC predicts nearly 53,000 buildings. Utility lifelines also show substantially greater damage in this investigation with over 20,000 potable water pipeline breaks, while CUSEC reports only 17,000 breaks. Over 100,000 households are expected to be without power the day after the earthquake in this investigation, while CUSEC shows only 40,000 households without power at the same post-earthquake time period. The northernmost states in the NMSZ experience substantially more damage and service loss in this investigation, where the closest fault rupture is used in the impact assessments. In the State of Illinois, roughly 17,000 buildings are expected to incur complete damage based on the results of this investigation. The CUSEC study reports only 4,300 cases of complete damage. In addition, CUSEC reports nearly 16,000 at least moderately damaged buildings, which is far less than the 43,000 estimated in this study. This is due to the different scenario events employed in each investigation. Waste water facilities damage is not only impacted by the scenario event, but also by the vastly improved inventory. Of the 2,221 waste water facilities in the State of Illinois, over 640 are at least moderately damaged, according to this study. In contrast, the CUSEC study shows only 300 waste water facilities in Illinois and of those only 18 incur at least moderate damage. In addition, a study was completed for the Illinois Emergency Management Agency (IEMA) for a major NMSZ event in the State of Illinois. Different ground shaking was used in this scenario, generating different results from those presented in this report. The IEMA Study shows that approximately 19,000 buildings are completely damaged, with roughly 75,000 buildings experiencing at least moderate damage. Conversely, this report shows nearly 17,000 completely damaged buildings and roughly 30,000 at least moderately damaged buildings. This difference is likely due to the difference in ground shaking and liquefaction susceptibility used in the IEMA study. This reports shows over 250 non-operational schools, while the IEMA study shows more than 320 non-operational schools the day after the earthquake. Conversely, this report indicates more highway bridge damage than the IEMA study. This report estimates over 250 at least moderately damaged bridges, even though the IEMA study shows only 150 in that same damage state. Finally, utility damage estimates differ greatly for some inventory items. This vast difference is likely due to the increased number of facilities in this study which are not present in the IEMA study. The IEMA study includes 153 electric power facilities

60
and 518 communication facilities of which three and 17 facilities experience at least moderate damage, respectively. This report includes nearly 2,200 electric power facilities and nearly 35,000 communication facilities and those facilities experience roughly 60 and 1,450 cases of at least moderate damage, respectively. The IEMA study and this report show different results, though both represent plausible earthquakes and corresponding damage to the State of Illinois. For more information on the IEMA study, please refer to Mid-America Earthquake Center (2007). There are numerous parameters that affect the results of earthquake impact assessments, and as a result input variables must be carefully and accurately determined to obtain the best possible results. For more information on the comparison of this study with the CUSEC study, please refer to Appendix IX.
Social Impact and Direct Economic Loss This section provides social impacts and direct economic losses for the ten scenarios completed in this phase of the New Madrid Seismic Zone Catastrophic Event Planning project. Induced damage is also included in this section and is quantified by various types of debris resulting from infrastructure damage. Social impacts include displaced residents, temporary shelter population, various food, medical and housing requirements for sheltered populations and casualties. Lastly, direct economic losses include estimates of building, transportation and utility losses plus building loss ratios. As with the earthquake impact assessment results, social impact and economic losses are presented by scenario. At the conclusion of this section is a series of maps illustrating building loss ratios for each scenario. For more information on social impacts and economic losses, please refer to Appendix VI.
State-Level Social Impact & Economic Loss
Alabama New Madrid Seismic Zone Scenario Damage to infrastructure generates 112,000 tons of debris, which is the only form of induced damage provided in this investigation. Debris estimates are divided into two categories: steel and concrete debris and wood, masonry and building contents. This differentiation of debris is based on the type of equipment required to clear the debris. Steel and concrete require heavy lifting equipment while wood, bricks and building contents require much lighter and smaller equipment. The NMSZ scenario in Alabama generates 25,000 tons of steel and concrete debris while the remaining 87,000 tons is attributed to wood, bricks and building contents. There are very few people displaced by the NMSZ event in the southwest segment. Table 61 details both displaced and shelter-seeking populations. Of the 4.4 million people in Alabama only 27 are displaced with the majority of those people residing in the 12 critical counties. Only five people seek temporary shelter and it requires 2,400 square feet

61
of space to house these people with 300 square feet reserved for sleeping. This sheltered population also requires beds, meals and water while they are in the temporary shelter. It is also estimated that there will be 17 cases of chronic health conditions within the displaced population. More detailed estimates of these needs are detailed in Appendix VI.
Table 61: NMSZ Event Shelter Requirements for the State of Alabama
Displaced and Shelter Seeking Population
Total Population Displaced Population
Shelter Seeking Population
12 Critical Counties 624, 368 24 5 Remaining Counties 3,822,732 3 0 Total State 4,447,100 27 5
Table 62: NMSZ Event Casualties for the State of Alabama
Worst Case Casualties (5:00 PM)
Severity Level Level 1 (Green)
Level 2 (Yellow)
Level 3 (Red)
Level 4 (Black) Total
12 Critical Counties 29 3 1 0 32 Other Remaining Counties 39 6 8 2 56 Total State 68 9 9 2 88
Numerous casualties occur due to this event, though most are minor injuries. Of the 88 total casualties, 68 are minor injuries not requiring hospitalization. Two fatalities are expected and these do not occur in the critical counties. Of the three times of day considered in the social impact assessment, an event at 5:00 PM generates the greatest number of casualties, as shown in Table 62. Direct economic losses are determined for buildings, transportation lifelines and utility lifelines. Utility losses account for over 50% of all direct economic loses. Table 63 illustrates that building losses and transportation losses contribute less, with 38% and 9%, respectively. Total direct economic losses are approximately $1 billion which is roughly 0.2% of all assets in the State of Alabama. Additionally, building loss ratios for the State of Alabama shown in Figure 19 at the conclusion of this section illustrate loss ratios for the NMSZ scenario. Ratios are less than 5% of total assets in any given census tract and are spread randomly across the state. This is likely due to the low levels of ground shaking and minor damage that is possible throughout the state. For more information on social impacts and economic losses for this scenario, please refer to Appendix VI.
Table 63: NMSZ Event Total Direct Economic Loss for the State of Alabama
Total Direct Economic Losses System Inventory Value Total Direct Economic Loss Buildings $269,580,000,000 $403,930,000 Transportation $108,231,000,000 $95,700,000 Utility $182,908,800,000 $568,770,000 Total $559,819,800,000 $1,068,400,000

62
Alabama East Tennessee Seismic Zone Scenario The ETSZ scenario generates 146,000 tons of debris in the State of Alabama. The majority of the debris, 85,000 tons, is comprised of brick, wood and building contents. The remaining 61,000 tons of debris is attributed to concrete and steel. The higher levels of shaking from the ETSZ event result in far more displaced people than the NMSZ scenario. All 1,625 displaced people reside in the 13 critical counties in eastern Alabama. Roughly 450 people will seek temporary shelter, as shown in Table 64. Over 200,000 square feet of space are required to house the shelter-seeking population and nearly 6,200 meals ready to eat (MREs) are needed to feed the sheltered population in the first week after the event.
Table 64: ETSZ Event Shelter Requirements for the State of Alabama
Displaced and Shelter Seeking Population
Total Population Displaced Population
Shelter Seeking Population
13 Critical Counties 1,751,879 1,625 440 Remaining Counties 2,695,221 0 0 Total State 4,447,100 1,625 440 Casualty estimates show that an event at 2:00 AM generates the most casualties. Table 65 shows that a total of 193 casualties are expected from the ETSZ event. All but one casualty occurs in the critical counties, with 80% of all casualties being minor injuries. Four fatalities are expected from this event as well as three serious injuries requiring immediate medical attention. The ETSZ scenario generates more than twice as many casualties as the NMSZ scenario.
Table 65: ETSZ Event Casualties for the State of Alabama
Worst Case Casualties (2:00 AM)
Severity Level Level 1 (Green)
Level 2 (Yellow)
Level 3 (Red)
Level 4 (Black) Total
13 Critical Counties 153 32 3 4 192 Other Remaining Counties 1 0 0 0 1 Total State 154 32 3 4 193
The ETSZ shows much fewer economic losses than the NMSZ event. In this scenario, buildings represent the largest portion of the total direct economic losses, at nearly 60% of all losses. Utilities show a much lower percentage at 36%, with transportation losses making up the remainder. Direct economic losses total nearly $700 million, as shown in Table 66. Building loss ratios are illustrated in Figure 20 at the conclusion of this section. The maximum loss ratio occurs near the epicenter and it is less than 10% of all building value in that area. For more information on social impacts and economic losses for this scenario, please refer to Appendix VI.
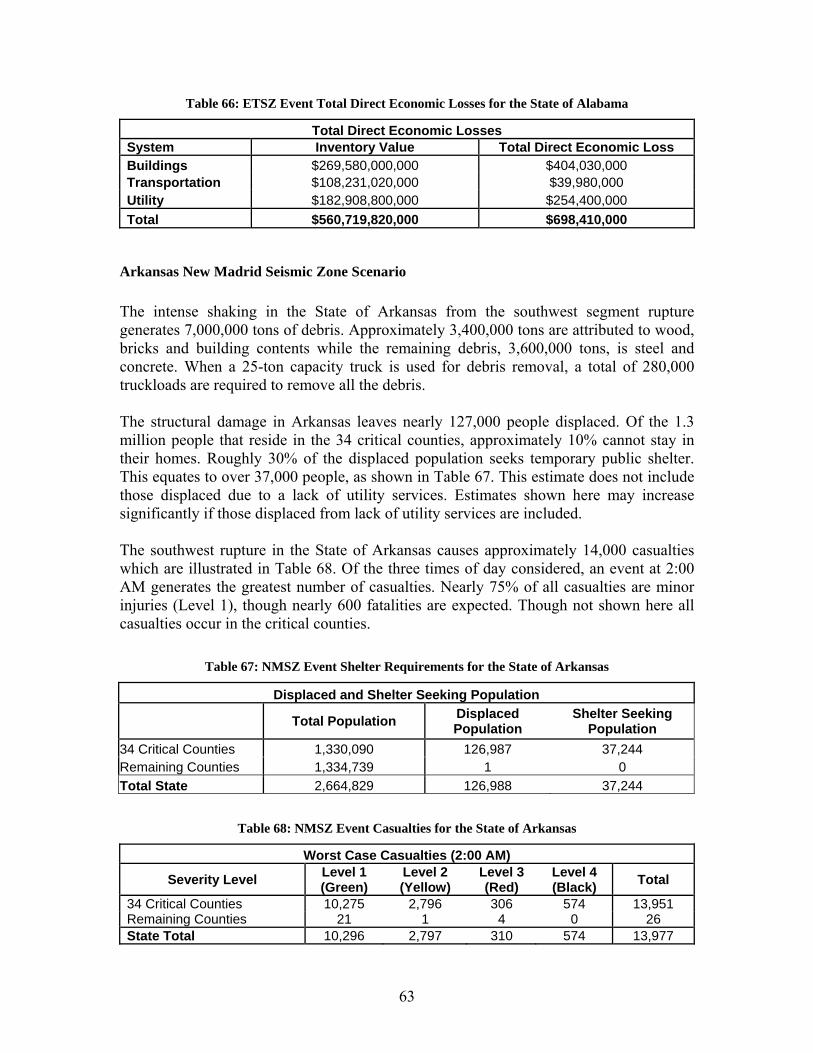
63
Table 66: ETSZ Event Total Direct Economic Losses for the State of Alabama
Total Direct Economic Losses System Inventory Value Total Direct Economic Loss Buildings $269,580,000,000 $404,030,000 Transportation $108,231,020,000 $39,980,000 Utility $182,908,800,000 $254,400,000 Total $560,719,820,000 $698,410,000
Arkansas New Madrid Seismic Zone Scenario The intense shaking in the State of Arkansas from the southwest segment rupture generates 7,000,000 tons of debris. Approximately 3,400,000 tons are attributed to wood, bricks and building contents while the remaining debris, 3,600,000 tons, is steel and concrete. When a 25-ton capacity truck is used for debris removal, a total of 280,000 truckloads are required to remove all the debris. The structural damage in Arkansas leaves nearly 127,000 people displaced. Of the 1.3 million people that reside in the 34 critical counties, approximately 10% cannot stay in their homes. Roughly 30% of the displaced population seeks temporary public shelter. This equates to over 37,000 people, as shown in Table 67. This estimate does not include those displaced due to a lack of utility services. Estimates shown here may increase significantly if those displaced from lack of utility services are included. The southwest rupture in the State of Arkansas causes approximately 14,000 casualties which are illustrated in Table 68. Of the three times of day considered, an event at 2:00 AM generates the greatest number of casualties. Nearly 75% of all casualties are minor injuries (Level 1), though nearly 600 fatalities are expected. Though not shown here all casualties occur in the critical counties.
Table 67: NMSZ Event Shelter Requirements for the State of Arkansas
Displaced and Shelter Seeking Population
Total Population Displaced Population
Shelter Seeking Population
34 Critical Counties 1,330,090 126,987 37,244 Remaining Counties 1,334,739 1 0 Total State 2,664,829 126,988 37,244
Table 68: NMSZ Event Casualties for the State of Arkansas
Worst Case Casualties (2:00 AM)
Severity Level Level 1 (Green)
Level 2 (Yellow)
Level 3 (Red)
Level 4 (Black) Total
34 Critical Counties 10,275 2,796 306 574 13,951 Remaining Counties 21 1 4 0 26 State Total 10,296 2,797 310 574 13,977

64
Direct economic losses for the State of Arkansas total approximately $19 billion. Table 69 shows the distribution of economic losses by major inventory group. Regional buildings account for the majority of losses at $12.6 billion in building losses. This is approximately two-thirds of all direct economic losses. Utility and transportation losses comprise the remaining losses, representing roughly 20% and 10% of the total loss, respectively. Additionally, building loss ratios are shown in Figure 21 for the State of Arkansas. The greatest loss ratios are between 50% and 83% of total building assets lost, and this occurs in portions of Mississippi, Poinsett, Craighead and Crittenden Counties. Many other counties in northeast Arkansas also experience significant loss ratios of between 25% and 50%. Loss ratios throughout the remainder of the state are typically less than 10%, which is far less severe than the counties nearest the rupture zone. For more information on social impacts and economic losses for this scenario, please refer to Appendix VI.
Table 69: NMSZ Event Total Direct Economic Losses for the State of Arkansas
Total Direct Economic Losses System Inventory Value Total Direct Economic Loss Buildings $157,602,000,000 $12,597,230,000 Transportation $67,940,310,000 $2,154,660,000 Utility $47,658,900,000 $4,126,730,000 Total $273,201,210,000 $18,878,620,000
Illinois New Madrid Seismic Zone Scenario The damage incurred by buildings in the State of Illinois generates roughly 2,570,000 tons of debris. Bricks, wood and building contents account for 1,400,000 tons while the remaining 1,170,000 tons is attributed to steel and concrete. It requires approximately 103,000 truckloads using 25-ton capacity trucks to remove all the debris generated by this event.
Table 70: NMSZ Event Shelter Requirements for the State of Illinois
Displaced and Shelter Seeking Population
Total Population Displaced Population
Shelter Seeking Population
40 Critical Counties 1,347,307 51,426 14,716 Remaining Counties 11,071,996 43 10 Total State 12,419,293 51,469 14,726 The extensive damage to buildings in southern Illinois displaces tens of thousands of people, as shown in Table 70. Nearly 51,500 people are displaced with most residing in the critical counties. Approximately 15,000 people seek temporary shelter, and the remainder of the displaced population likely seeks shelter with family or friends outside the region that is critically impacted. Over seven million square feet of space is required
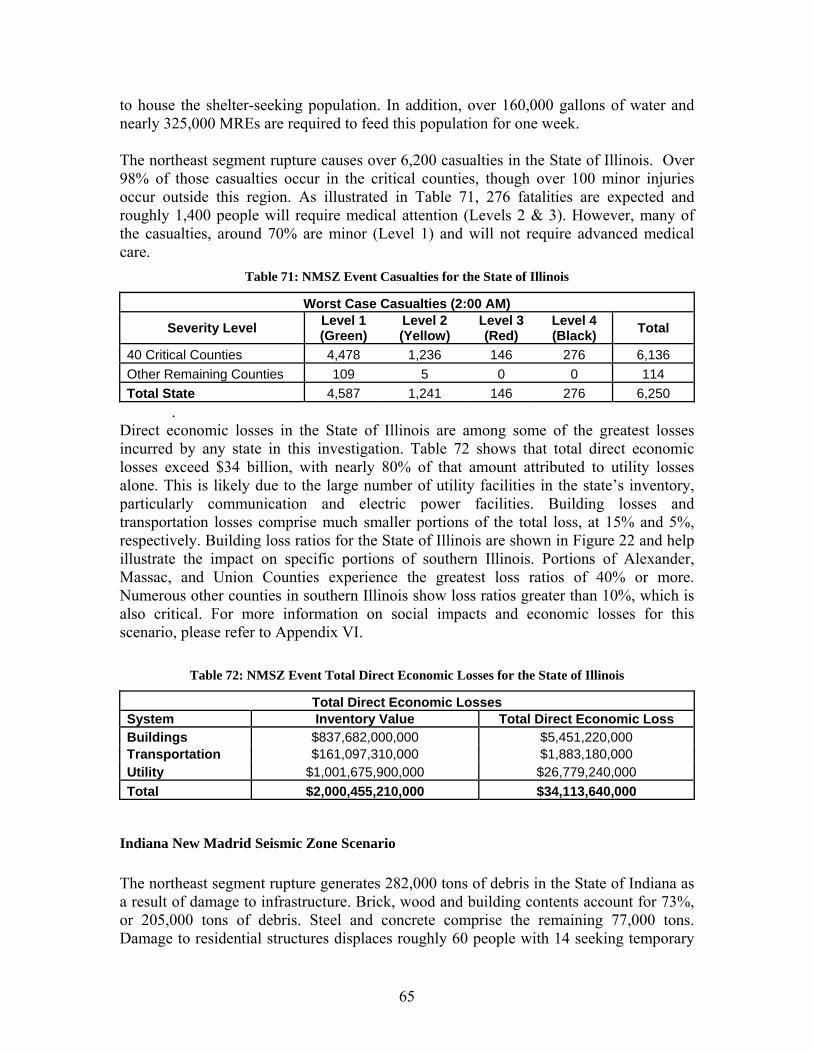
65
to house the shelter-seeking population. In addition, over 160,000 gallons of water and nearly 325,000 MREs are required to feed this population for one week. The northeast segment rupture causes over 6,200 casualties in the State of Illinois. Over 98% of those casualties occur in the critical counties, though over 100 minor injuries occur outside this region. As illustrated in Table 71, 276 fatalities are expected and roughly 1,400 people will require medical attention (Levels 2 & 3). However, many of the casualties, around 70% are minor (Level 1) and will not require advanced medical care.
Table 71: NMSZ Event Casualties for the State of Illinois
Worst Case Casualties (2:00 AM)
Severity Level Level 1 (Green)
Level 2 (Yellow)
Level 3 (Red)
Level 4 (Black) Total
40 Critical Counties 4,478 1,236 146 276 6,136 Other Remaining Counties 109 5 0 0 114 Total State 4,587 1,241 146 276 6,250
. Direct economic losses in the State of Illinois are among some of the greatest losses incurred by any state in this investigation. Table 72 shows that total direct economic losses exceed $34 billion, with nearly 80% of that amount attributed to utility losses alone. This is likely due to the large number of utility facilities in the state’s inventory, particularly communication and electric power facilities. Building losses and transportation losses comprise much smaller portions of the total loss, at 15% and 5%, respectively. Building loss ratios for the State of Illinois are shown in Figure 22 and help illustrate the impact on specific portions of southern Illinois. Portions of Alexander, Massac, and Union Counties experience the greatest loss ratios of 40% or more. Numerous other counties in southern Illinois show loss ratios greater than 10%, which is also critical. For more information on social impacts and economic losses for this scenario, please refer to Appendix VI.
Table 72: NMSZ Event Total Direct Economic Losses for the State of Illinois
Total Direct Economic Losses System Inventory Value Total Direct Economic Loss Buildings $837,682,000,000 $5,451,220,000 Transportation $161,097,310,000 $1,883,180,000 Utility $1,001,675,900,000 $26,779,240,000 Total $2,000,455,210,000 $34,113,640,000
Indiana New Madrid Seismic Zone Scenario The northeast segment rupture generates 282,000 tons of debris in the State of Indiana as a result of damage to infrastructure. Brick, wood and building contents account for 73%, or 205,000 tons of debris. Steel and concrete comprise the remaining 77,000 tons. Damage to residential structures displaces roughly 60 people with 14 seeking temporary

66
public shelter. Table 73 shows that most of the displaced individuals reside in the critical counties. The same pertains to the majority of the shelter-seeking population. Of the three times of day considered in the analysis of casualties, an event at 5PM generates the greatest number of casualties. Table 74 illustrates the various types of casualties expected and it is evident most of the injuries, approximately 75%, are minor (Level 1) casualties. Only three fatalities (Level 4) are expected. Additionally, less than 60% of all casualties are expected to occur within the 11 critical counties, indicating that shaking and damage are not confined to this portion of southwestern Indiana.
Table 73: NMSZ Event Shelter Requirements for the State of Indiana
Displaced and Shelter Seeking Population
Total Population Displaced Population
Shelter Seeking Population
11 Critical Counties 480,752 52 13 Remaining Counties 5,599,733 6 1 Total State 6,080,485 58 14
Table 74: NMSZ Event Casualties for the State of Indiana
Worst Case Casualties (5:00 PM)
Severity Level Level 1 (Green)
Level 2 (Yellow)
Level 3 (Red)
Level 4 (Black) Total
11 Critical Counties 57 12 12 2 83 Other Remaining Counties 53 4 4 1 62 Total State 110 16 16 3 145
Direct economic losses for the State of Indiana are minor in comparison with the total value of inventory in state. Approximately $1.4 billion is lost as the result of damage to buildings, transportation and utility systems. This is roughly 0.2% of the total value of assets in Indiana. Table 75 shows that buildings and utility systems contribute roughly the same value of loss, while transportation lifelines account for far less. Additionally, building loss ratios for the NMSZ scenario in Indiana are illustrated in Figure 23. All loss ratios are less than 2% and are very small in comparison with other loss ratios near the source of rupture. For more information on social impacts and economic losses for this scenario, please refer to Appendix VI.
Table 75: NMSZ Event Total Direct Economic Losses for the State of Indiana
Total Direct Economic Losses System Inventory Value Total Direct Economic Loss Buildings $380,969,000,000 $612,750,000 Transportation $107,793,100,000 $158,100,000 Utility $142,908,890,000 $647,880,000 Total $631,670,990,000 $1,418,730,000

67
Indiana Wabash Valley Seismic Zone Scenario The WVSZ event in the State of Indiana generates approximately 1.8 million tons of debris as a result of structural damage. Nearly 830,000 tons of debris is attributed to bricks, wood and other building contents. The remaining 930,000 tons of debris are comprised of steel and concrete. A total of 70,000 truckloads are required to remove all the debris when a 25-ton truck is used. The more intense shaking in southwestern Indiana due to the WVSZ event displaces far more people than the NMSZ event. As shown in Table 76, nearly 28,000 people are displaced with a majority of those people residing in the critical counties. Approximately 7,000 people that are displaced will seek temporary public shelter. Nearly 3.4 million square feet of space is required to house this shelter-seeking population. In addition, 98,000 MREs and 246,000 gallons of water are required to feed this population.
Table 76: WVSZ Event Shelter Requirements for the State of Indiana
Displaced and Shelter Seeking Population
Total Population Displaced Population
Shelter Seeking Population
11 Critical Counties 480,752 26,721 6,815 Remaining Counties 5,599,733 899 212 Total State 6,080,485 27,620 7,027
Table 77: WVSZ Event Casualties for the State of Indiana
Worst Case Casualties (2:00 AM)
Severity Level Level 1 (Green)
Level 2 (Yellow)
Level 3 (Red)
Level 4 (Black) Total
11 Critical Counties 2,012 572 64 118 2,766 Other Remaining Counties 193 24 1 3 221 Total State 2,205 596 65 121 2,987
Casualty estimates are also greater with this WVSZ scenario than with the NMSZ scenario. This difference is attributed to the higher level of damage to buildings― particularly residential buildings. The greatest number of casualties occurs at 2:00 AM as shown in Table 77. Nearly 3,000 casualties are expected, with over 2,200 being minor injuries. Approximately 120 fatalities are expected as well. This equates to roughly 4% of all casualties. Nearly all casualties occur in the 11 critical counties, with only 7% occurring outside that region. Total direct economic losses for the State of Indiana illustrate the greater economic impact of the WVSZ event. Direct economic losses total roughly $7.2 billion, with $3.9 billion attributed to building losses, as shown in Table 78. Utility and transportation losses comprise the remainder with 40% and 5% of total losses, respectively. In addition, loss ratios for the WVSZ in the State of Indiana are illustrated in Figure 24. Building loss ratios compare the value of building assets lost to that total value of buildings in a

68
specified region and are excellent indicators for the effort required to rebuild an area. The greatest loss ratios, between 15% and 27%, occur in Gibson and Knox Counties. The majority of Indiana, however, shows relatively low loss ratios, less than 2%. For more information on social impacts and economic losses for this scenario, please refer to Appendix VI.
Table 78: WVSZ Event Total Direct Economic Losses for the State of Indiana
Total Direct Economic Losses System Inventory Value Total Direct Economic Loss Buildings $380,969,000,000 $3,927,530,000 Transportation $107,793,100,000 $385,100,000 Utility $142,908,890,000 $2,936,550,000 Total $631,670,990,000 $7,249,180,000
Kentucky New Madrid Seismic Zone Scenario The thousands of damaged buildings in the State of Kentucky, particularly western Kentucky, generate a substantial amount of debris. A total of 4,000,000 tons of debris is produced with 2,100,000 tons attributed to steel and concrete. Brick, wood and building contents comprise the remaining 1,900,000 tons. Approximately 160,000 truckloads are required to remove the entirety of debris when a 25-ton truck is used. The extensive damage to the critical counties leaves tens of thousands displaced, with thousands more displaced outside this region. Nearly 53,000, or over 65% of all displaced people, reside in the critical counties with another 25,000 displaced in central Kentucky. These estimates indicate that 2% of the entire population is displaced, though when considering the critical counties only, more than 8% of the population is displaced, which is a far more significant portion. Table 79 shows the distribution of the shelter-seeking population in and out of the 25 critical counties. Approximately 20,700 people seek public shelter and roughly 13,900 are in the critical counties alone. Nearly ten million square feet of space are required to house the entire displaced population. In addition, 1.2 million pounds of ice and 300,000 MREs are required to feed this group of people for one week.
Table 79: NMSZ Event Shelter Requirements for the State of Kentucky
Displaced and Shelter Seeking Population
Total Population Displaced Population
Shelter Seeking Population
25 Critical Counties 655,184 52,964 13,904 Remaining Counties 3,386,585 25,225 6,759 Total State 4,041,769 78,189 20,663 Damage to infrastructure leads to nearly 10,000 casualties throughout the state of Kentucky. Table 80 illustrates the various types of casualties estimated should the event occur at 2:00 PM. Approximately 6,800 minor injuries are expected (Level 1) while

69
nearly 600 fatalities are expected. Very few casualties, mostly injuries, are expected to occur outside the 25 critical counties. The severity of damage to infrastructure, especially in western Kentucky, leads to substantial direct economic losses. The majority of losses, roughly 75% of all direct losses, are attributed to utility lifelines. This is due to the significantly improved inventory and thousands of new facilities. Buildings and transportation lifelines incur much smaller proportions of direct losses with roughly 20% and 3% of all direct loss, respectively. Kentucky is one of the few states in the NMSZ to incur this amount of direct economic loss. Furthermore, building loss ratios are illustrated in Figure 25 at the conclusion of this section. Several counties in western Kentucky show substantial loss ratios between 40% and 75%. These counties include Fulton, Hickman, Carlisle, Ballard, Graves, and McCracken Counties. Loss ratios as high as reported indicate that a majority of the building stock is lost and many buildings must be replaced completely or will require significant repairs are required. Portions of Graves, Marshall, Union, and Hopkins Counties also show loss ratios between 10% and 20% which are significant, but not as critical as those in the western counties near the rupture zone. For more information on social impacts and economic losses for this scenario, please refer to Appendix VI.
Table 80: NMSZ Event Casualties for the State of Kentucky
Worst Case Casualties (2:00 PM)
Severity Level Level 1 (Green)
Level 2 (Yellow)
Level 3 (Red)
Level 4 (Black) Total
25 Critical Counties 6,722 2,051 318 593 9,684 Other Remaining Counties 49 5 1 0 56 Total State 6,771 2,056 319 593 9,740
Table 81: NMSZ Event Total Direct Economic Losses for the State of Kentucky
Total Direct Economic Losses System Inventory Value Total Direct Economic Loss Buildings $259,784,000,000 $9,442,940,000 Transportation $128,035,860,000 $1,291,480,000 Utility $797,983,900,000 $35,291,800,000 Total $1,185,803,760,000 $46,026,220,000
Mississippi New Madrid Seismic Zone Scenario Damage to infrastructure in Mississippi creates two million tons of debris. The majority of this debris, 1.2 million tons, is steel and concrete, while the remaining 0.8 tons is brick, wood and buildings contents. A total of 80,000 truckloads with a 25-ton capacity truck are required to remove all the debris generated by this southwest segment rupture.

70
Tens of thousands of people are forced to leave their homes due to structural damage. Approximately 21,000 people are displaced with nearly all of those people residing in the critical counties. Nearly 5,600 of those displaced seek public shelter, as shown in Table 82. To care for this sheltered population, 2.7 million square feet of space are required, with 334,000 square feet reserved just for sleeping. Nearly 40,000 gallons of water and 78,000 MREs are required to feed this population for the first week after the event.
Table 82: NMSZ Event Shelter Requirements for the State of Mississippi
Displaced and Shelter Seeking Population
Total Population Displaced Population
Shelter Seeking Population
25 Critical Counties 748,030 20,832 5,555 Remaining Counties 2,096,628 34 11 Total State 2,844,658 20,866 5,566 Structural damage to buildings and lifelines leads to nearly 4,000 casualties throughout the State of Mississippi. Over 70% of all casualties are minor injuries (Level 1) and 20% require immediate or delayed medical attention (Levels 3 & 2, respectively). Table 83 shows that only 200 fatalities are expected throughout the state. The level of direct economic losses incurred by the State of Mississippi is less severe than the losses incurred by other states in the NMSZ, though this is expected due to the lower level of shaking throughout the majority of the State. Nearly 60% of all direct economic losses are attributed to utility lifelines. Buildings show a total loss of approximately $3.8 billion and transportation lifelines contribute significantly less with only 3% of all direct economic losses. This is likely due to the smaller set of inventory when compared to the total number of utility facilities and network components, for example.
Table 83: NMSZ Event Casualties for the State of Mississippi
Worst Case Casualties (2:00 PM)
Severity Level Level 1 (Green)
Level 2 (Yellow)
Level 3 (Red)
Level 4 (Black) Total
25 Critical Counties 2,036 474 45 86 2,641 Other Remaining Counties 855 294 65 122 1,336 Total State 2,891 768 110 208 3,977
The greatest building loss ratios occur in portions of Tunica and Desoto counties in northwestern Mississippi. Ratios of 20% to 33% indicate that a significant portion of the building stock is damaged and require repair. Loss ratios less than 5% are more common throughout the majority of the state, however. Building loss ratios for the State of Mississippi are illustrated in Figure 26. For more information on social impacts and economic losses for this scenario, please refer to Appendix VI.

71
Table 84: NMSZ Event Total Direct Economic Losses for the State of Mississippi
Total Direct Economic Losses System Inventory Value Total Direct Economic Loss Buildings $131,314,000,000 $3,769,990,000 Transportation $69,176,250,000 $279,730,000 Utility $266,440,450,000 $5,441,930,000 Total $466,930,700,000 $9,491,650,000
Missouri New Madrid Seismic Zone Scenario The central segment event generates six million tons of debris in the State of Missouri. Steel and concrete buildings account for 3.1 millions tons of debris, while brick, wood and building contents comprise the remaining 2.9 million tons. A total of 240,000 truckloads with a 25-ton truck are required to remove all the debris created by this earthquake. Missouri is one of the most catastrophically impacted states in the NMSZ zone with regard to social impacts and economic losses. As illustrated in Table 85, nearly 122,000 people are displaced, which is far more than any other scenario discussed previously. Nearly all displaced residents reside in the critical counties in southeastern Missouri. Approximately 36,700 people seek temporary public shelter after the NMSZ event. Substantial amounts of space are required to house all those displaced. Nearly 18 million square feet of space is required, while 1.3 million gallons of water and over 500,000 MREs are needed in the first week to care for the sheltered population.
Table 85: NMSZ Event Shelter Requirements for the State of Missouri
Displaced and Shelter Seeking Population
Total Population Displaced Population
Shelter Seeking Population
46 Critical Counties 3,043,805 121,927 36,702 Remaining Counties 2,551,406 2 2 Total State 5,595,211 121,929 36,704
Table 86: NMSZ Event Casualties for the State of Missouri
Worst Case Casualties (2:00 AM)
Severity Level Level 1 (Green)
Level 2 (Yellow)
Level 3 (Red)
Level 4 (Black) Total
46 Critical Counties 11,267 3,177 401 760 15,605 Remaining Counties 33 1 0 0 34 Total State 11,300 3,178 401 760 15,639
The tens of thousands of damaged buildings cause nearly 16,000 casualties, with most occurring in the 46 critical counties. Well over 11,000 minor injuries are expected, though injuries requiring medical attention are far less than that. This equates to 3,600

72
people requiring delayed or immediate medical attention, which will be difficult when most hospitals in the critical counties are not operational. In addition, transportation lifelines may be damaged and routes to the functioning care facilities impassible. Table 86 shows nearly 800 expected fatalities, which is much higher than any other scenario estimate. Despite the very high social impact estimates, direct economic losses are not as high other states. Nearly $39 billion in total direct economic loss is expected for the State of Missouri. Approximately 65% of all direct economic losses can be attributed to utility lifelines. Buildings account for $11.8 billion, or 30%, of all losses and transportation lifelines comprise the remaining 5%. These values are illustrated in Table 87.
Table 87: NMSZ Event Total Direct Economic Losses for the State of Missouri
Total Direct Economic Losses System Inventory Value Total Direct Economic Loss Buildings $334,877,000,000 $11,811,430,000 Transportation $121,237,610,000 $1,772,590,000 Utility $564,861,000,000 $25,138,310,000 Total $1,020,975,610,000 $38,722,330,000
Building loss ratios also show the catastrophic level of damage in some areas of southeastern Missouri. Figure 27 illustrates the very high loss ratios in Pemiscot, Dunklin, New Madrid, and Stoddard Counties. Between 70% and 91% of building value is lost in these areas, indicating that a significant portion of those counties needs to be repaired or rebuilt after a NMSZ earthquake. Several other counties in southeast Missouri show loss ratios greater than 20% which is less critical, but still significant. For more information on social impacts and economic losses for this scenario, please refer to Appendix VI.
Tennessee New Madrid Seismic Zone Scenario The southwest segment rupture zones runs along the western edge of Tennessee, generating substantial damage and significant amounts of debris. Over 20 million tons of debris is expected with 8.8 million tons attributed to brick, wood and building contents. The remaining 11.9 million tons is comprised of steel and concrete. A total of 800,000 truckloads with 25-ton trucks are required to remove all the debris from this event. Social impacts are more severe in the State of Tennessee than in any other state. Nearly 263,000 people are displaced, which is likely due to the major population center of Memphis, TN, incurring significant damage. Of the hundreds of thousands displaced, over 73,000 will seek public shelter. Table 88 details the sheltering estimates and shows that nearly all displaced people reside in the 37 critical counties in western Tennessee. It requires over 35 million square feet to house these 73,000 people. Additionally, over 500,000 gallons of water, four million pounds of ice and over one million MREs are required to feed this group of people in the first week alone.

73
Extensive structural damage leads to tens of thousands of casualties as detailed in Table 89. A total of 63,000 casualties are expected if the event occurs at 2:00 PM. If the event were to occur at other times of day, casualty estimates will be less than 63,000. Nearly 70% of all casualties are minor injuries, though nearly 4,100 fatalities are expected. Approximately 15,500 people require immediate or delayed medical attention (Level 3 & 2, respectively), though with many hospitals not functioning in the harder hit areas medical services will be scarce. Roughly 75% of all casualties occur in the 37 critical counties in western Tennessee, indicating that 17,000 casualties will occur outside this region. Medical facilities outside the critical counties are more likely to be operational immediately after the event and thus able to care of those that are injured. In addition, the operational facilities closest to the heavily damaged counties will likely need to care for victims evacuated from the critical counties in the first hours and days after the earthquake.
Table 88: NMSZ Event Shelter Requirements for the State of Tennessee
Displaced and Shelter Seeking Population
Total Population Displaced Population
Shelter Seeking Population
37 Critical Counties 2,699,993 262,907 73,293 Remaining Counties 2,989,290 2 0 Total State 5,689,283 262,909 73,293
Table 89: NMSZ Event Casualties for the State of Tennessee
Worst Case Casualties (2:00 PM)
Severity Level Level 1 (Green)
Level 2 (Yellow)
Level 3 (Red)
Level 4 (Black) Total
37 Critical Counties 31,913 9,706 1,544 2,904 46,067 Other Remaining Counties 11,419 3,759 609 1,184 16,971 Total State 43,332 13,465 2,153 4,088 63,038
Direct economic losses in the State of Tennessee are the greatest of any state in the NMSZ. A total of $56.6 billion is lost in combined building, transportation and utility infrastructure value. Table 90 illustrates the losses in each of these three categories. Building losses are the greatest portion of total loss with $40.3 billion in losses, representing 70% of all losses. Utility and transportation lifelines contribute lesser proportions with 25% and 3% of all direct economic losses, respectively.
Table 90: NMSZ Event Total Direct Economic Losses for the State of Tennessee
Total Direct Economic Losses System Inventory Value Total Direct Economic Loss Buildings $329,827,000,000 $40,316,300,000 Transportation $82,455,530,000 $1,746,230,000 Utility $173,425,200,000 $14,576,340,000 Total $585,707,730,000 $56,638,870,000

74
Building loss ratios for the State of Tennessee are illustrated in Figure 28. Though building losses are very high, the greatest loss ratios are confined to several small regions. Portions of Tipton and Crockett Counties show loss ratios of 40% to 62%, which is roughly half of all building value lost in those areas. Additionally, the City of Memphis shows loss ratios of 20% to 40% in some areas. This may be due to the large number of URMs in the city that are expected to incur sever damage. The majority of the rest of Tennessee shows much lesser loss ratios of 2% or less. For more information on social impacts and economic losses for this scenario, please refer to Appendix VI.

75
Figure 19: NMSZ Event Loss Ratio (% of Total Building Assets) for the State of Alabama

76
Figure 20: ETSZ Event Loss Ratio (% of Total Building Assets) for the State of Alabama
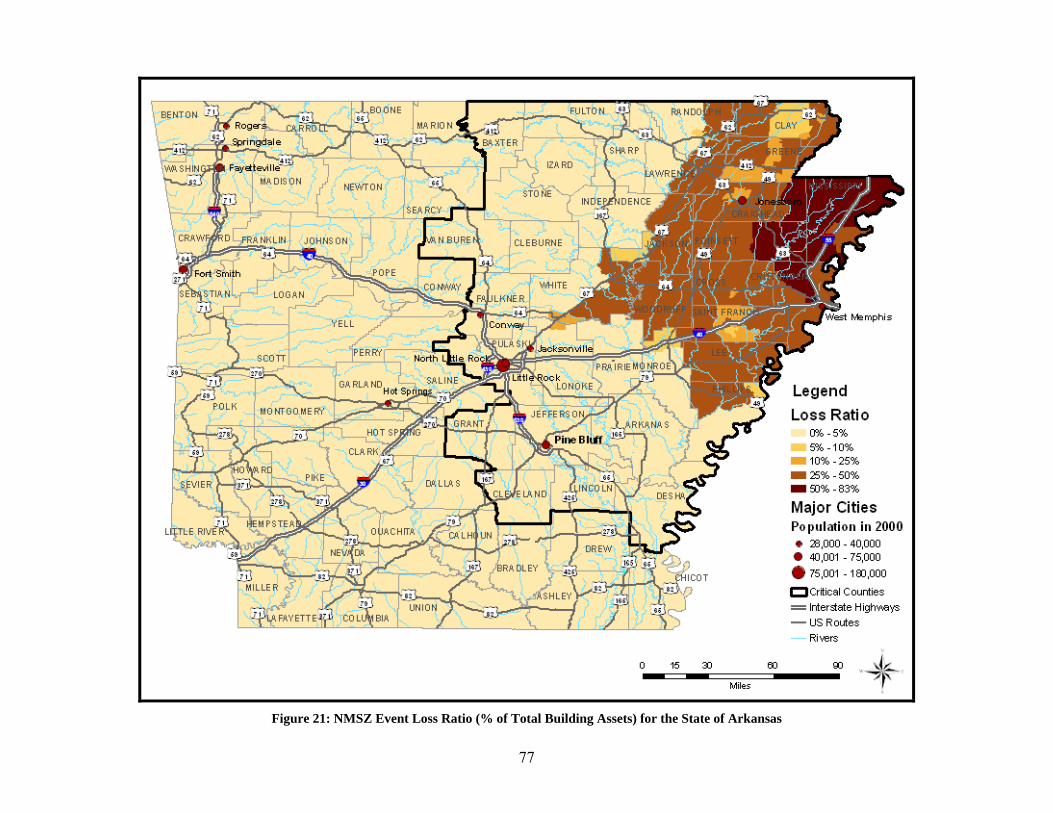
77
Figure 21: NMSZ Event Loss Ratio (% of Total Building Assets) for the State of Arkansas

78
Figure 22: NMSZ Event Loss Ratio (% of Total Building Assets) for the State of Illinois
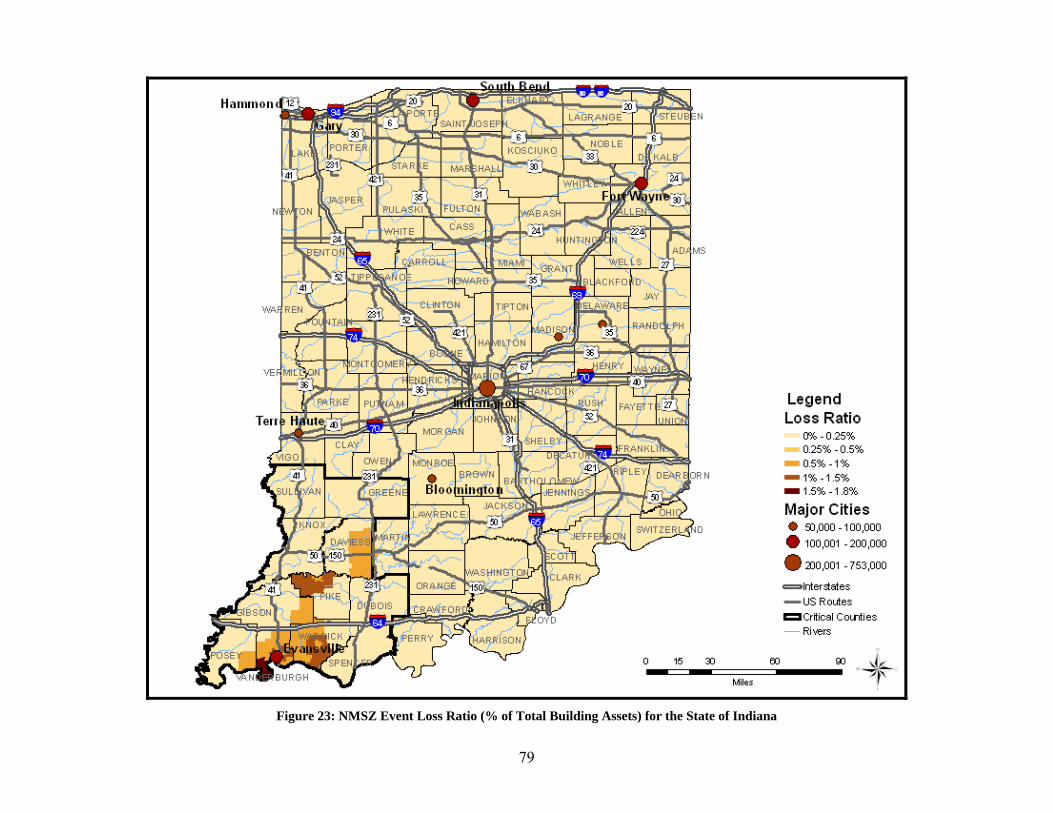
79
Figure 23: NMSZ Event Loss Ratio (% of Total Building Assets) for the State of Indiana
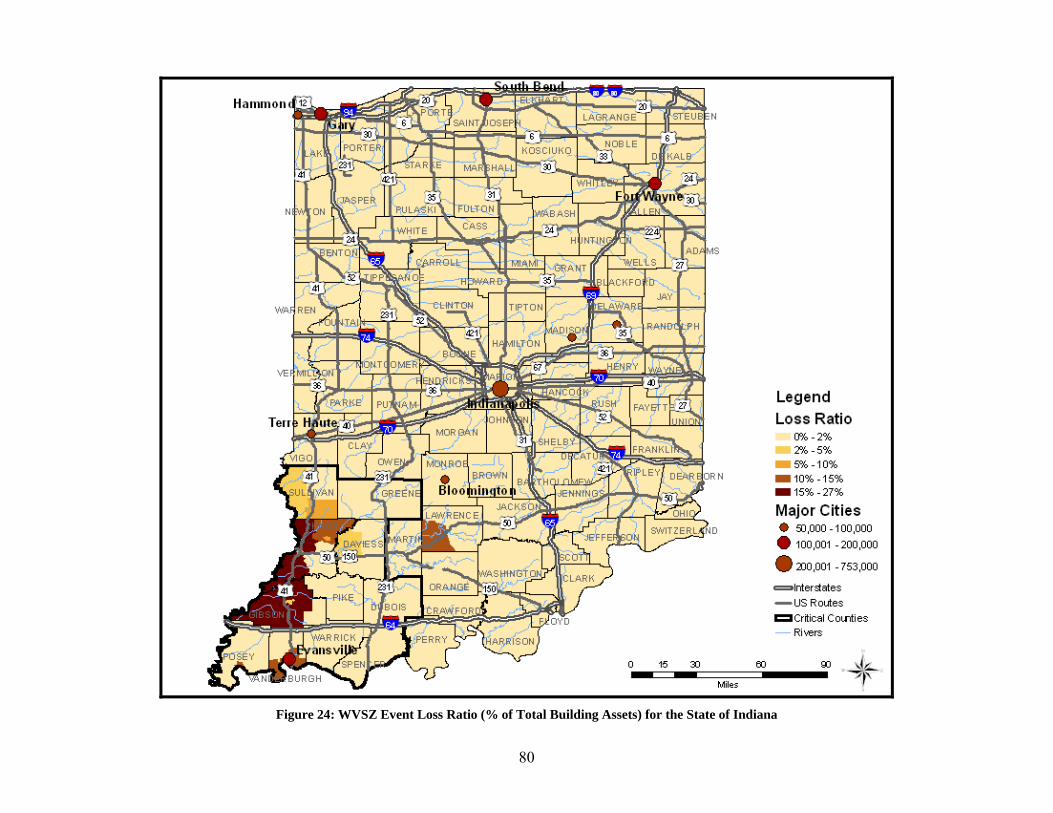
80
Figure 24: WVSZ Event Loss Ratio (% of Total Building Assets) for the State of Indiana
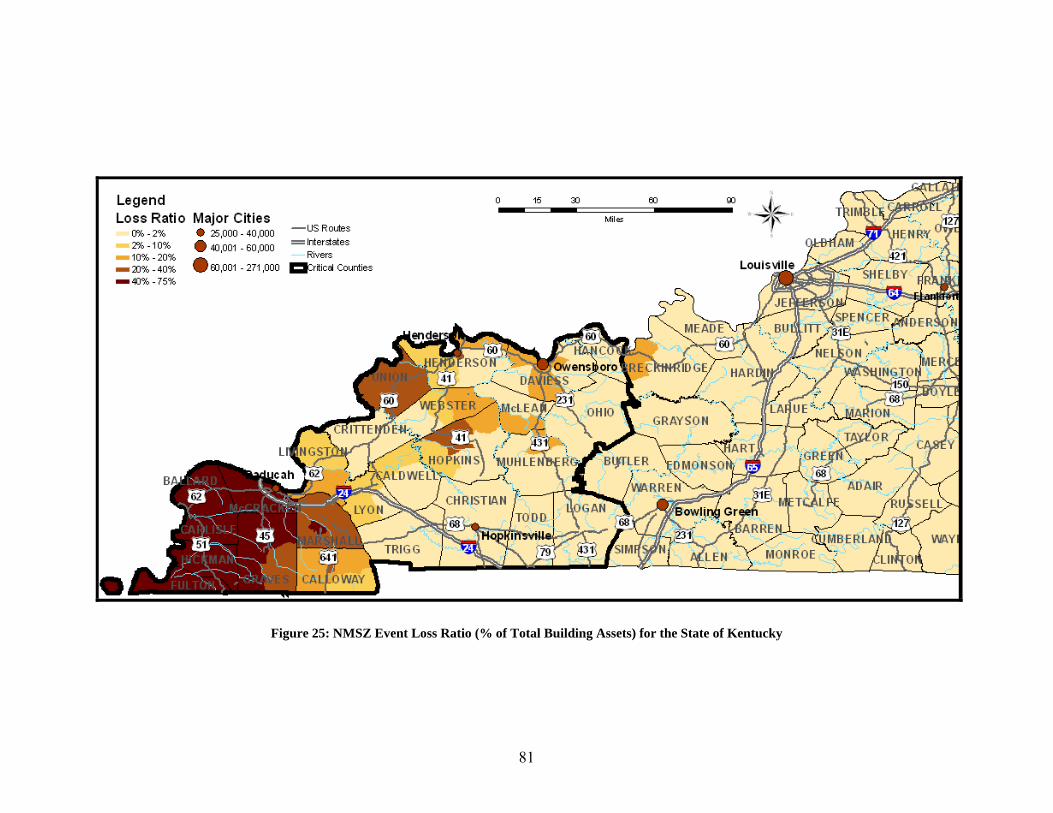
81
Figure 25: NMSZ Event Loss Ratio (% of Total Building Assets) for the State of Kentucky
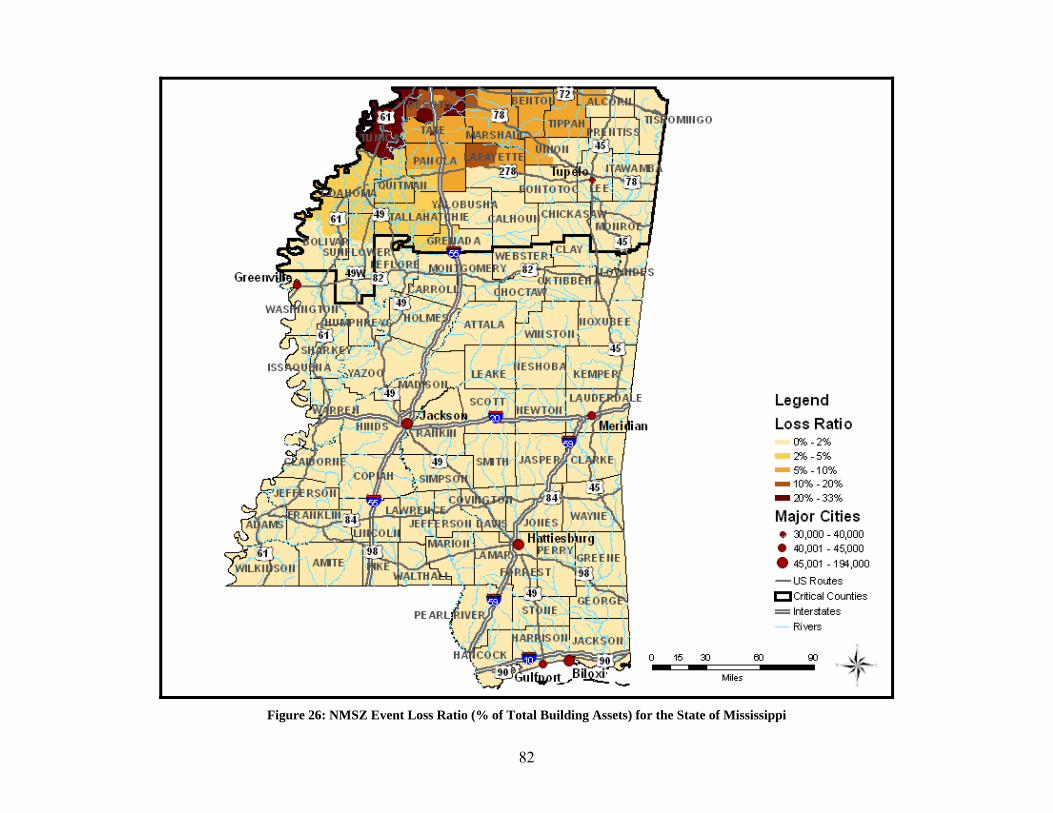
82
Figure 26: NMSZ Event Loss Ratio (% of Total Building Assets) for the State of Mississippi

83
Figure 27: NMSZ Event Loss Ratio (% of Total Building Assets) for the State of Missouri

84
Figure 28: NMSZ Event Loss Ratio (% of Total Building Assets) for the State of Tennessee

85
Regional Social Impact and Economic Loss As stated for the direct damage estimates, social losses and economic impacts should not be combined over all scenarios for regional totals. Since each scenario is based on a different hazard, adding impacts together will not reflect one regional scenario. It is possible, however, to discuss qualitatively the impact on this eight state region. Some states are more likely than others to incur substantial casualties and economic loss based on their location in relation to the source of rupture. Southern states such as Alabama and southern Mississippi show very few casualties, if any, and minimal economic losses. As a result, these areas will be more likely to provide supporting services to heavily impacted areas after the earthquake. Such services may include sheltering displaced populations, providing medical services at functioning hospitals and providing staging areas for rescue and aid workers. The same is true for northern Illinois and most of Indiana. These states, or portions of states, see very few casualties or displaced residents. Such areas will be able to provide similar services to more northern areas that are heavily damaged from a NMSZ event. Should a WVSZ event occur, however, these areas are likely to experience substantial impacts and will require outside assistance. Areas nearest the NMSZ are likely to see wide-spread and catastrophic social impacts and economic losses. Southeast Missouri, western Kentucky and Tennessee, northeast Arkansas and southern Illinois show the most significant social impacts. A southwest event affects the major population center of Memphis, TN, and leaves nearly 265,000 people displaced and over 63,000 people injured or killed. A southwest segment event could leave up to 500,000 people without homes and could injure 150,000 people across the entire NMSZ area. Up to 100,000 people may need temporary public shelter, which would require several million MREs for the first week alone. In addition, over one million gallons of water and as many as ten million pounds of ice may be needed for a NMSZ event. It is very likely that an event on the southwest segment will produce the greatest social impacts and thus present the largest requirements for food, water, ice, and shelter space. Substantial losses in Tennessee, Kentucky, Arkansas, northwestern Mississippi and southeastern Missouri would likely generate over $100 billion in direct economic losses. A large portion of these losses would be due to utility lifeline losses with building losses contributing a significant portion as well. A northeast segment event, however, would impact southern Illinois as well as parts of Missouri and Kentucky. Economic losses caused by a northeast segment effect, while likely to be less than a southwest segment event, would result in total losses possibly reaching $75 billion in direct economic losses.
Comparison with Other Published Studies As mentioned earlier, the earthquake impact assessment carried out by CUSEC provides the only regionally comprehensive study by which to compare results. The following

86
discussion compares the results of this study with those of the CUSEC study. It is also critical to note that the CUSEC study does not provide advanced social impact modeling, which details additional housing and medical requirements. New information that is only available in this study includes space requirements, number of beds, amount of food, water and ice needed, as well as estimates of medical assistance requirements for the displaced population. Since these impacts are not available in the CUSEC study they are not compared herein. Other estimates such as displaced population, casualties, debris and direct economic loss are compared in this section. In addition, the CUSEC study only includes those counties identified as critical counties in this study; thus, all comparisons are for the critical counties in each scenario only. It should also be noted that the displaced residences/households model and temporary shelter model were implemented incorrectly in the version of HAZUS-MH MR2 utilized in the CUSEC study. This investigation used the HAZUS-MH MR2 methodology but conducted those calculations externally to ensure the model for those particular social losses was used properly. In Alabama, the CUSEC study estimates over three times as many displaced residences and temporary shelter needs as compared with this study. Alabama casualties show similar trends as CUSEC estimates 72 total casualties, while this investigation shows only 30. Though the hazard is shifted closer to the State of Alabama, in the scenario utilized in this investigation the shaking experienced throughout the state is minor and does not affect social impact assessments substantially. Finally, this investigation estimates greater direct economic loss by roughly $300 million, which is likely due to the additional utility inventory and the shifting of the hazard closer to the State of Alabama. The scenario for the State of Arkansas is not shifted and utilizes the same scenario ground motion as the CUSEC scenario. Estimates of debris generation are roughly the same though sheltering estimates vary greatly. This investigation estimates that nearly 127,000 households are displaced and over 37,000 people will seek temporary shelter though CUSEC reports only 48,000 and 14,000 for these categories, respectively. This is likely due to the incorrect internal calculation of these values in HAZUS-MH MR2. When calculated externally, according to the HAZUS-MH MR2 model, estimates are substantially greater. CUSEC predicts roughly 15% more total casualties, though that is likely due to the large number of minor injuries. This investigation shows 130 more fatalities and several serious injuries (Level 3), which is likely due to the lowering of the seismic design level (moderate to low seismic design) in northeastern Arkansas. Though this investigation and the CUSEC study show total direct economic losses are roughly the same, buildings losses illustrate a sizeable difference of approximately $850 million. This is attributed to the lower seismic design specification in this investigation that makes buildings more vulnerable to earthquake damage. Kentucky shows similar trends to those seen in Arkansas. Estimates of social impacts and induced damage are much greater in this investigation than in the CUSEC study. Debris estimates are roughly twice as much in this investigation, while displaced household and temporary housing estimates in this investigation are nearly three times those shown in the CUSEC study. Furthermore, casualty estimates are substantially more in this investigation, with over 12,500 total casualties, while CUSEC estimates are nearly 4,700.

87
Such differences in social impacts and induced damage are likely due to the location of the hazard. In this investigation the fault rupture is shifted closer to Kentucky and generates more intense shaking in the western portion of the state. The shifting of hazard, adjustment of seismic design class and addition of utility inventory produced the nearly $28 billion difference in total direct economic loss. This investigation estimates roughly $33.5 billion in losses while the CUSEC study shows only $5.8 billion. A more accurate representation of regional inventory in conjunction with the nearest fault rupture generates a substantial difference in economic loss. As with many other southern states that experience significant impacts from a NMSZ earthquake, social impact estimates in Tennessee are far greater in this investigation than in the CUSEC study. Debris estimates are roughly 33% greater while sheltering and displaced household estimates are doubled. A total of 10,000 more casualties are expected in this investigation, with nearly 800 more fatalities estimated. This investigation produces estimates for social impacts that are far greater in many central and northern NMSZ states. As mentioned earlier, the CUSEC study only employed the southwest event so central and northern states will experience less intense shaking in the CUSEC study than in this investigation. In the State of Missouri, CUSEC estimates approximately 25,000 displaced households, while this investigation anticipates nearly 122,000. In addition, CUSEC expects roughly 8,000 total casualties, while this investigation reports over 15,600 casualties. The same is true in Illinois where the northeast event is likely to generate the most catastrophic impacts. The CUSEC study reports roughly 5,000 displaced households and nearly 1,400 requirements for temporary housing. This investigation, on the other hand, estimates over 51,000 displaced households and 14,700 requirements for temporary housing. Furthermore, total direct economic losses in the State of Illinois are estimated at $2.2 billion in the CUSEC study, while this investigation estimates losses of around $31 billion. It is clear that the difference in source rupture makes a substantial difference in the social impacts and direct economic losses experienced by a state: thus, choosing the appropriate event is critical in determining the worst case impacts in a specified region. For additional comparison data, please refer to Appendix IX. Additionally, the IEMA study provides a different, yet plausible set of social and economic losses than those presented in this report. This report estimates nearly 15,000 people will seek temporary shelter while the IEMA report estimates only 6,500 people seek temporary shelter. Conversely, this report estimates approximately 6,300 total casualties and the IEMA study estimates roughly 7,600 total casualties. Direct economic losses also differ, particularly utility lifeline losses. The substantially larger utility lifeline inventory utilized in this report generates nearly $27 billion in utility lifeline losses while the IEMA study shows only $2 billion in losses. For more information on the social and economic losses in the IEMA study, please refer to Mid-America Earthquake Center (2007) report.

88
Discussion and Conclusions This investigation employs ten scenarios designed to identify the effects of plausible earthquakes on eight states in the Central USA. Eight of the ten scenarios focused on the New Madrid fault system while two scenarios represent the risk from the Wabash Valley and the East Tennessee seismic zones. In several cases, the fault rupture was moved to the boundaries of the NMSZ in an effort to capture the worst case impacts for each individual state. In addition, liquefaction susceptibility characterization, inventory updates and advanced social impact modeling were incorporated to provide the most reliable impact assessment possible. Though numerous scenarios have been completed, it is important to emphasize that impacts from each scenario should not be combined for regional assessment. With each scenario employing a different earthquake (hazard), even within the NMSZ, adding all impacts together represents an event that could not take place. On the other hand, it could be argued that the 1811-1812 earthquakes were three consecutive and potentially damaging events that current modeling tools are incapable of representing. Emergency planning, response and recovery decision-makers should weigh these factors in their efforts to balance the potentially conservative and non-conservative assumptions that are inevitable in a large regional study of earthquake impacts such as that described in the current report. For further discussion of the background of the scenarios used in this study, reference is made to the Scenario Disclaimer in page iv of this report. The counties nearest to the source of seismic activity are likely to experience substantial damage to buildings as well as loss of critical services. This means that tens of thousands of homes will be damaged and residents will be displaced. For an earthquake nucleating in the northern portion of the NMSZ zone, thousands of buildings in southern Illinois and portions of Missouri and Kentucky will be damaged and tens of thousands will be without homes. The same is true for a southern NMSZ event, though in this case the heavily damaged areas will be northeast Arkansas, northwest Mississippi, western Tennessee and portions of western Kentucky. In addition, Memphis, TN, will be heavily damaged and its large number of highly vulnerable unreinforced masonry buildings will be significantly affected. This southern segment earthquake is likely to damage the greatest number of homes and affect the largest number of people when considering each individual segment rupture in the NMSZ. Critical infrastructure and lifelines will also be heavily damaged and will be out of service after the earthquake for a considerable period of time. Such mass outages are likely to affect a region much larger than the 8 states studied above. Many hospitals nearest to the rupture zone will not be able to care for patients, indicating that those injured during the event will have to be transported outside of the region for medical care. Moreover, pre-earthquake patients will have to be moved out of the area to fully-functioning hospitals. It is doubtful that the transportation system will be functioning to a level that allows such mass evacuation. Police and fire services will be severely impaired due to damage to stations throughout the impacted region. Many schools that serve as public shelter will be damaged and unusable after the earthquake. Transportation into and

89
out of the areas near the fault rupture will be difficult if not impossible. Many bridges will be damaged and not passable, airports will be damaged and some ferry facilities and ports will be out of service. The massive loss of functionality of transportation systems and facilities will prevent displaced residents from leaving the region and also make it difficult for ground-transported aid workers and relief supplies to access the most heavily damaged areas. Utility services will be severely disrupted for hundreds of thousands of customers due to extensive facility and pipeline damage. Extended service outages will be highly likely for tens of thousands of customers, making it difficult for them to remain in their homes, even if they are structurally sound after the earthquake. Damage to major natural gas and oil transmission lines will lead to service interruptions that will affect areas as far away as the east coast and New England. Social impact estimates show that hundreds of thousands of people will be displaced and tens of thousands of people will seek temporary public shelter after a major earthquake on the New Madrid fault. Three successive earthquakes, as in 1811-1812, will generate even more catastrophic impacts. Casualties in the tens of thousands are likely, especially with a southwest segment rupture. Most of these will be minor injuries, though several thousand serious injuries and fatalities are also predicted. In addition, debris generated from this event may reach several hundred thousands tons, which will have to be removed prior to repair and reconstruction efforts. Areas nearest to the rupture will be heavily damaged and many transportation and utility lifelines will not function for an extended period of time. The parts of each state that are farthest from the rupture will remain largely undamaged and functioning. Expectations are that these undamaged regions will support the response and recovery of the severely damaged areas. In addition, Indiana and Alabama are not likely to experience significant damage from a NMSZ event and may also function as host states in the aftermath of a NMSZ earthquake. Should an ETSZ or WVSZ event occur however, these states will require assistance from neighboring states.
Implications on Research and Development The detailed study presented in this report has highlighted several areas where significant effort is called for, in order that more realistic and reliable earthquake consequence assessment results may be available in the foreseeable future. The most pressing of these research and development products are listed below, in the sequence of Hazard, Fragility, Inventory and Social and Economic Consequences: Several major assumptions were made on the hazard side to account for the multiple
earthquake potential of the New Madrid Seismic Zone. Fundamental research in earthquake geophysics and engineering seismology is needed to assess the relative probabilities of occurrence of earthquake occurrence on the three identified segments of the NMSZ and the implications of one earthquake on the probabilities of the second and third earthquakes happening. This is a complex problem that pushes the

90
boundaries of time-dependent hazard and multiple source modeling, amongst other challenges.
Detailed liquefaction characterization that uses state-of-the-art liquefaction metrics is sorely needed. The difficult problem of characterizing liquefaction is compounded by the multiple earthquake occurrences which require new approaches to account for the cumulative effect of multiple earthquakes.
The above two research issues lead to a third important point, which is the effect of multiple earthquakes on site response that may effectively alter the site class in such a manner so as to annul the strong-motion (attenuation) models in current use. Research is required to address this problem and provide reliable ground motion parameters.
Significant improvements in inventory are still urgently required. There are many systems that are critical for response and recovery for which inventory is either sparse or lacking. Examples are utilities distribution networks that are not in the public domain and cell phone towers. It is clear that without accurate inventory, modeling efforts will continue to be relatively uncertain.
There are several important built environment components for which no fragility relationships exist, such as different configurations of gravity and earth dams, large and complex river crossings, special structural configurations used for power and chemical plants and their components, communications and electricity towers, amongst others. Such fragilities are urgently required.
For all fragilities used in assessment in the New Madrid Seismic Zone, the effect of degradation in stiffness and strength due to multiple earthquakes poses a fundamental and intricate research challenges that should be addressed urgently. The current approach is grossly inaccurate, and it is not possible to ascertain if it is conservative or otherwise, since the interaction between input motion and structural frequencies is highly nonlinear.
The sheltering model employed was developed based upon behavior exhibited in the San Francisco bay area following the Loma Prieta earthquake and in the Los Angeles area after the Northridge earthquake. The model has not been tested or validated outside of California. There is a large amount of uncertainty regarding the factors that influence the reasons for shelter-seeking. This model assumes that people will only seek shelter if their homes have been damaged. It neglects other factors that make it difficult to sustain themselves in their own homes such as loss of power or water, safety factors, damage to surrounding hazardous materials facilities and long term recovery.
During the response phase of the disaster management cycle, the prioritization of service needs will change. Over time focus will move from life-saving to life-sustaining and finally life-supporting. The uncertainty regarding the length of time that will be required to deliver services during a catastrophic event is very high. The transition from response to recovery takes much longer during a catastrophe. Midterm economic effects are prolonged due to factors such as loss of infrastructure, loss of jobs, etc. More research is needed on speed-of-recovery factors of the socio-economic systems. The response models currently focus on immediate responses and are not validated for longer time frames. Consideration of long term commodity distribution, medical services, and repair of cascading infrastructure failures is required.
91
Current preparedness goals are based on establishing adequate response system capabilities. The objective of response should be to successfully achieve observable and measurable goals. In order to do this, response managers must achieve critical success factors and avoid critical failures. The outcome-based metrics required to establish goals and to manage for success do not exist. The modeling and estimation of disaster caused needs conducted in this project can provide the basis for establishing these metrics and for developing outcome-based response strategies.
Comprehensive and theoretically sound measures of reliability of the loss assessment, taking into account uncertainties in all components, are urgently needed. Attaching a reliability measure to the impact estimate is essential for informed decision-making.
In general, disasters that lead to catastrophic consequences produce cascading infrastructure failures which may result in unanticipated response requirements. Infrastructure failures not only influence the demands for service but also the mobility and capabilities of response organizations attempting to provide these services. There is a dearth of information on the manner in which people and systems behave following a catastrophe. There is a pressing need for collection and assimilation of such information possibly from other regions in the world with social and economic characteristics similar to the Central USA.
Acknowledgements This report summarizes a considerable amount of work that includes various sub-disciplines. As such, it has benefited from the contributions of many individuals and organizations. It is impossible to include a comprehensive list; every attempt was made to list individuals and organizations under the heading of ‘Contributions’ in the opening part of this report, and below. Financial support was provided by FEMA through the US Army Corps of Engineers Civil Engineering Research Laboratory at Urbana, Illinois. Additional supporting resources were made available by the Mid-America Earthquake Center through its Emergency Management Agencies test bed project, funded by the National Science Foundation. The Project Team wishes to thank Mr. Michel S. Pawlowski for leading the FEMA oversight effort, Dr. Ilker Adiguzel and Dr. James Wilcoski (USACE), the IEM group, Mr. James Wilkinson (CUSEC), Mr. Douglas Bausch (FEMA Region VIII) and Mr. Robert Bauer (Illinois State Geological Survey). Thanks are also due to state emergency management offices, state geological surveys, the four relevant FEMA regions, PBS&J Corporation, and administration and finance personnel at the University of Illinois, both at the Civil and Environmental Engineering Department and the Campus.

92
References Abrahamson, N.A. & W.J. Silva (1997). Empirical response spectral attenuation
relationships for shallow crustal earthquakes. Seismological Research Letters, 68 (1), 94-127.
Ambraseys, N.N. & J.J. Bommer. (1991). The attenuation of ground accelerations in Europe. Earthquake Engineering and Structural Dynamics, 20 (12), 1179-1202. Ambraseys, N.N. & J.J. Bommer (1992). On the attenuation of ground accelerations in
Europe. Proceedings of the 10th World Conference on Earthquake Engineering, v 2, 675-678. July 19-24. Madrid, Spain.
Ambraseys, N.N. & K.A. Simpson (1996). Prediction of vertical response spectra in Europe. Earthquake Engineering and Structural Dynamics, 25 (4), 401-412. Atkinson G.M. & D.M. Boore (2003). Empirical ground-motion relationships for
subduction zone earthquake and their application to Cascadia and other regions. Bulletin of the Seismological Society of America, 93 (4), 1703-1729.
Atkinson G.M. & D.M. Boore. (1995). Ground-motion relations for eastern north
America. Bulletin of the Seismological Society of America, 85 (1), 17-30. Campbell, K.W. & Y. Bozorgnia (2003). Updated near-source ground-motion
(attenuation) relations for the horizontal and vertical components of peak ground acceleration and acceleration response spectra. Bulletin of the Seismological Society of America, 93 (1), 314-331.
Cramer, C. (2006). Quantifying the uncertainty in site amplification modeling and its effects on site-specific seismic-hazard estimation in the Upper Mississippi Embayment and adjacent areas. Bulletin of the Seismological Society of America. 96 (6), 2008-2020. Elnashai, A.S. (2003). Next Generation Vulnerability Functions for RC Structures. Response of Structures to Extreme Loading Conference. Toronto, Canada. August 3-6. Elnashai, A., Hampton, S., Karaman, H., Lee, J.S., McLaren, T., Myers, J., Navarro, C.,
Sahin, M., Spencer, B., and Tolbert, N. (2008) (a). Overview and Applications of Maeviz-HAZTURK 2007, Journal of Earthquake Engineering, 12 (2), 100-108.
Elnashai, A., Hampton, S., Lee, J.S., McLaren, T., Myers, J., Navarro, C., Spencer, B.,
and Tolbert, N. (2008) (b). Architectural Overview of MAEviz-HAZTURK, Journal of Earthquake Engineering, 12 (2), 92-99.

93
FEMA (2006), HAZUS-MH MR2 Technical Manual. Washington, D.C. FEMA. Frankel, A., C. Mueller, T. Bernard, D. Perkins, E. V. Leyendecker, N. Dickman, S. Hanson, and M. Hopper (1996). National seismic-hazard maps: documentation June, 1996, U.S. Geol. Surv. Open-File Rept. 96-532. Frankel, A. D., M. D. Petersen, C. S. Mueller, K. M. Haller, R. L. Wheeler, E. V. Leyendecker, R. L. Wesson, S. C. Harmsen, C. H. Cramer, D. M. Perkins, and K. S. Rukstales (2002b). Documentation for the 2002 update of the national seismic hazard maps, U.S. Geol. Surv. Open-File Rept. 02-420. Fukushima, Y., J.C. Gariel & R. Tanaka (1995). Site-Dependent attenuation relations of
seismic motion parameters at depth using borehole data. Bulletin of the Seismological Society of America, 85 (6), 1790-1804.
Gencturk, B, A.S. Elnashai and J. Song (2008). Fragility relationships for populations of woodframe structures based on inelastic response. Journal of Earthquake Engineering. 12 (2), 119-128. Gencturk, B., A.S. Elnashai, and J. Song (2007). Fragility relationships for populations of woodframe structures based on inelastic response. Proc. International Symposium on Earthquake Loss Estimation for Turkey, HAZTURK2007, September 24-26, Istanbul, Turkey. Hildenbrand, T.G., Griscom, A., Van Schmus, W.R., and Stuart, W.D. (1996). Quantitative investigations of the Missouri gravity low: A possible expression of a large, Late Precambrian batholith intersecting the New Madrid seismic zone. Journal of Geophysical Research B: Solid Earth 101 (B10), 21921-21942. Jeong, S-H., Elnashai, A.S. (2006). Fragility Analysis of Buildings with Plan Irregularities. 4th International Conference on Earthquake Engineering (4ICEE), Paper No. 145, Taipei, Taiwan, October 12-13. Johnston, A. C. and Schweig E. S. (1996). The Enigma of the New Madrid Earthquakes of 1811-1812. Ann. Rev. Earth Planet. Sci., 24, 339-384. Kamiyama, M. (1995). An attenuation model for the peak values of strong ground
motions with emphasis on local soil effects. Proceedings of the 1st International Conference on Earthquake Geotechnical Engineering, v 1, 579-585.
Kircher, C. A., Nassar, A, Kustu, O., Holmes, W. T. (1997). Development of building damage functions for loss estimation. Earthquake Spectra. 13 (4), 663-682.
MAEviz (2008). “MAEviz Software.” Mid-America Earthquake Center.
<http://mae.ce.uiuc.edu/software_and_tools/maeviz.html>, Febraury 12.

94
Mid-America Earthquake Center (2007). Comprehensive seismic loss modeling for the State of Illinois: Final Report. University of Illinois at Urbana-Champaign, Urbana, IL. June. NGA Office of Americas/North America and Homeland Security Division (PMH) (2007). Homeland Security Infrastructure Program (HSIP) Gold Dataset 2007. Bethesda, MD 20816-5003. May. National Institute of Building Sciences (NIBS) (1999). Enhancement of the highway
transportation lifeline module in HAZUS. Prepared by Nesrin Basoz and John Mander, January.
Nielson, B. G. and R. DesRoches (2004). Improved Methodology for Generation
of Analytical Fragility Curves for Highway Bridges, 9th ASCE Specialty Conference on Probabilistic Mechanics and Structural Reliability, ASCE, Albuquerque, NM, July.
Nielson, B. and R. DesRoches (2006a). Effect of using PGA versus Sa on the
uncertainty in probabilistic seismic demand models of highway bridges., 8th National Conference on Earthquake Engineering, Earthquake Engineering Research Institute, San Francisco, 18-21 April.
Nielson, B. G. and R. DesRoches (2006b). Influence of modeling assumptions on
the seismic response of multi-span simply supported steel girder bridges in moderate seismic zones, Engineering Structures, 28 (8), 1083-1092.
O'Rourke M.J and Ayala G. (1993). Pipeline damage due to wave propagation. Journal of Geotechnical Engineering, ASCE. 119 (9), 1490-1498. Somerville, P., N. Collins, R. Abrahamson, and C. Saikia (2001). Ground-motion
attenuation relationships for the Central and Eastern United States. Final report to the U.S. Geological Survey.
Toro, G. R., N.A. Abrahamson, & J.F. Schneider (1997). Engineering model of
strong ground motions from earthquakes in the Central and Eastern United States. Seismological Research Letters, v 68, 41-57.