impact of oral nutritional supplementation on hospital ... j. philipson, phd; julia thornton snider,...
TRANSCRIPT

VOL. 19, NO. 2 n THE AMERICAN JOURNAL OF MANAGED CARE n 121
n clinical n
© Managed Care &Healthcare Communications, LLC
M alnutrition is a serious and underappreciated problem among hospitalized patients. Malnourished patients face heightened risks of poor outcomes, including increased
length of stay (LOS),1-3 healthcare costs,1-4 complication rates,2,4-7 re-admission rates,8,9 and mortality.2,10-12
Estimates of malnutrition prevalence in the inpatient population range from 8% to 62%, depending on the location and the specific patient popu-lation considered.13-17 Groups at highest risk include elderly as well as on-cology and gastroenterology patients.16 Despite evidence documenting the deleterious effects of malnutrition in the inpatient setting, studies suggest it is a common problem that often goes unrecognized and undertreated.15,18
A growing body of evidence suggests that oral nutrition supple-ments (ONS), which deliver both macronutrients and micronutri-ents for special medical purposes in addition to normal food, might improve outcomes among hospitalized patients. A variety of benefits have been found for ONS use, including reduced LOS,3 inpatient epi-sode cost,3,19 complication rates,19,20 depressive symptoms,21 and read-mission rates,22,23 and improved lean body mass recovery.24 However, previous studies suffer from limitations, including modest sample sizes, narrowly selected patient populations, and in observational studies, possible selection bias. Consequently, questions remain regarding the robustness and generalizability of existing findings and the size of gains and healthcare costs associated with ONS use in hospitalized patients.
This retrospective data analysis was conducted to assess the associa-tion and causal impacts of ONS on health outcomes for hospitalized patients, focusing on 3 key outcomes: LOS, episode cost, and probability of 30-day readmission.
METHODSSetting, Subjects, and Data Sources
This analysis was conducted using the Premier Perspectives Data-base. This database contains diagnostic and billing information on 44.0
million adult inpatient episodes at 460 sites during the years 2000 to 2010. Premier estimates that these data cover 20% of all US inpatient episodes. The sample was restricted to adults 18 years or older and ex-cluded terminal episodes and all
Impact of Oral Nutritional Supplementation on Hospital Outcomes
Tomas J. Philipson, PhD; Julia Thornton Snider, PhD; Darius N. Lakdawalla, PhD;
Benoit Stryckman, MA; and Dana P. Goldman, PhD
Objectives: To assess the effect of inpatient oral nutritional supplement (ONS) use on length of stay, episode cost, and 30-day readmission probability.
Study Design: Eleven-year retrospective study (2000 to 2010).
Methods: Analyses were conducted using the Premier Perspectives Database, which contained information on 44.0 million adult inpatient episodes. Using a matched sample of ONS and non-ONS episodes for any inpatient diagnosis, instrumental variables regression analysis was performed to quantify the effect of ONS use on length of stay, episode cost, and probability of ap-proximate 30-day readmission. For the readmis-sion outcome, the matched sample was restricted to episodes where the patient was known to be at risk of readmission. The fraction of a hospital’s episodes in a given quarter involving ONS was used as an instrumental variable.
Results: Within the database, 1.6% of 44.0 million adult inpatient episodes involved ONS use. Based on a matched sample of 1.2 million episodes, ONS patients had a shorter length of stay by 2.3 days (95% confidence interval [CI] – 2.42 to –2.16), from 10.9 to 8.6 days (21.0% decline), and decreased episode cost of $4734 (95% CI – $4754 to – $4714), from $21,950 to $17,216 (21.6% decline). Restrict-ing the matched sample to the 862,960 episodes where patients were readmitted at some point, ONS patients had a reduced probability of early readmission (within 30 days) of 2.3 percentage points (95% CI – 0.027 to – 0.019), from 34.3% to 32.0% (6.7% decline).
Conclusions: Use of ONS decreases length of stay, episode cost, and 30-day readmission risk in the inpatient population.
(Am J Manag Care. 2013;19(2):121-128)
For author information and disclosures, see end of text.
In this article Take-Away Points / p122 www.ajmc.com Full text and PDF Web exclusive eAppendix

122 n www.ajmc.com n FEbRUARy 2013
n clinical n
episodes involving tube feeding, leaving only oral feeding for examination. All monetary figures were reported in 2010 dollars and inflation-adjusted based on the bureau of Labor Statistics medical Consumer Price Index (http://www.bls.gov/cpi/#tables).
MeasuresThe study’s 3 key outcome variables were LOS, episode
cost, and probability of 30-day readmission. Length of stay was defined as the number of days of direct patient care (mini-mum 1 day) from admission to discharge. Episode cost was defined as the actual costs to treat the patient during the hospitalization. Thirty-day readmission probability was de-fined as a return hospitalization for any diagnosis. For patient confidentiality purposes, the Premier database only contains the month and year of an inpatient episode. Therefore, the 30-day readmission window was calculated by identifying ad-missions later the same month or during the following month. Given that there are no International Classification of Diseases, Ninth Revision or Current Procedural Terminology codes that identify ONS use, ONS was defined as a “complete nutritio-nal supplement, oral,” as indicated by the Premier data, and coded as a binary variable, indicating any ONS used during the inpatient episode.
Statistical AnalysisNaïve ordinary least squares (OLS) regression analyses were
performed on the full matched sample. Analyses controlled for a variety of patient, episode, and provider characteristics. De-mographic covariates included age, age squared, insurance type, marital status, race, and sex. Comorbidity covariates included all components of the Charlson Comorbidity Index.25,26 Health his-tory covariates included whether the patient had been admitted to any Premier network hospital in the previous 6 months, and whether the patient was admitted from the emergency depart-ment, by physician referral, or by inter-facility transfer. Hospi-tal-specific covariates included number of beds, urban location, whether the site was a teaching hospital, and region (Northeast, Midwest, West, or South as defined by US Census data). Time trends were controlled for using year and quarter dummies.
Treatment is assigned randomly in clinical trials to avoid confounding; however, there is potential for selec-tion bias in observational research from unobserved factors that may influ-ence study outcomes.27,28 because it is likely to be administered to individuals who are less healthy, ONS use could be spuriously associated with increased LOS. Additionally, only certain patient
health-related risk factors were directly observable with avail-able data. Therefore, further methods were used to remove these sources of potential selection bias: propensity score matching and instrumental variables analysis.
Propensity Score Matching. To diminish the potential for confounding due to differences in observed personal char-acteristics and to identify nutritionally at-risk patients, pro-pensity score matching29 was used to match ONS episodes to similar non-ONS episodes. The probability of receiving ONS was estimated using a logistic regression of ONS based on the covariates noted above. After removing all episodes involving children (<18 years) and tube feeding, each ONS episode was matched to its nearest non-ONS episode neighbor.
Instrumental Variables Analysis. Instrumental variable analysis was used to specifically address potential bias due to nonrandomized treatment selection, which could not be ad-dressed with propensity matching alone. Instrumental variables can remove the effect of selection bias and identify the causal effect of a treatment on outcomes.30-32 Using this method re-quires an instrument that correlates with the treatment of interest but does not affect the outcome, except through its influence on the likelihood of receiving treatment.
For this analysis, the selected instrument was the fraction of episodes involving any ONS use in a given hospital in a given quarter. by looking at changes in ONS use based on a hospital’s inclination to prescribe it, rather than underlying patient characteristics, the unbiased identification of the ef-fect of ONS was made feasible. Since instrumental variable properties are best understood in linear settings,33 this instru-ment was applied to linear models of the 3 outcomes. Several tests of the instrument’s validity were performed.
To control further for unobserved patient heterogeneity, the model included fixed effects for groups based on how long patient data remained observable prior to loss to follow-up. These fixed-effects “follow-up” groups were no patient fol-low-up data; 1 day through 1 year of follow-up; 1 to 2 years of follow-up; 2 to 3 years of follow-up; and more than 3 years of follow-up. because life expectancy cannot generally be ob-served in the Premier database (except when individuals die in a Premier network hospital), follow-up duration served as
Take-Away PointsMalnutrition is a serious but underappreciated problem among hospitalized patients. There is relatively little evidence evaluating the large-scale effectiveness of therapeutic interventions against malnutrition. We conducted an instrumental variables analysis to determine the effect of oral nutritional supplement use in the inpatient setting.
n Use of oral nutrition supplements decreased length of stay, episode cost, and prob-ability of 30-day readmission.
n By increasing oral nutrition supplement use, hospitals can improve hospitalization outcomes and decrease healthcare spending.
VOL. 19, NO. 2 n THE AMERICAN JOURNAL OF MANAGED CARE n 123
impact of Oral nutritional Supplementation on Hospital Outcomes
among patients eventually readmitted). This approach also pro-vided a conservative estimate of the total impact of ONS on readmission.
Return on Investment Calculations. Next, estimates for the effect of ONS on LOS, episode cost, and readmission probability were used to calculate a return on investment (ROI) for ONS use, using the following formula:
ROI =savings generated through ONS use – amount spent on ONS
amount spent on ONS
The above formula yields the “episode cost” ROI of ONS use through reduced episode cost. Savings generated from ONS use were defined as the average reduction in episode cost due to ONS use. The amount spent on ONS was the average episode cost of ONS use. For readmission ROI, the average
a proxy for underlying health status. Observed follow-up us-ing hospital-based data may be a preferable measure of over-all patient frailty, because the diagnostic codes present in a single episode (vs multiple follow-up episodes) are unlikely to reflect the full range of patient comorbidities.
Additional Modeling of Readmissions. For the readmission outcome, the matched sample was restricted to episodes where the patient was known to be at risk of readmission following discharge. If patients did not die following hospitalization, it could be assumed ONS had 2 potential benefits: it prevented readmissions by making people healthy, or it delayed readmis-sions among those eventually readmitted. because the Premier data did not distinguish between patients not readmitted due to recovery and those not readmitted due to death, the cur-rent study could only measure the effect of delayed readmission (by calculating the change in 30-day readmission probability
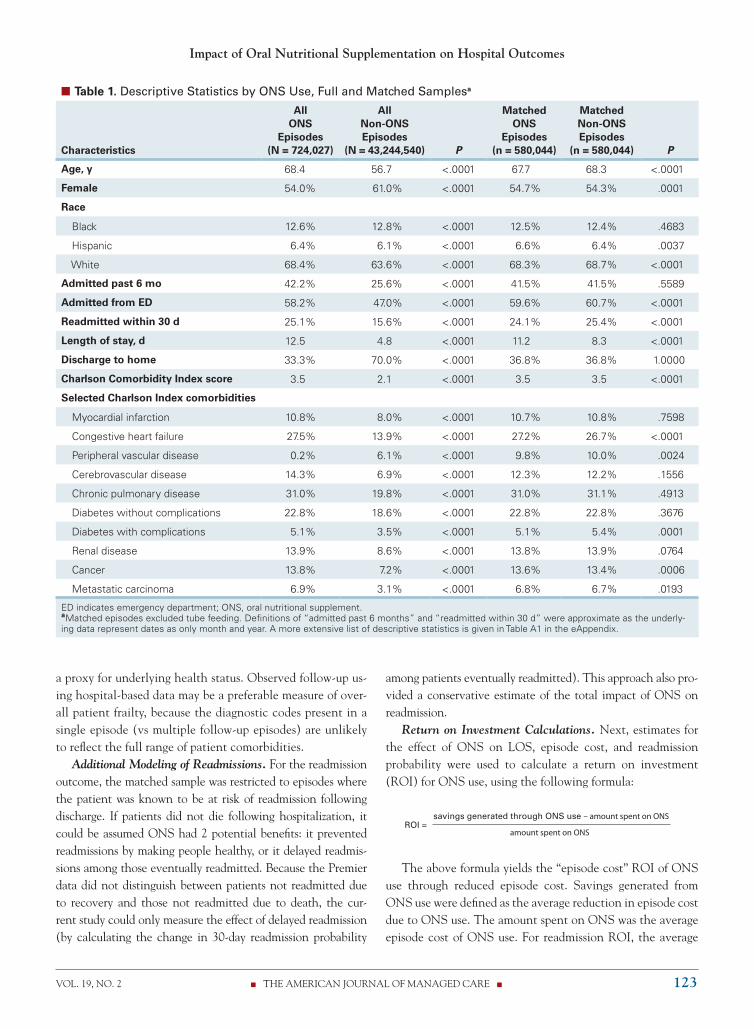
n Table 1. Descriptive Statistics by ONS Use, Full and Matched Samplesa
Characteristics
All ONS
Episodes (N = 724,027)
All Non-ONS Episodes
(N = 43,244,540)
P
Matched ONS
Episodes (n = 580,044)
Matched Non-ONS Episodes
(n = 580,044)
P
Age, y 68.4 56.7 <.0001 67.7 68.3 <.0001
Female 54.0% 61.0% <.0001 54.7% 54.3% .0001
Race
Black 12.6% 12.8% <.0001 12.5% 12.4% .4683
Hispanic 6.4% 6.1% <.0001 6.6% 6.4% .0037
White 68.4% 63.6% <.0001 68.3% 68.7% <.0001
Admitted past 6 mo 42.2% 25.6% <.0001 41.5% 41.5% .5589
Admitted from ED 58.2% 47.0% <.0001 59.6% 60.7% <.0001
Readmitted within 30 d 25.1% 15.6% <.0001 24.1% 25.4% <.0001
Length of stay, d 12.5 4.8 <.0001 11.2 8.3 <.0001
Discharge to home 33.3% 70.0% <.0001 36.8% 36.8% 1.0000
Charlson Comorbidity Index score 3.5 2.1 <.0001 3.5 3.5 <.0001
Selected Charlson Index comorbidities
Myocardial infarction 10.8% 8.0% <.0001 10.7% 10.8% .7598
Congestive heart failure 27.5% 13.9% <.0001 27.2% 26.7% <.0001
Peripheral vascular disease 0.2% 6.1% <.0001 9.8% 10.0% .0024
Cerebrovascular disease 14.3% 6.9% <.0001 12.3% 12.2% .1556
Chronic pulmonary disease 31.0% 19.8% <.0001 31.0% 31.1% .4913
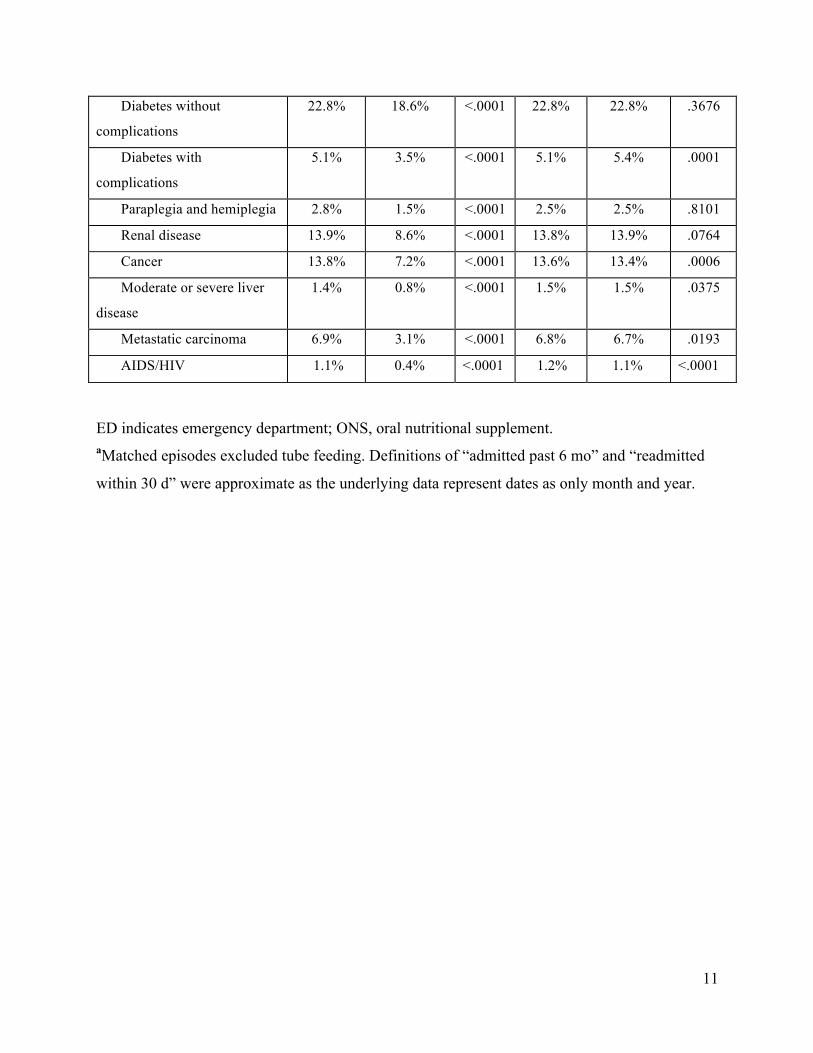
Diabetes without complications 22.8% 18.6% <.0001 22.8% 22.8% .3676
Diabetes with complications 5.1% 3.5% <.0001 5.1% 5.4% .0001
Renal disease 13.9% 8.6% <.0001 13.8% 13.9% .0764
Cancer 13.8% 7.2% <.0001 13.6% 13.4% .0006
Metastatic carcinoma 6.9% 3.1% <.0001 6.8% 6.7% .0193
ED indicates emergency department; ONS, oral nutritional supplement. aMatched episodes excluded tube feeding. Definitions of “admitted past 6 months” and “readmitted within 30 d” were approximate as the underly-ing data represent dates as only month and year. A more extensive list of descriptive statistics is given in Table A1 in the eAppendix.

124 n www.ajmc.com n FEbRUARy 2013
n clinical n
episode cost among the readmitted population was multiplied by the reduction in the probability of readmission to calculate the savings generated through ONS use. The amount spent on ONS was defined as for the episode cost ROI.
Computation. Analyses were performed using Stata ver-sion 11 (StataCorp LP, College Station, Texas). A 2-sided P value of .05 or less was considered statistically significant. A detailed summary of additional testing and sensitivity analyses conducted to validate study results can be found in the eap-pendix (available at www.ajmc.com).
RESULTS From 46.1 million inpatient episodes and 810,589 epi-
sodes involving ONS use, we excluded 306,528 tube-feeding episodes, 1,798,907 involving patients under age 18 years, 112 with incomplete data, and 19,817 terminal episodes to obtain a sample of 44.0 million episodes and 724,027 ONS episodes. The overall rate of ONS use in adult inpatient episodes was 1.6%. Each adult ONS episode was matched to an adult non-ONS episode, to obtain a matched sample of 1,160,088 episodes.
Mean characteristics of ONS episodes, all non-ONS epi-sodes, and matched non-ONS episodes are reported in Table 1. Compared with general non-ONS inpatient episodes, in-dividuals receiving ONS were older (age 68.4 vs 56.7 years) and less healthy on various dimensions; and 42.2% of ONS episodes were preceded by an admission in the prior 6 months, compared with only 25.6% for non-ONS episodes. The aver-age LOS for an ONS episode was 12.5 days compared with 4.8 days for non-ONS episodes.
Table 2 shows the characteristics of matched ONS sample subgroups by follow-up group. Patient ONS use was highly
correlated with other health markers, including prior admis-sion history, LOS, episode cost, and Charlson Comorbidity Index score.
Length of StayOrdinary least squares regression analysis performed on
the full matched sample showed that ONS use was associated with a 2.9-day (95% confidence interval [CI] 2.8-3.0 days), or 34.7%, increase in LOS, from 8.3 to 11.2 days. However, when instrumental variables regression analysis was used to account for selection bias, ONS lowered LOS by 2.3 days (95% CI -2.4 to -2.2 days), or 21.0%, from 10.9 to 8.6 days (Table 3, columns 1 and 2).
Next, to determine whether the effect of ONS differed depending on the underlying health status of the treated in-dividual, the instrumental variables regression analysis was repeated on matched sample subgroups, sorted by duration of observed follow-up. For this comparison, all episodes with no observed follow-up were dropped. Once the matched sample was restricted in this way (Table 3, columns 3-6), episodes with longer follow-up duration were successively dropped to create an increasingly sick sample moving from column 3 (patients with at least 1 day of follow-up) to column 6 (patients with 1 day to 1 year of follow-up). When the data were grouped in this way, it became apparent that ONS had the greatest LOS benefit for the sickest group (-22.8%) and a smaller, but still significant, benefit for the healthiest group (-16.3%).
Episode CostOrdinary least squares regression analysis showed that ONS
use was associated with an increased episode cost of $7598 (95% CI $7579-$7617), or 50.7%, from $14,998 to $22,596
n Table 2. Mean Characteristics of Matched ONS Sample Subgroups
Mean by Group
Episode Characteristic
All
(N = 1,160,088)
No Follow-up (n = 297,128)
Follow-up 1 d to <1 y
(n = 566,682)
Follow-up 1 y to <2 y
(n = 104,141)
Follow-up 2 y to <3 y
(n = 64,813)
Follow-up >3 y
(n = 127,324)
Age, y 68.0 67.1 68.8 68.9 68.3 65.5
Female 54.5% 53.3% 53.6% 56.4% 57.7% 58.3%
Admitted past 6 mo 41.5% 33.2% 43.5% 49.2% 46.7% 42.4%
Admitted from ED 60.1% 58.8% 60.1% 63.9% 63.2% 58.7%
Discharged to home 36.8% 35.8% 33.2% 40.3% 42.5% 49.1%
Readmitted within 30 d 24.7% 0.0% 36.2% 29.5% 27.8% 25.6%
Length of stay, d 9.7 10.0 9.9 9.1 9.1 9.0
Episode cost $18,981 $20,414 $19,381 $16,763 $16,704 $16,825
Charlson Comorbidity Index score
3.5 3.5 3.8 3.3 3.0 2.5
ED indicates emergency department; ONS, oral nutritional supplements.

VOL. 19, NO. 2 n THE AMERICAN JOURNAL OF MANAGED CARE n 125
impact of Oral nutritional Supplementation on Hospital Outcomes
(Table 4, column 1). However, when the instrumental vari-ables method was applied to the full matched sample (Table 4, column 2), ONS use decreased episode cost by $4734 (95% CI -$4754 to -$4714), or 21.6%, from $21,950 to $17,216. When the matched samples were grouped in terms of dura-tion of known follow-up (Table 4, columns 3-6), a clear pat-tern was observed, with the largest ONS benefit going to the sickest individuals. Episode cost savings ranged from 17.9% to 24.0% for the healthiest to the sickest subgroups, respectively.
ReadmissionIn the known follow-up subsample, naïve OLS regres-
sions showed that ONS use was associated with a 0.3 per-centage point (95% CI -0.005 to -0.001), or 0.9%, decrease in readmission probability, from 33.4% to 33.1% (Table 5, column 1). Instrumental variables regression results demon-strated that ONS use led to a 2.3 percentage point (95% CI −0.027 to −0.019), or 6.7%, decrease in the probabil-ity of readmission among episodes with any follow-up, from 34.3% to 32.0% (Table 5, column 2). Assuming conserva-tively that ONS provided no benefit to patients never read-mitted and served only to delay readmissions among those who were eventually readmitted, this finding implied that ONS decreased the probability of readmission in the full matched sample by at least 6.9% (measured as a 0.0231 re-duction in readmission probability multiplied by the 74% of the matched sample eventually readmitted, divided by a baseline 30-day readmission rate of 24.7% in the matched sample). Grouping the subsample with known follow-up by underlying health status (Table 5, columns 2-5) again shows a clear pattern of the largest benefit of ONS use going to the sickest individuals (14.1%).
Return on Investment Use of ONS cost an average of $88.26 per episode. This
cost included the cost of ONS and associated labor and ad-ministrative expenses, based on hospital reporting. When held against the estimate (Table 4, Column 2) that ONS use generates $4734 in savings per episode, this amounted to an ROI of $52.63 in net savings for every dollar spent on ONS in terms of reduced episode cost.
To calculate readmission ROI, it was assumed that hospi-tal sites could not distinguish between individuals who would eventually be readmitted and those who would not, and there-fore had to administer ONS to all matched sample patients. As noted previously, study estimates indicated that ONS de-creased readmission probability by 0.0231 for the 74% of the matched sample eventually readmitted. This conservatively assumed no benefit from readmission prevention for the other 26%. This effect was then multiplied by $18,478 (the average population episode cost for inpatient readmission), resulting in an estimated $314.13 in savings per episode due to ONS use. This translated into an ROI of at least $2.56 in net sav-ings due to averted 30-day readmissions for every dollar spent on ONS in the matched sample.
DISCUSSION This study found that ONS use in hospitalized patients
led to substantial reductions in LOS, episode cost, and 30-day readmissions. Specifically, ONS use resulted in a 2.3-day (21.0%) LOS decrease, $4734 (21.6%) in decreased episode costs, and a 6.7% decrease in 30-day readmissions among patients eventually readmitted. Conservatively assuming no benefit to those never readmitted, these outcomes translated
n Table 3. Effect of ONS Use on Length of Staya
Regression Specification
(1) (2) (3) (4) (5) (6)
Subset of Matched Sample Analyzed
All
All
Follow-up at least 1 d
Follow-up 1 d to 3 y
Follow-up 1 d to 2 y
Follow-up 1 d to 1 y
Model OLS IV IV IV IV IV
Effect of any ONS use on LOS, d (SE)
2.879b (0.0432) −2.291b (0.0657) −1.714b (0.0721) −2.299b (0.0843) −2.407b (0.0892) −2.585b (0.103)
Predicted LOS without ONS, d 8.30 10.88 10.5 10.93 11.07 11.32
Predicted LOS with ONS, d 11.18 8.59 8.79 8.63 8.66 8.74
Change due to ONS use 34.7% −21.0% −16.3% −21.0% −21.8% −22.8%
Observations, n 1,160,088 1,160,088 862,960 735,636 670,823 566,682
IV indicates instrumental variable; LOS, length of stay; OLS, ordinary least squares; ONS, oral nutritional supplement; SE, standard error. aRegression results were from a sample of ONS episodes matched 1:1 to non-ONS episodes on propensity to receive ONS. Terminal episodes and tube-fed episodes were excluded. The instrument was the fraction of episodes in a given hospital in a given quarter involving ONS use. Standard errors took into account repeated observations of the same individual. bSignificant at the 1% level.

126 n www.ajmc.com n FEbRUARy 2013
n clinical n
to a minimum 6.9% decrease in readmissions among the full matched sample of all ONS episodes and similar non-ONS episodes. The study of 30-day readmissions is particularly relevant, given new Medicare rules that may make hospitals liable for some readmissions within 30 days.34-40
These gains, it is important to note, are consistent with re-sults from previous randomized controlled trials. In a study of general inpatients, Somanchi and colleagues found that early nutritional intervention reduced LOS by 1.93 days (P = .003), and in a severely malnourished subpopulation, reduced LOS by 3.2 days (P = .052).3 In a UK-based study, Lawson and col-leagues found that ONS was associated with a 6% reduction in episode cost.19 Somanchi et al found a $1514 episode cost decrease among severely malnourished patients.3 This cost re-duction was lower than that observed in the current study. How-ever, Somanchi et al calculated cost savings as number of days of reduced LOS multiplied by average cost of additional days. This approach did not take into account that ONS use might make the inpatient stay less resource intensive, not just shorter.
In a trial with malnourished patients, Norman and col-leagues found that ONS use decreased 3-month readmissions from 48% to 26%.23 Likewise, Gariballa and colleagues found that ONS use led to a 28% reduction in 6-month readmis-sions, from 40% to 29% (adjusted hazard ratio 0.68 [95% CI = 0.49-0.94]).22 However, in both of these randomized con-trolled trials, ONS use was sustained postdischarge. For the current study, it was not possible to determine whether pa-tients continued ONS after leaving the hospital.
because ONS is inexpensive to provide, the sizable savings generated make it a cost-effective therapy. From the health-
care perspective, for every dollar spent on ONS, the ROI was $52.63 in immediate net episode cost savings and $2.56 in net savings from avoided 30-day readmissions. The 1:1 matched sample estimates imply that doubling ONS use by targeting patients similar to current ONS users is likely to produce fi-nancial returns to hospitals and improve patient outcomes. Sensitivity analyses suggest that further increases beyond doubling may continue to generate positive results, but more research is needed on this point.
The current study has 2 key advantages over previous re-search. First, it used a large database to estimate the effect of ONS based on real-world data. With 44 million adult in-patient episodes, these data were relevant and broadly repre-sentative. Second, econometric methods were used to enable causal inference regarding the impact of ONS on patient outcomes. by applying propensity score matching and instru-mental variables, potential bias due to nonrandom selection into ONS treatment was mitigated. This made it possible to estimate causal impact of ONS use on LOS, episode cost, and readmission probability.
However, the Premier Perspectives data did have limita-tions. The lack of detailed patient health information, such as laboratory test results and patient health status assessment, led to a selection challenge whereby patients receiving ONS were presumably sicker on a variety of dimensions not fully observable in the data. This limitation was addressed using propensity score matching and instrumental variables anal-ysis. In addition, the fact that it was not possible to distin-guish between avoided readmissions due to recovery, death, or transfer to a non-Premier hospital meant that analyses of
n Table 4. Effect of ONS Use on Episode Costa
Regression Specification
(1) (2) (3) (4) (5) (6)
Subset of Matched Sample Analyzed
All
All
Follow-up at least 1 d
Follow-up 1 d to 3 y
Follow-up 1 d to 2 y
Follow-up 1 d to 1 y
Model OLS IV IV IV IV IV
Effect of any ONS use on episode cost (SE)
$7598b ($9.70) −$4734b ($10.07) −$3694b ($10.47) −$4473b ($11.69) −$4873b ($12.5) −$5519b ($14.25)
Predicted episode cost without ONS
$14,998 $21,950 $20,664 $21,522 $22,028 $22,950
Predicted episode cost with ONS
$22,596 $17,216 $16,969 $17,049 $17,155 $17,431
Change due to ONS use 50.7% −21.6% −17.88% −20.78% −22.12% −24.0%
Observations, n 1,160,088 1,160,088 862,960 735,636 670,823 566,682
IV indicates instrumental variables; OLS, ordinary least squares; ONS, oral nutritional supplement; SE, standard error. aRegression results were from a sample of ONS episodes matched 1:1 to non-ONS episodes on propensity to receive ONS. Terminal episodes and tube-fed episodes were excluded. The dependent variable in the regressions was log of episode cost. Costs are in 2010 dollars. The instrument was the fraction of episodes in a given hospital in a given quarter involving ONS use. Predicted episode costs used Duan’s smearing estimator. Standard errors took into account repeated observations of the same individual. bSignificant at the 1% level.

VOL. 19, NO. 2 n THE AMERICAN JOURNAL OF MANAGED CARE n 127
impact of Oral nutritional Supplementation on Hospital Outcomes
the effect of ONS on readmission had to be confined to a subsample of episodes with known follow-up. Therefore, the benefit of ONS could only be quantified based on delayed, rather than prevented, readmission. The Premier data set did not provide data on ONS use following discharge. Lastly, al-though we performed multiple instrument validity tests, more comprehensive tests could be performed with hospital-specific quality measures such as report cards. In the future, research-ers with access to more comprehensive data may be able to gain additional insight on this issue.
Using the instrumental variables method, this study found that the use of ONS led to statistically significant decreases in inpatient LOS, episode cost, and readmission. Given the high prevalence of malnutrition among inpatient populations, these results suggest that ONS use could help improve out-comes at relatively low cost to the healthcare system. Today, hospitals are facing pressures to find low-cost, highly effective therapy while maintaining quality of care. by increasing ONS use, hospitals can improve hospitalization outcomes and de-crease healthcare spending.
Author Affiliations: From University of Chicago (TJP), Chicago, IL; Pre-cision Health Economics, (JTS, bS), Los Angeles, CA; University of South-ern California (DNL, DPG), Los Angeles, CA.
Funding Source: Abbott Nutrition.Author Disclosures: Dr Snider and Mr Stryckman report involvement in
the preparation of this manuscript while employed by Precision Health Eco-nomics, which received consulting fees from Abbott Nutrition. Drs Philipson, Lakdawalla, and Goldman are partners at Precision Health Economics.
Authorship Information: Concept and design (JTS, DNL, DPG, bS); ac-quisition of data (bS); analysis and interpretation of data (TJP, JTS, DNL, DPG); drafting of the manuscript (TJP, JTS, DNL, DPG, bS); critical revision of the manuscript for important intellectual content (TJP, JTS, DNL, DPG, bS); statistical analysis (JTS, bS); provision of study materials or patients
(JTS, bS); obtaining funding (TJP, JTS, DNL, DPG, bS); and supervision (TJP, JTS, DNL, DPG, bS).
Address correspondence to: Julia Thornton Snider, PhD, Precision Health Economics, 11100 Santa Monica blvd, Ste 500, Los Angeles, CA 90025. E-mail: [email protected].
REFERENCES1. Chima CS, Barco K, Dewitt ML, Maeda M, Teran JC, Mullen KD. Relationship of nutritional status to length of stay, hospital costs, and discharge status of patients hospitalized in the medicine service. J Am Diet Assoc. 1997;97(9):975-978.2. Correia MI, Waitzberg DL. The impact of malnutrition on morbidity, mortality, length of hospital stay and costs evaluated through a multi-variate model analysis. Clin Nutr. 2003;22(3):235-239.3. Somanchi M, Tao X, Mullin GE. The facilitated early enteral and dietary management effectiveness trial in hospitalized patients with malnutrition. JPEN J Parenter Enteral Nutr. 2011;35(2):209-216.4. Braunschweig C, Gomez S, Sheean PM. Impact of declines in nutri-tional status on outcomes in adult patients hospitalized for more than 7 days. J Am Diet Assoc. 2000;100(11):1316-1322.5. Schoonhoven L, Grobbee DE, Donders AR, et al; prePURSE Study Group. Prediction of pressure ulcer development in hospitalized pa-tients: a tool for risk assessment. Qual Saf Health Care. 2006;15(1): 65-70.6. Fry DE, Pine M, Jones BL, Meimban RJ. Patient characteristics and the occurrence of never events. Arch Surg. 2010;145(2):148-151.7. Schneider SM, Veyres P, Pivot X, et al. Malnutrition is an independent factor associated with nosocomial infections. Br J Nutr. 2004;92(1): 105-111.8. Allaudeen N, Vidyarthi A, Maselli J, Auerbach A. Redefining readmission risk factors for general medicine patients. J Hosp Med. 2011;6(2):54-60.9. Mudge AM, Kasper K, Clair A, et al. Recurrent readmissions in medi-cal patients: a prospective study. J Hosp Med. 2011;6(2):61-67.10. Gariballa S, Forster S. Malnutrition is an independent predictor of 1-year mortality following acute illness. Br J Nutr. 2007;98(2):332-336.11. Sullivan DH, Walls RC. Protein-energy undernutrition and the risk of mortality within six years of hospital discharge. J Am Coll Nutr. 1998;17(6):571-578.12. Sullivan DH, Sun S, Walls RC. Protein-energy undernutrition among elderly hospitalized patients: a prospective study. JAMA. 1999;281(21): 2013-2019.
n Table 5. Effect of ONS Use on 30-Day Readmissiona
Regression Specification
(1) (2) (3) (4) (5)
Subset of Matched Sample Analyzed
Follow-up at least 1 d
Follow-up at least 1 d
Follow-up 1 d to 3 y
Follow-up 1 d to 2 y
Follow-up 1 d to 1 y
Model OLS IV IV IV IV
Effect of any ONS use on probability of readmission (SE)
−0.00310b (0.00103) −0.0231b (0.00204) −0.0475b (0.00225) −0.0504b (0.00235) −0.0550b (0.00254)
Predicted probability of readmission without ONS
0.334 0.343 0.369 0.377 0.391
Predicted probability of readmission with ONS
0.331 0.320 0.322 0.327 0.336
Change due to ONS use −0.9% −6.7% −12.7% −13.3% −14.1%
Observations, n 862,960 862,960 735,636 670,823 566,682
IV indicates instrumental variables; OLS, ordinary least squares; ONS, oral nutritional supplements; SE, standard error. aThe 30-day readmission window was approximate as only the month and year were observed in the data. Regression results were from a sample of ONS episodes matched 1:1 to non-ONS episodes on propensity to receive ONS. Terminal episodes and tube-fed episodes were excluded. The instrument was the fraction of episodes in a given hospital in a given quarter involving ONS use. Standard errors took into account repeated observations of the same individual. bSignificant at the 1% level.

128 n www.ajmc.com n FEbRUARy 2013
n clinical n
13. Bauer JD, Isenring E, Torma J, Horsley P, Martineau J. Nutritional status of patients who have fallen in an acute care setting. J Hum Nutr Diet. 2007;20(6):558-564.14. Naber TH, Schermer T, de Bree A, et al. Prevalence of malnutrition in nonsurgical hospitalized patients and its association with disease complications. Am J Clin Nutr. 1997;66(5):1232-1239.15. McWhirter JP, Pennington CR. Incidence and recognition of malnu-trition in hospital. BMJ. 1994;308(6934):945-948.16. Pirlich M, Schütz T, Norman K, et al. The German hospital malnutri-tion study. Clin Nutr. 2006;25(4):563-572.17. Planas M, Audivert S, Pérez-Portabella C, et al. Nutritional status among adult patients admitted to an university-affiliated hospital in Spain at the time of genoma. Clin Nutr. 2004;23(5):1016-1024.18. Lyder CH, Preston J, Grady JN, et al. Quality of care for hospital-ized medicare patients at risk for pressure ulcers. Arch Intern Med. 2001;161(12):1549-1554.19. Lawson RM, Doshi MK, Barton JR, Cobden I. The effect of unselec-ted post-operative nutritional supplementation on nutritional status and clinical outcome of orthopaedic patients. Clin Nutr. 2003;22(1): 39-46.20. Beattie AH, Prach AT, Baxter JP, Pennington CR. A randomised con-trolled trial evaluating the use of enteral nutritional supplements post-operatively in malnourished surgical patients. Gut. 2000;46(6):813-818.21. Gariballa S, Forster S. Effects of dietary supplements on depressive symptoms in older patients: a randomised double-blind placebo-con-trolled trial. Clin Nutr. 2007;26(5):545-551.22. Gariballa S, Forster S, Walters S, Powers H. A randomized, double-blind, placebo-controlled trial of nutritional supplementation during acute illness. Am J Med. 2006;119(8):693-699.23. Norman K, Kirchner H, Freudenreich M, Ockenga J, Lochs H, Pirlich M. Three month intervention with protein and energy rich supplements improve muscle function and quality of life in malnourished patients with non-neoplastic gastrointestinal disease—a randomized controlled trial. Clin Nutr. 2008;27(1):48-56.24. Jensen MB, Hessov I. Dietary supplementation at home improves the regain of lean body mass after surgery. Nutrition.1997;13(5):422-430.25. Charlson ME, Pompei P, Ales KL, MacKenzie CR. A new method of classifying prognostic comorbidity in longitudinal studies: develop-ment and validation. J Chronic Dis. 1987;40(5):373-383.26. Charlson ME, Sax FL, MacKenzie CR, Braham RL, Fields SD, Douglas RG Jr. Morbidity during hospitalization: can we predict it? J Chronic Dis. 1987;40(7):705-712.27. Linden A, Adams JL. Evaluating disease management programme effectiveness: an introduction to instrumental variables. J Eval Clin Pract. 2006;12(2):148-15å4.28. Goldman DP, Bhattacharya J, McCaffrey DF, et al. Effect of insur-ance on mortality in an HIV-positive population in care. J Am Stat Assoc. 2001;96(455):883-894.
29. Rubin DB. Estimating causal effects from large data sets using propensity scores. Ann Intern Med. 1997;127(8, pt 2):757-763.
30. Bao Y, Duan N, Fox SA. Is some provider advice on smoking ces-sation better than no advice? an instrumental variable analysis of the 2001 National Health Interview Survey. Health Serv Res. 2006;41(6): 2114-2135.
31. McClellan M, McNeil BJ, Newhouse JP. Does more intensive treat-ment of acute myocardial infarction in the elderly reduce mortality? analysis using instrumental variables. JAMA. 1994;272(11):859-866.
32. Newhouse JP, McClellan M. Econometrics in outcomes research: the use of instrumental variables. Annu Rev Public Health. 1998; 19:17-34.
33. Staiger D, Stock JH. Instrumental variables regression with weak instruments. Econometrica. 1997;65(3):557-586.
34. Centers for Medicare & Medicaid Services. Medicare Program; Hospital Inpatient Prospective Payment Systems for Acute Care Hos-pitals and the Long-Term Care Hospital Prospective Payment System and Fiscal Year 2012 Rates; Revisions to the Reductions and Increases to Hospitals’ FTE Resident Caps for Graduate Medical Education Payment. CMS-1518-F. https://www.cms.gov/Medicare/Medicare-Fee-for-Service-Payment/AcuteInpatientPPS/FY-2012-IPPS-Final-Rule-Home-Page-Items/CMS1250103.html. Published 2011. Accessed January 7, 2013.
35. Andrews M. Health law forces changes to reduce hospitals read-missions. Kaiser Health News. http://www.kaiserhealthnews.org/fea-tures/insuring-your-health/michelle-andrews-on-hospital-readmissions.aspx?referrer=search. Published February 22, 2011. Accessed January 7, 2013.
36. Centers for Medicare & Medicaid Services. Acute patient PPS: overview. http://www.cms.gov/AcuteInpatientPPS/01_overview.asp. Published 2011. Accessed February 15, 2012.
37. Foster D, Harkness G. Healthcare reform: pending changes to reimbursement for 30-day readmissions. In: Research Brief 2010. Ann Arbor, MI: Thomson Reuters; August 2010.
38. Gold N. 3 Readmissions to reduce now. http://www.healthlead-ersmedia.com/page-1/COM-263665/3-Readmissions-to-Reduce-Now. Published March 15, 2011. Accessed February 14, 2012.
39. Stone J, Hoffman GJ. Medicare Hospital Readmissions: Issues, Policy Options and PPACA. Congressional Research Service. http://www.pascenter.org/publications/publication_home.php?id=1230. Published September 1, 2010. Accessed January 7, 2013.
40. Thorpe JH, Cascio T. Medicare hospital readmissions reduction program. Legal Notes. Volume 3, issue 4. http://www.rwjf.org/en/research-publications/find-rwjf-research/2011/10/medicare-hospital-readmissions-reduction-program.htm. Published October 1, 2011. Accessed January 7, 2013. n

1
n eAppendix. Additional Technical Details on the Definition of Oral Nutritional Supplement
Use, Definition of Covariates, Episode Cost Predictions, Readmissions Modeling, Instrument
Validity Tests, and Sensitivity Analysis
Definition of ONS Use
Oral nutritional supplement (ONS) use was defined as a binary indicator that any amount of
ONS was used during an inpatient episode. There are no International Classification of Diseases,
Ninth Revision (ICD-‐9) or Current Procedural Terminology (CPT) codes that identify ONS use.
However, the Premier Perspectives data are derived from hospital billing records, and therefore
contain not only diagnoses and procedures but also a detailed list of products provided during
the inpatient stay, to be used for billing purposes. Use of ONS was flagged for any episode
indicating the provision of “complete nutritional supplement, oral,” as classified by the Premier
data. The list of products corresponding to the Premier definition of ONS was manually
checked; to ensure that these products were actually used orally, we dropped all episodes
involving tube feeding. (To identify episodes involving tube feeding, we used CPT codes 43246,
43653, 43750, 43832, 44372, 44373, 74350, 43246, 49440, 49441, 43241, and 43752, and ICD-‐9
procedure codes 43.1, 43.11, 43.19, 44.32, V44.1, 44.4, and 46.432.)
Definition of Specific Covariates
Marital status was coded as a dummy indicating whether the patient was married at the time of
the episode. Race was coded as dummies indicating black, white, or Hispanic race. Insurance
status was coded as dummies indicating whether the payer was Medicare, Medicaid, or managed
care.
Charlson Comorbidity Index components were acute myocardial infarction, congestive
heart failure, peripheral vascular disease, cerebrovascular disease, dementia, chronic pulmonary
disease, connective tissue disease, peptic ulcer disease, mild liver disease, diabetes without
complications, diabetes with complications, paraplegia and hemiplegia, renal disease, cancer,
moderate or severe liver disease, metastatic carcinoma, and HIV/AIDS. Table A1 presents
descriptive statistics by ONS use.
2
Episode Cost Predictions
To estimate the effect of ONS on episode cost, the natural logarithm of episode cost on ONS use
and covariates was regressed using the instrumental variables method. To reduce the influence of
outliers, the log of cost was applied as the dependent variable. Duan’s smearing estimator was
used to translate the predicted values back to dollars.1
Readmissions Modeling
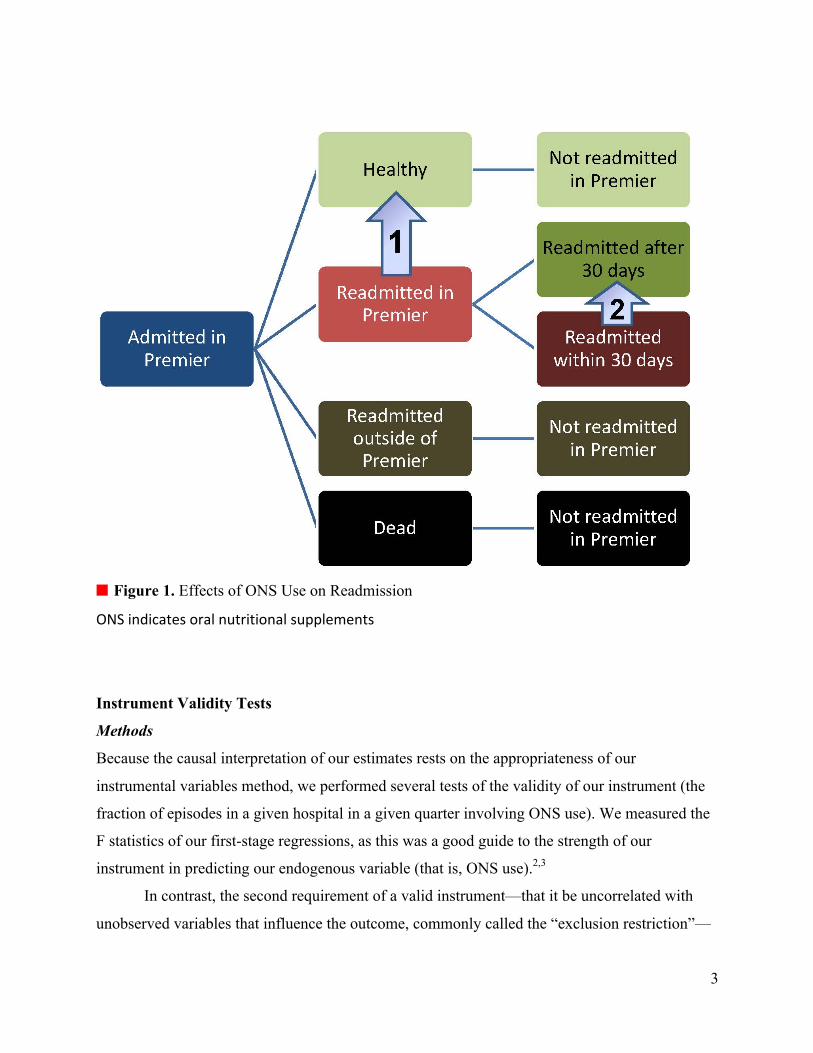
After patients were discharged from the hospital, 1 of 4 outcomes was possible: (1) The
individual might become healthy, in which case they would not return to the hospital. (2) The
individual might be readmitted within the Premier hospital network. (3) The individual might be
readmitted out of the Premier hospital network. (4) The individual might die. The Figure
illustrates the conceptual relationship between ONS and readmission, as it is measured in the
Premier database.
Use of ONS has 2 potential effects on 30-day readmission: it may prevent readmission by
shifting individuals from the readmitted state to the healthy state (effect 1), or it may delay
readmission by shifting readmitted individuals from the state of being readmitted within 30 days
to the state of being readmitted past 30 days. Because the Premier data did not distinguish
between individuals not readmitted due to recovery and those not readmitted due to death, this
analysis by necessity focuses on delays in readmission (effect 2).
3
n Figure 1. Effects of ONS Use on Readmission
ONS indicates oral nutritional supplements
Instrument Validity Tests
Methods
Because the causal interpretation of our estimates rests on the appropriateness of our
instrumental variables method, we performed several tests of the validity of our instrument (the
fraction of episodes in a given hospital in a given quarter involving ONS use). We measured the
F statistics of our first-stage regressions, as this was a good guide to the strength of our
instrument in predicting our endogenous variable (that is, ONS use).2,3
In contrast, the second requirement of a valid instrument—that it be uncorrelated with
unobserved variables that influence the outcome, commonly called the “exclusion restriction”—
1
2
4
could not be tested directly. Although by design our instrument removed any personal
characteristics from the estimation of the effect of ONS, it is possible that our instrument could
have been correlated with unobserved provider-level characteristics that influenced outcomes,
such as hospital quality. To test whether this might have been the case, we performed 2 tests to
address the validity of the exclusion restriction.
The first test involved measuring whether the instrument was correlated with hospital
quality, as measured by the adoption of new technologies. We regressed our instrument on all
provider characteristics (as listed in the above covariates), a time trend, and a set of dummies
measuring the adoption of new, high-technology procedures. We created flags identifying
whether a provider had billed using CPT codes for any of the following procedures: angioplasty
stents (35470, 35471, 35472, 35473, 35474, 35475, 35476, 37205, and 37206), cardiac
catheterization (93451-93533), endovascular graft (33880, 3388, 75956, and 75957), image-
guided surgery (61781, 61782, and 77011), implantable neurostimulator (0171T and 0172T),
implantable cardioverter (93282-93284, 93289, 93296, and 93295), infused bone graft (27759),
intraoperative magnetic resonance imaging (70557-70559), Kinetra (61863, 61864, 61874,
61868, 61880, 61885, 61886, 95970, 95978, and 95979), minimally invasive surgery (44180,
43644, 449770, and 45397), and thrombolytics (37201 and 75896). We performed a second
regression that also included the average of all episode characteristics from the covariates
(excluding the follow-up group fixed effects). These regressions tested whether hospitals using
ONS more intensively also systematically adopt new technologies earlier; if true, this might
create problems by creating a correlation between high ONS use and better patient care on
dimensions unrelated to ONS use.
As a second test of the validity of the exclusion restriction, we compared episode
characteristics across high and low ONS propensity hospitals. The purpose of this test was to
investigate the extent to which high ONS propensity hospitals had healthier patients or more
favorable outcomes to begin with. Because we were concerned with the underlying
characteristics of the hospital and not merely those (relatively uncommon) episodes in which a
decision to provide ONS was made, we calculated a hospital’s mean episode characteristics
using all episodes within the given hospital, rather than just those selected into the matched
sample.
5
To do this, we sorted all hospitals in the data by the fraction of their episodes that
involved ONS use, which enabled us to define high ONS propensity and low ONS propensity
hospitals. We used 2 alternative definitions of high and low ONS propensity. According to the
first definition, hospitals with ONS use below the 5th percentile were considered low ONS
propensity hospitals, while hospitals with ONS use above the 95th percentile were considered
high ONS propensity hospitals. According to the second definition, we specified low ONS
propensity as below the 50th percentile and high ONS propensity as above the 50th percentile.
Mean episode characteristics were calculated and compared using 2-tailed t tests across the low
ONS propensity and the high ONS propensity hospitals.
Results
To test for relevance, we predicted ONS use using all covariates in our model as well as our
instrument. (This is known as the “first stage” regression.) A typical rule of thumb suggests that
an F statistic over 10 largely eliminates bias created by an insufficiently relevant instrument.3
Our F statistic was 6273.10 in the full matched sample and 2416.54 in the subsample with the
smallest F statistic; thus relevance was satisfied.
The exclusion restriction could not be directly tested (because the unobserved
characteristics were indeed unobservable), but with some care, tests could be thought of that
provided insight on whether the exclusion restriction was likely to be satisfied.
In our first test of the exclusion restriction, we advanced the possible concern that ONS-
using hospitals also systematically adopt new technologies more rapidly and thus produce better
outcomes for patients. If true, the ONS use instrument would be correlated with provider quality.
We tested this hypothesis directly using 11 commonly cited cutting-edge technologies.4,5 The
question is whether ONS use is systematically positively correlated with technology adoption. Of
the 11 technologies considered, we found that 2 technologies were significantly positively
predictive of provider-level ONS use, 1 to 3 technologies were significantly negatively
predictive of provider-level ONS use (depending on whether we used the short or long list of
provider-level covariates), and the rest had no statistically significant relationship with provider-
level ONS use. In other words, there is no clear pattern between high-technology adoption and
ONS use at the provider level.
6
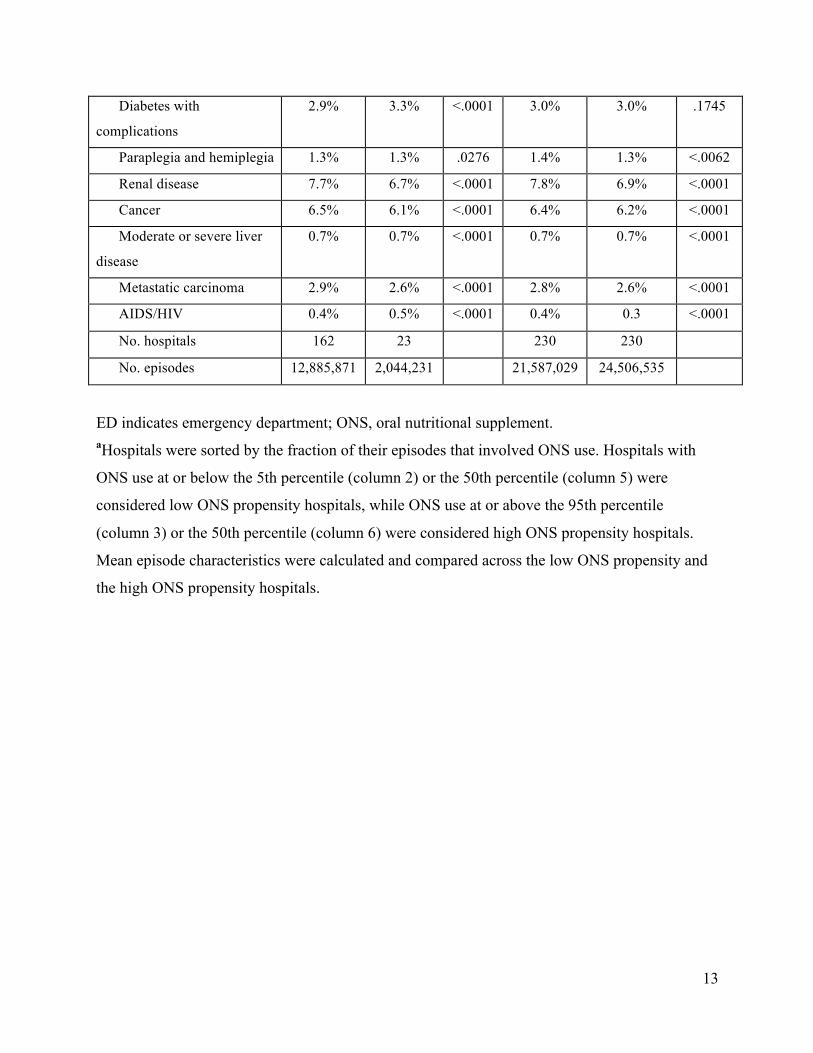
In our second test of the exclusion restriction, we compared the episode characteristics
across low and high ONS propensity hospitals, as presented in Table A2. We identified 162
hospitals with ONS use below the 5th percentile and 23 hospitals with ONS use above the 95th
percentile, containing 12,885,871 and 2,044,231 episodes, respectively. Similarly, we identified
230 hospitals with ONS use below the 50th percentile and 230 hospitals with ONS use above the
50th percentile, containing 21,587,029 and 24,506,535 episodes, respectively.
Differences between the low and high ONS propensity hospitals were typically small, yet
given the enormous sample size, nearly all differences were highly statistically significant. Some
comorbidities, such as peripheral vascular disease and cerebrovascular disease, were more
prevalent in the high ONS propensity hospitals (6.2% vs 4.9% in the 95/5 sample [P <.0001] and
5.3% vs 5.0% in the 50/50 sample [P <.0001] for peripheral vascular disease; 6.3% vs 5.7% in
the 95/5 sample [P <.0001] and 6.0% vs 5.9% in the 50/50 sample [P < .0001] for
cerebrovascular disease). Other comorbidities, such as dementia and cancer, were more prevalent
in the low ONS propensity hospitals (2.1% vs 2.3% in the 95/5 sample [P <.0001] and 2.1% vs
2.2% in the 50/50 sample [P <.0001] for dementia; 6.1% vs 6.5% in the 95/5 sample [P <.0001]
and 6.2% vs 6.4% in the 50/50 sample [P <.0001] for cancer). The average Charlson
Comorbidity Index score was 1.8 in both high and low ONS propensity hospitals, regardless of
the percentile cutoffs used to define the hospital groups. To the extent that unobserved health
status may be correlated with observed health status, this suggests that the underlying patient
health status at the high and low ONS propensity hospitals is quite similar. Therefore, the results
of this test support the validity of the instrument used in the study analyses.
Of course, these validity tests could not definitively prove the validity of our instrumental
variables approach, as the exclusion restriction was fundamentally untestable. Nevertheless,
given the variety of tests used and the lack of evidence of a positive correlation between hospital
quality and ONS use, we find the results persuasive.
Sensitivity Analysis
Methods
In our baseline analysis, we artificially restricted the size of the matched sample to 1 non-ONS
episode for every ONS episode. Our results thus showed the effect of ONS in a population of
actual ONS episodes and an equal number of similar non-ONS episodes. To gain a sense of the

7
size of the ONS-eligible population and to understand how the results would vary if the matching
were done more or less restrictively, we performed a sensitivity analysis in which we allowed as
matches all non-ONS episodes for which the propensity to receive ONS was within a given
tolerance of the associated ONS episode.
Using the same controls and stratification as in the 1-to-1 matching, we performed
matches whereby each ONS episode was matched to many non-ONS episodes. We began by
calculating the differences in propensity scores between each ONS episode and its associated
non-ONS episode in the 1-to-1 matched sample. Intuitively, this summarizes the distribution of
match quality in the baseline sample. We can construct “one-to-many” matching in a variety of
ways, using alternative criteria for match quality. For example, insisting upon high match quality
will reduce the number of matches, and vice versa. Specifically, we used the difference in
propensity scores observed at the 25th and 95th percentiles of the match quality distributions. All
non-ONS episodes whose propensity scores differed by less than this amount were matched to
their corresponding ONS episode matches. The 25th percentile sample reflected a more closely
matched sample than the base case analysis, while the 95th percentile sample was less closely
matched. We hypothesized that ONS effects would be bigger for the more closely matched
samples.
Results
We created 2 alternative matched samples by allowing any non-ONS episode to be matched to a
given ONS episode if the difference in propensity score between the ONS episode and the non-
ONS episode was less than a certain tolerance. (We then eliminated duplicate non-ONS
episodes.) As the tolerance, we selected the 25th and 95th percentile propensity score differences
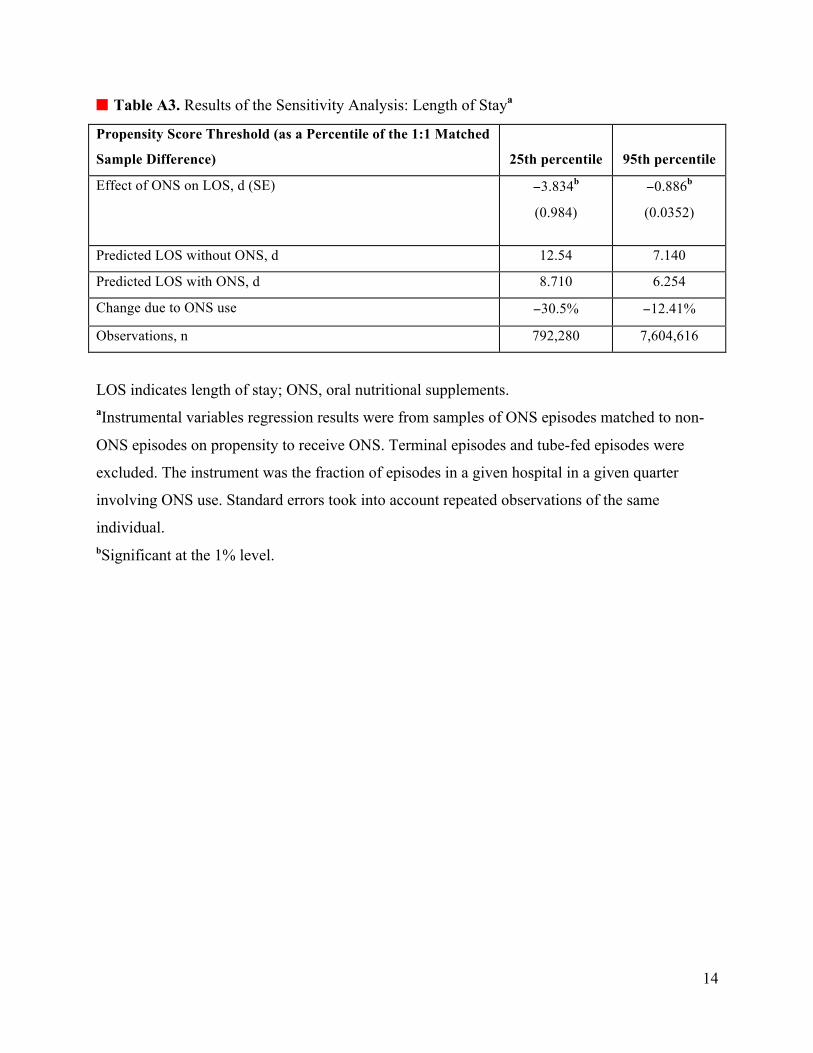
in the 1-to-1 (base case) matched sample. The results of the sensitivity analysis are presented in
Table A3 (length of stay), Table A4 (episode cost), and Table A5 (readmission). In comparison
to our base case matched sample of 1,160,088 episodes, the 25th percentile sample contained
792,280 episodes, and the 95th percentile sample contained 7,604,616 episodes.
Looking at the length of stay results (Table A3), we can see that ONS use led to a larger decrease
in length of stay in the closely matched 25th percentile sample (−3.83 days; 95% confidence
interval [CI] −4.03, −3.64), and a smaller, though still statistically significant, decrease in length
of stay in the 95th percentile sample (−0.89 days; 95% CI −0.96, −0.82). From Table A3 it is
8
also clear that the 25th percentile sample episodes involve sicker individuals, as the predicted
length of stay was considerably longer in this group (12.5 days without ONS, 8.7 days with
ONS) than in the 95th percentile sample (7.1 days without ONS, 6.3 days with ONS).
Examining the episode cost results (Table A4), we saw a similar pattern. ONS use led to
a larger decrease in episode cost in the 25th percentile sample (−$12,858; 95% CI −$12,818 to
−$12,896) and a smaller, though still statistically significant, decrease in episode cost in the 95th
percentile sample (−$3259; 95% CI −$3262 to −$3254). Again it is clear that the 25th percentile
sample contains sicker individuals, as the average episode cost was considerably larger in this
group ($31,759 without ONS, $18,901 with ONS) than in the 95th percentile sample ($14,114
without ONS, $10,855 with ONS).
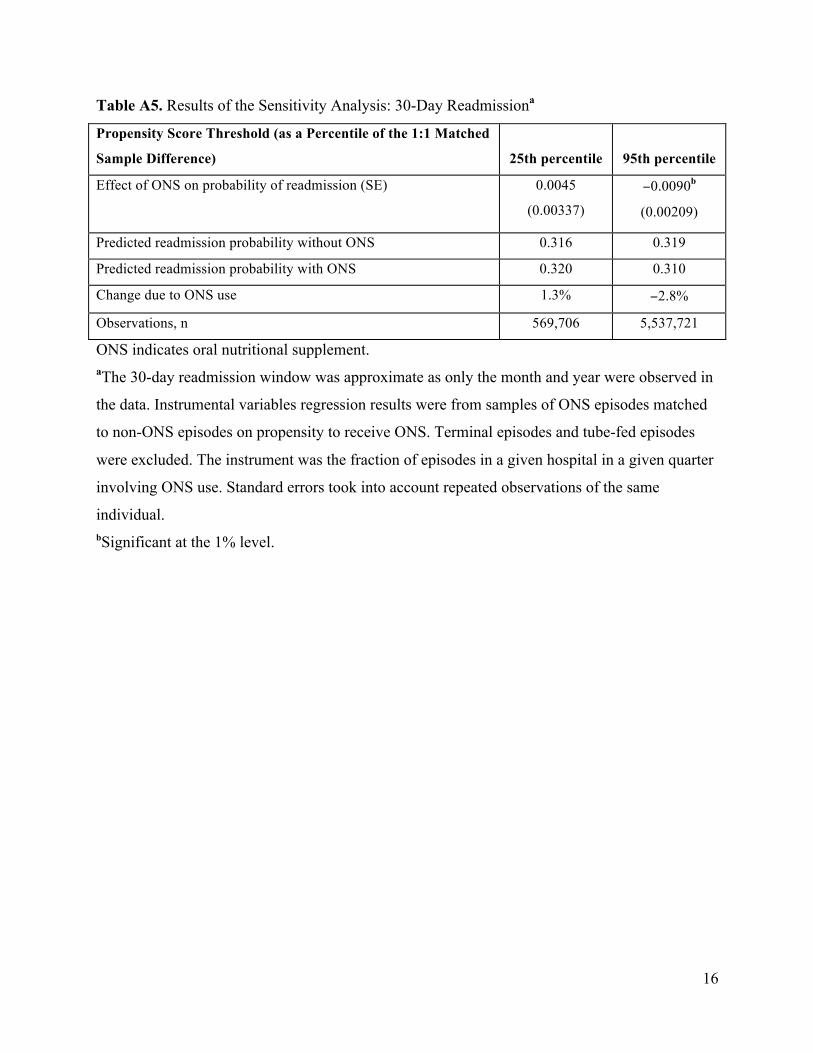
Finally, the readmission results are presented in Table A5. In this case we did not see a
monotonic relationship with the largest benefits of ONS in the more closely matched 25th
percentile sample. The change in the probability of readmission among the subset of the sample
known to be at risk of readmission (because they had at least 1 episode of follow-up) in the 25th
percentile sample was not statistically significant from zero. In the much larger 95th percentile
sample, however, there was a small but statistically significant reduction in probability of
readmission (−0.009; 95% CI −0.013 to −0.005).
Return on Investment to Hospital Through Avoided Medicare Penalties
Methods
We estimated a return on investment (ROI) to the hospital based on the readmission effects.
Starting in October 2012, Medicare was expected to institute penalties for excessive
readmissions among patients with acute myocardial infarction, congestive heart failure, or
pneumonia diagnoses.6-12 If a hospital’s risk-adjusted rate of readmissions for these patients is
considered excessive, Medicare will deny reimbursement for the excessive readmissions, up to a
certain cap.6-12 For the hospital ROI, we calculated the penalties that a hospital would avoid if
ONS were administered to all the matched non-ONS episode patients. Due to the absence of
detailed data used by Medicare in its algorithm, we approximated this ROI by assuming the
hospital had reached an excessive level of readmissions, but had not yet reached the cap.
Specifically, we restricted the sample to the Medicare population with a primary
diagnosis of 1 of the 3 affected conditions. (For acute myocardial infarction, we used

9
International Classification of Diseases, Ninth Revision, Clinical Modification [ICD-9-CM]
codes 41001, 41051, 41011, 41061, 41021, 41071, 41031, 41081, 41041, and 41091. For
congestive heart failure, we used ICD-9-CM codes 39891, 40201, 40211, 40291, 40401, 40403,
40411, 40413, 40491, 40493, 4254, and 4255. For pneumonia, we used ICD-9-CM codes 480,
481, 482, 483, 484, 485, 486, and 487.) We then multiplied the decrease in the probability of 30-
day readmission from switching the non-ONS episodes to ONS episodes by the actual cost of
readmissions for those episodes. We conservatively assumed no savings were generated from
averted readmissions, only from delays in readmissions past the 30-day window. However, we
assumed that the provider could not tell who would eventually be readmitted, so that all non-
ONS episodes were switched to ONS regardless of whether they could potentially generate a
readmission delay or not. We summed the savings over all the non-ONS episodes at a given
hospital over our sample period, and summed up the cost of the additional ONS across episodes
to obtain an ROI for the hospital.
Results
Among the population of Medicare patients admitted for acute myocardial infarction, congestive
heart failure, or pneumonia, we calculated that switching all non-ONS episodes to ONS episodes
would generate an average ROI to the provider of $3.89 in net savings for every dollar spent on
ONS (95% CI $3.61-$4.18). Because we assumed no benefit through readmissions preventions,
only through delays, and because providers differed in the extent to which their patients were
eventually readmitted, the ROI of additional ONS use varied by provider. The ROI also varied
because we used the actual cost of the readmissions to calculate the savings, and the cost of
readmissions varied by provider. The 10th percentile provider obtained an ROI of $1.79 in net
savings for every dollar spent on ONS, while the 90th percentile provider obtained an ROI of
$6.39 in net savings for every dollar spent on ONS.

10
n Table A1. Descriptive Statistics by ONS Use, Full and Matched Samplesa
Characteristics
All ONS
Episodes
(N =
724,027)
All Non-
ONS
Episodes
(N =
43,244,540) P
Matched
ONS
Episodes
(n =
580,044)
Matched
Non-ONS
Episodes
(n =
580,044) P
Age, y 68.4 56.7 <.0001 67.7 68.3 <.0001
Female 54.0% 61.0% <.0001 54.7% 54.3% .0001
Race
Black 12.6% 12.8% <.0001 12.5% 12.4% .4683
Hispanic 6.4% 6.1% <.0001 6.6% 6.4% .0037
White 68.4% 63.6% <.0001 68.3% 68.7% <.0001
Admitted past 6 mo 42.2% 25.6% <.0001 41.47% 41.47% .5589
Admitted from ED 58.2% 47.0% <.0001 59.6% 60.7% <.0001
Readmitted within 30 d 25.1% 15.6% <.0001 24.1% 25.4% <.0001
Length of stay, d 12.5 4.8 <.0001 11.2 8.3 <.0001
Discharged to home 33.3% 70.0% <.0001 36.8% 36.8% >.9999
Charlson Comorbidity Index
score
3.5 2.1 <.0001 3.5 3.5 <.0001
Charlson Index comorbidities
Myocardial infarction 10.8% 8.0% <.0001 10.7% 10.8% .7598
Congestive heart failure 27.5% 13.9% <.0001 27.2% 26.7% <.0001
Peripheral vascular disease 0.2% 6.1% <.0001 9.8% 10.0% .0024
Cerebrovascular disease 14.3% 6.9% <.0001 12.3% 12.2% .1556
Dementia 6.7% 2.5% <.0001 6.5% 6.7% .5832
Chronic pulmonary
disease
31.0% 19.8% <.0001 31.0% 31.1% .4913
Connective tissue and
rheumatic disease
2.9% 2.2% <.0001 3.0% 3.0% .8654
Peptic ulcer disease 2.8% 1.5% <.0001 2.5% 2.5% .8101
Mild liver disease 4.6% 2.9% <.0001 4.8% 4.6% <.0001
11
Diabetes without
complications
22.8% 18.6% <.0001 22.8% 22.8% .3676
Diabetes with
complications
5.1% 3.5% <.0001 5.1% 5.4% .0001
Paraplegia and hemiplegia 2.8% 1.5% <.0001 2.5% 2.5% .8101
Renal disease 13.9% 8.6% <.0001 13.8% 13.9% .0764
Cancer 13.8% 7.2% <.0001 13.6% 13.4% .0006
Moderate or severe liver
disease
1.4% 0.8% <.0001 1.5% 1.5% .0375
Metastatic carcinoma 6.9% 3.1% <.0001 6.8% 6.7% .0193
AIDS/HIV 1.1% 0.4% <.0001 1.2% 1.1% <.0001
ED indicates emergency department; ONS, oral nutritional supplement. aMatched episodes excluded tube feeding. Definitions of “admitted past 6 mo” and “readmitted
within 30 d” were approximate as the underlying data represent dates as only month and year.

12
n Table A2. Mean Episode Characteristics Across High and Low ONS Propensity Hospitalsa
Episode Characteristics
Hospital Propensity to Use ONS
≤5th
percentile
>95th
percentile P
≤50th
percentile
>50th
percentile P
Age, y 48.9 49.8 <.0001 48.8 48.0 <.0001
Female 58.7% 57.6% <.0001 58.8% 59.2% <.0001
Race
Black 12.1% 10.0% <.0001 13.7% 12.5% <.0001
Hispanic 7.7% 9.3% <.0001 6.8% 7.3% <.0001
White 57.4% 68.1% <.0001 59.8% 63.0% <.0001
Admitted past 6 mo 23.2% 24.9% <.0001 23.2% 22.8% <.0001
Admitted from ED 43.8% 44.7% <.0001 43.0% 41.2% <.0001
Readmitted within 30 d 14.1% 14.9% <.0001 14.1% 13.8% <.0001
Length of stay, d 4.9 4.7 <.0001 4.8 4.7 <.0001
Discharge to home 68.3% 68.9% <.0001 68.3% 70.1% <.0001
Charlson Comorbidity Index
score
1.8 1.8 <.0001 1.8 1.8 <.0001
Charlson Index comorbidities
Myocardial infarction 7.0% 7.1% <.0001 7.0% 6.6% <.0001
Congestive heart failure 12.0% 13.1% <.0001 12.1% 11.9% <.0001
Peripheral vascular
disease
4.9% 6.2% <.0001 5.0% 5.3% <.0001
Cerebrovascular disease 5.7% 6.3% <.0001 5.9% 6.0% <.0001
Dementia 2.3% 2.1% <.0001 2.2% 2.1% <.0001
Chronic pulmonary
disease
17.6% 20.1% <.0001 17.8% 17.5% <.0001
Connective tissue and
rheumatic disease
2.0% 1.8% <.0001 1.9% 1.9% <.0001
Peptic ulcer disease 1.3% 1.4% <.0001 1.3% 1.3% <.0001
Mild liver disease 2.5% 2.5% .7608 2.6% 2.4% <.0001
Diabetes without
complications
16.1% 16.3% <.0001 16.2% 15.6% <.0001
13
Diabetes with
complications
2.9% 3.3% <.0001 3.0% 3.0% .1745
Paraplegia and hemiplegia 1.3% 1.3% .0276 1.4% 1.3% <.0062
Renal disease 7.7% 6.7% <.0001 7.8% 6.9% <.0001
Cancer 6.5% 6.1% <.0001 6.4% 6.2% <.0001
Moderate or severe liver
disease
0.7% 0.7% <.0001 0.7% 0.7% <.0001
Metastatic carcinoma 2.9% 2.6% <.0001 2.8% 2.6% <.0001
AIDS/HIV 0.4% 0.5% <.0001 0.4% 0.3 <.0001
No. hospitals 162 23 230 230
No. episodes 12,885,871 2,044,231 21,587,029 24,506,535
ED indicates emergency department; ONS, oral nutritional supplement. aHospitals were sorted by the fraction of their episodes that involved ONS use. Hospitals with
ONS use at or below the 5th percentile (column 2) or the 50th percentile (column 5) were
considered low ONS propensity hospitals, while ONS use at or above the 95th percentile
(column 3) or the 50th percentile (column 6) were considered high ONS propensity hospitals.
Mean episode characteristics were calculated and compared across the low ONS propensity and
the high ONS propensity hospitals.
14
n Table A3. Results of the Sensitivity Analysis: Length of Staya
Propensity Score Threshold (as a Percentile of the 1:1 Matched
Sample Difference) 25th percentile 95th percentile
Effect of ONS on LOS, d (SE) −3.834b
(0.984)
−0.886b
(0.0352)
Predicted LOS without ONS, d 12.54 7.140
Predicted LOS with ONS, d 8.710 6.254
Change due to ONS use −30.5% −12.41%
Observations, n 792,280 7,604,616
LOS indicates length of stay; ONS, oral nutritional supplements. aInstrumental variables regression results were from samples of ONS episodes matched to non-
ONS episodes on propensity to receive ONS. Terminal episodes and tube-fed episodes were
excluded. The instrument was the fraction of episodes in a given hospital in a given quarter
involving ONS use. Standard errors took into account repeated observations of the same
individual. bSignificant at the 1% level.

15
n Table A4. Results of the Sensitivity Analysis: Episode Costa
Propensity Score Threshold (as a Percentile of the 1:1
Matched Sample Difference) 25th percentile 95th percentile
Effect of ONS on episode cost (SE) −$12,858b
($19.79)
−$3259b
($2.09)
Predicted episode cost without ONS $31,759 $14,114
Predicted episode cost with ONS $18,901 $10,855
Change due to ONS use −40.5% −23.1%
Observations, n 792,280 7,604,616
ONS indicates oral nutritional supplement. aInstrumental variables regression results were from samples of ONS episodes matched to non-
ONS episodes on propensity to receive ONS. Terminal episodes and tube-fed episodes were
excluded. Dependent variable in the regressions was log of episode cost. Costs are in 2010
dollars. The instrument was the fraction of episodes in a given hospital in a given quarter
involving ONS use. Predicted episode costs used Duan’s smearing estimator. Standard errors
took into account repeated observations of the same individual. bSignificant at the 1% level.
16
Table A5. Results of the Sensitivity Analysis: 30-Day Readmissiona
Propensity Score Threshold (as a Percentile of the 1:1 Matched
Sample Difference) 25th percentile 95th percentile
Effect of ONS on probability of readmission (SE) 0.0045
(0.00337)
−0.0090b
(0.00209)
Predicted readmission probability without ONS 0.316 0.319
Predicted readmission probability with ONS 0.320 0.310
Change due to ONS use 1.3% −2.8%
Observations, n 569,706 5,537,721
ONS indicates oral nutritional supplement. aThe 30-day readmission window was approximate as only the month and year were observed in
the data. Instrumental variables regression results were from samples of ONS episodes matched
to non-ONS episodes on propensity to receive ONS. Terminal episodes and tube-fed episodes
were excluded. The instrument was the fraction of episodes in a given hospital in a given quarter
involving ONS use. Standard errors took into account repeated observations of the same
individual. bSignificant at the 1% level.
17
APPENDIX REFERENCES
1. Duan N. Smearing estimate—a nonparametric retransformation method. J Am Stat Assoc.
1983;78(383):605-610.
2. Bound J, Jaeger DA, Baker RM. Problems with instrumental variables estimation when the
correlation between the instruments and the endogenous explanatory variable is weak. J Am Stat
Assoc. 1995;90(430):443-450.
3. Staiger D, Stock JH. Instrumental variables regression with weak instruments. Econometrica.
1997;65(3):557-586.
4. American Hospital Association. Adopting Technological Innovation in Hospitals: Who Pays
and Who Benefits? Washington, DC: American Hospital Association; 2006:1-10.
5. Centers for Medicare & Medicaid Services. Innovators’ Guide to Navigating Medicare.
Baltimore, MD: Department of Health and Human Services; 2010:1-55.
6. Centers for Medicare & Medicaid Services. Medicare Program; Hospital Inpatient Prospective
Payment Systems for Acute Care Hospitals and the Long-Term Care Hospital Prospective
Payment System and Fiscal Year 2012 Rates; Revisions to the Reductions and Increases to
Hospitals’ FTE Resident Caps for Graduate Medical Education Payment. CMS-1518-F.
https://www.cms.gov/Medicare/Medicare-Fee-for-Service-Payment/AcuteInpatientPPS/FY-
2012-IPPS-Final-Rule-Home-Page-Items/CMS1250103.html. Published 2011. Accessed January
7, 2013.
7. Andrews M. Health law forces changes to reduce hospitals readmissions. Kaiser Health News.
http://www.kaiserhealthnews.org/features/insuring-your-health/michelle-andrews-on-hospital-
readmissions.aspx?referrer=search. Published February 22, 2011. Accessed January 7, 2013.
8. Centers for Medicare & Medicaid Services. Acute Patient PPS: Overview.
http://www.cms.gov/AcuteInpatientPPS/01_overview.asp. Published 2011. Accessed February
15, 2012.
9. Foster D, Harkness G. Healthcare reform: pending changes to reimbursement for 30-day
readmissions. In: Research Brief 2010. Ann Arbor, MI: Thomson Reuters; August 2010.
10. Gold N. 3 Readmissions to reduce now. http://www.healthleadersmedia.com/page-1/COM-
263665/3-Readmissions-to-Reduce-Now. Published March 15, 2011. Accessed February 14,
2012.
18
11. Stone J, Hoffman GJ. Medicare Hospital Readmissions: Issues, Policy Options and PPACA.
Congressional Research Service.
http://www.pascenter.org/publications/publication_home.php?id=1230. Published September 1,
2010. Accessed January 7, 2013.
12. Thorpe JH, Cascio T. Medicare hospital readmissions reduction program. Legal Notes.
Volume 3, issue 4. http://www.rwjf.org/en/research-publications/find-rwjf-
research/2011/10/medicare-hospital-readmissions-reduction-program.html. Published October 1,
2011. Accessed January 7, 2013.