impact of repo rate and reverse repo rate on bank niftyadalyajournal.com/gallery/84-nov-2330.pdf ·...
TRANSCRIPT
Impact of Repo Rate and Reverse repo rate on Bank Nifty
Dr E.M. Naresh Babu
Associate Professor,
ABBS School of Management
Bengaluru-560091
----------------------------------------------------------------------------------------------------------------
Abstract
Banking sector is considered to be one of the most promising sectors for investment in
India. Bank Nifty is an index comprising 12 leading bank stocks in India. The
announcement of Repo, Reverse Repo rates by RBI will influence the banking sector, when
there is an increase in Repo rate, it becomes burden to the banks as the banks have to pay
higher rate for the funds which they have taken from the RBI. This will impact not only the
banks but also the Bank Nifty, similarly there will be a change in the Bank Nifty whenever
there is a change in the Reverse Repo Rate also. The present study focuses on the impact of
Bank Nifty when there is a change in Repo and Reverse Repo Rate for the period from 2005
to 2019 August. The results found were, Repo Rate increasing is more impacting Bank Nifty
in terms of returns Variance.
Key Words: Bank Nifty, Repo Rate, Reverse Repo Rate, Variance
----------------------------------------------------------------------------------------------------------------
Introduction
India is one of the emerging economies and lot of sectors are contributing to the
economy. The GDP is dominated by the service sector after the LPG. Banking sector is
considered as one of the growing sectors since 1991. Bank Nifty is the index which gives a
brief idea about the major banking stocks in India. Index calculation has been started since
2001 and the base value is taken as value from 2000. The index is influenced by the stocks
movement in the index and which are dependent on the RBIs announcement of policy rates.
Many investors believe that banking stocks will be influenced by Repo and Reverse Repo
rates. The policy rates will influence the money flow in the economy.
Literature review
The Stock market is considered to be the most representative indicator of economy of
any country. For smooth functioning of economy, the central monetary authority plays a vital
role. The central monetary authority uses monetary policy to control the money supply in the
country. There is a insignificant relationship between macro economic variables and Nifty.
The Nifty performance is not affected by the changes in the macro economic policies such as
CRR and Reverse Repo Rate. (Kumari & Nagendra, 2019)
Central bank controls supply of money with the help of monetary policy. The announcement
of CRR, SLR, PLR and Repo rate not only influences the money flow in the country but also
ADALYA JOURNAL
Volome 8, Issue 11, November 2019 932
ISSN NO: 1301-2746
http://adalyajournal.com/

the banking stocks listed in National Stock Exchange. It is found that announcement of
changes in Reverse Repo Rate and Cash Reserve Ratio are impacting the baking stocks.
Reverse Repo Rate has given a positive impact on CAAR(Cumulative Abnormal Average
Returns) where as Cash Reserve Ratio change has given a negative CAAR.. It is also
observed that Reverse Repo Rate is more influential than Repo Rate (Vanitha et al, 2013)
RBIs monetary policy announcements have been identified to be influencing the
Indian Stock Market Efficiency. Nifty values have been observed for a period of 31 days i.e.
15 days prior to the announcement and 15 days after the announcement of monetary policy
decision. Certain variables like Average Return, Average Abnormal Return and Cumulative
Average Abnormal Return were observed with Single Index Model and found to be
impacting Nifty returns. Certain announcement have not shown immediate impact on the day
of announcement as it is been in the discussion in market for some period, but on a whole, the
Monetary policy announcements have got an impact on stock market but not efficient in semi
strong form. (Agarwal, 2007)
Research Methodology
Need for the study
Many of the investors feel that there will be a difference in the Bank Nifty returns
when there is a change in the Repo and Reverse Repo rates change announcement by RBI.
So there is a dire need for identifying whether there will be a huge difference in the Bank
Nifty in the short run and long run when there is a rate change announcement by RBI.
Scope of the study
The present study focuses on the aspects of Repo Rate and Reverse Repo rates
changes and its’ impact on Bank Nifty. The period of data analysis is from Jan 2005 to
August 2019 For the present study the data of Bank Nifty values has been gathered from
National Stock Exchange Official website and Repo and Reverse Repo rates have been
gathered from official website of Reserve Bank of India.
Objectives of the study :
To analyze the effect of announcement of Repo Rate changes on Bank Nifty
To analyze the effect of announcement of Reverse Repo Rate changes on Bank Nifty
To compare the volatility in variance of returns in the Bank Nifty for 3 days, 6 days
and 9 days when there is a change in Repo rate (Pre and Post)
To compare the volatility in variance of returns in the Bank Nifty for 3 days, 6 days
and 9 days when there is a change in Reverse Repo rate (Pre and Post)
Limitations of the study
The study considers Repo rate and Reverse Repo rate announcements of RBI and the
other macro-economic, political, economical social factors are not considered.
ADALYA JOURNAL
Volome 8, Issue 11, November 2019 933
ISSN NO: 1301-2746
http://adalyajournal.com/
Analysis and Discussion
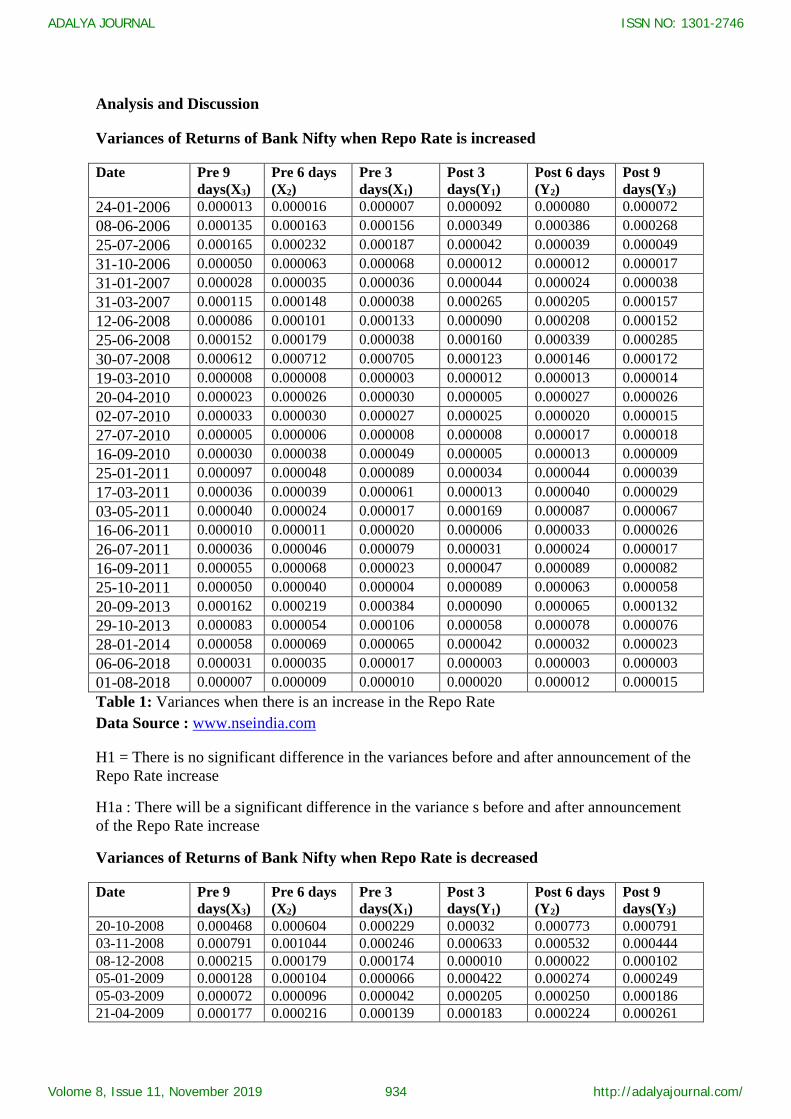
Variances of Returns of Bank Nifty when Repo Rate is increased
Date Pre 9
days(X3)
Pre 6 days
(X2)
Pre 3
days(X1)
Post 3
days(Y1)
Post 6 days
(Y2)
Post 9
days(Y3)
24-01-2006 0.000013 0.000016 0.000007 0.000092 0.000080 0.000072
08-06-2006 0.000135 0.000163 0.000156 0.000349 0.000386 0.000268
25-07-2006 0.000165 0.000232 0.000187 0.000042 0.000039 0.000049
31-10-2006 0.000050 0.000063 0.000068 0.000012 0.000012 0.000017
31-01-2007 0.000028 0.000035 0.000036 0.000044 0.000024 0.000038
31-03-2007 0.000115 0.000148 0.000038 0.000265 0.000205 0.000157
12-06-2008 0.000086 0.000101 0.000133 0.000090 0.000208 0.000152
25-06-2008 0.000152 0.000179 0.000038 0.000160 0.000339 0.000285
30-07-2008 0.000612 0.000712 0.000705 0.000123 0.000146 0.000172
19-03-2010 0.000008 0.000008 0.000003 0.000012 0.000013 0.000014
20-04-2010 0.000023 0.000026 0.000030 0.000005 0.000027 0.000026
02-07-2010 0.000033 0.000030 0.000027 0.000025 0.000020 0.000015
27-07-2010 0.000005 0.000006 0.000008 0.000008 0.000017 0.000018
16-09-2010 0.000030 0.000038 0.000049 0.000005 0.000013 0.000009
25-01-2011 0.000097 0.000048 0.000089 0.000034 0.000044 0.000039
17-03-2011 0.000036 0.000039 0.000061 0.000013 0.000040 0.000029
03-05-2011 0.000040 0.000024 0.000017 0.000169 0.000087 0.000067
16-06-2011 0.000010 0.000011 0.000020 0.000006 0.000033 0.000026
26-07-2011 0.000036 0.000046 0.000079 0.000031 0.000024 0.000017
16-09-2011 0.000055 0.000068 0.000023 0.000047 0.000089 0.000082
25-10-2011 0.000050 0.000040 0.000004 0.000089 0.000063 0.000058
20-09-2013 0.000162 0.000219 0.000384 0.000090 0.000065 0.000132
29-10-2013 0.000083 0.000054 0.000106 0.000058 0.000078 0.000076
28-01-2014 0.000058 0.000069 0.000065 0.000042 0.000032 0.000023
06-06-2018 0.000031 0.000035 0.000017 0.000003 0.000003 0.000003
01-08-2018 0.000007 0.000009 0.000010 0.000020 0.000012 0.000015
Table 1: Variances when there is an increase in the Repo Rate
Data Source : www.nseindia.com
H1 = There is no significant difference in the variances before and after announcement of the
Repo Rate increase
H1a : There will be a significant difference in the variance s before and after announcement
of the Repo Rate increase
Variances of Returns of Bank Nifty when Repo Rate is decreased
Date Pre 9
days(X3)
Pre 6 days
(X2)
Pre 3
days(X1)
Post 3
days(Y1)
Post 6 days
(Y2)
Post 9
days(Y3)
20-10-2008 0.000468 0.000604 0.000229 0.00032 0.000773 0.000791 03-11-2008 0.000791 0.001044 0.000246 0.000633 0.000532 0.000444 08-12-2008 0.000215 0.000179 0.000174 0.000010 0.000022 0.000102 05-01-2009 0.000128 0.000104 0.000066 0.000422 0.000274 0.000249 05-03-2009 0.000072 0.000096 0.000042 0.000205 0.000250 0.000186 21-04-2009 0.000177 0.000216 0.000139 0.000183 0.000224 0.000261
ADALYA JOURNAL
Volome 8, Issue 11, November 2019 934
ISSN NO: 1301-2746
http://adalyajournal.com/

17-04-2012 0.000027 0.000033 0.000026 0.000013 0.000018 0.000014 29-01-2013 0.000012 0.000009 0.000013 0.000005 0.000003 0.000003 19-03-2013 0.000060 0.000044 0.000058 0.000070 0.000046 0.000035 03-05-2013 0.000049 0.000039 0.000050 0.000062 0.000036 0.000060 15-01-2015 0.000062 0.000047 0.000062 0.000039 0.000025 0.000026 04-03-2015 0.000054 0.000072 0.000083 0.000046 0.000035 0.000035 02-06-2015 0.000036 0.000049 0.000079 0.000041 0.000043 0.000042 29-09-2015 0.000050 0.000059 0.000017 0.000049 0.000033 0.000023 05-04-2016 0.000052 0.000068 0.000049 0.000041 0.000060 0.000046 04-10-2016 0.000031 0.000037 0.000055 0.000006 0.000016 0.000024 02-08-2017 0.000005 0.000007 0.000010 0.000017 0.000012 0.000017 07-02-2019 0.000017 0.000012 0.000001 0.000002 0.000001 0.000005 04-04-2019 0.000019 0.000021 0.000003 0.000014 0.000011 0.000014 06-06-2019 0.000035 0.000023 0.000034 0.000039 0.000023 0.000018 07-08-2019 0.000027 0.000029 0.000038 0.000068 0.000039 0.000040
Table 2: Variances when there is a decrease in the Repo Rate
Data Source : www.nseindia.com
H2 = There is no significant difference in the variances before and after announcement of the
Repo Rate decrease
H2a : There will be a significant difference in the variance s before and after announcement
of the Repo Rate decrease
Variances of Returns of Bank Nifty when Reverse Repo Rate is increased
Date Pre 9
days(X3)
Pre 6 days
(X2)
Pre 3
days(X1)
Post 3
days(Y1)
Post 6 days
(Y2)
Post 9
days(Y3)
24-01-2006 0.000013 0.000016 0.000007 0.000092 0.000080 0.000072 08-06-2006 0.000135 0.000163 0.000156 0.000349 0.000386 0.000268 25-07-2006 0.000165 0.000232 0.000187 0.000042 0.000039 0.000049 19-03-2010 0.000008 0.000008 0.000003 0.000012 0.000013 0.000014 20-04-2010 0.000023 0.000026 0.000030 0.000005 0.000027 0.000026 02-07-2010 0.000033 0.000030 0.000027 0.000025 0.000020 0.000015 27-07-2010 0.000005 0.000006 0.000008 0.000008 0.000017 0.000018 16-09-2010 0.000030 0.000038 0.000049 0.000005 0.000013 0.000009 25-01-2011 0.000097 0.000048 0.000089 0.000034 0.000044 0.000039 17-03-2011 0.000036 0.000039 0.000061 0.000013 0.000040 0.000029 03-05-2011 0.000040 0.000024 0.000017 0.000169 0.000087 0.000067 16-06-2011 0.000010 0.000011 0.000020 0.000006 0.000033 0.000026 26-07-2011 0.000036 0.000046 0.000079 0.000031 0.000024 0.000017 16-09-2011 0.000055 0.000068 0.000023 0.000047 0.000089 0.000082 25-10-2011 0.000050 0.000040 0.000004 0.000089 0.000063 0.000058 20-09-2013 0.000162 0.000219 0.000384 0.000090 0.000065 0.000132 29-10-2013 0.000083 0.000054 0.000106 0.000058 0.000078 0.000076 28-01-2014 0.000058 0.000069 0.000065 0.000042 0.000032 0.000023 05-04-2016 0.000052 0.000068 0.000049 0.000041 0.000060 0.000046 06-04-2017 0.000007 0.000008 0.000007 0.000012 0.000007 0.000005 06-06-2018 0.000031 0.000035 0.000017 0.000003 0.000003 0.000003 01-08-2018 0.000007 0.000009 0.000010 0.000020 0.000012 0.000015
Table 3: Variances when there is an increase in the Reverse Repo Rate
Data Source : www.nseindia.com
ADALYA JOURNAL
Volome 8, Issue 11, November 2019 935
ISSN NO: 1301-2746
http://adalyajournal.com/

H3 = There is no significant difference in the variances before and after announcement of the
Reverse Repo Rate increase
H3a : There will be a significant difference in the variance s before and after announcement
of the Reverse Repo Rate increase
Variances of Returns of Bank Nifty when Reverse Repo Rate is decreased
Date Pre 9
days(X3)
Pre 6 days
(X2)
Pre 3
days(X1)
Post 3
days(Y1)
Post 6 days
(Y2)
Post 9
days(Y3)
29-10-2005 0.000046 0.000048 0.000054 0.000203 0.000108 0.000076
08-12-2008 0.000215 0.000179 0.000174 0.000010 0.000022 0.000102
05-01-2009 0.000128 0.000104 0.000066 0.000422 0.000274 0.000249
05-03-2009 0.000072 0.000096 0.000042 0.000205 0.000250 0.000186
21-04-2009 0.000177 0.000216 0.000139 0.000183 0.000224 0.000261
17-04-2012 0.000027 0.000033 0.000026 0.000013 0.000018 0.000014
29-01-2013 0.000012 0.000009 0.000013 0.000005 0.000003 0.000003
19-03-2013 0.000060 0.000044 0.000058 0.000070 0.000046 0.000035
03-05-2013 0.000049 0.000039 0.000050 0.000062 0.000036 0.000060
15-01-2015 0.000062 0.000047 0.000062 0.000039 0.000025 0.000026
04-03-2015 0.000054 0.000072 0.000083 0.000046 0.000035 0.000035
02-06-2015 0.000036 0.000049 0.000079 0.000041 0.000043 0.000042
29-09-2015 0.000050 0.000059 0.000017 0.000049 0.000033 0.000023
04-10-2016 0.000031 0.000037 0.000055 0.000006 0.000016 0.000024
02-08-2017 0.000005 0.000007 0.000010 0.000017 0.000012 0.000017
07-02-2019 0.000017 0.000012 0.000001 0.000002 0.000001 0.000005
04-04-2019 0.000019 0.000021 0.000003 0.000014 0.000011 0.000014
06-06-2019 0.000035 0.000023 0.000034 0.000039 0.000023 0.000018
07-08-2019 0.000027 0.000029 0.000038 0.000068 0.000039 0.000040
Table 4: Variances when there is a decrease in Reverse Repo Rate
Data Source : www.nseindia.com
H4 = There is no significant difference in the variances before and after announcement of the
Reverse Repo Rate decrease
H4a : There will be a significant difference in the variance s before and after announcement
of the Reverse Repo Rate decrease
F test results of comparing variances when Repo Rate is increased
F Value F Critical P value
X1 and Y1 1.624902 1.955447 0.115891
Y2 and Y1 0.791541 0.511392 0.281642
Y2 and Y3 1.06714 1.955447 0.436116
Y3 and Y1 1.34818 1.955447 0.230226
X3 and Y1 0.934045 0.511392 0.432952
X3 and Y2 0.739335 0.511392 0.227803
X3 and Y3 0.692819 0.511392 0.182512
Table 5 : F test results of comparison of variances when Repo rate is increased
ADALYA JOURNAL
Volome 8, Issue 11, November 2019 936
ISSN NO: 1301-2746
http://adalyajournal.com/

As the P value is not less than LOS, the Null Hypothesis is accepted, so there is no
significance difference in the variances of returns of Bank Nifty when there is a decrease in
the Reverse Repo Rate. In the case of H1, the Null Hypothesis is accepted.
F test results of comparing variances when Repo Rate is decreased
F Value F Critical P value
X1 and Y1 1.426819 2.124155 0.21684
Y2 and Y1 1.523929 2.124155 0.176969
Y2 and Y3 0.933567 0.470775 0.439677
Y3 and Y1 0.612606 0.470775 0.140769
X3 and Y1 0.788792 0.470775 0.300375
X3 and Y2 1.202063 2.124155 0.342323
X3 and Y3 1.287601 2.124155 0.288598
Table 6 : F test results of comparison of variances when Repo rate is decreased
As the P value is not less than LOS, the Null Hypothesis is accepted, so there is no
significance difference in the variances of returns of Bank Nifty when there is a decrease in
the Repo Rate. In the case of H2, the Null Hypothesis is accepted
F test results of comparing variances when Reverse Repo Rate is increased
F Value F Critical P value
X1 and Y1 1.478497 2.084189 0.188728
Y2 and Y1 0.835193 0.479803 0.341824
Y2 and Y3 0.955595 0.479803 0.459046
Y3 and Y1 1.144161 2.084189 0.380256
X3 and Y1 0.908376 0.479803 0.413894
X3 and Y2 0.758669 0.479803 0.266194
X3 and Y3 0.793924 0.479803 0.300859
Table 7 : F test results of comparison of variances when Reverse Repo rate is increased
As the P value is not less than LOS, the Null Hypothesis is accepted, so there is no
significance difference in the variances of returns of Bank Nifty when there is an increase in
the Reverse Repo Rate. In the case of H3, the Null Hypothesis is accepted
F test results of comparing variances when Reverse Repo Rate is decreased
F Value F Critical P value
X1 and Y1 1.248508 2.217197 0.321372
Y2 and Y1 0.664172 0.45102 0.196777
Y2 and Y3 0.880052 0.45102 0.394649
Y3 and Y1 1.325037 2.217197 0.27832
X3 and Y1 0.758313 0.45102 0.28167
X3 and Y2 0.50365 0.45102 0.077601
X3 and Y3 0.572296 0.45102 0.122974
Table 8 : F test results of comparison of variances when Reverse Repo rate is decreased
ADALYA JOURNAL
Volome 8, Issue 11, November 2019 937
ISSN NO: 1301-2746
http://adalyajournal.com/
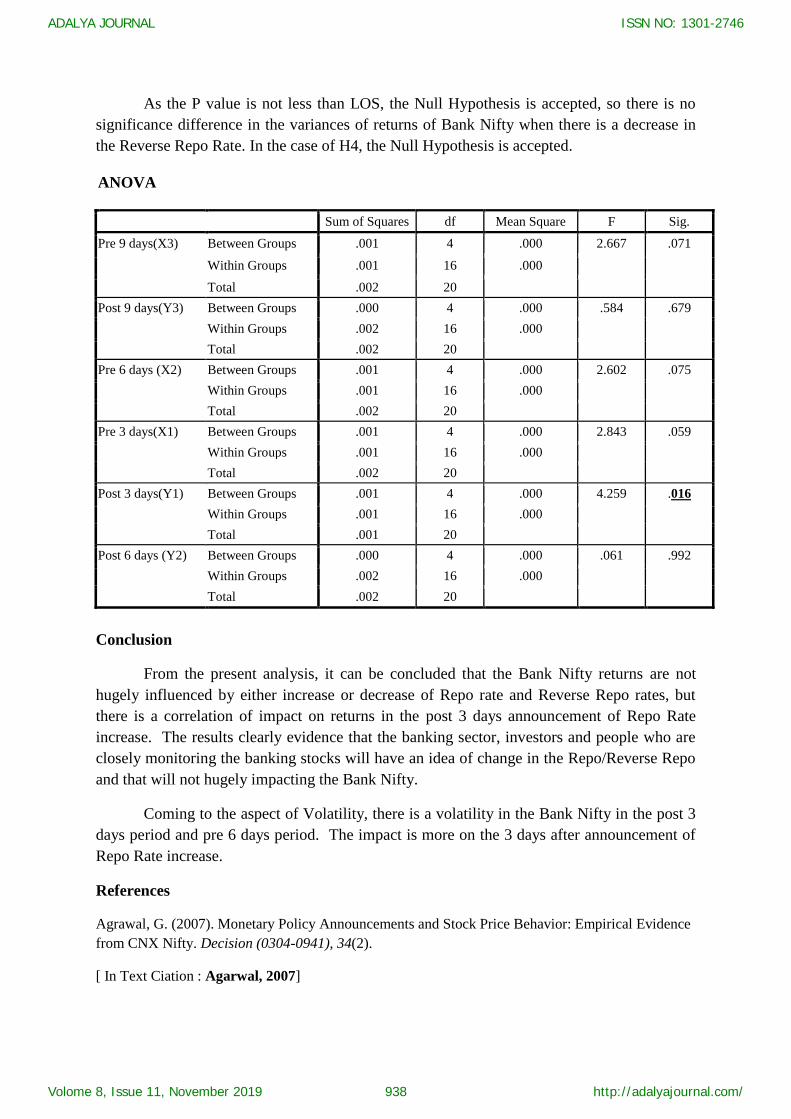
As the P value is not less than LOS, the Null Hypothesis is accepted, so there is no
significance difference in the variances of returns of Bank Nifty when there is a decrease in
the Reverse Repo Rate. In the case of H4, the Null Hypothesis is accepted.
ANOVA
Sum of Squares df Mean Square F Sig.
Pre 9 days(X3) Between Groups .001 4 .000 2.667 .071
Within Groups .001 16 .000
Total .002 20
Post 9 days(Y3) Between Groups .000 4 .000 .584 .679
Within Groups .002 16 .000
Total .002 20
Pre 6 days (X2) Between Groups .001 4 .000 2.602 .075
Within Groups .001 16 .000
Total .002 20
Pre 3 days(X1) Between Groups .001 4 .000 2.843 .059
Within Groups .001 16 .000
Total .002 20
Post 3 days(Y1) Between Groups .001 4 .000 4.259 .016
Within Groups .001 16 .000
Total .001 20
Post 6 days (Y2) Between Groups .000 4 .000 .061 .992
Within Groups .002 16 .000
Total .002 20
Conclusion
From the present analysis, it can be concluded that the Bank Nifty returns are not
hugely influenced by either increase or decrease of Repo rate and Reverse Repo rates, but
there is a correlation of impact on returns in the post 3 days announcement of Repo Rate
increase. The results clearly evidence that the banking sector, investors and people who are
closely monitoring the banking stocks will have an idea of change in the Repo/Reverse Repo
and that will not hugely impacting the Bank Nifty.
Coming to the aspect of Volatility, there is a volatility in the Bank Nifty in the post 3
days period and pre 6 days period. The impact is more on the 3 days after announcement of
Repo Rate increase.
References
Agrawal, G. (2007). Monetary Policy Announcements and Stock Price Behavior: Empirical Evidence
from CNX Nifty. Decision (0304-0941), 34(2).
[ In Text Ciation : Agarwal, 2007]
ADALYA JOURNAL
Volome 8, Issue 11, November 2019 938
ISSN NO: 1301-2746
http://adalyajournal.com/
Kumari, Lakshmi., Kumar Nagendra. (2019). The Effect of Cash Reserve Ratio and Reverse Repo
rate on Stock Market Performance – Empirical Evidence from India. IOSR Journal of Economics and
Finance , Volume 10, Issue 1, Ser II(Jan, - Feb.2019), PP 47-51
[In Text Citation : Kumari & Nagendra, 2019]
Vanitha, S., Nageswari, P., & Srinivasan, P. (2013). Impact of reverse repo rate and cash
reserve ratio in National Stock Exchange (NSE) CNX bank index. International Journal of
Management and Business Studies, 3(1), 72-81.
[In Text Citation : Vanita et al, 2013]
Websites
www.rbi.org.in
www.nseindia.com
www.investopedia.com
ADALYA JOURNAL
Volome 8, Issue 11, November 2019 939
ISSN NO: 1301-2746
http://adalyajournal.com/
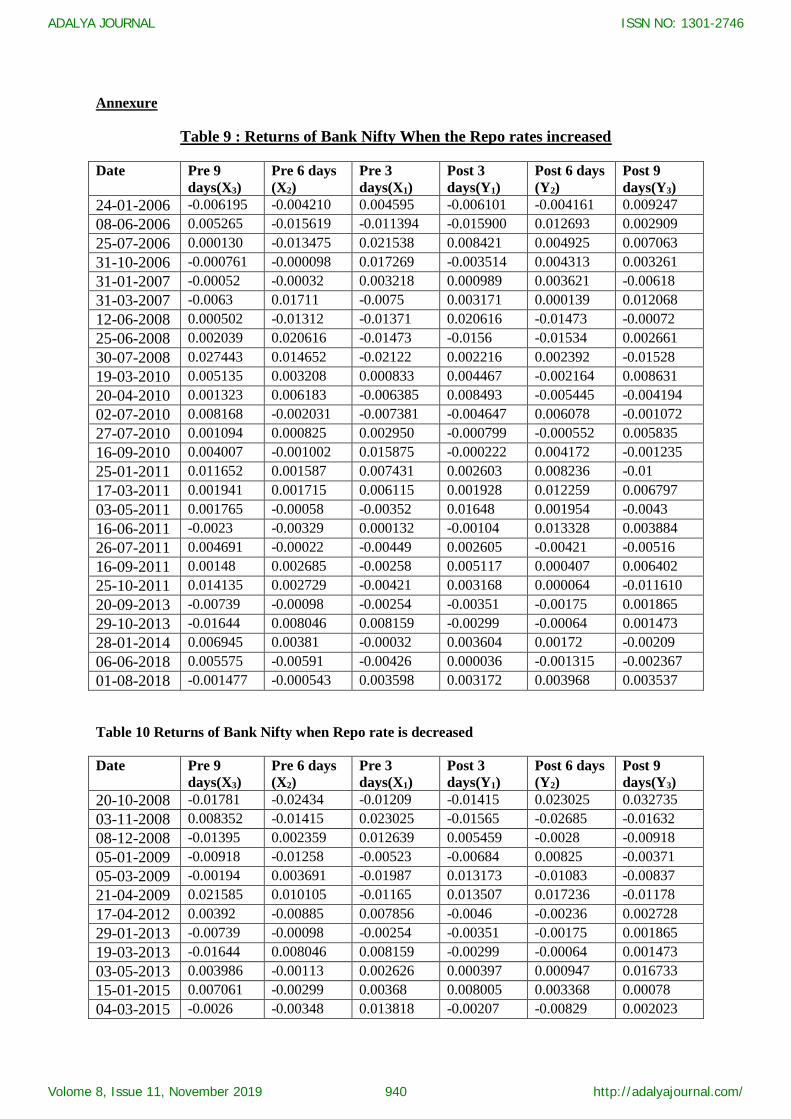
Annexure
Table 9 : Returns of Bank Nifty When the Repo rates increased
Date Pre 9
days(X3)
Pre 6 days
(X2)
Pre 3
days(X1)
Post 3
days(Y1)
Post 6 days
(Y2)
Post 9
days(Y3)
24-01-2006 -0.006195 -0.004210 0.004595 -0.006101 -0.004161 0.009247
08-06-2006 0.005265 -0.015619 -0.011394 -0.015900 0.012693 0.002909
25-07-2006 0.000130 -0.013475 0.021538 0.008421 0.004925 0.007063
31-10-2006 -0.000761 -0.000098 0.017269 -0.003514 0.004313 0.003261
31-01-2007 -0.00052 -0.00032 0.003218 0.000989 0.003621 -0.00618
31-03-2007 -0.0063 0.01711 -0.0075 0.003171 0.000139 0.012068
12-06-2008 0.000502 -0.01312 -0.01371 0.020616 -0.01473 -0.00072
25-06-2008 0.002039 0.020616 -0.01473 -0.0156 -0.01534 0.002661
30-07-2008 0.027443 0.014652 -0.02122 0.002216 0.002392 -0.01528
19-03-2010 0.005135 0.003208 0.000833 0.004467 -0.002164 0.008631
20-04-2010 0.001323 0.006183 -0.006385 0.008493 -0.005445 -0.004194
02-07-2010 0.008168 -0.002031 -0.007381 -0.004647 0.006078 -0.001072
27-07-2010 0.001094 0.000825 0.002950 -0.000799 -0.000552 0.005835
16-09-2010 0.004007 -0.001002 0.015875 -0.000222 0.004172 -0.001235
25-01-2011 0.011652 0.001587 0.007431 0.002603 0.008236 -0.01
17-03-2011 0.001941 0.001715 0.006115 0.001928 0.012259 0.006797
03-05-2011 0.001765 -0.00058 -0.00352 0.01648 0.001954 -0.0043
16-06-2011 -0.0023 -0.00329 0.000132 -0.00104 0.013328 0.003884
26-07-2011 0.004691 -0.00022 -0.00449 0.002605 -0.00421 -0.00516
16-09-2011 0.00148 0.002685 -0.00258 0.005117 0.000407 0.006402
25-10-2011 0.014135 0.002729 -0.00421 0.003168 0.000064 -0.011610
20-09-2013 -0.00739 -0.00098 -0.00254 -0.00351 -0.00175 0.001865
29-10-2013 -0.01644 0.008046 0.008159 -0.00299 -0.00064 0.001473
28-01-2014 0.006945 0.00381 -0.00032 0.003604 0.00172 -0.00209
06-06-2018 0.005575 -0.00591 -0.00426 0.000036 -0.001315 -0.002367
01-08-2018 -0.001477 -0.000543 0.003598 0.003172 0.003968 0.003537
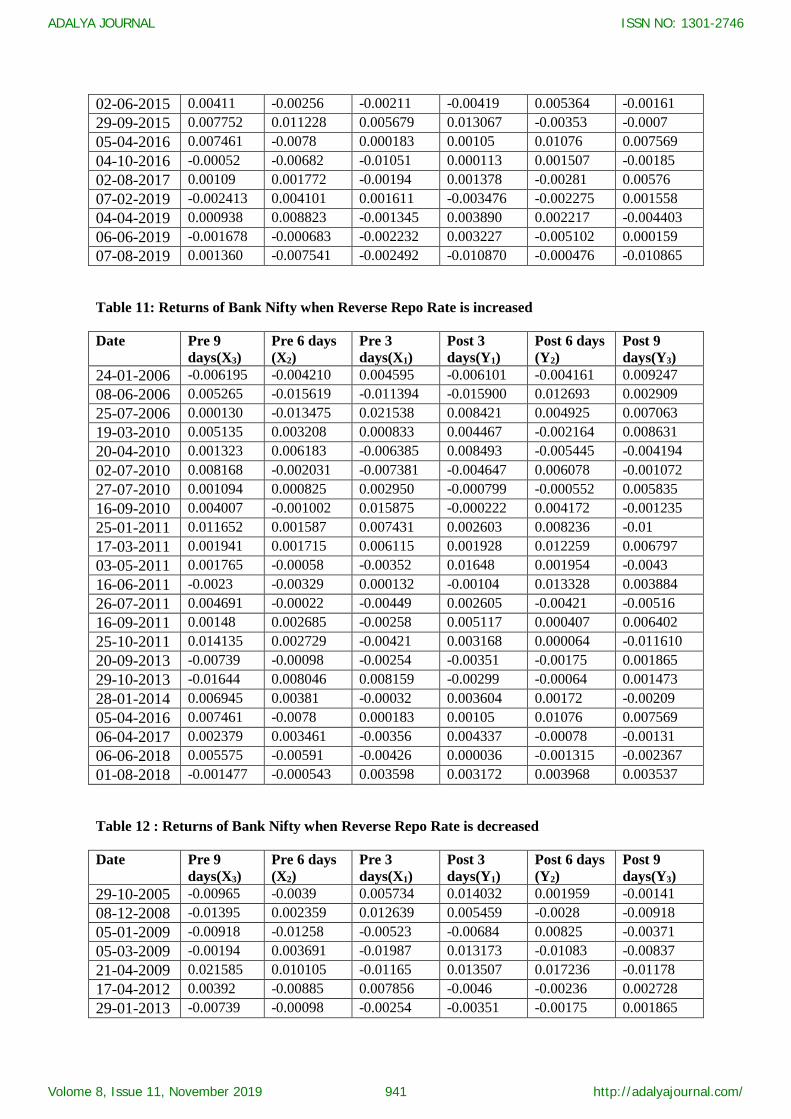
Table 10 Returns of Bank Nifty when Repo rate is decreased
Date Pre 9
days(X3)
Pre 6 days
(X2)
Pre 3
days(X1)
Post 3
days(Y1)
Post 6 days
(Y2)
Post 9
days(Y3)
20-10-2008 -0.01781 -0.02434 -0.01209 -0.01415 0.023025 0.032735
03-11-2008 0.008352 -0.01415 0.023025 -0.01565 -0.02685 -0.01632
08-12-2008 -0.01395 0.002359 0.012639 0.005459 -0.0028 -0.00918
05-01-2009 -0.00918 -0.01258 -0.00523 -0.00684 0.00825 -0.00371
05-03-2009 -0.00194 0.003691 -0.01987 0.013173 -0.01083 -0.00837
21-04-2009 0.021585 0.010105 -0.01165 0.013507 0.017236 -0.01178
17-04-2012 0.00392 -0.00885 0.007856 -0.0046 -0.00236 0.002728
29-01-2013 -0.00739 -0.00098 -0.00254 -0.00351 -0.00175 0.001865
19-03-2013 -0.01644 0.008046 0.008159 -0.00299 -0.00064 0.001473
03-05-2013 0.003986 -0.00113 0.002626 0.000397 0.000947 0.016733
15-01-2015 0.007061 -0.00299 0.00368 0.008005 0.003368 0.00078
04-03-2015 -0.0026 -0.00348 0.013818 -0.00207 -0.00829 0.002023
ADALYA JOURNAL
Volome 8, Issue 11, November 2019 940
ISSN NO: 1301-2746
http://adalyajournal.com/
02-06-2015 0.00411 -0.00256 -0.00211 -0.00419 0.005364 -0.00161
29-09-2015 0.007752 0.011228 0.005679 0.013067 -0.00353 -0.0007
05-04-2016 0.007461 -0.0078 0.000183 0.00105 0.01076 0.007569
04-10-2016 -0.00052 -0.00682 -0.01051 0.000113 0.001507 -0.00185
02-08-2017 0.00109 0.001772 -0.00194 0.001378 -0.00281 0.00576
07-02-2019 -0.002413 0.004101 0.001611 -0.003476 -0.002275 0.001558
04-04-2019 0.000938 0.008823 -0.001345 0.003890 0.002217 -0.004403
06-06-2019 -0.001678 -0.000683 -0.002232 0.003227 -0.005102 0.000159
07-08-2019 0.001360 -0.007541 -0.002492 -0.010870 -0.000476 -0.010865
Table 11: Returns of Bank Nifty when Reverse Repo Rate is increased
Date Pre 9
days(X3)
Pre 6 days
(X2)
Pre 3
days(X1)
Post 3
days(Y1)
Post 6 days
(Y2)
Post 9
days(Y3)
24-01-2006 -0.006195 -0.004210 0.004595 -0.006101 -0.004161 0.009247
08-06-2006 0.005265 -0.015619 -0.011394 -0.015900 0.012693 0.002909
25-07-2006 0.000130 -0.013475 0.021538 0.008421 0.004925 0.007063
19-03-2010 0.005135 0.003208 0.000833 0.004467 -0.002164 0.008631
20-04-2010 0.001323 0.006183 -0.006385 0.008493 -0.005445 -0.004194
02-07-2010 0.008168 -0.002031 -0.007381 -0.004647 0.006078 -0.001072
27-07-2010 0.001094 0.000825 0.002950 -0.000799 -0.000552 0.005835
16-09-2010 0.004007 -0.001002 0.015875 -0.000222 0.004172 -0.001235
25-01-2011 0.011652 0.001587 0.007431 0.002603 0.008236 -0.01
17-03-2011 0.001941 0.001715 0.006115 0.001928 0.012259 0.006797
03-05-2011 0.001765 -0.00058 -0.00352 0.01648 0.001954 -0.0043
16-06-2011 -0.0023 -0.00329 0.000132 -0.00104 0.013328 0.003884
26-07-2011 0.004691 -0.00022 -0.00449 0.002605 -0.00421 -0.00516
16-09-2011 0.00148 0.002685 -0.00258 0.005117 0.000407 0.006402
25-10-2011 0.014135 0.002729 -0.00421 0.003168 0.000064 -0.011610
20-09-2013 -0.00739 -0.00098 -0.00254 -0.00351 -0.00175 0.001865
29-10-2013 -0.01644 0.008046 0.008159 -0.00299 -0.00064 0.001473
28-01-2014 0.006945 0.00381 -0.00032 0.003604 0.00172 -0.00209
05-04-2016 0.007461 -0.0078 0.000183 0.00105 0.01076 0.007569
06-04-2017 0.002379 0.003461 -0.00356 0.004337 -0.00078 -0.00131
06-06-2018 0.005575 -0.00591 -0.00426 0.000036 -0.001315 -0.002367
01-08-2018 -0.001477 -0.000543 0.003598 0.003172 0.003968 0.003537
Table 12 : Returns of Bank Nifty when Reverse Repo Rate is decreased
Date Pre 9
days(X3)
Pre 6 days
(X2)
Pre 3
days(X1)
Post 3
days(Y1)
Post 6 days
(Y2)
Post 9
days(Y3)
29-10-2005 -0.00965 -0.0039 0.005734 0.014032 0.001959 -0.00141
08-12-2008 -0.01395 0.002359 0.012639 0.005459 -0.0028 -0.00918
05-01-2009 -0.00918 -0.01258 -0.00523 -0.00684 0.00825 -0.00371
05-03-2009 -0.00194 0.003691 -0.01987 0.013173 -0.01083 -0.00837
21-04-2009 0.021585 0.010105 -0.01165 0.013507 0.017236 -0.01178
17-04-2012 0.00392 -0.00885 0.007856 -0.0046 -0.00236 0.002728
29-01-2013 -0.00739 -0.00098 -0.00254 -0.00351 -0.00175 0.001865
ADALYA JOURNAL
Volome 8, Issue 11, November 2019 941
ISSN NO: 1301-2746
http://adalyajournal.com/

19-03-2013 -0.01644 0.008046 0.008159 -0.00299 -0.00064 0.001473
03-05-2013 0.003986 -0.00113 0.002626 0.000397 0.000947 0.016733
15-01-2015 0.007061 -0.00299 0.00368 0.008005 0.003368 0.00078
04-03-2015 -0.0026 -0.00348 0.013818 -0.00207 -0.00829 0.002023
02-06-2015 0.00411 -0.00256 -0.00211 -0.00419 0.005364 -0.00161
29-09-2015 0.007752 0.011228 0.005679 0.013067 -0.00353 -0.0007
04-10-2016 -0.00052 -0.00682 -0.01051 0.000113 0.001507 -0.00185
02-08-2017 0.00109 0.001772 -0.00194 0.001378 -0.00281 0.00576
07-02-2019 -0.002413 0.004101 0.001611 -0.003476 -0.002275 0.001558
04-04-2019 0.000938 0.008823 -0.001345 0.003890 0.002217 -0.004403
06-06-2019 -0.001678 -0.000683 -0.002232 0.003227 -0.005102 0.000159
07-08-2019 0.001360 -0.007541 -0.002492 -0.010870 -0.000476 -0.010865
ADALYA JOURNAL
Volome 8, Issue 11, November 2019 942
ISSN NO: 1301-2746
http://adalyajournal.com/

F test Results – Repo Rate increase
X1 and Y1
F-Test Two-Sample for Variances
Variable 1 Variable 2
Mean -0.000482 0.001260
Variance 0.000098 0.000060
Observations 26 26
Df 25 25
F 1.624902
P(F<=f) one-tail 0.115891
F Critical one-tail 1.955447
X2 and Y1
F-Test Two-Sample for Variances
Variable 1 Variable 2
Mean 0.001152 0.001260
Variance 0.000048 0.000060
Observations 26 26
df 25 25
F 0.791541
P(F<=f) one-tail 0.281642
F Critical one-tail 0.511392
Y2 and Y3
F-Test Two-Sample for Variances
Variable 1 Variable 2
Mean 0.001152 0.000439
Variance 0.000048 0.000045
Observations 26 26
df 25 25
F 1.067140
P(F<=f) one-tail 0.436116
F Critical one-tail 1.955447
Y3 and Y1
F-Test Two-Sample for Variances
Variable 1 Variable 2
Mean 0.001260 0.000439
Variance 0.000060 0.000045
Observations 26 26
df 25 25
F 1.348180
P(F<=f) one-tail 0.230226
F Critical one-tail 1.955447
X3 and Y1
F-Test Two-Sample for Variances
Variable 1 Variable 2
Mean 0.001260 0.002381
Variance 0.000060 0.000064
Observations 26 26
df 25 25
F 0.934045
P(F<=f) one-tail 0.432952
F Critical one-tail 0.511392
X3 and Y2
F-Test Two-Sample for Variances
Variable 1 Variable 2
Mean 0.001152 0.002381
Variance 0.000048 0.000064
Observations 26 26
df 25 25
F 0.739335
P(F<=f) one-tail 0.227803
F Critical one-tail 0.511392
X3 and Y3
F-Test Two-Sample for Variances
Variable 1 Variable 2
Mean 0.000439 0.002381
Variance 0.000045 0.000064
Observations 26 26
df 25 25
F 0.692819
P(F<=f) one-tail 0.182512
F Critical one-tail 0.511392
ADALYA JOURNAL
Volome 8, Issue 11, November 2019 943
ISSN NO: 1301-2746
http://adalyajournal.com/

F test Results Repo Decreased
X1 and Y1
F-Test Two-Sample for Variances
Var1 Var2
Mean 0.0003 -0.0002
Variance 0.0001 0.0001
Observations 21 21
df 20 20
F 1.4268
P(F<=f) one-tail 0.2168
F Critical one-
tail 2.1242
Y2 and Y1
F-Test Two-Sample for Variances
Var1 Var2
Mean 0.0002 -0.0002
Variance 0.0001 0.0001
Observations 21 21
df 20 20
F 1.5239
P(F<=f) one-tail 0.1770
F Critical one-
tail 2.1242
Y2 and Y3
F-Test Two-Sample for Variances
Var1 Var2
Mean 0.0002 0.0002
Variance 0.0001 0.0001
Observations 21 21
df 20 20
F 0.9336
P(F<=f) one-tail 0.4397
F Critical one-
tail 0.4708
Y3 and Y1
F-Test Two-Sample for Variances
Var1 Var2
Mean -0.0002 0.0002
Variance 0.0001 0.0001
Observations 21 21
df 20 20
F 0.6126
P(F<=f) one-tail 0.1408
F Critical one-
tail 0.4708
X3 and Y1
F-Test Two-Sample for Variances
Var1 Var2
Mean -0.0002 -0.0003
Variance 0.0001 0.0001
Observations 21 21
df 20 20
F 0.7888
P(F<=f) one-tail 0.3004
F Critical one-
tail 0.4708
X3 and Y2
F-Test Two-Sample for Variances
Var1 Var2
Mean 0.0002 -0.0003
Variance 0.0001 0.0001
Observations 21 21
df 20 20
F 1.2021
P(F<=f) one-tail 0.3423
F Critical one-
tail 2.1242
X3 and Y3
F-Test Two-Sample for Variances
Var1 Var2
Mean 0.0002 -0.0003
Variance 0.0001 0.0001
Observations 21 21
df 20 20
F 1.2876
P(F<=f) one-tail 0.2886
F Critical one-
tail 2.1242
ADALYA JOURNAL
Volome 8, Issue 11, November 2019 944
ISSN NO: 1301-2746
http://adalyajournal.com/

F test Results When Reverse Repo Rate is increased
X 1 and Y1
F-Test Two-Sample for Variances
Var1 Var2
Mean 0.000944 0.001376
Variance 0.000058 0.000039
Observations 22 22
df 21 21
F 1.478497 P(F<=f) one-tail 0.188728 F Critical one-
tail 2.084189
Y2 and Y1
F-Test Two-Sample for Variances
Var1 Var2
Mean 0.002707 0.001376
Variance 0.000033 0.000039
Observations 22 22
df 21 21
F 0.835193 P(F<=f) one-tail 0.341824 F Critical one-
tail 0.479803
Y2 and Y3
F-Test Two-Sample for Variances
Var1 Var2
Mean 0.002707 0.000994
Variance 0.000033 0.000034
Observations 22 22
df 21 21
F 0.955595
P(F<=f) one-tail 0.459046
F Critical one-tail 0.479803
Y3 and Y1
F-Test Two-Sample for Variances
Var1 Var2
Mean 0.001376 0.000994
Variance 0.000039 0.000034
Observations 22 22
df 21 21
F 1.144161
P(F<=f) one-tail 0.380256
F Critical one-tail 2.084189
X3 and Y1
F-Test Two-Sample for Variances
Var1 Var2
Mean 0.001376 0.002243
Variance 0.000039 0.000043
Observations 22 22
df 21 21
F 0.908376
P(F<=f) one-tail 0.413894
F Critical one-
tail 0.479803
X3 and Y2
F-Test Two-Sample for Variances
Var1 Var2
Mean 0.002707 0.002243
Variance 0.000033 0.000043
Observations 22 22
df 21 21
F 0.758669
P(F<=f) one-tail 0.266194
F Critical one-
tail 0.479803
X3 and Y3
F-Test Two-Sample for Variances
Var1 Var2
Mean 0.000994 0.002243
Variance 0.000034 0.000043
Observations 22 22
df 21 21
F 0.793924 P(F<=f) one-tail 0.300859 F Critical one-
tail 0.479803
ADALYA JOURNAL
Volome 8, Issue 11, November 2019 945
ISSN NO: 1301-2746
http://adalyajournal.com/

F test Results – Reverse Repo Rate Decreased
X1 and Y1
F-Test Two-Sample for Variances
Variable 1 Variable 2
Mean 0.000099 0.001984
Variance 0.000070 0.000056
Observations 19 19
df 18 18
F 1.248508 P(F<=f) one-tail 0.321372 F Critical one-
tail 2.217197
Y2 and Y1
F-Test Two-Sample for Variances
Variable 1 Variable 2
Mean -0.000001 0.001984
Variance 0.000037 0.000056
Observations 19 19
df 18 18
F 0.664172 P(F<=f) one-tail 0.196777 F Critical one-
tail 0.451020
Y2 and Y3
F-Test Two-Sample for Variances
Variable 1 Variable 2
Mean -0.000001 -0.001095
Variance 0.000037 0.000042
Observations 19 19
df 18 18
F 0.880052
P(F<=f) one-tail 0.394649
F Critical one-tail 0.451020
Y3 and Y1
F-Test Two-Sample for Variances
Variable 1 Variable 2
Mean 0.001984 -0.001095
Variance 0.000056 0.000042
Observations 19 19
df 18 18
F 1.325037
P(F<=f) one-tail 0.278320
F Critical one-tail 2.217197
X3 and Y1
F-Test Two-Sample for Variances
Variable 1 Variable 2
Mean 0.001984 -0.000735
Variance 0.000056 0.000074
Observations 19 19
df 18 18
F 0.758313
P(F<=f) one-tail 0.281670
F Critical one-
tail 0.451020
X3 and Y2
F-Test Two-Sample for Variances
Variable 1 Variable 2
Mean -0.000001 -0.000735
Variance 0.000037 0.000074
Observations 19 19
df 18 18
F 0.503650
P(F<=f) one-tail 0.077601
F Critical one-
tail 0.451020
X3 and Y3
F-Test Two-Sample for Variances
Variable 1 Variable 2
Mean -0.001095 -0.000735
Variance 0.000042 0.000074
Observations 19 19
df 18 18
F 0.572296
P(F<=f) one-tail 0.122974
F Critical one-tail 0.451020
ADALYA JOURNAL
Volome 8, Issue 11, November 2019 946
ISSN NO: 1301-2746
http://adalyajournal.com/