presentation: asia's perspectives on rebalancing and orei … · 2011-04-25 · reverse...
TRANSCRIPT

Asia’s Perspectives onAsia’s Perspectives onAsia s Perspectives onAsia s Perspectives onRebalancing & OREI ResearchRebalancing & OREI Research
1.1. Asia’s Issues & ChallengesAsia’s Issues & Challenges2.2. OREI’s Research AgendaOREI’s Research Agenda
IwanIwan J. J. AzisAzisHead, Office of Regional Economic IntegrationHead, Office of Regional Economic Integration
Asian Development Bank forAsian Development Bank forAsian Development Bank, for Asian Development Bank, for ADBADB--PIIE Book launchingPIIE Book launching
Washington DC, 25 April 2011Washington DC, 25 April 2011

Contribution to CPI Inflation
Jan-June 2010 July 2010-latest data
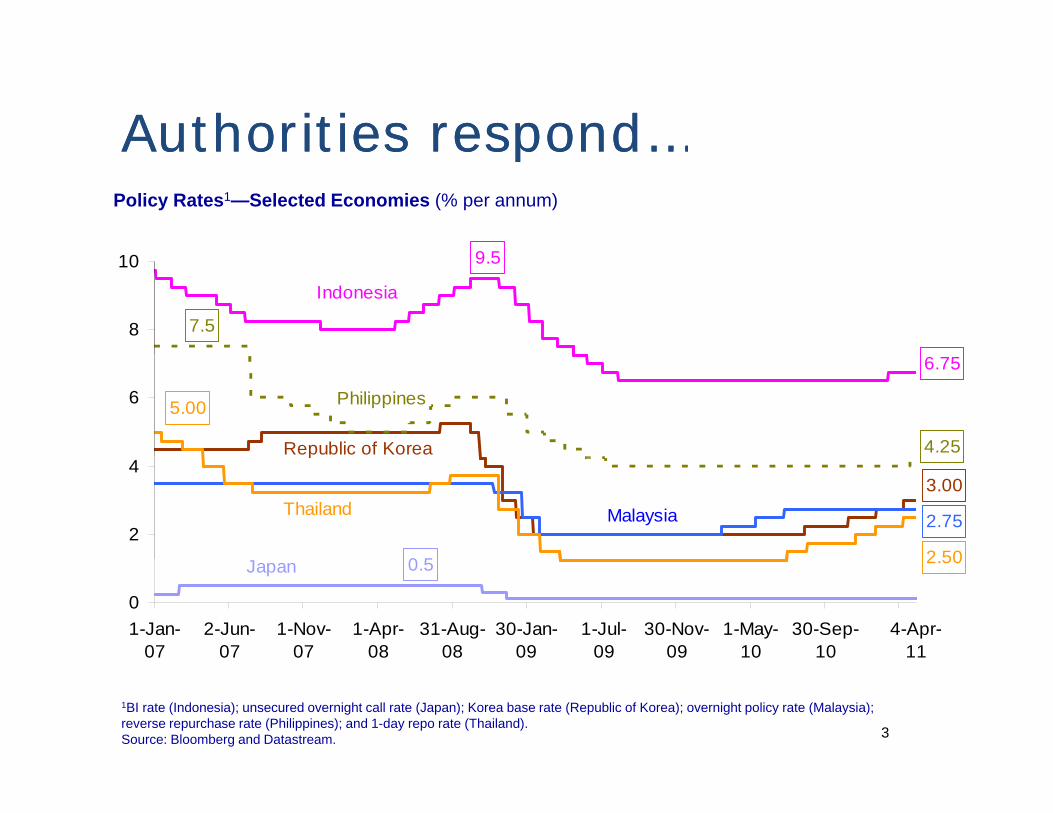
Authorities respond…Authorities respond…Authorities respond…Authorities respond…Policy Rates1—Selected Economies (% per annum)
9 5
7.5
9.5
8
10
Indonesia
4.25
5.00
6.75
6 Philippines
Republic of Korea
3.00
2.75
2 500 5
2
4
Thailand Malaysia
J 2.500.5
01-Jan-
072-Jun-
071-Nov-
071-Apr-
0831-Aug-
0830-Jan-
091-Jul-09 30-Nov-
091-May-
1030-Sep-
101-Mar-
11
Japan
4-Apr-11
1-Jul-09
1BI rate (Indonesia); unsecured overnight call rate (Japan); Korea base rate (Republic of Korea); overnight policy rate (Malaysia); reverse repurchase rate (Philippines); and 1-day repo rate (Thailand).Source: Bloomberg and Datastream. 3

Currency appreciation helpsCurrency appreciation helpsChange in Exchange Rate against US dollar1 (%)
Indonesian rupiah 2010
Malaysian ringgit
Singapore dollar
Indonesian rupiah 2010
2011 YTD
PRC renminbi
Philippine peso
Japanese yen
2
Thai baht
Hong Kong dollar
Korean won
-8 -4 0 4 8 12 16
Vietnamese dong
Thai baht
1Year-to-date (YTD) figures based on 21 Mar 2011 closing. Negative values indicate depreciation.2PRC = People's Republic of China.Source: OREI staff calculations based on Reuters data. 4

Keeping food costs downKeeping food costs downAdministrative Measures (as of 16 February 2011)
Control
EconomiesReduce
taxesIncrease supply
Restrict exports
Control prices /
subsidize consumers
Cash transfers
Food for work Food aid
Feeding programs
Stimulate production
China, People's Rep. ofCambodiaIndonesiaL PDRLao PDRPhilippinesThailandViet Nam
Source: Asian Development Bank 2011, April 2011.
5

Declining Correlation of Output Gap and Commodity PricesGap and Commodity Prices
3 06%2000CY=1
2 0
2.5
3.0
4
6
Global Output Gap(RHS)
S&P GSCI
1.5
2.0
2
Linear approximation of S&P GSCI
0.5
1.0
-2
0
-0.5
0.0
-41998 99 2000 01 02 03 04 05 06 07 08 09 10 11
Linear approximation of Global Output Gap
6
(Note) S&P GSCI is shown as relative price to the global headline CPI.(Source) IMF, Bloomberg
998 99 000 0 0 03 0 05 06 0 08 09 0

Upward Level Shift in Correlation: Structural Changes?Structural Changes?
3.0 2000=1
2.5 1998-2002
1.5
2.0 2003-2005
2006-2010
Linear approximation of 1998-2002PG
SC
I
1.0 Linear approximation of 2006-2010S
&P
0.5 -4 -2 0 2 4 (%)
Global Output Gap
7
(Note) S&P GSCI is shown as relative price to the global headline CPI.(Source) IMF, Bloomberg
Global Output Gap

Stalled Oil Supply vs Increased Inventories Inventories
4,500 90 Million barrelsMillion barrels/day
4,300
4,400
85
World Oil Supply
World Petroleum Stocks (RHS)
4 000
4,100
4,200
80
3,800
3,900
4,000
75
3,600
3,700 70
8
3,500 65 1994 1996 1998 2000 2002 2004 2006 2008 2010
(Source) U.S. Department of Energy

One‐year rolling correlation between daily return of global
Interest rate gap = short‐term real interest rate minus potential GDP growth (minus means easy monetary conditions). S&P GSCI is shown as
equity index (MSCI AC‐World) and that of commodity index (S&P GSCI) . (Source) Bloomberg
relative price to the global headline CPI. (Source) IMF, Bloomberg

Global Investors’ Portfolio R b l i “Fi i li ti ”?
• Institutional investors aiming to
Rebalancing: “Financialisation”?
• Institutional investors aiming to gain the benefits of asset diversification and inflation diversification and inflation hedging and higher returns.
• Improvements in market infrastructure
• Development of commodity indices and Improvement in indices and Improvement in trading-related platform.

Destabilizing capital flowsDestabilizing capital flowsg pg pNet Financial Flows—Selected Economies1
(% of GDP)
5.7
5.820
30Gross Inflows
-0.4
4.3
3.8
0
10
-5.9
-6.1-20
-10
-40
-30
2007Q1 2007Q4 2008Q3 2009Q2 2010Q1 2010Q4
Direct Investment Portfolio Investment Other Investment Net Financial Flows
Gross Outflows
GDP = gross domestic product.1Includes Hong Kong, China; Indonesia; Republic of Korea; Philippines; Singapore; Thailand; and Viet Nam. Does not include Malaysia from 2010Q2 to 2010Q4 as data on inflow-outflow breakdown for portfolio and other investment unavailable. Does not include Viet Nam in 2010Q4 as data unavailable. "Other investment" includes financial derivatives. Source: OREI staff calculations based on data from International Financial Statistics, International Monetary Fund; and national sources.

Policy IssuesPolicy Issues• Managing inflationary pressureg g y p
• Monetary-fiscal & other policies • Currency appreciation • Regional cooperation & other policies?
• Managing capital flows effectively (well t t d & t d i )targeted & temporary, and conversion)• Limit foreign currency borrowing• Foreign currency reserve requirement• Foreign currency reserve requirement• Holding period• Withholding tax on foreign investmentWithholding tax on foreign investment• Tax on foreign capital• Regional coordination & intraregional trade
• Excess saving and cross-border financial flows

DevelopmentTrade & Finance
em
DevelopmentTrade & Finance
mployym
ent & povverty


Real sectorsFinancial sectors
PRODTY
LBR PRODTY