impact of the information and communication technologies
TRANSCRIPT

HAL Id: tel-01539429https://tel.archives-ouvertes.fr/tel-01539429
Submitted on 14 Jun 2017
HAL is a multi-disciplinary open accessarchive for the deposit and dissemination of sci-entific research documents, whether they are pub-lished or not. The documents may come fromteaching and research institutions in France orabroad, or from public or private research centers.
L’archive ouverte pluridisciplinaire HAL, estdestinée au dépôt et à la diffusion de documentsscientifiques de niveau recherche, publiés ou non,émanant des établissements d’enseignement et derecherche français ou étrangers, des laboratoirespublics ou privés.
Impact of the Information and CommunicationTechnologies on workers’ behaviors : an experimental
investigationPeguy Ndodjang Ngantchou
To cite this version:Peguy Ndodjang Ngantchou. Impact of the Information and Communication Technologies on workers’behaviors : an experimental investigation. Economics and Finance. Université Montpellier, 2016.English. �NNT : 2016MONTD028�. �tel-01539429�

Délivré par
Université de Montpellier
Préparée au sein de l’école doctorale d’Economie et de
Gestion
Et du Laboratoire Montpelliérain d’Economie Théorique
et Appliquée (LAMETA)
Spécialité : Sciences Economiques
Présentée par Peguy Ndodjang
Soutenue le 8 décembre 2016 devant le jury composé de
Mr Gilles Grolleau, Professeur, HDR, Montpellier Supagro, UMR LAMETA
Directeur
Mr Jean-Michel Salles, Directeur de recherche, HDR, CNRS, UMR LAMETA
Examinateur
Mr François Cochard, Professeur des universités, HDR, Université de Bourgogne-Franche-Comté, CRESE
Rapporteur
Mr Naoufel Mzoughi, Chargé de recherche, HDR, INRA PACA, Ecodéveloppement
Rapporteur
Impact of Information and Communication Technologies on workers’ behavior: An
experimental Investigation
L’impact des Technologies de l’Information et de la Communication sur le comportement des travailleurs : Une approche Expérimentale

III
L’Université de Montpellier n’entend donner aucune approbation ni improbation aux opinions émises dans cette thèse; ces opinions doivent être considérées comme propres à leur auteur.

IV
Abstract
This dissertation explores the impact of the use of Information and Communication
Technologies (ICT) on employees’ behaviors. While the neoclassical growth theory considers
ICT as an input used in the production process, we relied on the knowledge hierarchy
literature which states that technologies have two different key aspects. Information
technologies push down the decision making at the employee level while Communication
technologies centralize the decision making. We addressed the issues of the more efficient
technologies for workers’ performance, the costs generated by using the most efficient type of
technologies and how the technology-based monitoring may be useful to reduce those costs.
We used the experimental methodology since the collection of individuals and team's
production is hard with survey data. Our results show that employees prefer Information
technologies and those who use it are more productive than others. We also show that work
organization and technologies which push down the decision making at the employee level
could entail some substantial costs for the firm. Indeed, employees are more willing to engage
on time wasting activities in order to influence the principal’s decision when they can
manipulate information even when there are no monetary incentives to do so. However
Technology-based monitoring is quite successful at reducing those costs. Indeed, technology
monitoring implies a disciplining effect at the beginning when the sanction is available but
this effect lessens over time. Our results show that employees are more productive when they
spend more time on internet. Giving constant heightened feedbacks (about their productivity)
provided by ICT to workers should be the better way to sensitize them about the extent of
technology monitoring and to increase their performance.
Keywords: Behavioral economics; Experimental economics; Information and
Communication Technologies; Monitoring; Performance; Incentives

V
Résumé
Cette thèse explore l’impact des technologies de l'information et de la communication (TIC)
sur le comportement des employés. Alors que la théorie néoclassique de la croissance
considère les TIC comme un outil utilisé dans le processus de production, nous nous sommes
basés sur une théorie qui stipule que les technologies ont deux aspects différents. Les
technologies de la communication centralisent la prise de décision tandis que les technologies
de l'information déplacent la prise de décision au niveau de l'employé. Nous avons abordé les
questions du meilleur type de technologies pour l’amélioration de la performance des
employés, des coûts engendrés par l'utilisation de ce type de technologies et de l’impact de la
surveillance informatique dans la réduction de ces coûts. Nous avons utilisé la méthode
expérimentale pour répondre à ces questions. Nos résultats montrent que les employés
préfèrent utiliser les technologies de l'information et ceux qui les utilisent sont plus productifs
que les autres. Nous trouvons également que l’environnement de travail et les technologies
qui favorisent la prise de décision au niveau de l'employé pourraient engendrer des coûts
importants pour l’entreprise. En effet, les employés sont plus disposés à s'engager dans les
activités non productives dans le but d'influencer la décision de leur manager, et ce lorsqu’ils
peuvent manipuler l’information même en l’absence d’incitations monétaires. Cependant, la
surveillance informatique est efficace pour réduire ces coûts néanmoins, son effet diminue au
fil du temps. Nos résultats montrent que les employés les plus productifs sont ceux qui ont
passé le plus de temps sur internet. Donner aux employés les informations constantes et
détaillées (sur leur performance) produites par les technologies pourrait être une façon
efficace de les sensibiliser sur l’ampleur de la surveillance informatique afin d’agir sur leur
productivité.
Mots clés : Economie comportementale ; Economie expérimentale ; Technologies de
l’Information et de la Communication ; Surveillance ; Performance ; Incitations

VI
Remerciements
Entêté pour certains, déterminé pour d’autres, c’est le moment pour moi de remercier tous
ceux qui de près ou de loin, sans le savoir et parfois même sans le vouloir ont participé
l’aboutissement de ces travaux de recherche.
A tout seigneur tout honneur… Je commencerai par Gilles Grolleau qui ne devrait pas être
dans cette rubrique car le mot MERCI n’est pas assez riche pour t’exprimer ma gratitude. Tu
m’as fait découvrir et aimer la recherche en général et l’économie expérimentale en
particulier. Par ta signature je suis resté étudiant de l’université de cette belle ville que je
considère comme chez moi en occident. Plus encore, tu as accepté de m’aider et de
m’accompagner jusqu’au terme du projet malgré ton indisponibilité. Toujours prompt dans les
réponses, je garderai précieusement cette richesse que représentent toutes tes versions de mes
manuscrits en suivi de modifications. Tu es pour moi un modèle de chercheur et d’Homme.
On ne jette pas le bébé avec l’eau du bain… J’adresse donc mes premiers mots de
remerciements à Ludivine Martin et Angela Sutan pour leur encadrement. Elles n’ont ménagé
aucun effort pour mettre à ma disposition les moyens nécessaires pour effectuer ce travail.
Merci aussi à Ludivine pour le financement des trois premières années de cette thèse à travers
le projet TWAIN et pour ses leçons pratiques d’économétrie. Je remercie Brice Corgnet qui
m’a tout appris au sujet des expériences en laboratoire, je n’aurais rien pu faire sans toi.
Je remercie François Cochard et Naoufel Mzoughi qui ont accepté d'être les rapporteurs de
cette thèse. Je remercie également Jean-Michel Salles qui a accepté d'examiner ce travail.
Mes mots de remerciements s’adressent aussi à Lisette Ibanez, Jean-Michel Salles et Patrick
De Sentis qui m’ont assisté pendant la douloureuse épreuve que j’ai traversée à la fin de ma
troisième année de thèse.
Je remercie Guillaume Hollard et Nicolas Poussing pour leur contribution à l’amélioration de
la qualité de ce travail.
Je tiens à remercier mon équipe d’accueil au LISER et tous les autres chercheurs qui m’ont
communiqué leur savoir et apporté leur soutien. Je pense à Michel, Uyen et à Maria- Noel.
Je tiens à remercier toute l’équipe de l’ESI de Chapman University qui m’a apporté son
soutien technique, moral et financier. Un merci tout particulier à Stephen Rassenti et Vernon

VII
Smith pour l’accueil et le financement de l’expérience du chapitre II. Cette expérience
n’aurait jamais pu bien se dérouler sans l’aide de Megan, Ryan et Roberto Hernan Gonzalez
que je remercie également.
Je tiens à remercier les équipes du LESSAC et de l’ESC Dijon qui m’ont communiqué leur
savoir et apporté leur soutien logistique et technique. Je pense tout particulièrement à Jérémy,
Emilie, Sylvain et Guillermo. Je pense également aux stagiaires Marwa, Maryam et Myriam.
Je remercie aussi les équipes du LAMETA et du LEEM pour leurs critiques lors des
présentations internes.
Je remercie mes amis et collègues doctorants de l’UM et de Supagro avec qui j’ai partagé mes
moments de joie, de doute et avec qui j’ai passé des nuits blanches. Je pense à Moktar, Nour,
Ndene, Bocar, Hissein, Mamadou, Ibrahima. Je pense aussi à mes amis et collègues
doctorants du Luxembourg : Bora, Marion, Cindy et Iryna.
Je remercie ma mère, mon père et mes frères et ma sœur pour leurs mots d’encouragements.
Pour leur soutien moral, leurs messages d’encouragement et leur compréhension, je remercie
mes amies Marie, Claire, Théodora, Gaby, Balkis, Dorianne, Orlane, Cindy et mon ami
Mustapha. Je remercie également les époux Kampé et leurs adorables petites filles.
Les retrouvailles et les belles rencontres chez l’Oncle Sam m’ont permis d’affronter
sereinement le dépaysement et à la solitude. Je remercie chaleureusement Elisabeth, Matthew,
Alma, Samantha et Jacqueline pour leur accueil et leur aide.
Je remercie Gery et sa femme May mes grands-parents de Montpellier pour l’amélioration de
mon anglais et pour les bons plats.
Je remercie les secrétaires et le personnel non enseignant pour leur sympathie et leur aide. Je
pense à Maxime, Bégonia, Sonia, Cindy, Thésy, Isabelle sans oublier mon frère Florentin.
Last but not least… Je remercie ma douce et tendre pour sa présence quotidienne malgré la
distance. Les relectures et corrections de mes travaux en anglais. Pour ses mots
d’encouragements, son soutien moral et spirituel et tout le reste, merci bé!
J’ai probablement pu oublier des personnes, en ce moment j’ai juste envie de mettre le point
final. Je remercie de tout cœur tous ceux qui étaient là, qui se reconnaitront dans ce travail.

IX
“…any action performed on a company computer may subject to monitoring even if it is not
transmitted over a network nor stored in a file” (Ariss, 2002, p.554)

X
A mon grand-père Ngatchou Gabriel

XI
Table of contents
Abstract .................................................................................................................................... IV
Résumé ...................................................................................................................................... V
Remerciements ......................................................................................................................... VI
General Introduction ............................................................................................................. - 1 -
References ........................................................................................................................... - 10 -
Chapter I: The effects of Information Technologies versus Communication Technologies on
workers’ performance: An experimental evidence ............................................................. - 14 -
I1. Introduction ................................................................................................................... - 15 -
I2. Literature overview and behavioral hypotheses............................................................ - 18 -
I3. Experimental design and procedures ............................................................................ - 22 -
I3.1. The work task (routine task and problems) ................................................................ - 22 -
I3.2. Information technologies ........................................................................................... - 24 -
I3.3. Communication technologies ..................................................................................... - 25 -
I3.4. Principal’s working activities .................................................................................... - 26 -
I4. Procedures and treatments ............................................................................................ - 26 -
I4.1. Experimental procedures ........................................................................................... - 26 -
I4.2. Treatments .................................................................................................................. - 27 -
I5. Results ........................................................................................................................... - 28 -
I5.1. Descriptive statistics of treatments ............................................................................ - 29 -
I5.2. Econometric results .................................................................................................... - 30 -
I5.2.1. Solving problems .................................................................................................... - 30 -
I5.2.2. Agents’ production .................................................................................................. - 32 -
I5.2.3. Preference between technologies and principal’s activities .................................... - 34 -
I.6. Conclusion ................................................................................................................... - 36 -
References ........................................................................................................................... - 38 -
Appendix I ........................................................................................................................... - 41 -

XII
Chapter II: Influence costs: An experimental evidence ...................................................... - 67 -
II1. Introduction ................................................................................................................. - 68 -
II2. Experimental design and procedures ........................................................................... - 72 -
II2.1. Game design ............................................................................................................. - 72 -
II2.1.1. The work task ........................................................................................................ - 72 -
II2.1.2. Leisure activity (Internet) ...................................................................................... - 73 -
II2.1.3. Monitoring activities .............................................................................................. - 73 -
II2.1.4. Influence activities ................................................................................................. - 74 -
II2.1.5 Payment schemes .................................................................................................... - 75 -
II2.2. Treatments ................................................................................................................ - 75 -
II2.3. Procedures ................................................................................................................ - 76 -
II3. Behavioral hypotheses ................................................................................................. - 78 -
II3.1. Influence activities .................................................................................................... - 78 -
II3.2. Influence costs .......................................................................................................... - 79 -
II3.2.1. Productivity ........................................................................................................... - 79 -
II3.2.2. Decision making .................................................................................................... - 79 -
II4. Results ......................................................................................................................... - 80 -
II4.1. Descriptive statistics of time dedication on each activity per treatments ................. - 80 -
II4.1.1. Influence activities (Time and amount) ................................................................. - 81 -
II4.1.2. Work and internet time .......................................................................................... - 82 -
II4.2. Influence costs .......................................................................................................... - 83 -
II4.2.1. Productivity of the organization ............................................................................ - 83 -
II4.2.2. Decision making .................................................................................................... - 85 -
II5. Conclusion ................................................................................................................... - 89 -
References ........................................................................................................................... - 92 -
Appendix II ......................................................................................................................... - 95 -

XIII
Chapter III: On the impact of technology-based monitoring on workers’ behavior: An
experimental investigation ................................................................................................ - 124 -
III1. Introduction .............................................................................................................. - 125 -
III2. Behavioral hypotheses .............................................................................................. - 129 -
III2.1. Agents’ behaviors .................................................................................................. - 130 -
III2.1.1. Working activity ................................................................................................. - 130 -
III2.1.2. Cheating activity ................................................................................................ - 130 -
III2.1.3. Leisure activity ................................................................................................... - 131 -
III2.2. Principal’s behaviors: monitoring and working .................................................... - 131 -
III3. Experimental design ................................................................................................. - 132 -
III3.1. Design of the activities .......................................................................................... - 132 -
III3.1.1. The work task ..................................................................................................... - 132 -
III3.1.2. The cheating activity .......................................................................................... - 133 -
III3.1.3. The leisure activity ............................................................................................. - 133 -
III3.1.4. The monitoring activity ...................................................................................... - 134 -
III3.2. Treatments ............................................................................................................. - 135 -
III3.3. Experimental procedures ........................................................................................ - 136 -
III4. Results ...................................................................................................................... - 137 -
III4.1. Descriptive statistics .............................................................................................. - 138 -
III4.2.2. Cheating activity ................................................................................................. - 144 -
III5. Discussion and Conclusion ...................................................................................... - 153 -
References ......................................................................................................................... - 156 -
Appendix III ...................................................................................................................... - 159 -
General Conclusion ........................................................................................................... - 177 -
References ......................................................................................................................... - 181 -

XIV
List of figures
Figure 1: Virtual organization, interactions and activities .................................................... - 7 -
Figure I. 1: Screen shot of the work task ............................................................................. - 23 -
Figure I. 2: Example of PDF file_2 (Information Technology) .......................................... - 24 -
Figure I. 3: example of chat screen (Communication technology) ..................................... - 25 -
Figure I. 4: Average of agents’ production and problems solved for each treatment ......... - 29 -
Figure II. 1: Task screen ...................................................................................................... - 73 -
Figure II. 2: Time dedication on each activity per treatments ............................................ - 81 -
Figure II. 3: Average amount of influence activities in cents ............................................. - 82 -
Figure III. 1: Example of principals’ screen for IT monitoring and Traditional monitoring ...... -
134 -
Figure III. 2: Time dedication by agents on shirking activities per treatments ................. - 138 -
Figure III. 3: Agents’ production on average over payment scheme in cents ................... - 159 -
Figure III. 4: Agents cheating (amount in cents) on average over discretionary treatments ...... -
160 -
List of tables
Table I. 1: Expected effects of IT and CT on workers’ productivity .................................. - 22 -
Table I. 2: Summary of treatments ...................................................................................... - 27 -
Table I. 3: Summary of experimental design ...................................................................... - 28 -
Table I. 4: Linear panel regression assessing the impact of IT and CT use by agents for
solving problems ................................................................................................................. - 31 -
Table I. 5: Linear panel regression assessing the use of IT and CT on agents’ production. - 32 -
Table I. 6: Linear panel regression for the time devoted to work by principals ................. - 34 -
Table I. 7: Main effects of IT and CT ................................................................................. - 35 -
Table I. 8: Average agents’ production in cents and (number of problems solved) ........... - 41 -
Table I. 9: Linear panel regression for the impact of IT and CT use on teams’ production - 41 -
Table I. 10: Linear panel regression assessing the preference of agents between IT and CT- 42
-

XV
Table II. 1: Summary of treatments .................................................................................... - 76 -
Table II. 2: Summary of the experimental design ............................................................... - 77 -
Table II. 3: Linear panel regression for individual production for Discretionary and all
treatments ............................................................................................................................ - 84 -
Table II. 4: Linear panel regression for pays allocated by the principal in Discretionary
treatments ............................................................................................................................ - 86 -
Table II. 5: Linear panel regression for pay allocated by the principal in IDP treatment ... - 88 -
Table II. 6: Individual production per treatment for 5 periods ............................................ - 95 -
Table III. 1: Summary of treatments ................................................................................. - 136 -
Table III. 2: Summary of the experimental design ............................................................ - 137 -
Table III. 3: Linear panel regression assessing the impact of the IT monitoring on agents’
behavior for working activity. ........................................................................................... - 142 -
Table III. 4: Linear panel regression assessing the impact of IT monitoring on agents’ and
principals’ behaviors regarding cheating activity for discretionary treatments................ - 145 -
Table III. 5: Linear panel regression assessing the time spent on internet by agents and agents’
pay in ITDP treatment. ...................................................................................................... - 148 -
Table III. 6: Main effects of IT monitoring on agents’ behavior. ..................................... - 149 -
Table III. 7: Linear panel regression assessing the effects of IT monitoring on principals
behavior regarding production and monitoring. ................................................................ - 151 -
Table III. 8: Main effects of IT monitoring on principals’ behavior. ................................ - 152 -
Table III. 9: Comparison of agents’ production over payment scheme. ........................... - 159 -
Table III. 10: Linear panel regression with regarding production and pay for low ability
agents. ................................................................................................................................ - 160 -

General Introduction
- 1 -
General Introduction
The use of technologies at workplace has considerably increased in the last decades. Large
firms have taken advantage of the great number of communication and coordination
capabilities offered by technologies in the spheres of design engineering, production and sale
of goods and services (Colombo and Delmastro, 1999). The advancement in Information and
Communication Technologies (ICT) entailed a decrease of information and communication
costs (Milgrom and Roberts, 1990; Garicano, 2000). The introduction of ICT at workplace
has lowered the production costs by allowing the automation of routine tasks which are
replaced by computerization (Autor et al., 2003). This computerization ensured that work is
being performed as required in the organizational guidelines and thereby lowered human
errors in the production process as well as resources waste. This reduction of information and
communication costs also led to a better organizational planning and improved organizational
communication (Milgrom and Roberts, 1990). This positively impacted firms’ performance.
In the economic framework, studies based on the neoclassical growth theory always
considered ICT as an input in the production process (Chou et al., 2014). ICT serves as
devices which are essential for storing and sharing information and knowledge. According to
this theory, ICT results from the technological progress and is a driver of innovation which
sustained long-term economic growth (Romer, 1990; Aghion and Howitt, 1992). Although
ICT was “identified with the outputs of computers, communications equipment, and software”
(Jorgenson, 2001, p.8), prior empirical studies addressed Information and Communication
Technologies in terms of investment on ICT capital or computers per person (Brynjolfsson
and Hitt, 2000; Black and Lynch, 2001; Colombo and Delmastro, 2004; Bertschek and Kaiser,
2004; Acemoglu et al., 2007). Consequently, these studies did not distinctly take into account
the different aspects of technologies.
However, recent studies considered enterprise software systems such as Enterprise Resource
Planning (ERP) systems, Supply Chain Management (SCM) systems, Customer Relationship
Management (CRM), Computer Assisted Design/Computer Assisted Manufacturing
(CAD/CAM), Computer Performance Monitoring (CPM), Corporate Information System and
internet/broadband (Falk, 2005; Alder and Ambrose, 2005; Bloom et al., 2014; Sun, 2016).
We define ICT as hardware (computers, mobile devices) and software (ERP, CRM, CPM,
internet…) that are usually used in the production process of the organization.

General Introduction
- 2 -
This growing body of literature shed light on the distinct effects of Information technologies
(IT) and Communication technologies (CT) (Bloom et al., 2014; Sun, 2016). On one hand, IT
curtails the costs of acquiring information and by so doing it pushes down decision making at
the workforce level. The ease of information access allowed by the use of IT may increase
agents’ autonomy and discretion concerning decision making. This positive effect called the
empowering effect (Bloom et al., 2014), should increase workers’ productivity (Garicano,
2000; Bertschek and Kaiser, 2004; Garicano and Rossi-Hansberg, 2006; Bloom et al., 2014;
Charness et al., 2012). On the other hand, CT reduces communication costs inside the firm
(Bloom et al., 2014); thus decision making is transferred to higher levels of the hierarchy.
Because workers’ empowerment with IT may lead to a costly loss of control for the principal
(Acemoglu et al., 2007), the latter might be more willing to help (keep under control) workers
by taking advantage of low communication costs instead of giving them more autonomy. This
is the substitution effect (Di Maggio and Van Alstyne, 2013). If workers feel overruled
(Aghion and Tirole, 1997), this might negatively impact their performance (Falk and Kosfeld,
2006; Frey, 1993). So, the implementation of new technologies in the work organization may
have opposite effects on worker’s productivity (Garicano, 2000; Bertschek and Kaiser, 2004;
Garicano and Rossi-Hansberg, 2006; Bloom et al., 2014; Martin and Omrani, 2015; Sun,
2016).
These recent studies on ICT also stressed that technologies which foster more autonomy for
workers (IT) may lead to a higher workers’ productivity (Black and Lynch, 2001; Bresnahan
et al., 2002; Brynjolfsson and Hitt, 2000; Garicano, 2000; Garicano and Rossi-Hansberg,
2006; Bloom et al., 2014; Sun, 2016). Therefore, firms should more invest in IT which entails
a decentralized work environment. However, according to Cyert and March (1963, p.67):
“Where different parts of the organization have responsibility for different pieces of
information relevant to a decision, we would expect some biases in the information
transmitted due to perceptual differences among the subunits and some attempts to manipulate
information as a device for manipulating the decision.” The manipulation of information can
take many forms, “ranging from conscious lies concerning facts, through suppression of
unfavorable information, to simply presenting the information in a way that accentuates the
points supporting the interested party’s preferred decision and then insisting on these points at
every opportunity” (Milgrom and Roberts, 1988, p.156). Since manager and workers’
interests are not perfectly aligned (Acemoglu et al., 2007), workers may engage on cheating

General Introduction
- 3 -
behaviors to maximize their profits (Nagin et al., 2002). Therefore, the implementation of
Information technologies could also be costly for firms.
The use of the technology-based monitoring system (IT monitoring) is an important
consequence of the introduction of ICT at workplace (Ariss, 2002; Alder and Ambrose, 2005;
Sarpong and Rees, 2014; West and Bowman, 2014). “There are many reasons for employers
to use modern technology to keep tabs on employees, among them to: prevent misuse of
company resources; monitor employee performance; ensure that company security is not
breached and guard against legal liability for employee statements or actions’’ (Ariss, 2002,
p.555). This monitoring system keeps details about agents’ attendance (log-in account), time
coded log of all activities performed from their computer terminal, the real time of a website
visited and its duration, over time, break time etc. Consequently, technology features included
in software used by workers allow firms to automatically record indicators of their effort and
performance. The use of this effective monitoring system should lead agents to increase their
effort (Dickinson and Villeval, 2008; Nagin et al., 2002; Ariss, 2002) and reduce the costs of
their empowerment. Nevertheless, the pervasive and invasive nature of the IT monitoring may
also have a counterproductive effect on workers’ behaviors (Deci, 1975; Fehr and Gächter,
2001; Frey, 1993; Frey and Oberholzer-Gee, 1997; Falk and Kosfeld, 2006). Consequently,
the technology-based monitoring may have several effects which could generate opposite
results on workers’ behaviors and performance.
The investigation on ICT use at the level of workers is crucial to reap the full potential of
technologies. The aim of this dissertation is to assess the following question: How does ICT
use impact individual workers’ behaviors? More precisely, are Information technologies
better than Communication technologies for workers’ performance? Is it costless for firms to
empower workers? What is the overall effect of the technology-based monitoring on workers’
productivity and behaviors?
The issue of ICT at the workers’ level is worthwhile since evidence suggest that the
implementation of technologies at workplace has to be combined with organizational changes
for more efficiency (Milgrom and Roberts, 1990; Brynjolfsson and Hitt, 2000; Black and
Lynch, 2001; Bresnahan et al., 2002; Garicano, 2000; Bertschek and Kaiser, 2004; Garicano
and Rossi-Hansberg, 2006; Bloom et al., 2014). Assessing the question of the impacts of ICT
use on workers’ behaviors may enable us to fill the gap of the scarcity of studies on this issue
(Martin and Omrani, 2015; Sun, 2016). This could be useful to know which changes should

General Introduction
- 4 -
be adopted and how organizational changes should be adapted in order to maximize firms’
efficiency.
Indeed, some changes like employee involvement in decision making, compensation,
enhancement group work, flattering hierarchies, work allocation, scheduling etc. directly
concern the workforce (Bertschek and Kaiser, 2004; Falk, 2005). Employees can work where
and when they feel the most comfortable and productive. Distance and space are no more
constraints for firms as ICT use enabled teleworking, virtual teams and work at home.
However, some studies have linked the use of ICT with anxiety, depression, decrease in job
satisfaction (Aubert et al., 2004). Employees often feel stressed and distrusted because their
privacy is violated by the technology-based monitoring (Ariss, 2002). So the implementation
of technologies could also negatively impact workers’ performance.
All these changes and capabilities generated by the widespread of ICT in workplace are likely
to impact workers’ productivity. It is clear that effects of ICT use on workers’ performance
may vary according to organizational changes regarding human resources management (Black
and Lynch, 2001). These technological and organizational changes may also impact workers’
behaviors (Sun, 2016). Even though technological changes facilitated by ICT contributed to
the increase of firms’ productivity (Black and Lynch, 2001; Bresnahan et al., 2002;
Brynjolfsson and Hitt, 2000), these changes also incurred substantial costs of workplace
reorganization (Colombo and Delmastro, 2004; Bertschek and Kaiser, 2004). Indeed, firms
did not only face investment costs on new technologies but also costs of implementing
organizational changes (Schaefer, 1998), engendered by the decrease of information and
communication costs (Black and Lynch, 2001).
Organizational costs could be generated by workers’ behaviors who are reluctant to
organizational changes (Schaefer, 1998) or who could attempt to influence these changes in
favor of their own interests (Milgrom, 1988; Milgrom and Roberts, 1988, 1990b). Also, there
are several cases where agents got fired because of technologies misuse. These misuses of
computer systems and technology resources may have a negative impact on the firm
efficiency (Koch and Nafziger, 2015). Investigating the impacts of ICT use on workers’
behaviors might contribute to minimize costs engendered by technological changes.

General Introduction
- 5 -
Method
We used the experimental methodology for addressing the impacts of ICT use on workers’
behaviors issues. This method enabled to overcome some difficulties that are usually met
when some studies aim to test empirically the predictions of firm theories (Powell, 2014). For
example according to Nagin (2002, p.850), “… it will be very difficult to disentangle the
effects of monitoring strategies from responses to other unobserved features of the firm’s
employees or its human resource system.’’. Details regarding individuals and teams’
production are generally difficult to measure and collect with surveys. This is the added value
provided by the experimental methodology to the literature in economics. Indeed, we
simulated realistic work environment in the laboratory with real-effort tasks in our
experiments. This permitted us to observe and collect data regarding manager and workers’
productivity and behaviors. In a controlled and repeated laboratory environment, we were
able to test specific key variables of predictions from theoretical models that we relied on for
our investigation. The experimental method allowed us to confirm some causal relationships
which underlined these theories (Falk and Fehr, 2003; Ostrom, 2006; Charness and Kuhn,
2011; Camerer and Weber, 2013).
Virtual Organization software
We used the Virtual Organization (VO) software1 to conduct two experiments in California
(Orange) and one in France (Dijon). The VO software aims to propose a new approach of
analyzing organizations. The most important contribution of this software is to reproduces
some features of real workplace environment such as real-effort work task as well as real-time
monitoring and real-time access to Internet (Corgnet et al., 2015). So the VO platform can be
considered as a mix between lab and field experiments. This software allows a tight control
for the experimenter as well as relevant levels of realism. More information is available on the
Virtual Organizations website2.
The VO platform permitted us to take account of relevant Information technologies such as
internet and the technology-based monitoring as well as Communication technologies through
the chat option embedded in this software. There are nine main features that can be explored
by using the VO software: Work, Incentives, Leisure, Hierarchy, Supervision (Peer Pressure),
1 The principal investigators behind the Virtual Organization software are Dr. Stephen Rassenti (Chapman University), Dr. Brice Corgnet (EM Lyon) and Dr. Roberto Hernan Gonzalez (Nottingham University). 2 https://sites.google.com/site/corgnetb/virtual-organizations.

General Introduction
- 6 -
Influence activities, Promotion (Firing and Retirement), Help (Teamwork) and Voting.
However, we will only present features that we used to run our experiments.
The Virtual Organization software considers organization with three levels of hierarchy. On
top of the organization there are E-Subjects, they can promote and fire other subjects. C-
Subjects are in the middle of the firm. They can promote and fire B-Subjects which are at the
bottom of the organization. They can also allocate payoff as well as dole out bonuses to them.
We designed organizations with two ladders (C-Subjects and B-Subjects) to simplify our
investigation. All these types of subjects can communicate through the chat option embedded
in the VO software. To implement the Communication technologies in Chapter I, we decided
to set up a vertical communication between C-Subjects and B-Subjects only. B-Subjects were
not allowed to communicate amongst themselves.
All subjects are able to perform a Work task. The task consists in summing up numbers in a
table or auditing it for errors. It is a long, repetitive and effortful task (e.g. Dohmen and Falk,
2011; Eriksson et al., 2009; Niederle and Vesterlund, 2007) that was designed to reduce as
much as possible the intrinsic motivation derived from performing the task just for its sake
(Corgnet et al., 2015). We designed a more laborious task by filling some tables with decimal
numbers in order to implement what Bloom et al. (2014) called “problems to solve” in the
experiment of Chapter I.
One of the most important features available on the VO software is the Internet option.
Indeed, the Virtual organization platform is the first software for experiments that implements
the use of Internet at work environment. Subjects can switch to this real leisure activity at any
time during the experiment. They are informed about the confidentiality of their internet
usage. The last web page they visited is automatically displayed when they return to the
Internet screen after switching to another activity. Since the internet browser is embedded in
the software, we were able to keep record of time spent by subjects on Internet, as well as the
number of times they switch to this activity to another.
By using the Boost option of the VO software, subjects can falsely increase the level of
production as observed by others. By cheating, subjects give wrong information that makes
them look good compared to others in order to influence the decision of their line manager.
We chose to set a cost in terms of time as subjects were unable to undertake another activity

General Introduction
- 7 -
while using the Boost option. This allows subjects to be caught while cheating. In our
experiments, only B-Subjects were able to use the Boost option.
The Virtual Organization software also enabled us to implement the intrusive and invasive
technology-based monitoring. As mentioned above, this software allows implementing a real-
time supervision. Indeed, subjects are able to monitor others’ activities at any time during the
experiment. In our experiments, only C-Subjects were allowed to supervise B-Subjects and we
decided not to inform supervisees as “…any action performed on a company computer may
subject to monitoring even if it is not transmitted over a network nor stored in a file” (Ariss,
2002, p.554). There are Summary View and History table features we set up to control
information displayed for the supervisor. The VO software allowed us to measure the time
spent by C-Subjects in monitoring B-Subjects as well as how many times subjects were
supervised.
Figure 1: Virtual organization, interactions and activities
We used STATA to analyze data from experiments. We also used the clustered version of the
Wilcoxon rank-sum test as well as linear panel regressions with random effects and clustered
standard errors for teams. This allowed us to take into account the fact that the performance of
subjects in the same team may be correlated. Indeed, we used team incentives and the relative
contribution of each subject was displayed on a subjects’ screen during each the period. Also,
the pay of other team members was displayed at the end of each period. This may affect
subjects’ motivation. So, this correction was especially relevant.

General Introduction
- 8 -
Conceptual framework
We started our investigation by testing the theory of “knowledge hierarchy” which points out
that technologies have two key aspects which have different impacts on workers’ performance
(Garicano, 2000; Garicano and Rossi-Hansberg, 2006; Bloom et al., 2014) in Chapter I.
Information technologies (IT) lead to decentralization while Communication technologies
(CT) entail a centralization of decision making (Garicano, 2000; Garicano and Rossi-
Hansberg, 2006; Bloom et al., 2014). The theoretical model which underlies the knowledge
hierarchy literature is interesting because it serves as a framework to study the different
aspects of ICT. The important finding of this theory is that both communication and
Information technologies increase workers’ productivity. Nevertheless, Information
technologies which allow more autonomy to workers lead to a higher performance. Our
between subjects experimental design allowed us to compare workers’ productivity regarding
Information technologies and Communication technologies use. One of our important
contributions to the literature was to investigate workers’ performance about devices
embedding both IT and CT. This allowed us to study workers’ preference between these two
technologies.
In Chapter II, we aimed to investigate organizational costs generated by workers’ behaviors
when technologies push decision making at their level (Chapter I). The influence costs theory
has highlighted substantial costs engendered by workers who are willing to manipulate
information (Milgrom and Roberts, 1988). According to Milgrom and Roberts (1988),
influence costs are costs generated by agents’ activities to provide information which makes
them look good relatively to others in the way that it would affect the principal’s decisions on
their behalf. We tested some features of influence costs theory. The costs of influence
activities depend on how the information is gathered and on the reward systems in the
organization. We focused on the impact of influence activities on the principal’s discretion
regarding the allocation of pay but we also ran treatments with fixed pay reward system.
To avoid agents to engage on time wasting activities (Chapter II), firms can take advantage on
invisible, pervasive and invasive monitoring system allowed by technologies. Chapter III
aimed to investigate the effects of the technology-based monitoring on workers’ behaviors
concerning working, leisure (browsing the web) and cheating (manipulation of information)
activities. Although some technologies provide more autonomy to workers (Chapter I), they
also allow the manager to easily evaluate their effort by providing a heightened transparency
of the work process and the instant availability of work performance indicators. This chapter

General Introduction
- 9 -
also enabled us to understand why some workers abuse the use of technologies even though
they sign the IT chart. We also addressed the issue of the principal’s behavior regarding this
monitoring system.
This dissertation may contribute to a better knowledge and understanding of the ICT use on
workers’ behaviors in the light of theoretical predictions. Our findings may rise up managerial
attention on the effects of ICT use at workplace regarding productivity and technology-based
monitoring. Our three chapters have given rise to submitted and accepted papers in top tier
journals with the contribution of co-authors and can be read independently.

General Introduction
- 10 -
References
Acemoglu, D., Aghion, P., Lelarge C., Van Reenen, J., and F. Zilibotti (2007) ‘Technology, Information, and the Decentralization of the Firm.’ Quarterly Journal of Economics 122(4), 1759–99.
Aghion, P. and E. Howitt (1992) ‘A model of growth through creative destruction.’ Econometrica 60 (2), 323–351.
Aghion, P., and J. Tirole (1997) ‘Formal and real authority in organizations.’ The Journal of
Political Economy 105 (1), 1-29.
Alder, G. S., and M. L. Ambrose (2005) ‘An examination of the effect of computerized performance monitoring feedback on monitoring fairness, performance, and satisfaction.’ Organizational Behavior & Human Decision Processes 97, 161-177.
Ariss, S. A. (2002) ‘Computer monitoring: benefits and pitfalls facing management.’ Information & Management, 39 (7) 553– 558.
Aubert, P., Caroli, E., and R. Muriel (2006), ‘New Technologies, workplace organization and the structure of the workforce: firm-level evidence.’ Economic Journal 116, 73-93.
Autor, D. H., F. Levy, and R. J. Murnane (2003) ‘The skill content of recent technological change: An empirical exploration’ Quarterly Journal of Economics 118(4), 1279-1333.
Black, S. E., and L. M. Lynch (2001) ‘How to compete: The impact of workplace practices and information technology on productivity.’ The Review of Economics and Statistics 83(3), 434–445.
Bertschek I., and U. Kaiser (2004) ‘Productivity effects of organizational change: Microeconometric evidence.’ Management Science 50(3), 394-404.
Bloom, N., L. Garicano, R. Sadun, and J. Van Reenen (2014) ‘The distinct effects of
information technology and communication technology on firm organization’, Management Science 60(12), 2859-2885.
Bresnahan, T. F., E. Brynjolfsson, and L. M. Hitt (2002) ‘Information technology, workplace organization, and the demand for skilled labor: Firm-level evidence.’ The Quarterly
Journal of Economics 117(1), 339–376.
Brynjolfsson, E., and L. M. Hitt (2000) ‘Beyond computation: Information technology, organizational transformation and business performance.’ The Journal of Economic
Perspectives 14(4), 23–48.
Camerer, Colin, and Roberto Weber. "Experimental Organizational Economics." In The Handbook of Organizational Economics. edited by R. Gibbons and J. Roberts. Princeton, NJ: Princeton University Press, forthcoming.
Carpenter, J., P. Matthews, and J. Schirm (2010) ‘Tournaments and office politics: Evidence from a real effort experiment.’ The American Economic Review 100(1), 504–517.

General Introduction
- 11 -
Charness, G., and P. Kuhn (2011) ‘Lab Labor: What Can Labor Economists Learn from the Lab?’ O. Ashenfelter and D. Card (eds.), Handbook of Labor Economics, Volume 4A. San Diego, CA, Amsterdam: Elsevier, North Holland, Chapter 3, 229-330.
Charness, G., Cobo-Reyes, R., Jinénez, N., Lacomba, J. A and F. Lagos, (2012) ‘The Hidden Advantage of Delegation: Pareto-improvements in a Gift-exchange Game’, American
Economic Review 102(5) 2358-2379. Chou, Y., Chuang, H. H., and B. B., Shao (2014). ‘The impacts of information technology on
total factor productivity: A look at externalities and innovations.’ International Journal of
Production Economics 158, 290-299. Colombo, M.G., and M. Delmastro (1999) ‘Some stylized facts on organization and its
evolution.’ Journal of Economic Behavior & Organization 40, 255-274.
Colombo, M.G., and M. Delmastro (2004) ‘The determinants of organizational change and structural inertia: technological and organizational factors.’ Journal of Economics and
Management Strategy 11(4), 595-635. Corgnet, B., Hernán-González, R., and E. Schniter (2015). Why real leisure really matters:
Incentive effects on real effort in the laboratory. Experimental Economics, 18(2), 284-301. Cyert, R., and J. March (1963) ‘A Behavioral Theory of the Firm’. Englewood Cliffs, NJ:
Prentice-Hall. Deci, E. L. (1975) Intrinsic Motivation, New York, NY: Plenum Press.
Dickinson, D., and M.-C. Villeval (2008) ‘Does monitoring decrease work effort? The complementarity between agency and crowding-out theories.’ Games and Economic
Behavior 63(1), 56–76. Dohmen, T., and A. Falk (2011) ‘Performance pay and multi-dimensional sorting:
Productivity, preferences and gender.’ The American Economic Review 101(2), 556–590. Eriksson, T., A. Poulsen, and M.-C. Villeval (2009) ‘Feedback and incentives: Experimental
evidence.’ Labour Economics 16(6), 679–688. Falk, A. and E. Fehr (2003) “Why Labour Market Experiments?,” Labour Economics 10(4),
399-406. Falk, A., and M. Kosfeld (2006) ‘The hidden costs of control.’ The American Economic
Review 96(5), 1611–1630.
Falk, M., (2005) ‘ICT-linked firm reorganisation and productivity gains.’ Technovation 25 (11), 1229- 1250.
Frey, B. S. (1993) ‘Does monitoring increase work effort? The rivalry between trust and
loyalty.’ Economic Inquiry 31(4), 663–670. Frey, B. S., and F. Oberholzer-Gee (1997) ‘The cost of price incentives: An empirical analysis
of motivation crowding-out.’ The American Economic Review 87(4), 746–755.

General Introduction
- 12 -
Garicano, L. (2000) ‘Hierarchies and the organization of knowledge in production’, Journal
of Political Economy 108(5), 874-904. Garicano, L., and E. Rossi-Hansberg (2006) ‘Organization and inequality in a knowledge
economy’, The Quarterly Journal of Economics 121(4), 1383-1435.
Jorgenson, D.W., (2001) ‘Information technology and the US economy’. American Economic
Review 91 (1), 1–32. Koch, A. K., and J. Nafziger (2015) ‘A Real-Effort Experiment on Gift Exchange with
Temptation’. IZA Discussion Paper No. 9084. Nagin, D. S., J. B. Rebitzer, S. Sanders, and L. J. Taylor (2002) ‘Monitoring, motivation, and
management: The determinants of opportunistic behavior in a field experiment.’ The
American Economic Review 92(4), 850–873. Martin, L., and N., Omrani (2015) ‘An assessment of trends in technology use, innovative
work practices and employees' attitudes in Europe.’ Applied Economics 74 (6), 623-638. Milgrom, P., and J. Roberts (1988) ‘An Economic Approach to Influence Activities in
Organization’ American Journal of Sociology 94 (S), 154-179. Milgrom, P., and Roberts, J. (1990). The economics of modern manufacturing technology,
strategy and organisation. The American Economic Review, 311–328. Niederle, M., and L. Vesterlund (2007) ‘Do women shy away from competition? Do men
compete too much?’ The Quarterly Journal of Economics 3(8), 1067–1101.
Ostrom, E. (2006) ‘The value-added of laboratory experiments for the study of institutions and common-pool resources.’ Journal of Economic Behavior & Organization 61, (2) 149–163.
Powell, M. (2014) ‘An Influence-Cost Model of Organizational Practices and Firm
Boundaries.’ Journal of Law, Economics, & Organization, forthcoming. Romer, P. (1990) ‘Endogenous technological change.’ Journal of Political Economy 98 (5),
71–101.
Sarpong, S., and D. Rees (2014) ‘Assessing the effects of “big brother” in a workplace: The case of WAST.’ European Management Journal 32, 216-222.
Schaefer, S. ‘Influence costs, structural inertia, and organizational change.’ Journal of
Economics and Management Strategy, 1998, 7(2), 237–63. Sun, J. (2016) ‘The effect of information technology on IT-facilitated coordination, IT-
facilitated autonomy, and decision-makings at the individual level’. Applied Economics, 1-18.
West, J. P., and J. S. Bowman (2016) ‘Electronic surveillance at work an ethical
analysis.’ Administration & Society 48 (5), 628-651.

- 14 -
Chapter I: The effects of Information Technologies versus
Communication Technologies on workers’
performance: An experimental evidence
Chapter I: Information VS Communication Technologies
- 15 -
I1. Introduction
New technologies are regularly integrated in firms with the aim to improve workers’
productivity (Falk, 2005). Although significant changes in the workplace are the result of the
widespread use of Information and Communication Technologies (ICT) (Black and Lynch,
2001), studies on its impact at the level of workers are scarce (Martin and Omrani, 2015; Sun,
2016). Indeed, ICT has intensely reshaped the workplace and completely modified the way
employees used to work. We consider new technologies such as hardware and software
(computers, internet, ERP, ect…) that are most often used in the production process
(Colombo and Delmastro, 2004). These sophisticated technologies are used to accomplish
routine as well as some complex tasks. The introduction of ICT at the workplace entails the
decrease of acquiring, verifying, and communicating information costs and thus leads to a
better organizational planning and improves organizational communication (Milgrom and
Roberts, 1990). Therefore, the use of ICT has simplified the way employees perform their
work as well as their management in the firm (Alder and Ambrose, 2005). ICT also enables
adjustments in authority relationships by modifying the coordination of the decision-making
process (Falk, 2005; Sun, 2016).
All these changes generated by the diffusion of ICT in the workplace impacted workers’
productivity but outcomes are unclear (Martin and Omrani, 2015; Sun, 2016). Also, several
studies on the impact of ICT use on the firm productivity showed that the implementation of
technologies has to be combined with some organizational changes for more efficiency
(Milgrom and Roberts, 1990; Brynjolfsson and Hitt, 2000; Black and Lynch, 2001; Bresnahan
et al., 2002). These organizational changes such as “…compensation, information sharing,
employee involvement in decision-making, and scheduling” (Falk, 2005, p.1230) which
directly concern workers, affect their productivity and consequently the efficiency of the firm.
So, to implement or adapt organizational changes which maximize the firm performance, the
crucial question is how does the use of technologies impact workers’ performance? By
adopting changes which may increase workers’ performance, the firm should reap more
benefits of ICT use. Also, since changes imply some costs for the firm (Bertschek and Kaiser,
2004; Falk, 2005; Colombo and Delmastro, 1999), the investigation of ICT effects at level
workers should be needed to decrease the costs of these changes and to limit the waste of
resources and the misuse of technologies by workers.

Chapter I: Information VS Communication Technologies
- 16 -
Our research question is worthwhile because the implementation of ICT in the work
organization may have opposite effects on worker’s productivity (Garicano, 2000; Bertschek
and Kaiser, 2004; Garicano and Rossi-Hansberg, 2006; Bloom et al., 2014; Martin and
Omrani, 2015; Sun, 2016). On one hand, ICT enables workers to easily process information,
create new information and selectively access new information inside the firm. Hardware and
software also allow firms to retrieve and store large amounts of data faster; ICT plays a
strategic role in the diffusion of organizational data at all hierarchical levels. Consequently,
workers at the lower level of the hierarchy may easily access to available information for
making decisions without seeking instructions from their manager. Decisions which can be
made quickly by workers may be efficient since available information is relevant. Moreover,
workers may solve a wide range of problems they face without need to rely on their manager.
So, the redistribution of information access in the firm due to ICT entails more autonomy and
discretion for workers concerning the acquisition of information and decision making
(Brynjolfsson and Hitt, 2000; Sun 2016); this should have a positive effect on workers’
productivity (Garicano, 2000; Bertschek and Kaiser, 2004; Garicano and Rossi-Hansberg,
2006; Bloom et al., 2014; Charness et al., 2012).
On the other hand, ICT enables faster communication between workers and manager (Green,
2006). Indeed, ICT also allows the manager to communicate easily and cheaply across time
and geographic locations with one or several workers at the same time. Because the interests
of the manager and workers are not perfectly aligned, workers’ autonomy may generate a
costly loss of control for the manager (Acemoglu et al., 2007). Therefore, the manager may
limit workers’ autonomy by taking advantage of the communication tools entailed by
technologies. Thereby, workers’ discretion engendered by ICT may be restricted by the
manager who doesn’t want to lose his authority and control on workers’ activities. Also, the
manager could not be confident about the efficiency of decision made by employees
(Acemoglu et al., 2007). Accordingly, workers should need the validation of their decision
and rely on the manager to have the relevant information before performing their activities.
The centralization of the decision making process by the manager will lead to a decrease of
workers’ discretion. This situation is likely to jeopardize communication if workers feel
overruled (Aghion and Tirole, 1997) and could negatively impact their performance (Falk and
Kosfeld, 2006; Frey, 1993).
In this chapter, our first contribution is to fill the gap of the lack of studies on effects of ICT
use at workers level. To do so, we use the experimental method to test the model developed

Chapter I: Information VS Communication Technologies
- 17 -
by Bloom et al. (2014) based on the “knowledge hierarchy” theory of Garicano (2000). This
model distinguishes Information Technologies (IT) from Communication Technologies (CT).
Bloom et al. (2014) focused on the impact of Information versus Communication technologies
on the allocation of decision making between manager and workers. This model allows us to
take into account different aspects of technologies for investigating the impacts of the use of
ICT on workers’ performance. One important insight of this model is to show that
Information technologies which engender a greater workers’ autonomy lead to a highest
workers’ productivity. Our research question appears more relevant since there are some
hardware like computers or software like ERP (Enterprise Resource Planning) which
encompass both communication and information systems.
The experimental method is very useful for that purpose since individuals and teams’
production are hard to collect with survey data. Experimental data enable us to deepen
existing analyses in a highly controlled environment. Our experimental design allows us to
compare workers’ performance with Information technologies and Communication
technologies. More precisely, agents were autonomous to solve problems by searching
solution in PDF files (IT) or needed to chat with the principal to ask for solution to solve
problems (CT). Autonomy is defined as the high degree of discretion provided by Information
technologies to workers for decision making in problems solving (Sun, 2016). Our
experimental design also enables us to observe workers’ performance with a device which
encompasses both IT and CT.
Our second contribution to the literature is to investigate workers’ performance with devices
that embedded both IT and CT and workers’ preference regarding IT and CT. Our
experimental design consists in four treatments. The baseline treatment is treatment without
technologies. In the IT and CT treatments, participants were able to use information or
Communication technologies and in the ICT treatment, both technologies were available.
Consistent with the theoretical predictions of the model developed by Bloom et al. (2014), our
results point out that workers solve more problems when they use Information technologies
and that Communication technologies lead workers to rely more on the manager. Our
experimental results show that teams’ production is higher with Information technologies
users and lower with Communication technologies users compared to teams with technologies
non-users. We also find that when both technologies are available no worker use
Communication technologies. The chapter is organized as follows: Section 2 summarizes the
related literature and presents our hypotheses. Section 3 describes the experimental design.
Chapter I: Information VS Communication Technologies
- 18 -
Section 4 provides experimental procedures. Section 5 presents main results and section 6
concludes.
I2. Literature overview and behavioral hypotheses
The investigation on the effects of the ICT use at the level of workers is crucial for
researchers as well as managers to determine how firms which implement ICT are much
better organized and managed (Milgrom and Roberts, 1990). It is clear that these effects may
vary according to organizational changes regarding human resources issues (Black and
Lynch, 2001) but, there is a lack of studies which investigate the impacts of technologies use
at the employees and managers’ level (Martin and Omrani, 2015; Sun, 2016). Bloom et al.
(2014) present a model of the hierarchical organization of decision making in an economy
where knowledge is an essential input in production and agents are heterogeneous in skills.
This model which investigates the effects of Information technologies (IT) versus
Communication technologies (CT) in the firm states that IT and CT have different effects on
agents’ and principals’ productivity. Contrary to Aghion and Tirole (1997) and Acemoglu et
al., 2007 which state that the implementation of ICT will lead to the decentralization of
decision making inside the firm, Garicano, (2000); Garicano and Rossi-Hansberg, (2006);
Bloom et al. (2014) suggest that the implementation of ICT use at workplace has two key
aspects which impact differently the decision making in firms. Information technologies and
Communication technologies have to be taken separately in order to better understand the
impacts of ICT use on workers’ performance (Garicano, 2000; Garicano and Rossi-Hansberg,
2006; Bloom et al., 2014).
The first key aspect is Information technologies (IT). The ERP (Enterprise Resource
Planning) which is an example of this type of technologies provides a range of information
regarding the production, like energy use, inventories and human resources (Bloom et al.,
2014). Information technologies reduce the cost of accessing information for the agent and
also facilitate the recording and the storage of information. So, Information technologies push
down the decision making because workers easily have access to more information that they
need to make a decision (Garicano and Rossi-Hansberg, 2006). These technologies provide an
“empowering effect” by allowing agents to handle more of the problems they face with no
need to rely on the manager (Bloom et al., 2014).

Chapter I: Information VS Communication Technologies
- 19 -
The second key aspect is the Communication technologies (CT). These technologies reduce
the cost of communication inside the firm, between workers and managers and between
workers. This kind of technologies lowers the costs of control and the collaboration between
members of the firm. The introduction of intranets, the spread of cheap wired and wireless
communications and the presence of LAN/WAN system are the implementation of
Communication technologies (Bloom et al., 2014). The easy sharing of documentation
engendered by Communication technologies fosters the transfer of decision making to the
principal because it is cheaper for the agent to rely on him to make decisions. CT is likely to
reduce the agent’s autonomy (Bloom et al., 2014).
According to this theoretical model, information and communication technologies have very
different impacts on the decision making at each level of an organization. Both lead to the
increase of the productivity by solving problems but in different ways: Information
technologies increase workers’ autonomy and then positively impact workers’ productivity
while Communication technologies decrease workers’ discretion in the decision making
process. CT may also negatively affect the principal's performance because he will devote a
large portion of his time to help other employees (Di Maggio and Van Asltyne, 2013).
Moreover, workers’ performance is supposed to be higher with the use of Information
technologies (Bloom et al., 2014). Information technologies facilitate the acquisition of the
knowledge since learning costs are lower, the production increases and a larger proportion of
problems get solved by workers (Garicano and Rossi-Hansberg, 2006). This is consistent with
previous studies which state that the positive effects of ICT are more salient in a decentralized
work environment which allows more autonomy for employees as they have a greater voice in
decision making (Garicano, 2000; Bertschek and Kaiser, 2004).
Sliwka (2001) showed that agents’ motivation to work hard increases when they have the
discretion on how to perform their work in the sense that they make decisions themselves on
how to carry it out. A work environment which transfers the decision making at the employee
level increases his incentive to acquire information (Aghion and Tirole, 1997). According to
Charness et al. (2012), when agents get a higher scope of decision making they feel more
autonomous, their sense of responsibility increases and they reciprocate by increasing their
performance. Sun (2016) which focus on how the use of ICT impact the decision-making at
workers’ level, showed that the positive effect of ICT on firm performance may be partially
attributed “to its beneficial use in coordination and tendency to foster more autonomy”. All

Chapter I: Information VS Communication Technologies
- 20 -
these papers showed theoretical and empirical evidence of the theoretical predictions of the
Knowledge hierarchy model but up to now, none experimental studies highlight this evidence.
The model:
Bloom et al. (2014) present a simplified version of the theory of “knowledge hierarchy”
(Garicano, 2000). There are 3 levels in the hierarchy of the firm: The corporate manager on
the top of the firm, middle managers in the middle of the hierarchy and production workers at
the bottom floor. There are 2 types of decisions that have to be made in the firm: production
decisions and non-production decisions. Production decision is related to workers’ discretion
about task to perform and is split between middle manager and productions workers. The non-
production decision (investment, hiring, marketing...) concerns middle and corporate
managers. To simplify our investigation, we consider a firm with two ladders (middle
managers and production workers) and production decisions only. We will refer to middle
managers as managers and production workers as workers.
The objective of the firm is to maximize the profit under a knowledge hierarchy by solving
problems. We start by presenting 3 assumptions developed by Bloom et al. (2014). The
production needs time and knowledge which is costly to acquire and can be communicated.
So, a worker can solve a problem or rely on the manager for help. The output of problem
solved by a worker is normalized to 1. Some recurrent problems are distributed according to a
probability density function f (z) whose cumulative distribution function is F(z). Knowledge z
is normalized in [0, 1] and knowledge acquisition cost is proportional to the knowledge level
( ). A worker can solve a fraction of F(zp) problems and requests managers for help with a
fraction of 1-F(zp). The communication cost incurred by manager’s help is h per units of time.
More common problems are easier and solved by workers i.e. f '(z) <0). A manager will need
a total time of [1 − F( )] to help each worker. For optimal production, the number of
middle managers required is [1 − F( )] =
The wages of managers and workers are wn and wp according to their knowledge level. If the
fire faces N problems, the maximization of the profit of the firm per problem can be written
as:
by replacing nm in the equation below we can write the maximization program as follow:

Chapter I: Information VS Communication Technologies
- 21 -
The optimal organization will face a tradeoff between information acquisition and helping
costs. The reduction of information acquisition costs (a) allowed by IT may lead to an
increase of workers’ knowledge and thus of their autonomy therefore, they will solve more
problems. The reduction of communication costs (h) allowed by CT may lead to a decrease
workers’ autonomy as it is cheaper to ask for help.
Based on the predictions of the theoretical model, we formulate the following hypotheses:
Hypothesis 1: Solving problems
We expect: i) Information technologies users to have the higher number of problems solved
compared to non-users. ii) Communication technologies users will have the lower number of
problems solved compared to non-users.
Garicano, (2000); Garicano and Rossi-Hansberg, (2006); Bloom et al. (2014) associate
Information technologies with more agility for the agent to make autonomous decisions, there
is evidence of the positive impact of autonomy on effort (Aghion et al., 2013; Charness et al.,
2012; Sliwka, 2001). Also, Chen et al. (2013) find that people who use a search technology
are more efficient than non-users. Thanks to the theoretical predictions and findings, we can
also formulate the following hypothesis:
Hypothesis 2: Production (routines tasks + problems)
We expect: i) IT users will be more productive than non-users. ii) Agents using
Communication technologies will produce less than non-users. iii) Team production will be
higher with IT users and lower with CT users.
According to the team theory (Bolton and Dewatripont, 1994; Marschak and Radner, 1972;
Sah and Stiglitz, 1986; Van Zandt, 1999) and the recent contribution of Di Maggio and Van
Alstyne (2013), the flow of information between principal and agents drives individual
behaviors. It has been shown that there is a trade-off for the agent between acquiring himself
the information to make a decision and asking for the relevant information to the manager. If
agents rely more on managers to ask for help since communication costs are low, principals
will spend more time solving problems faced by agents. This effect is called the “substitution
effect” by Di Maggio and Van Alstyne (2013) and leads us to formulate the following
hypotheses:

Chapter I: Information VS Communication Technologies
- 22 -
Hypothesis 3 (Preference between technologies and principal’s production)
We expect: i) Agents will rely less on principal when Information technologies will be
available. ii) The principal’s production will be lower when he will be solicited to solve
problems.
We summarize our main hypotheses in the table below:
Table I. 1: Expected effects of IT and CT on workers’ productivity
Number of
problem solved
Requesting
help
Agents’
production
Principal’s
production
Team
production
IT + - + Not tested +
CT - + - - -
I3. Experimental design and procedures
We ran our experiment through the Virtual organization software3 (Corgnet et al., 2015)
which allows for the reproduction of relevant features of a real workplace environment. As
discussed in the presentation of the model, we considered a firm with two ladders (principal
and agents) and productive decisions only. We built our experimental design in a way that
agents faced routine tasks and problems in the production process. They were able to find the
solution on their own through Information technologies or they could rely on the principal to
solve problems through Communication technologies or both according to the treatment.
I3.1. The work task (routine task and problems)
The experiment conducted was based on a real effort task that consisted of summing up 25
repetitive numbers in a table (Corgnet et al., 2015; Dohmen and Falk, 2011; Ericksson et al.,
2009; Niederle and Vesterlund, 2007). In each period, participants were asked to solve as
many different tables as they wanted according to their ability and were paid accordingly.
Each table had five rows and five columns of randomly-generated numbers; the use of pen,
3The Virtual Organization software built at the Economic Science Institute (ESI) of Chapman University. https://sites.google.com/site/corgnetb/virtual-organizations

Chapter I: Information VS Communication Technologies
- 23 -
scratching paper, calculator or any other computer-based devices was not allowed.
Participants had to provide a separate subtotal for all of the 4 columns before providing the
final answer of the table. Once the final sum was submitted, a gain or a loss followed by a
new table appeared on the screen depending on whether the answer was correct or not. To
implement the occurrence of routine tasks and problems during the production process, we
designed 2 types of tables: easy tables and difficult tables. So, the work task is made up of
routine tasks (easy tables) and problems (difficult tables) solved.
Figure I. 1: Screen shot of the work task
The easy tables were tables with integers between zero and three and the difficult tables were
tables with decimal numbers only. Those numbers were generated randomly with the same
level of difficulty for each participant4. The decimal numbers were equal to 0.65, 1.5, 2.35,
and 3.45 as shown in Figure I.1. Each difficult table had an integer in the first cell as the
table's number which was useful to quickly identify the problem when using Communication
technologies. The frequency of the problems to solve was the same for all participants.
To solve difficult tables which were more laborious to sum up mentally, agents were allowed
to use Communication technologies, Information technologies or both according to the
treatment. Communication technologies enabled agents to ask for help to the principal who
received 2 PDF files with the solutions of difficult tables at the beginning of the experiment.
Information technologies allowed agents to solve a given table by looking up directly the
solution in one or both PDF files available on their computer’s desktop. Asking for help to the
principal or looking up in PDF files entailed some costs that were directly subtracted from the
4The work task started by an easy table followed by a difficult table and so on.

Chapter I: Information VS Communication Technologies
- 24 -
individual earnings of each participant at the end of the experiment according to their
declaration5.
I3.2. Information technologies
Information technologies provide a range of information regarding the production, and reduce
the cost of accessing information stored in database for the agent. One of the most important
features of IT is that it allows agents to have more autonomy (Bloom et al., 2014). Autonomy
being defined as the facility the IT use offers to workers to have more freedom and discretion
in decision making (Sun, 2016).
Figure I. 2: Example of PDF file_2 (Information Technology)
To mimic the autonomy associated with Information technologies, our design provided agents
to have more agility to solve a problem by looking up themselves the solution for difficult
tables in 2 PDF files. These PDF files were referred to as PDF1 and PDF2 on the desktop of
the computer terminals at which they were seated. In the PDF1, only the 5 columns with
solutions were available while PDF2 provided the 5 columns with solutions plus the final
sum. On each PDF file, tables were laid horizontally and each line corresponded to a table. To
find the solution, participants just had to read the 5 last numbers in PDF1 (or 6 in PDF2) at
the end of each line. To implement the looking up action, we set up several tables with the
same number of tables (see Figure I.2). To quickly solve a difficult table, agents had first to
find the table’s number they were summing up in the PDF file and then had to check the row
5 Thereby, agents were able to cheat by reporting a wrong number of times they used PDF files but, we were able to correct their declaration.

Chapter I: Information VS Communication Technologies
- 25 -
of the table (the first 5 numbers of the each) to make sure they are reading the right table
before copying the answers.
I3.3. Communication technologies
Communication technologies facilitate the communication between the principal and agents
(Bloom et al., 2014). Then agents can rely on the principal to solve a problem they faced. In
our design, we used the Chat option of the virtual organization software to mimic the reliance
of the agent to the principal through Communication technologies. Each agent was able to ask
for a solution to the principal by clicking on the Chat option in the action menu on his screen.
Agents had access to a chat room through which they could send to and receive messages
from the principal only. The Chat option enabled agents to ask for help to solve a problem
they were facing or to make sure they correctly solved the problem. To do so, they just had to
specify the number of the table and the type of solution (PDF1 or PDF2) they wanted to the
principal for solving easily and quickly a problem. Each time a participant received a message
but was not currently on the chat screen, a pop-up window warned him. All participants were
free to discuss any and all aspects of the experiment, but they were not allowed to reveal their
name, discuss side payments outside the laboratory, or engage in inappropriate language.
Figure I. 3: example of chat screen (Communication technology)
The principal received two PDF files with solutions of difficult tables only at the beginning of
the experiment. To implement the fact that the principal has the knowledge to solve problems
(Bloom et al., 2014), we gave him only right answers of all difficult tables in PDF files.
Actually, the number of a table was directly followed by the sum of each column (PDF1_p)

Chapter I: Information VS Communication Technologies
- 26 -
plus the final answer (PDF2_p). The principal did not need to check the first row of the table
like agents with Information technologies.
I3.4. Principal’s working activities
The principal just as agents had to sum up numbers as he wanted. In treatments where
Communication technologies were available, the principal was able to use the Chat option to
give answers when requested. The time wasted to communicate with agents is a kind of
helping costs. The principal was also able to monitor the contribution of agents at any time
during the experiment by clicking on the Watch option in the action menu on his screen.
I4. Procedures and treatments
I4.1. Experimental procedures
We ran our experiment in the Laboratory of Experimentation in Social Sciences and
Behavioral Analysis (LESSAC) from Burgundy School of Business (France). We recruited
108 students (70% females) from this Business School. The number of participants varied
from 20-32 per session. Each session lasted almost one hour with 5 periods of 7 minutes. We
conducted those sessions between February and March 2015.
Participants were randomly matched in a team of 4 members and assigned to one of the two
existing roles. Each team consisted of one principal and three agents. Participants kept the
same role and the same partners for the whole duration of the experiment. First, all
participants received sheets with instructions and screen captures of the software. They had 10
minutes to read the instructions with the monitor which was reading aloud according to the
treatments described below. Second, participants entered in a training period6 to make sure
they well understood the instructions and were able to use the VO software tools. Participants
with the role of principal received the PDF files during this stage. A few days before,
participants were asked to play a beauty contest game repeated 10 times. They were divided
in groups of 8 members. They also filled in a Raven test. Their score of these two quizzes is
what we refer to as “Ability” in the rest of the chapter. The participants’ earnings at the end of
6 Participants were informed of their role at this stage.

Chapter I: Information VS Communication Technologies
- 27 -
the experiment were computed as the sum of the earnings in the 5 periods. On average,
participants earned a payoff of €4.7 regardless their role.
I4.2. Treatments
Our experimental design consisted in four (between-subjects) treatments (see Table I.2). In the
baseline treatment, participants were unable to use any type of technologies. In the IT
treatment, participants were able to use the Information technologies by accessing directly the
PDF files on their computer’s desktop. Agents on CT treatment were allowed to use the Chat
option as Communication technologies to ask for solutions. Participants were able to use both
information and Communication technologies in the ICT treatment. In IT treatment and ICT
treatment, participants were able to use Information technology, we will refer to these
treatments as ITs treatments, we will also use CTs treatments to talk about treatments which
allowed Communication technologies (CT and ICT treatments).
Table I. 2: Summary of treatments
Treatments Technologies Number of participants (team)
Baseline No technologies 32 (8)
IT treatment Information technologies only 28 (7)
CT treatment Communication technologies only 20 (5)
ICT treatment Information and Communication
technologies
28 (7)
Regardless the difficulty level of a table, each correct answer paid 50 cents that was added to
the total production of the group and each incorrect answer generated a penalty of 25 cents
that was subtracted to the total production of the group. At the end of a given period, each
agent of the group received 20 % of the total production while the principal received 40% of
this amount. Using information or communication technologies entailed some costs that were
directly subtracted from the individual earnings of the participant at the end of the experiment.
The cost of using technologies depended on the type of the PDF files, access to PDF1 costed
10 cents for solutions used for each table and access to PDF2 costed 20 cents. Participants

Chapter I: Information VS Communication Technologies
- 28 -
were invited to write down on a paper how many times they used or asked for answers from
each type of PDF files at the end of each period7.
Table I. 3: Summary of experimental design
108 participants were matched in organization of 4 members : one
principal and three agents
Treatments No Tech IT CT ICT
Kind of
Technologies × Information Communication
Information & communication
Implementation
×
Agents can search solution on PDF files
Agents can chat with principal
to ask for solutions
Agents can search and chat
First stage Ability test ( few days before)
Second stage Session ( 5 periods of 7 minutes each)
Third stage Payment stage (at the end of the experiment)
END
I5. Results
We start this section by presenting descriptive statistics regarding production and problems
solved by agents in all treatments. The production is summarized as the amount generated by
each table (difficult + easy) correctly solved minus the amount generated by incorrect tables.
In the second part of this section, we will present econometric results regarding technologies
users compared to non-users.
7 The software enabled us to verify agents’ declaration only; we needed to rely on principals’ declaration to complete data regarding their use of PDF files.

Chapter I: Information VS Communication Technologies
- 29 -
I5.1. Descriptive statistics of treatments
The figure below (Figure I.4) displays the average production and number of problems solved
by agents only in each treatment. We observe that agents in ICT treatment were more
productive on average and agents in IT treatment were less productive compared to others
(99.05> 96.67> 93> 75.23, see Table I.8 in appendix I). This result suggests that the
production is higher when both Information and Communication technologies are available.
We also observe that agents’ production in treatments which allow only one kind of
technologies was lower than agents’ production in the baseline. These results are only
significant when we compare IT treatment with baseline and ICT treatment (z = 1.95, p = 0.04
and z = -1.84, p = 0.07 respectively).
Figure I. 4: Average of agents’ production and problems solved for each treatment
We also observe that agents in ICT treatment solved more problems than others and agents in
IT treatment solved fewer compared to others. However, results are only significant when we
compare ICT treatment and IT treatment (z = -1.93, p = 0.05). When we deeply looked data
related to production, we realized that some agents in the baseline treatment did not solve
difficult tables. Indeed, some of them willingly entered wrong answers (when they faced a
difficult table) in order to quickly move on to an easy table. Another reason which can explain
why agents in baseline treatment were more productive is that participants in treatments with
technologies were very slow in adapting to technologies. Indeed, some agents used more
technologies over time. In our experiment 16.7% of participants in ITs treatments and 19.4%
05
10
15
20
Total production Problems solved
Baseline IT treatment
CT treatment ICT treatment

Chapter I: Information VS Communication Technologies
- 30 -
of participants in CTs treatments used at least once Information technologies or
Communication technologies respectively.
I5.2. Econometric results
This section presents our econometric analyses of the effects on IT and CT on agents’
performance. We also present our detailed analyses on the effect of using IT and CT on
principals and teams’ production by taking advantage of experimental data that perfectly
measure the outcome of work.
I5.2.1. Solving problems
Results reported in Table I.3 present linear panel regressions estimated with random effects
which analyze the impacts of IT and CT on agents’ solving problem activity. We create
dummy variables IT users and CT users which take value one if a given agent used IT or CT
to solve a problem during a period and zero otherwise. The models are estimated with random
effects and clustered standard errors for organizations to take account the fact that
observations may not be entirely independent.
In line with descriptive statistics, we find that IT users solved more problems than non-users
(see dummy IT users in columns 1, 2 and 5). We observe that the coefficient is higher on ITs
treatments. Indeed, IT users solved more than one problem on average (1.14) compared to
non-users in ITs treatments (0.45) as well as in all treatments (0.53). These differences
between users and non-users are statistically significant in ITs treatments (z = - 2.83, p =
0.005) and in all treatments (z = - 2.68, p = 0.007). These results are consistent with the
finding of Chen et al. (2013) which showed that people who use a search technology are more
efficient than non-users. We also observe that costs of using IT are positively related to
solving problems; the more agents used IT the more they solved problems. We also find that
CT users solved fewer problems than non-users (see dummy CT users in columns 3, 4 and 5).
The coefficient is higher on CTs treatments and costs generated by CT use have a positive
relationship with the number of problems solved.
These results are in line with our hypothesis 1 related to solving problems and support
predictions of the theoretical model of knowledge hierarchy. Agents are more productive
when using Information technologies (Garicano, 2000; Garicano and Rossi-Hansberg, 2006;
Bloom et al., 2014). We also observe a positive trend in problems solved regardless

Chapter I: Information VS Communication Technologies
- 31 -
regressions; this is consistent with learning effects (Charness and Campbell, 1988). We
observe that the relationship between problems solved and the variable Ability is positive but
only significant on ITs treatments.
Table I. 4: Linear panel regression assessing the impact of IT and CT use by agents for solving problems
Number of problems solved
ITs treatments
All treatments
CTs treatments
All treatments
All treatments
(1) (2) (3) (4) (5)
Using IT 0.53*** 0.29**
0.30**
(0.13) (0.14)
(0.14)
Using CT
-0.50*** -0.40*** -0.41***
(0.12) (0.11) (0.10)
Costs 0.04*** 0.04*** 0.05*** 0.05*** 0.04***
(0.00) (0.01) (0.01) (0.01) (0.00)
Working_time -0.00 0.00 -0.00 0.00 0.00
(0.00) (0.00) (0.00) (0.00) (0.00)
Trend 0.06** 0.07*** 0.07** 0.07*** 0.07***
(0.03) (0.02) (0.03) (0.02) (0.02)
Ability 0.07*** 0.02 0.02 0.02 0.02
(0.02) (0.02) (0.03) (0.02) (0.02)
Male dummy 0.06 0.16 0.30** 0.18* 0.17
(0.12) (0.10) (0.14) (0.11) (0.12)
Constant -0.38 -0.21 0.19 0.02 0.04
(0.28) (0.24) (0.30) (0.28) (0.28)
Observations 210 405 180 405 405
Number of agents 42 81 36 81 81
Number of teams 14 27 12 27 27
R2 overall 0.424 0.219 0.311 0.218 0.219
Model test chi2 234.23*** 135.96*** 197.47*** 173.11*** 177.06***
Notes: Estimation output using robust standard errors clustered at the team level (in parentheses). Coefficients * significant at 10%; ** significant at 5%; *** significant at 1%

Chapter I: Information VS Communication Technologies
- 32 -
We summarize our findings regarding the effect of IT and CT use on agents’ problems
solving as follows:
Result 1: i) IT users solve more problems than non-users. ii) CT use reduces the number of
problems solved by agents.
I5.2.2. Agents’ production
In Table I.4, we report results regarding agents’ production. The first two columns are related
to IT users and the following two columns to Communication technologies use while the last
column encompasses both technologies users.
Table I. 5: Linear panel regression assessing the use of IT and CT on agents’ production.
Agents’ production
ITs
treatments All
treatments CTs
treatments All
treatments All
treatments
(1) (2) (3) (4) (5)
Using IT 101.76*** 89.25*** 88.24***
(9.13) (12.85) (12.10)
Using CT -40.04* -33.18* -26.25*
(21.41) (18.58) (15.14)
Working_time -0.09 0.02 -0.04 -0.02 -0.02
(0.14) (0.08) (0.12) (0.11) (0.09)
Trend 3.09 2.31 4.03 4.31* 2.61
(2.32) (2.08) (3.67) (2.38) (2.09)
Ability 6.07*** 2.59 3.42** 1.94 2.30
(1.60) (1.75) (1.71) (1.65) (1.70)
Male dummy -3.82 7.79 26.91** 12.91 8.72
(9.34) (8.24) (10.98) (9.40) (8.59)
Constant 38.44 45.40* 67.35* 66.34* 61.61**
(42.67) (25.82) (38.92) (35.74) (29.38)
Observations 210 405 180 405 405
Number of agents 42 81 36 81 81
Number of teams 14 27 12 27 27
R2 overall 0.270 0.122 0.095 0.035 0.122
Model test chi2 269.16*** 123.63*** 24.82*** 18.00*** 176.18***
Notes: Estimation output using robust standard errors clustered at the team level (in parentheses). Coefficients * significant at 10%; ** significant at 5%; *** significant at 1%

Chapter I: Information VS Communication Technologies
- 33 -
These results are consistent with our hypotheses 2i and 2ii. We find that IT users were more
productive compared to non-users (see dummy IT users in columns 1, 2 and 5). The
production of IT users was 66.66 % higher compared to non-users in ITs treatments (z = -
2.67, p = 0.01) and 49.72 % higher compared to non-users in all treatments (z = - 2.54, p =
0.01). As expected, CT users were less productive than non-users in CTs treatments and in all
treatments (see dummy IT users in columns 3, 4 and 5). The production of CT users was equal
to 90 cents on average compared to 98.10 cents and 91.15 cents for non-users in CTs
treatments and all treatments respectively. The R2 is very low showing that models related to
CT users do not well explain agents’ production. The trend variable reveals that agents were
significantly more productive over time but the result is only significant when we compare
CT users and non-users in all treatments. The variable Ability is positively related to the
production regardless the kind of technologies used. However, the result is only significant on
ITs and CTs treatments. Results reported in column (5) confirm previous findings; IT users
are more productive and CT users are less productive than technologies non-users.
To compare team production between technologies users and non-users, we create dummy
variables IT team and CT team that take value one if agents used IT or CT respectively in a
team and zero otherwise. Consistent with our hypothesis 2iii, teams with IT users were more
productive than teams with no IT users and teams with CT users produced less compared to
teams without CT users (see dummy variables of Table I.9 in appendix I). The production of
teams with IT users was equal to € 4.63 on average compared to € 3 (z = - 1.94, p = 0.05) and
€ 3.59 (z = - 1.89, p = 0.06) for teams without IT users in ITs treatments and all treatments
respectively. We observe the opposite relation regarding CT users; teams’ production with
CTs users was 15.98% lower compared to the production of teams without CTs users in CTs
treatments. However, teams’ production with CTs users was 5.84% higher when we compare
CT use in all treatments; these results are not statistically significant. We observe a positive
trend in teams’ production.
Result 2: i) IT users are more productive than non-users. ii) Agents using Communication
technologies produce less than non-users. iii) Team production is higher with IT users and
lower with CT users.

Chapter I: Information VS Communication Technologies
- 34 -
I5.2.3. Preference between technologies and principal’s activities
In line with our hypothesis 3i, agents in ICT treatment used less Communication technologies
than agents in CT treatment (see dummy ICT treatment on Table I.10 in appendix I). Indeed,
when both IT and CT were available, agents preferred using Information technologies to solve
problems. Moreover, in the ICT treatment, agents did not request for help to solve problems
after the practice period. We suggest that agents prefer to be autonomous than to be assisted.
Table I. 6: Linear panel regression for the time devoted to work by principals
Production Working_time
CTs
treatments All
treatments CTs
treatments All
treatments (1) (2) (3) (4)
Working_time 0.28* 0.16*
(0.15) (0.09)
Being solicited -34.64 -38.22* -156.24** -148.64***
(33.79) (22.41) (21.47) (23.98)
Trend 31.38** 20.28*** 19.016** 11.18**
(13.41) (6.11) (9.67) (4.85)
Ability 7.66 3.45 2.56 2.56
(5.48) (3.40) (2.05) (2.40)
Male dummy 98.71** 80.47* 5.39 18.17
(40.64) (45.50) (14.25) (12.14)
Constant -111.86** -42.28 270.089*** 285.38***
(49.95) (40.88) (40.21) (31.80)
Observations 60 135 60 135
Number of principals 12 27 12 27
Number of teams 12 27 12 27
R2 overall 0.453 0.220 0.563 0.371
Model test chi2 290.23*** 32.96*** 283.79*** 146.87*** Notes: Estimation output using robust standard errors clustered at the team level (in parentheses). Coefficients * significant at 10%; ** significant at 5%; *** significant at 1%.
Table I.5 presents results for regressions that we performed to test our hypothesis 3ii, we
looked at the principal’s behavior regarding the working activity. The variable Being solicited
refers to principals which were solicited by agents through Communication technologies. The
first two columns are related to principals’ production while the last two columns concern the
time dedicated to work. We can see that principals produced less when they were solicited to

Chapter I: Information VS Communication Technologies
- 35 -
solve problems through Communication technologies (see dummy Being solicited in columns
1, 2). However, the coefficient is higher and significant when we compare principals in all
treatments only. This finding is in line with our hypothesis 3ii. We observe that the time
dedicated to work is positively and significantly related to the production in CTs and all
treatments. The trend variable reveals that principals were significantly more productive over
time.
The time dedicated to work could explain why principals who were solicited to solve
problems were less productive. Indeed, the time spent by those principals to sum up tables
was lower compared to the time spent by those who were not solicited. On average, this time
was 30.08% lower (z = 2.88, p = 0.004 in CTs treatments) and 27.35% lower (z = 3.09, p =
0.002 in all treatments) for principals in teams with CT users compared to principals in teams
with no CT users. As expected, if principals devote a large proportion of time to help agents,
they will have less time to work. This result is consistent with the substitution effect (Di
Maggio and Van Alstyne, 2013). We observe a positive trend in time spent to work.
We summarize our findings regarding the effects on the principal’s activities as follows:
Result 3 Agents use less CT when Information technologies are available. ii) The production
of principals is lower when they are solicited to solve problems compared to those who are
not solicited.
Table I.6 summarizes our main results regarding the investigation on ICT effects at the
workplace.
Table I. 7: Main effects of IT and CT
Problems solved
Requesting help
Agents’ production
Principal’s production
Team production
IT +8 Not significant
+ Not tested +
CT - + - - -
8 Symbols + and – refer to observed effects of technologies on CT and IT users compared to non-users.

Chapter I: Information VS Communication Technologies
- 36 -
I.6. Conclusion
In this first chapter, we aimed to investigate the effects of Information and Communication
Technologies use on workers’ performance. The implementation of ICT at workplace has
reshaped the way employees perform their work. Changes generated by the diffusion of ICT
impacted workers’ productivity but there is a lack of studies which investigate ICT use effects
at the level of workforce. The combination of technologies and required organizational
changes may lead to an increase of workers’ performance. Hence, firms should reap more
benefits of ICT use. Our first contribution was to test the theory of hierarchical organization
of decision making developed by Bloom et al. (2014). Their model distinguishes Information
Technologies (IT) from Communication Technologies (CT). This theory enabled us to take
into account different aspects of technologies since evidence shows that its introduction in the
workplace may have counterproductive effects on workers’ performance.
Our experimental design consisted in four treatments: the baseline treatment with no
technologies, IT and CT treatments with Information or Communication technologies
respectively. Our second contribution to the literature was to design a treatment (the fourth
one) in which IT and CT were available for workers since both information and
communication systems are incorporated in some technology devices. Our findings support
theoretical predictions of the model relied on the “knowledge hierarchy” theory of Garicano
(2000). Information technologies users are more productive and solve more problems than
non-users. CT users are less productive and solve fewer problems than workers who do not
use Communication technologies. We also found that workers prefer to use Information
technologies rather than Communication technologies. Indeed when they had the choice
between both types of technologies, none of them chose Communication technologies in the
fourth treatment. The use of Communication technologies is also detrimental for principals
because they spend more time to help agents.
Our work brings into managerial attention the opposite effects of ICT use on workers’
performance. Indeed, ICT play a key role in the management of organizations and may not
always lead to an increase of workers’ performance. Indeed, Communication technologies
may have negative effects on workers’ autonomy and team leaders’ production. This could be
detrimental on the firm efficiency. Information technologies give more autonomy to workers.
So, managers must ensure that employees have required skills and knowledge to make right
decisions that should positively impact the firm performance. The distinction between

Chapter I: Information VS Communication Technologies
- 37 -
Information technologies and Communication technologies is crucial for the decision making
in the firm. In other words the allocation of decision making in the firm may depend in part on
the kind of technologies used in the firm. For example, the use of Information technologies
should be combined with a decentralized organization in order to derive full potential of
technologies and to avoid counterproductive behaviors. Managers should also consider the
preference of workers for Information technologies and autonomy. That may curtail
organizational costs due to technological changes.
Our experimental design did not allow us to test all aspects of Communication technologies in
the firm. Indeed, the decrease of Communication costs in the firm may also lead to an
increase of information sharing between workers for solving problems. This horizontal
communication may enable workers to use more communication technologies by relying less
on managers which may spend more time to their own work. Another limit of our work is that
our experimental design could have been simpler. One PDF file could have been enough to
implement Information technologies. Further researches could focus on other payment
schemes. Workers’ preference between Information technologies and Communication
technologies may differ in a competitive payment system. Also, studies on Communication
technologies effects on workers’ cooperation may be worthwhile. Since the selfish behavior
may lead workers to maximize their profit, is it costless for the firm to give them more
autonomy?

Chapter I: Information VS Communication Technologies
- 38 -
References
Acemoglu, D., Aghion, P., Lelarge C., Van Reenen, J., and F. Zilibotti (2007) ‘Technology, Information, and the Decentralization of the Firm.’ Quarterly Journal of Economics, 122(4) 1759–99.
Aghion, P., Bloom, N., and J. Van Reenen (2014) ‘Incomplete contracts and the internal organization of firms.’ Journal of Law, Economics, and Organization 30(s1), i37-i63.
Aghion, P. and E. Howitt (1992) ‘A model of growth through creative destruction.’ Econometrica 60(2), 323–351.
Aghion, P., and J. Tirole (1997) ‘Formal and real authority in organizations.’ The Journal of
Political Economy 105(1), 1-29.
Alder, G. S., and M. L. Ambrose (2005) ‘An examination of the effect of computerized performance monitoring feedback on monitoring fairness, performance, and satisfaction.’ Organizational Behavior and Human Decision Processes 97, 161-177.
Bayo-Moriones, A., J. Calleja-Blanco, and F. Lera-López (2012) ‘ICTs and job design. Evidence from Europe.’ Working paper, Universidad Pública de Navarra, Pamplona and Universitat Autónoma de Barcelona, Barcelona.
Black, S. E., and L.M. Lynch (2001) ‘How to compete: The impact of workplace practices
and information technology on productivity’ The Review of Economics and Statistics 83(3), 434-445.
Bertschek I., and U. Kaiser (2004) ‘Productivity effects of organizational change:
Microeconometric evidence.’ Management Science 50(3), 394-404. Bloom, N., L. Garicano, R. Sadun, and J. Van Reenen (2014) ‘The distinct effects of
information technology and communication technology on firm organization.’ Management Science 60(12), 2859-2885.
Bolton, P. and M. Dewatripont (1994) ‘The firm as a communication network.’ The Quarterly
Journal of Economics 109(4), 809-839. Bresnahan, T. F., E. Brynjolfsson, and L. M. Hitt (2002) ‘Information technology, workplace
organization, and the demand for skilled labor: Firm-level evidence.’ The Quarterly
Journal of Economics 117(1), 339–376.
Brynjolfsson, E., and L.M. Hitt (2000) ‘Beyond computation: Information technology, organizational transformation and business performance.’ The Journal of Economic
Perspectives 14(4), 23-48. Charness, G., Cobo-Reyes, R., Jinénez, N., Lacomba, J. A and F. Lagos, (2012) ‘The Hidden
Advantage of Delegation: Pareto-improvements in a Gift-exchange Game.’ American
Economic Review 102(5), 2358-2379. Chen, Y., Jeon, G., and Y. Kim (2014) ‘A day without a search engine: an experimental study
of online and offline searches.’ Experimental Economics 17, 512-536.

Chapter I: Information VS Communication Technologies
- 39 -
Chou, Y., Chuang, H. H., and B. B., Shao (2014) ‘The impacts of information technology on
total factor productivity: A look at externalities and innovations.’ International Journal of
Production Economics 158, 290-299. Colombo, M.G., and M. Delmastro (1999) ‘Some stylized facts on organization and its
evolution.’ Journal of Economic Behavior & Organization 40, 255-274.
Colombo, M.G., and M. Delmastro (2004) ‘The determinants of organizational change and structural inertia: technological and organizational factors.’ Journal of Economics and
Management Strategy 11(4), 595-635. Corgnet, B., Hernán-González, R., and E. Schniter (2015) ‘Why real leisure really matters: Incentive effects on real effort in the laboratory.’ Experimental Economics 18(2), 284-301. Correa, L., (2006) ‘The economic impact of telecommunications diffusion on UK
productivity growth.’ Information Economics and Policy 18(4), 385–404. Di Maggio, M and M.W. Van Alstyne (2013) ‘Information sharing, social norms and
performance.’ Working paper 1893164 available at SSRN. Dohmen, T., and A. Falk (2011) ‘Performance pay and multi-dimensional sorting:
Productivity, preferences and gender.’ The American Economic Review 101(2), 556-590. Eriksson, T., A. Poulsen, and M.-C. Villeval (2009) ‘Feedback and incentives: Experimental
evidence.’ Labour Economics 16(6), 679-688.
Falk, M., ( 2005) ‘ICT-linked firm reorganisation and productivity gains.’ Technovation 25(11), 1229- 1250.
Garicano, L. (2000) ‘Hierarchies and the organization of knowledge in production.’ Journal
of Political Economy 108(5), 874-904. Garicano, L., and E. Rossi-Hansberg (2006) ‘Organization and inequality in a knowledge
economy.’ The Quarterly Journal of Economics 121(4), 1383-1435. Green, F (2006) ‘Demanding Work’. The Paradox of Job Quality in the Affluent Economy.
Princeton, NJ: Princeton University Press, 2006. Jorgenson, D.W., (2001) ‘Information technology and the US economy.’ American Economic
Review 91(1), 1–32.
Marschak, J. and R. Radner (1972) ‘The Economic Theory of Teams.’ Yale University Press, New Haven and London.
Martin, L., and N., Omrani (2015) ‘An assessment of trends in technology use, innovative
work practices and employees' attitudes in Europe.’ Applied Economics 74 (6), 623-638. Milgrom, P., and J. Roberts (1990) ‘The economics of modern manufacturing technology,
strategy and organisation.’ The American Economic Review 311–328.

Chapter I: Information VS Communication Technologies
- 40 -
Niederle, M., and L. Vesterlund (2007) ‘Do women shy away from competition? Do men compete too much?’ The Quarterly Journal of Economics 3(8), 1067-1101.
Romer, P. (1990) ‘Endogenous technological change.’ Journal of Political Economy 98(5),
71–101. Sah, R. K. and J. E. Stiglitz (1986) ‘The architecture of economic systems: Hierarchies and
polyarchies.’ American Economic Review 76(4), 716-727. Sliwka, D. (2001) ‘On the costs and benefits of delegation in organizations.’ Journal of
Institutional and Theoretical Economics 157(4), 568-590. Sun, J. (2016) ‘The effect of information technology on IT-facilitated coordination, IT-
facilitated autonomy, and decision-makings at the individual level.’ Applied Economics 1-18.
Van Zandt, T. (2004) ‘Information overload in a network of targeted communication.’ RAND
Journal of Economics 35(3), 542-560.

Chapter I: Information VS Communication Technologies
- 41 -
Appendix I
Table I. 8: Average agents’ production in cents and (number of problems solved)
Production (problems solved)
Number of agents
Average Standard deviation
Baseline 24 96.67 (0.57) 5.23 (0.06)
IT treatment 21 75.24 (0.4) 5.57 (0.06)
CT treatment 15 93 (0.65) 7.69 (0.09)
ICT treatment 21 99.05 (0.72) 6.82 (0.08)
Table I. 9: Linear panel regression for the impact of IT and CT use on teams’ production
Team production
IT team 127.35***
(49.30)
CT team -93.86***
(28.39)
Working_time 0.18
(0.13)
Ability -4.62
(6.01)
Trend 29.85***
(8.63)
Constant 270.08***
(74.34)
Observations 540
Number of participants 108
Number of teams 27
R2 overall 0.225
Model test chi2 36.80*** Notes: Estimation output using robust standard errors clustered at the team level (in parentheses). Coefficients * significant at 10%; ** significant at 5%; *** significant at 1%.

Chapter I: Information VS Communication Technologies
- 42 -
Table I. 10: Linear panel regression assessing the preference of agents between IT and CT
Receiving problem to
solve
ICT treatment -0.20***
(0.03)
Costs -0.00
(0.00)
Trend 0.02
(0.02)
Ability 0.00
(0.01)
Male dummy 0.06
(0.04)
Constant 0.10*
(0.06)
Observations 180
Number of principals 36
Number of teams 12
R2 overall 0.138
Model test chi2 96.08*** Notes: Estimation output using robust standard errors clustered at the team level (in parentheses). Coefficients * significant at 10%; ** significant at 5%; *** significant at 1%.

Chapter I: Information VS Communication Technologies
- 43 -
Instructions – Baseline You have exactly 10 minutes to go through the instructions. You will have enough time to read the instructions carefully. You are going to participate in an experiment about decision making. You will be paid in cash for your participation at the end of the experiment. Different participants may earn different amounts. What you earn depends on your decisions and the decisions of others. Please note that during the experiment communication is not allowed. If you have questions, please raise your hand and a monitor will come by to answer your question. If any difficulties arise after the experiment has begun, raise your hand, and someone will assist you. This experiment involves a team of 4 members and consists of 5 periods of 7 minutes each. There are two types of team members referred to as subject B and subject C. 3 members will be subjects B and one will be subject C. You will learn the type of subject you are when the experiment starts. Your individual earnings at the end of the experiment are computed as the sum of your earnings in the 5 periods. In each period of this experiment both subjects B and subject C will be able to sum up numbers in a table (work task). Subject C will have access to another activity that consists in monitoring other team members. To switch from one activity to another you just have to click on the corresponding option of the action menu displayed on your screen. The activities are referred to as Task (sum up numbers in a table) and Watch (monitor subjects B contributions – only available to C). Each activity is undertaken separately, in a different screen. Your experiment ID will be displayed on the top left corner of your screen once the experiment starts. It will consist of the letter B followed by a number if you are of type B. If you are the subject C your ID will be C11. The experiment will start by a practice period.
Task – summing up numbers
The task consists in summing up 25 numbers in a table with 5 rows and 5 columns. Each team member is given a different set of tables with the same level of difficulty. Before providing your final answer (the total sum of all numbers in the table) you have to fill in the 5 cells that correspond to the sums of the 5 columns. Filling in these 5 cells does not directly generate earnings but it can help you to compute the final sum. Only after filling in all these cells you will be allowed to provide a final answer (the total sum) in the box located below the table on the left. Notice that you are not allowed to use a calculator or any other electronic, computer-based or internet-based devices to sum up numbers.
If you do, you will be excluded and you will not be paid.
There are 2 types of tables: Itables and Dtables. Itables are tables with integers only and Dtables are tables with decimal numbers. Only the final answer (total sum of the table) is rewarded. Intermediate sums of all columns are required but are not rewarded. Each time you answer the task correctly (your final sum is correct) you generate 50 cents of Total production. This 50 cents is not directly added to your individual earnings. Subject C

Chapter I: Information VS Communication Technologies
- 44 -
always gets 40% of Total production while each subject B gets 20% of the total profit contributed by all members undertaking the task.
n If you sum up the numbers of a table correctly then each subject in the experiment (including yourself) gets 50 cents times the percentage of Total production that he or she is assigned.
- 20 cents (40%×50) if you are subject C - 10 cents (20%×50) if you are subject B
n If you answer the task incorrectly you generate a penalty of 25 cents that is subtracted from Total production. So when you answer incorrectly your individual earnings decrease by: - 10 cents (40%×25) if you are subject C
- 5 cents (20%×25) if you are subject B
n EXAMPLE: In the first period you provided 7 correct answers completing the task
while providing 3 incorrect answers. Also, the other three team members in the experiment provided a total of 24 correct answers in the task while providing 5 incorrect answers. Your earnings (“My Period Earnings”) for that period are equal to:
- Earnings: 40%×(31×50 - 8×25)= 540 cents if you are subject C - Earnings: 20%×(31×50 - 8×25)= 270 cents if you are subject B
The amount of money you generate by undertaking the task is displayed in the second column “My Production” of the history table at the bottom of the screen. The total amount of money generated by all 4 members (subject C + 3 subjects B) on the task is displayed in the sixth column “Total Production” of the history table at the bottom of the screen.
Monitoring: only for subject C
If and only if you are subject C, you can monitor the contribution of the three subjects B at any time during this experiment. You can do so by clicking on the Watch option in the action menu. You will be faced with a monitoring screen with 3 columns, each of them corresponding to one of the subjects B in the experiment. The head of each column indicates the experiment ID of the subject. You can monitor or stop monitoring all B subjects’ contributions at the same time by clicking on the buttons displayed in the top right corner of the screen. To stop monitoring a given subject you have to click on the corresponding column header. You will be informed in real time of the production and contribution to Total production (in % terms) of the selected subject B.

Chapter I: Information VS Communication Technologies
- 45 -
Instructions – IT treatment You have exactly 10 minutes to go through the instructions. You will have enough time to read the instructions carefully. You are going to participate in an experiment about decision making. You will be paid in cash for your participation at the end of the experiment. Different participants may earn different amounts. What you earn depends on your decisions and the decisions of others. Please note that during the experiment communication is not allowed. If you have questions, please raise your hand and a monitor will come by to answer your question. If any difficulties arise after the experiment has begun, raise your hand, and someone will assist you. This experiment involves a team of 4 members and consists of 5 periods of 7 minutes each. There are two types of team members referred to as subject B and subject C. 3 members will be subjects B and one will be subject C. You will learn the type of subject you are when the experiment starts. Your individual earnings at the end of the experiment are computed as the sum of your earnings in the 5 periods. In each period of this experiment both subjects B and subject C will be able to sum up numbers in a table (work task). Subject C will have access to another activity that consists in monitoring other team members. To switch from one activity to another you just have to click on the corresponding option of the action menu displayed on your screen. The activities are referred to as Task (sum up numbers in a table) and Watch (monitor subjects B contributions – only available to C). Each activity is undertaken separately, in a different screen. Your experiment ID will be displayed on the top left corner of your screen once the experiment starts. It will consist of the letter B followed by a number if you are of type B. If you are the subject C your ID will be C11. The experiment will start by a practice period.
Task – summing up numbers
The task consists in summing up 25 numbers in a table with 5 rows and 5 columns. Each team member is given a different set of tables with the same level of difficulty. Before providing your final answer (the total sum of all numbers in the table) you have to fill in the 5 cells that correspond to the sums of the 5 columns. Filling in these 5 cells does not directly generate earnings but it can help you to compute the final sum. Only after filling in all these cells you will be allowed to provide a final answer (the total sum) in the box located below the table on the left. Notice that you are not allowed to use a calculator or any other electronic, computer-based or internet-based devices to sum up numbers but, you will be able to look up some solutions in 2 PDF files if you want to provide quickly the final sum of tables.
If you do, you will be excluded and you will not be paid.
There are 2 types of tables: Itables and Dtables. Itables are tables with integers only and Dtables are tables with decimal numbers. Only the final answer (total sum of the table) is rewarded. Intermediate sums of all columns are required but are not rewarded. Each time you answer the task correctly (your final sum is correct) you generate 50 cents of Total production. This 50 cents is not directly added to your individual earnings. Subject C

Chapter I: Information VS Communication Technologies
- 46 -
always gets 40% of Total production while each subject B gets 20% of the total profit contributed by all members undertaking the task.
n If you sum up the numbers of a table correctly then each subject in the experiment (including yourself) gets 50 cents times the percentage of Total production that he or she is assigned.
- 20 cents (40%×50) if you are subject C - 10 cents (20%×50) if you are subject B
n If you answer the task incorrectly you generate a penalty of 25 cents that is subtracted from Total production. So when you answer incorrectly your individual earnings decrease by: - 10 cents (40%×25) if you are subject C
- 5 cents (20%×25) if you are subject B
n EXAMPLE: In the first period you provided 7 correct answers completing the task
while providing 3 incorrect answers. Also, the other three team members in the experiment provided a total of 24 correct answers in the task while providing 5 incorrect answers. Your earnings (“My Period Earnings”) for that period are equal to:
- Earnings: 40%×(31×50 - 8×25)= 540 cents if you are subject C - Earnings: 20%×(31×50 - 8×25)= 270 cents if you are subject B
The amount of money you generate by undertaking the task is displayed in the second column “My Production” of the history table at the bottom of the screen. The total amount of money generated by all 4 members (subject C + 3 subjects B) on the task is displayed in the sixth column “Total Production” of the history table at the bottom of the screen.
Task – Dtables’ solutions
To solve tables with decimal numbers which are more difficult to sum up mentally, you can look up Dtables’ solutions in one or both PDF files available on your computer’s desktop. Looking up in PDF files will entail some costs that will be directly subtracted from your individual earnings at the end of the experiment. Each Dtable gets a number in the first cell (first row, first column) that you will need to look up the solution quickly. Note that PDF files contain the solutions for Dtables only. There are 2 types of PDF files:
- PDF1 with solutions which are answers of 5 cells that correspond to the sum of the 5 columns. Access to PDF1 costs 10 cents for solutions used for each table. - PDF2 with solutions which are answers of 5 cells that correspond to the sum of the 5 columns plus the final sum. Access to PDF1 costs 20 cents for solutions used for each table.

Chapter I: Information VS Communication Technologies
- 47 -
Task – PDF files
To quickly solve the Dtables, you will be able to look up the solutions in 2 PDF files referred to as PDF1 and PDF2 on the desktop of the computer terminals at which you are seated. The PDF1 only gets the 5 columns solutions while the PDF2 gets the 5 columns solutions plus the final sum. On each PDF file, tables are laid horizontally, each line is a table, the system first goes from left to right then top to bottom, that means the first 5 numbers corresponding to the first row of the table, the 5 following numbers corresponding to the second row consecutively. The sum of the 5 columns and the final sum will be the 5 or 6 last numbers in cells at the end of each according the PDF file you will use. Several Dtables could have the same table’s number, you will need to check the first row of the table to be sure that you are reading the right Dtable before to copy answers. Remember that the first five numbers of a line corresponds to the table’s number plus the 4 numbers of the first row of the table. Subject C will get different PDF files, the table’s number will be directly follow by the sum of tables (PDF1) plus the final answer (PDF2), he won’t need to check row of the table. At the end of the experiment, a questionnaire will be given to you to report how many times you solved a Dtable by looking up or asking for a solution from each PDF file. During the experiment, you will have to use the numbered pieces of paper that you will received for helping you to remember how many times you looked up or asked for a solution and which PDF file was needful for each period. You will have to cut the part of the piece of paper corresponding to number of times you resorted to a PDF file for solving the Dtables at the end of each period.
Monitoring: only for subject C
If and only if you are subject C, you can monitor the contribution of the three subjects B at any time during this experiment. You can do so by clicking on the Watch option in the action menu. You will be faced with a monitoring screen with 3 columns, each of them corresponding to one of the subjects B in the experiment. The head of each column indicates the experiment ID of the subject. You can monitor or stop monitoring all B subjects’ contributions at the same time by clicking on the buttons displayed in the top right corner of the screen. To stop monitoring a given subject you have to click on the corresponding column header. You will be informed in real time of the production and contribution to Total production (in % terms) of the selected subject B.

Chapter I: Information VS Communication Technologies
- 48 -
Instructions – CT treatment You have exactly 10 minutes to go through the instructions. You will have enough time to read the instructions carefully. You are going to participate in an experiment about decision making. You will be paid in cash for your participation at the end of the experiment. Different participants may earn different amounts. What you earn depends on your decisions and the decisions of others. Please note that during the experiment communication is not allowed outside the software. If you have questions, please raise your hand and a monitor will come by to answer your question. If any difficulties arise after the experiment has begun, raise your hand, and someone will assist you This experiment involves a team of 4 members and consists of 5 periods of 7 minutes each. There are two types of team members referred to as subject B and subject C. 3 members will be subjects B and one will be subject C. You will learn the type of subject you are when the experiment starts. Your individual earnings at the end of the experiment are computed as the sum of your earnings in the 5 periods. In each period of this experiment both subjects B and subject C will be able to sum up numbers in a table (work task) or chat with subject C in the experiment. Subject C will have access to another activity that consists in monitoring other team members. To switch from one activity to another you just have to click on the corresponding option of the action menu displayed on your screen. The activities are referred to as Task (sum up numbers in a table), Chat (send/receive messages to/from Subject C in the experiment) and Watch (monitor subjects B contributions – only available to C). Each activity is undertaken separately, in a different screen. Your experiment ID will be displayed on the top left corner of your screen once the experiment starts. It will consist of the letter B followed by a number if you are of type B. If you are the subject C your ID will be C11. The experiment will start by a practice period.
Task – summing up numbers
The task consists in summing up 25 numbers in a table with 5 rows and 5 columns. Each team member is given a different set of tables with the same level of difficulty. Before providing your final answer (the total sum of all numbers in the table) you have to fill in the 5 cells that correspond to the sums of the 5 columns. Filling in these 5 cells does not directly generate earnings but it can help you to compute the final sum. Only after filling in all these cells you will be allowed to provide a final answer (the total sum) in the box located below the table on the left. Notice that you are not allowed to use a calculator or any other electronic, computer-based or internet-based devices to sum up numbers.
If you do, you will be excluded and you will not be paid.
There are 2 types of tables: Itables and Dtables. Itables are tables with integers only and Dtables are tables with decimal numbers. Only the final answer (total sum of the table) is rewarded. Intermediate sums of all columns are required but are not rewarded.

Chapter I: Information VS Communication Technologies
- 49 -
Each time you answer the task correctly (your final sum is correct) you generate 50 cents of Total production. This 50 cents is not directly added to your individual earnings. Subject C always gets 40% of Total production while each subject B gets 20% of the total profit contributed by all members undertaking the task.
n If you sum up the numbers of a table correctly then each subject in the experiment (including yourself) gets 50 cents times the percentage of Total production that he or she is assigned.
- 20 cents (40%×50) if you are subject C - 10 cents (20%×50) if you are subject B
n If you answer the task incorrectly you generate a penalty of 25 cents that is subtracted from Total production. So when you answer incorrectly your individual earnings decrease by: - 10 cents (40%×25) if you are subject C
- 5 cents (20%×25) if you are subject B
n EXAMPLE: In the first period you provided 7 correct answers completing the task
while providing 3 incorrect answers. Also, the other three team members in the experiment provided a total of 24 correct answers in the task while providing 5 incorrect answers. Your earnings (“My Period Earnings”) for that period are equal to:
- Earnings: 40%×(31×50 - 8×25)= 540 cents if you are subject C - Earnings: 20%×(31×50 - 8×25)= 270 cents if you are subject B
The amount of money you generate by undertaking the task is displayed in the second column “My Production” of the history table at the bottom of the screen. The total amount of money generated by all 4 members (subject C + 3 subjects B) on the task is displayed in the sixth column “Total Production” of the history table at the bottom of the screen.
Task – Dtables’ solutions
To solve tables with decimal numbers which are more difficult to sum up mentally, you can ask for help to subject C who will receive 2 PDF files with Dtables’ solutions. Asking for help to subject C will entail some costs that will be directly subtracted from your individual earnings at the end of the experiment. Each Dtable gets a number in the first cell (first row, first column) that you will need to request for solutions quickly. Note that PDF files contain the solutions for Dtables only. There are 2 types of PDF files:
- PDF1 with solutions which are answers of 5 cells that correspond to the sum of the 5 columns. Access to PDF1 costs 10 cents for solutions used for each table. - PDF2 with solutions which are answers of 5 cells that correspond to the sum of the 5 columns plus the final sum. Access to PDF1 costs 20 cents for solutions used for each table.

Chapter I: Information VS Communication Technologies
- 50 -
Chat
If you are members B, you can ask for help subject C to provide the final sum. To do so, you have access to a chat room through which you can communicate with him in the experiment. You can access chat by clicking on the Chat option in the action menu. You can send and receive messages to and from subject C. To send a message, you have to select first the members you want to send the message to and then click on the button send
message. Each time you will have to rely on subject C to ask for help, you have to specify the table’s number and the PDF file (PDF1 or PDF2) that you request the solution for to facilitate the communication and to get easily and quickly the solution that you will need. Each time you receive a message but you are not currently on the chat screen a pop-up window will warn you about the message. You are free to discuss any and all aspects of the experiment, with the following exceptions: you may not reveal your name, discuss side payments outside the laboratory, or engage in inappropriate language (including such shorthand as ‘WTF’). If you do, you will be excluded and you will not be paid. At the end of the experiment, a questionnaire will be given to you to report how many times you solved a Dtable by looking up (subject C) or asking for (subject B) a solution from each PDF file. During the experiment, you will have to use the numbered pieces of paper that you will received for helping you to remember how many times you looked up or asked for a solution and which PDF file was needful for each period. You will have to cut the part of the piece of paper corresponding to number of times you resorted to a PDF file for solving the Dtables at the end of each period.
Monitoring: only for subject C
If and only if you are subject C, you can monitor the contribution of the three subjects B at any time during this experiment. You can do so by clicking on the Watch option in the action menu. You will be faced with a monitoring screen with 3 columns, each of them corresponding to one of the subjects B in the experiment. The head of each column indicates the experiment ID of the subject. You can monitor or stop monitoring all B subjects’ contributions at the same time by clicking on the buttons displayed in the top right corner of the screen. To stop monitoring a given subject you have to click on the corresponding column header. You will be informed in real time of the production and contribution to Total production (in % terms) of the selected subject B.

Chapter I: Information VS Communication Technologies
- 51 -
Instructions – ICT treatment You have exactly 10 minutes to go through the instructions. You will have enough time to read the instructions carefully. You are going to participate in an experiment about decision making. You will be paid in cash for your participation at the end of the experiment. Different participants may earn different amounts. What you earn depends on your decisions and the decisions of others. Please note that during the experiment communication is not allowed outside the software. If you have questions, please raise your hand and a monitor will come by to answer your question. If any difficulties arise after the experiment has begun, raise your hand, and someone will assist you This experiment involves a team of 4 members and consists of 5 periods of 7 minutes each. There are two types of team members referred to as subject B and subject C. 3 members will be subjects B and one will be subject C. You will learn the type of subject you are when the experiment starts. Your individual earnings at the end of the experiment are computed as the sum of your earnings in the 5 periods. In each period of this experiment both subjects B and subject C will be able to sum up numbers in a table (work task) or chat with subject C in the experiment. Subject C will have access to another activity that consists in monitoring other team members. To switch from one activity to another you just have to click on the corresponding option of the action menu displayed on your screen. The activities are referred to as Task (sum up numbers in a table), Chat (send/receive messages to/from Subject C in the experiment) and Watch (monitor subjects B contributions – only available to C). Each activity is undertaken separately, in a different screen. Your experiment ID will be displayed on the top left corner of your screen once the
experiment starts. It will consist of the letter B followed by a number if you are of type B. If
you are the subject C your ID will be C11. The experiment will start by a practice period.
Task – summing up numbers
The task consists in summing up 25 numbers in a table with 5 rows and 5 columns. Each team member is given a different set of tables with the same level of difficulty. Before providing your final answer (the total sum of all numbers in the table) you have to fill in the 5 cells that correspond to the sums of the 5 columns. Filling in these 5 cells does not directly generate earnings but it can help you to compute the final sum. Only after filling in all these cells you will be allowed to provide a final answer (the total sum) in the box located below the table on the left. Notice that you are not allowed to use a calculator or any other electronic, computer-based or internet-based devices to sum up numbers but, you will be able to look up some solutions in 2 PDF files if you want to provide quickly the final sum of tables.
If you do, you will be excluded and you will not be paid.
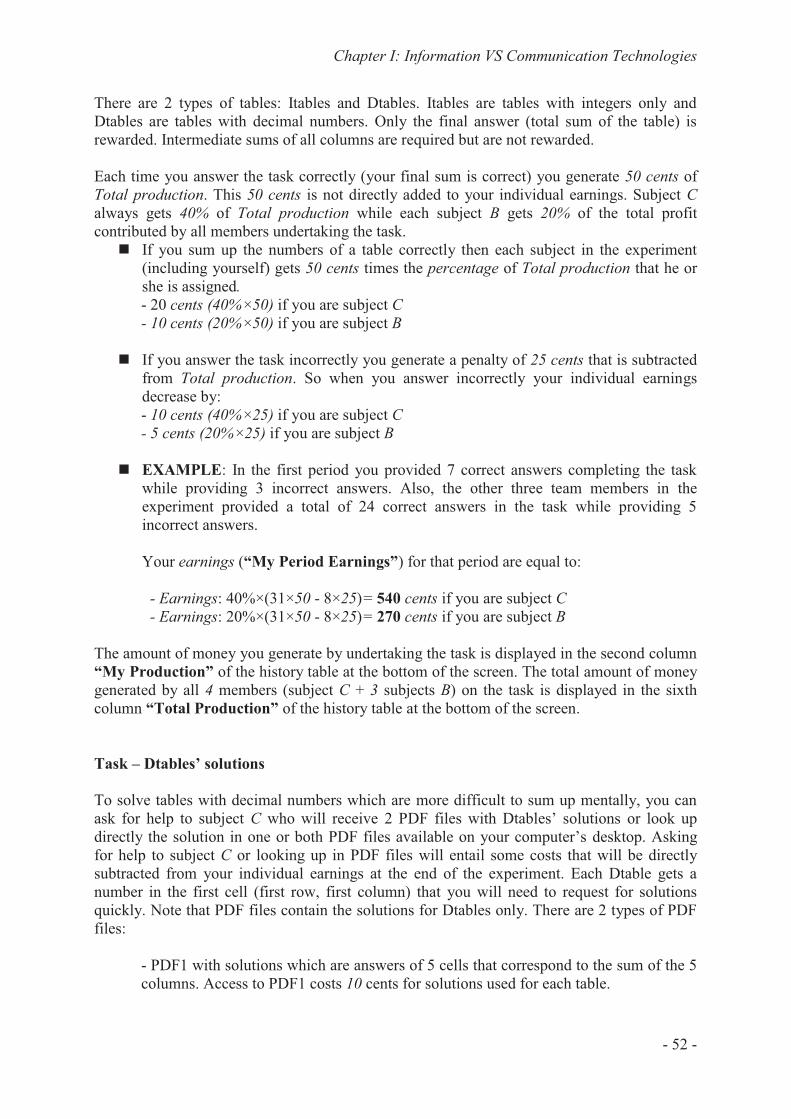
Chapter I: Information VS Communication Technologies
- 52 -
There are 2 types of tables: Itables and Dtables. Itables are tables with integers only and Dtables are tables with decimal numbers. Only the final answer (total sum of the table) is rewarded. Intermediate sums of all columns are required but are not rewarded. Each time you answer the task correctly (your final sum is correct) you generate 50 cents of Total production. This 50 cents is not directly added to your individual earnings. Subject C always gets 40% of Total production while each subject B gets 20% of the total profit contributed by all members undertaking the task.
n If you sum up the numbers of a table correctly then each subject in the experiment (including yourself) gets 50 cents times the percentage of Total production that he or she is assigned.
- 20 cents (40%×50) if you are subject C - 10 cents (20%×50) if you are subject B
n If you answer the task incorrectly you generate a penalty of 25 cents that is subtracted from Total production. So when you answer incorrectly your individual earnings decrease by: - 10 cents (40%×25) if you are subject C
- 5 cents (20%×25) if you are subject B
n EXAMPLE: In the first period you provided 7 correct answers completing the task
while providing 3 incorrect answers. Also, the other three team members in the experiment provided a total of 24 correct answers in the task while providing 5 incorrect answers. Your earnings (“My Period Earnings”) for that period are equal to:
- Earnings: 40%×(31×50 - 8×25)= 540 cents if you are subject C - Earnings: 20%×(31×50 - 8×25)= 270 cents if you are subject B
The amount of money you generate by undertaking the task is displayed in the second column “My Production” of the history table at the bottom of the screen. The total amount of money generated by all 4 members (subject C + 3 subjects B) on the task is displayed in the sixth column “Total Production” of the history table at the bottom of the screen.
Task – Dtables’ solutions
To solve tables with decimal numbers which are more difficult to sum up mentally, you can ask for help to subject C who will receive 2 PDF files with Dtables’ solutions or look up directly the solution in one or both PDF files available on your computer’s desktop. Asking for help to subject C or looking up in PDF files will entail some costs that will be directly subtracted from your individual earnings at the end of the experiment. Each Dtable gets a number in the first cell (first row, first column) that you will need to request for solutions quickly. Note that PDF files contain the solutions for Dtables only. There are 2 types of PDF files:
- PDF1 with solutions which are answers of 5 cells that correspond to the sum of the 5 columns. Access to PDF1 costs 10 cents for solutions used for each table.

Chapter I: Information VS Communication Technologies
- 53 -
- PDF2 with solutions which are answers of 5 cells that correspond to the sum of the 5 columns plus the final sum. Access to PDF1 costs 20 cents for solutions used for each table.
Task – PDF files
To quickly solve the Dtables, you can ask for help to subject C or you can look up the solutions in 2 PDF files referred to as PDF1 and PDF2 on the desktop of the computer terminals at which you are seated. The PDF1 only gets the 5 columns solutions while the PDF2 gets the 5 columns solutions plus the final sum. On each PDF file, tables are laid horizontally, each line is a table, the system first goes from left to right then top to bottom, that means the first 5 numbers corresponding to the first row of the table, the 5 following numbers corresponding to the second row consecutively. The sum of the 5 columns and the final sum will be the 5 or 6 last numbers in cells at the end of each the line according the PDF file you will use. Several Dtables could have the same table’s number, you will need to check the first row of the table to be sure that you are reading the right Dtable before to copy answers. Remember that the first five numbers of a line corresponds to the table’s number plus the 4 numbers of the first row of the table. Subject C will get different PDF files, the table’s number will be directly follow by the sum of tables (PDF1) plus the final answer (PDF2), he won’t need to check row of the table.
Chat
If you are members B, you can ask for help subject C to provide the final sum. To do so, you have access to a chat room through which you can communicate with him in the experiment. You can access chat by clicking on the Chat option in the action menu. You can send and receive messages to and from subject C. To send a message, you have to select first the members you want to send the message to and then click on the button send
message. Each time you will have to rely on subject C to ask for help, you have to specify the table’s number and the PDF file (PDF1 or PDF2) that you request the solution for to facilitate the communication and to get easily and quickly the solution that you will need. Each time you receive a message but you are not currently on the chat screen a pop-up window will warn you about the message. You are free to discuss any and all aspects of the experiment, with the following exceptions: you may not reveal your name, discuss side payments outside the laboratory, or engage in inappropriate language (including such shorthand as ‘WTF’). If you do, you will be excluded and you will not be paid. At the end of the experiment, a questionnaire will be given to you to report how many times you solved a Dtable by looking up or asking for (subject B) a solution from each PDF file. During the experiment, you will have to use the numbered pieces of paper that you will received for helping you to remember how many times you looked up or asked for a solution and which PDF file was needful for each period. You will have to cut the part of the piece of paper corresponding to number of times you resorted to a PDF file for solving the Dtables at the end of each period.

Chapter I: Information VS Communication Technologies
- 54 -
Monitoring: only for subject C
If and only if you are subject C, you can monitor the contribution of the three subjects B at any time during this experiment. You can do so by clicking on the Watch option in the action menu. You will be faced with a monitoring screen with 3 columns, each of them corresponding to one of the subjects B in the experiment. The head of each column indicates the experiment ID of the subject. You can monitor or stop monitoring all B subjects’ contributions at the same time by clicking on the buttons displayed in the top right corner of the screen. To stop monitoring a given subject you have to click on the corresponding column header. You will be informed in real time of the production and contribution to Total production (in % terms) of the selected subject B.

Chapter I: Information VS Communication Technologies
- 55 -
PDF 1-principal
Remember that access to this file costs 10 cents for solutions used for each table. At the end of the experiment, a questionnaire will be given to you to report how many times you solved a Dtable by looking up a solution from this PDF file.
Table’s number
Sum of the 5 columns
C 1 C 2 C 3 C 4 C 5
10 20.75 5.8 12.5 9.7 14.2
11 14.45 6.65 8.6 13.1 10.3
12 18.25 13.1 12.25 6.9 9.2
13 24 13.1 8.35 9.45 13.1
14 20 15.05 9.45 4.95 4.95
15 22.1 15.3 11.4 11.15 6.65
16 23.95 8.35 7.5 6.9 10.3
17 26.9 8.35 8.6 7.75 6.65
18 25.95 6.65 12.25 10.55 5.8
19 26.95 13.1 7.75 10.05 6.65
20 29.9 10.05 12.25 11.4 10.55
21 34.8 6.9 6.65 8.85 8.35
22 28.25 10.55 8.85 13.35 9.7
23 34.85 8.6 9.2 6.9 12.25
24 34.75 9.45 9.2 11.15 8.6
25 33.8 9.7 6.9 10.05 10.3
26 35.9 9.2 15.3 10.3 10.3
27 36.9 9.7 8.6 7.5 8.6
28 34 10.3 6.65 12.85 4.95
29 39.75 10.05 9.45 9.45 9.2
30 36 13.95 6.65 10.55 7.75
31 39.8 14.2 10.55 10.3 8.6
32 38 7.5 13.1 11.4 10.3
33 43.75 5.8 14.2 12.25 7.75
34 39.15 9.45 13.1 9.2 8.6
35 45.75 6.65 9.45 12 13.1
36 44.8 12.25 15.05 13.35 8.6
37 45.2 10.3 9.45 7.75 11.15
38 45.1 4.95 9.7 12.25 5.8
39 48.65 10.55 7.75 13.35 12
40 49.9 8.6 10.55 7.5 9.45
41 50.65 13.35 15.05 11.4 10.3
42 50.8 10.55 7.5 10.3 8.6
43 48.15 9.2 8.6 10.55 11.4
44 53.05 6.65 11.15 4.1 10.9
45 54.9 12.25 10.3 9.2 11.15
46 56.75 16.15 9.45 11.15 10.3
47 54.1 7.75 7.5 10.55 10.3
48 56.8 13.95 13.35 9.45 11.4
49 55.25 13.95 10.55 6.65 12.25

Chapter I: Information VS Communication Technologies
- 56 -
PDF 2-principal
Remember that access to this file costs 20 cents for solutions used for each table. At the end of the experiment, a questionnaire will be given to you to report how many times you solved a Dtable by looking up a solution from this PDF file.
Table’s number
Sum of the 5 columns Final sum C 1 C 2 C 3 C 4 C 5
10 20.75 5.8 12.5 9.7 14.2 62.95
11 14.45 6.65 8.6 13.1 10.3 53.1
12 18.25 13.1 12.25 6.9 9.2 59.7
13 24 13.1 8.35 9.45 13.1 68
14 20 15.05 9.45 4.95 4.95 54.4
15 22.1 15.3 11.4 11.15 6.65 66.6
16 23.95 8.35 7.5 6.9 10.3 57
17 26.9 8.35 8.6 7.75 6.65 58.25
18 25.95 6.65 12.25 10.55 5.8 61.2
19 26.95 13.1 7.75 10.05 6.65 64.5
20 29.9 10.05 12.25 11.4 10.55 74.15
21 34.8 6.9 6.65 8.85 8.35 65.55
22 28.25 10.55 8.85 13.35 9.7 70.7
23 34.85 8.6 9.2 6.9 12.25 71.8
24 34.75 9.45 9.2 11.15 8.6 73.15
25 33.8 9.7 6.9 10.05 10.3 70.75
26 35.9 9.2 15.3 10.3 10.3 81
27 36.9 9.7 8.6 7.5 8.6 71.3
28 34 10.3 6.65 12.85 4.95 68.75
29 39.75 10.05 9.45 9.45 9.2 77.9
30 36 13.95 6.65 10.55 7.75 74.9
31 39.8 14.2 10.55 10.3 8.6 83.45
32 38 7.5 13.1 11.4 10.3 80.3
33 43.75 5.8 14.2 12.25 7.75 83.75
34 39.15 9.45 13.1 9.2 8.6 79.5
35 45.75 6.65 9.45 12 13.1 86.95
36 44.8 12.25 15.05 13.35 8.6 94.05
37 45.2 10.3 9.45 7.75 11.15 83.85
38 45.1 4.95 9.7 12.25 5.8 77.8
39 48.65 10.55 7.75 13.35 12 92.3
40 49.9 8.6 10.55 7.5 9.45 86
41 50.65 13.35 15.05 11.4 10.3 100.75
42 50.8 10.55 7.5 10.3 8.6 87.75
43 48.15 9.2 8.6 10.55 11.4 87.9
44 53.05 6.65 11.15 4.1 10.9 85.85
45 54.9 12.25 10.3 9.2 11.15 97.8
46 56.75 16.15 9.45 11.15 10.3 103.8

Chapter I: Information VS Communication Technologies
- 57 -
47 54.1 7.75 7.5 10.55 10.3 90.2
48 56.8 13.95 13.35 9.45 11.4 104.95
49 55.25 13.95 10.55 6.65 12.25 98.65

Chapter I: Information VS Communication Technologies
- 58 -
PDF 2-agent
Tables are laid horizontally, each line is a table, the system first goes from left to right then top to bottom, that means the first 5 numbers corresponding to the first row of the table, the 5 following numbers corresponding to the second row consecutively. The sum of the 5 columns and the final sum will be the 6 last numbers in cells at the end of the line. Advice: Several Dtables could have the same table’s number, you will need to check the first row of the table to be sure that you are reading the right Dtable before to copy answers. The first five numbers of a line correspond to the table’s number plus the 4 numbers of the first row of the table. Remember that access to this file costs 20 cents for solutions used for each table. At the end of the experiment, a questionnaire will be given to you to report how many times you solved a Dtable by looking up a solution from this PDF file.
Dtables Sum of the 5 columns Final
sum C 1 C 2 C 3 C 4 C 5
44,1.5,0.65,0.65,2.35,3.45,0.65,2.35,0.65,2.35,0.65,1.5,2.35,1.5,1.5,1.5,2.35,2.35,0.65,2.35,3.45,0.65,3.45,0.65,2.35 53.05 6.65 11.15 3.1 10.9 85.85
10,1.5,3.45,0.65,3.45,3.45,0.65,1.5,3.45,3.45,2.35,1.5,3.45,1.5,2.35,3.45,2.35,3.45,3.45,3.45,1.5,0.65,0.65,0.65,2.35 20.75 6.65 12.5 8.7 15.05 64.65
11,1.5,0.65,2.35,3.45,0.65,2.35,3.45,3.45,2.35,1.5,1.5,1.5,1.5,2.35,0.65,0.65,1.5,3.45,0.65,0.65,1.5,1.5,2.35,1.5 14.45 7.5 8.6 12.1 10.3 53.95
49,3.45,1.5,0.65,3.45,1.5,2.35,3.45,1.5,2.35,3.45,3.45,1.5,2.35,0.65,0.65,2.35,3.45,0.65,2.35,0.65,2.35,0.65,1.5,3.45 55.25 13.95 10.55 5.65 12.25 98.65
12,1.5,1.5,0.65,2.35,3.45,3.45,1.5,0.65,1.5,0.65,1.5,3.45,1.5,1.5,1.5,2.35,2.35,0.65,2.35,0.65,3.45,3.45,3.45,0.65 18.25 12.25 12.25 5.9 8.35 58
10,0.65,1.5,0.65,3.45,3.45,0.65,1.5,3.45,3.45,2.35,1.5,3.45,1.5,2.35,3.45,2.35,3.45,3.45,3.45,1.5,0.65,0.65,0.65,1.5 20.75 5.8 10.55 8.7 14.2 61
11,0.65,1.5,2.35,3.45,0.65,2.35,3.45,3.45,2.35,1.5,1.5,1.5,1.5,2.35,0.65,0.65,1.5,3.45,0.65,0.65,1.5,1.5,2.35,1.5 14.45 6.65 9.45 12.1 10.3 53.95
12,2.35,0.65,0.65,2.35,3.45,3.45,1.5,0.65,1.5,0.65,1.5,3.45,1.5,1.5,1.5,2.35,2.35,0.65,2.35,0.65,3.45,3.45,3.45,1.5 18.25 13.1 11.4 5.9 9.2 58.85
43,1.5,0.65,3.45,3.45,1.5,2.35,3.45,0.65,3.45,1.5,1.5,1.5,1.5,1.5,0.65,1.5,1.5,3.45,1.5,1.5,2.35,1.5,1.5,1.5 48.15 9.2 8.6 9.55 11.4 87.9
13,3.45,1.5,3.45,3.45,3.45,3.45,1.5,1.5,2.35,0.65,1.5,1.5,2.35,3.45,3.45,2.35,0.65,1.5,1.5,3.45,2.35,2.35,0.65,2.35 24 13.1 7.5 8.45 13.1 67.15
14,3.45,3.45,2.35,0.65,2.35,3.45,2.35,0.65,2.35,0.65,3.45,0.65,0.65,0.65,1.5,2.35,3.45,0.65,0.65,1.5,2.35,2.35,0.65,0.65 20 15.05 12.25 3.95 4.95 57.2
10,0.65,3.45,0.65,3.45,3.45,0.65,1.5,3.45,3.45,2.35,1.5,3.45,1.5,2.35,3.45,2.35,3.45,3.45,3.45,1.5,0.65,0.65,0.65,1.5 20.75 5.8 12.5 8.7 14.2 62.95
15,3.45,0.65,2.35,2.35,0.65,3.45,3.45,2.35,0.65,2.35,1.5,1.5,3.45,2.35,0.65,3.45,3.45,0.65,0.65,3.45,3.45,2.35,2.35,2.35 22.1 15.3 11.4 10.15 8.35 68.3
16,0.65,1.5,0.65,1.5,1.5,1.5,2.35,3.45,3.45,1.5,1.5,2.35,0.65,2.35,1.5,2.35,0.65,1.5,2.35,3.45,2.35,0.65,0.65,1.5 23.95 8.35 7.5 5.9 11.15 57.85
13,3.45,2.35,3.45,3.45,3.45,3.45,1.5,1.5,2.35,0.65,1.5,1.5,2.35,3.45,3.45,2.35,0.65,1.5,1.5,3.45,2.35,2.35,0.65,2.35 24 13.1 8.35 8.45 13.1 67.3
17,1.5,0.65,3.45,1.5,1.5,0.65,2.35,1.5,0.65,1.5,2.35,1.5,1.5,0.65,3.45,1.5,3.45,0.65,1.5,3.45,1.5,0.65,0.65,1.5 26.9 7.5 8.6 6.75 5.8 75
18,3.45,3.45,3.45,0.65,0.65,0.65,2.35,0.65,1.5,3.45,0.65,0.65,3.45,1.5,2.35,2.35,2.35,2.35,1.5,1.5,1.5,3.45,0.65,1.5 25.95 8.6 12.25 9.55 6.65 64.7
47,0.65,2.35,3.45,3.45,0.65,1.5,1.5,0.65,2.35,3.45,3.45,2.35,0.65,0.65,2.35,0.65,0.65,2.35,2.35,0.65,1.5,0.65,3.45,1.5 54.1 7.75 7.5 9.55 10.3 72.4

Chapter I: Information VS Communication Technologies
- 59 -
22,1.5,0.65,3.45,3.45,0.65,1.5,3.45,3.45,0.65,3.45,0.65,3.45,1.5,3.45,1.5,1.5,0.65,3.45,1.5,0.65,3.45,0.65,1.5,3.45 28.25 8.6 8.85 12.35 12.5 61
23,1.5,1.5,0.65,2.35,1.5,3.45,2.35,3.45,3.45,3.45,0.65,1.5,1.5,3.45,3.45,0.65,1.5,0.65,2.35,3.45,2.35,2.35,0.65,3.45 34.85 8.6 9.2 5.9 15.05 62.95
12,2.35,1.5,0.65,2.35,3.45,3.45,1.5,0.65,1.5,0.65,1.5,3.45,1.5,1.5,1.5,2.35,2.35,0.65,2.35,0.65,3.45,3.45,3.45,1.5 18.25 13.1 12.25 5.9 9.2 53.95
24,1.5,2.35,2.35,1.5,3.45,1.5,0.65,3.45,2.35,1.5,3.45,2.35,1.5,3.45,3.45,2.35,2.35,1.5,0.65,2.35,0.65,1.5,2.35,1.5 34.75 9.45 9.2 10.15 9.45 58.85
25,2.35,0.65,1.5,1.5,2.35,0.65,0.65,1.5,2.35,1.5,3.45,1.5,2.35,0.65,1.5,1.5,0.65,2.35,3.45,3.45,3.45,3.45,2.35,1.5 33.8 11.4 6.9 9.05 9.45 67.15
26,1.5,3.45,0.65,2.35,3.45,0.65,1.5,2.35,3.45,2.35,1.5,3.45,1.5,1.5,3.45,2.35,3.45,2.35,2.35,0.65,2.35,3.45,3.45,2.35 35.9 8.35 15.3 9.3 12 57.2
25,0.65,0.65,1.5,1.5,2.35,0.65,0.65,1.5,2.35,1.5,3.45,1.5,2.35,0.65,1.5,1.5,0.65,2.35,3.45,3.45,3.45,3.45,2.35,2.35 33.8 9.7 6.9 9.05 10.3 64.9
27,0.65,2.35,1.5,1.5,3.45,1.5,1.5,2.35,1.5,0.65,0.65,0.65,0.65,1.5,2.35,3.45,3.45,2.35,3.45,3.45,0.65,0.65,0.65,0.65 36.9 6.9 8.6 6.5 8.6 52.25
28,3.45,2.35,2.35,1.5,1.5,2.35,0.65,2.35,0.65,2.35,3.45,1.5,3.45,0.65,0.65,1.5,0.65,2.35,1.5,1.5,2.35,1.5,2.35,2.35 34 13.1 6.65 11.85 6.65 73.5
14,3.45,0.65,2.35,0.65,2.35,3.45,2.35,0.65,2.35,0.65,3.45,0.65,0.65,0.65,1.5,2.35,3.45,0.65,0.65,1.5,2.35,2.35,0.65,0.65 20 15.05 9.45 3.95 4.95 73.15
29,2.35,1.5,0.65,2.35,1.5,2.35,1.5,1.5,2.35,3.45,1.5,1.5,2.35,1.5,2.35,1.5,3.45,1.5,0.65,3.45,2.35,1.5,3.45,3.45 39.75 10.05 9.45 8.45 10.3 68.3
30,0.65,0.65,2.35,3.45,2.35,2.35,1.5,3.45,2.35,0.65,3.45,0.65,0.65,0.65,1.5,2.35,2.35,0.65,0.65,1.5,2.35,1.5,3.45,0.65 36 11.15 6.65 9.55 7.75 57.85
31,3.45,0.65,2.35,1.5,2.35,3.45,3.45,2.35,0.65,2.35,1.5,0.65,3.45,2.35,0.65,3.45,3.45,0.65,0.65,3.45,3.45,2.35,1.5,0.65 39.8 15.3 10.55 9.3 5.8 68
36,3.45,3.45,1.5,1.5,0.65,3.45,3.45,3.45,2.35,3.45,2.35,2.35,3.45,0.65,2.35,2.35,3.45,3.45,3.45,2.35,0.65,2.35,1.5,0.65 44.8 12.25 15.05 12.35 8.6 54.4
38,0.65,0.65,3.45,2.35,3.45,1.5,3.45,2.35,0.65,0.65,0.65,3.45,1.5,0.65,2.35,1.5,0.65,3.45,1.5,0.65,0.65,1.5,1.5,0.65 45.1 4.95 9.7 11.25 5.8 56.55
15,3.45,1.5,2.35,2.35,0.65,3.45,3.45,2.35,0.65,2.35,1.5,1.5,3.45,2.35,0.65,3.45,3.45,0.65,0.65,3.45,3.45,2.35,2.35,0.65 22.1 15.3 12.25 10.15 6.65 64
16,0.65,1.5,0.65,3.45,1.5,1.5,2.35,3.45,3.45,1.5,1.5,2.35,0.65,2.35,1.5,2.35,0.65,1.5,2.35,3.45,2.35,0.65,0.65,0.65 23.95 8.35 7.5 5.9 12.25 71.85
11,0.65,0.65,2.35,3.45,0.65,2.35,3.45,3.45,2.35,1.5,1.5,1.5,1.5,2.35,0.65,0.65,1.5,3.45,0.65,0.65,1.5,1.5,2.35,1.5 14.45 6.65 8.6 12.1 10.3 82.7
17,2.35,2.35,3.45,1.5,1.5,0.65,2.35,1.5,0.65,1.5,2.35,1.5,1.5,0.65,3.45,1.5,3.45,0.65,1.5,3.45,1.5,0.65,0.65,2.35 26.9 8.35 10.3 6.75 6.65 74.1
18,1.5,0.65,3.45,0.65,0.65,0.65,2.35,0.65,1.5,3.45,0.65,0.65,3.45,1.5,2.35,2.35,2.35,2.35,1.5,1.5,1.5,3.45,0.65,0.65 25.95 6.65 9.45 9.55 5.8 70.45
19,2.35,2.35,0.65,1.5,2.35,1.5,0.65,2.35,0.65,0.65,2.35,1.5,2.35,1.5,1.5,3.45,1.5,2.35,2.35,3.45,3.45,0.65,2.35,0.65 26.95 13.1 6.65 9.05 6.65 79
20,2.35,1.5,0.65,1.5,0.65,2.35,3.45,3.45,3.45,3.45,1.5,2.35,2.35,1.5,2.35,2.35,3.45,3.45,3.45,3.45,1.5,2.35,1.5,0.65 29.9 10.05 13.1 10.4 10.55 76.6
15,3.45,0.65,2.35,2.35,0.65,3.45,3.45,2.35,0.65,2.35,1.5,1.5,3.45,2.35,0.65,3.45,3.45,0.65,0.65,3.45,3.45,2.35,2.35,0.65 22.1 15.3 11.4 10.15 6.65 71.55
21,0.65,1.5,3.45,1.5,3.45,1.5,2.35,0.65,2.35,3.45,3.45,0.65,3.45,1.5,3.45,0.65,1.5,0.65,1.5,3.45,0.65,0.65,0.65,1.5 34.8 6.9 6.65 7.85 8.35 74.6
42,2.35,1.5,2.35,0.65,1.5,2.35,1.5,0.65,1.5,3.45,3.45,1.5,2.35,3.45,1.5,3.45,1.5,3.45,0.65,2.35,0.65,1.5,1.5,3.45 50.8 12.25 7.5 9.3 9.7 53.1
43,1.5,0.65,3.45,3.45,1.5,2.35,3.45,0.65,3.45,1.5,1.5,1.5,1.5,1.5,0.65,1.5,1.5,3.45,1.5,1.5,2.35,1.5,1.5,3.45 48.15 9.2 8.6 9.55 13.35 59.7
32,0.65,1.5,3.45,1.5,1.5,1.5,2.35,2.35,3.45,1.5,1.5,2.35,3.45,2.35,0.65,2.35,3.45,1.5,2.35,2.35,1.5,3.45,0.65,0.65 38 7.5 13.1 10.4 10.3 74
44,1.5,0.65,0.65,2.35,3.45,0.65,2.35,0.65,2.35,0.65,1.5,2.35,1.5,1.5,1.5,2.35,2.35,0.65,2.35,3.45,0.65,3.45,0.65,0.65 53.05 6.65 11.15 3.1 9.2 71.6
45,2.35,3.45,2.35,2.35,2.35,3.45,2.35,1.5,2.35,0.65,2.35,1.5,2.35,2.35,3.45,2.35,0.65,2.35,0.65,3.45,3.45,2.35,0.65,0.65 54.9 13.95 10.3 8.2 8.35 81.85
33,1.5,3.45,2.35,1.5,3.45,0.65,1.5,3.45,0.65,1.5,2.35,3.45,0.65,3.45,2.35,0.65,2.35,2.35,0.65,3.45,0.65,3.45,3.45,1.5 43.75 5.8 14.2 11.25 7.75 68.5
46,1.5,1.5,2.35,0.65,3.45,3.45,2.35,3.45,3.45,1.5,3.45,1.5,1.5,1.5,2.35,3.45,0.65,2.35,2.35,3.45,3.45,3.45,1.5,1.5 56.75 15.3 9.45 10.15 9.45 73.25
47,0.65,2.35,3.45,3.45,0.65,1.5,1.5,0.65,2.35,3.45,3.45,2.35,0.65,0.65,2.35,0.65,0.65,2.35,2.35,0.65,1.5,0.65,3.45,3.45 54.1 7.75 7.5 9.55 12.25 79
37,1.5,2.35,0.65,1.5,0.65,1.5,3.45,0.65,3.45,3.45,2.35,0.65,3.45,1.5,0.65,1.5,1.5,1.5,2.35,3.45,3.45,1.5,1.5,2.35 45.2 10.3 9.45 6.75 11.15 72.1
48,1.5,3.45,1.5,3.45,2.35,2.35,3.45,0.65,1.5,3.45,2.35,3.45,1.5,0.65,2.35,3.45,1.5,3.45,3.45,0.65,3.45,1.5,2.35,3.45 56.8 13.1 13.35 8.45 12.5 81.75

Chapter I: Information VS Communication Technologies
- 60 -
49,2.35,1.5,0.65,3.45,1.5,2.35,3.45,1.5,2.35,3.45,3.45,1.5,2.35,0.65,0.65,2.35,3.45,0.65,2.35,0.65,2.35,0.65,1.5,3.45 55.25 12.85 10.55 5.65 12.25 83.45
42,0.65,1.5,2.35,0.65,1.5,2.35,1.5,0.65,1.5,3.45,3.45,1.5,2.35,3.45,1.5,3.45,1.5,3.45,0.65,2.35,0.65,1.5,1.5,2.35 50.8 10.55 7.5 9.3 8.6 94.05
23,1.5,1.5,0.65,2.35,1.5,3.45,2.35,3.45,3.45,3.45,0.65,1.5,1.5,3.45,3.45,0.65,1.5,0.65,2.35,3.45,2.35,2.35,0.65,0.65 34.85 8.6 9.2 5.9 12.25 83.85
21,0.65,3.45,3.45,1.5,3.45,1.5,2.35,0.65,2.35,3.45,3.45,0.65,3.45,1.5,3.45,0.65,1.5,0.65,1.5,3.45,0.65,0.65,0.65,1.5 34.8 6.9 8.6 7.85 8.35 81.15
22,3.45,0.65,3.45,2.35,0.65,1.5,3.45,3.45,0.65,3.45,0.65,3.45,1.5,3.45,1.5,1.5,0.65,3.45,1.5,0.65,3.45,0.65,1.5,0.65 28.25 10.55 8.85 12.35 8.6 82.9
23,1.5,0.65,0.65,2.35,1.5,3.45,2.35,3.45,3.45,3.45,0.65,1.5,1.5,3.45,3.45,0.65,1.5,0.65,2.35,3.45,2.35,2.35,0.65,0.65 34.85 8.6 8.35 5.9 12.25 81.2
39,0.65,0.65,3.45,1.5,1.5,2.35,0.65,2.35,2.35,2.35,3.45,3.45,0.65,2.35,2.35,3.45,0.65,3.45,2.35,3.45,0.65,2.35,3.45,3.45 48.65 10.55 7.75 12.35 12 85.85
24,1.5,3.45,2.35,1.5,3.45,1.5,0.65,3.45,2.35,1.5,3.45,2.35,1.5,3.45,3.45,2.35,2.35,1.5,0.65,2.35,0.65,1.5,2.35,0.65 34.75 9.45 10.3 10.15 8.6 95.75
25,0.65,3.45,1.5,1.5,2.35,0.65,0.65,1.5,2.35,1.5,3.45,1.5,2.35,0.65,1.5,1.5,0.65,2.35,3.45,3.45,3.45,3.45,2.35,2.35 33.8 9.7 9.7 9.05 10.3 57
26,2.35,1.5,0.65,2.35,3.45,0.65,1.5,2.35,3.45,2.35,1.5,3.45,1.5,1.5,3.45,2.35,3.45,2.35,2.35,0.65,2.35,3.45,3.45,0.65 35.9 9.2 13.35 9.3 10.3 60.55
16,0.65,1.5,0.65,1.5,1.5,1.5,2.35,3.45,3.45,1.5,1.5,2.35,0.65,2.35,1.5,2.35,0.65,1.5,2.35,3.45,2.35,0.65,0.65,0.65 23.95 8.35 7.5 5.9 10.3 67.15
27,3.45,0.65,1.5,1.5,3.45,1.5,1.5,2.35,1.5,0.65,0.65,0.65,0.65,1.5,2.35,3.45,3.45,2.35,3.45,3.45,0.65,0.65,0.65,0.65 36.9 9.7 6.9 6.5 8.6 56.1
28,0.65,3.45,2.35,1.5,1.5,2.35,0.65,2.35,0.65,2.35,3.45,1.5,3.45,0.65,0.65,1.5,0.65,2.35,1.5,1.5,2.35,1.5,2.35,0.65 34 10.3 7.75 11.85 4.95 69.4
45,0.65,3.45,2.35,2.35,2.35,3.45,2.35,1.5,2.35,0.65,2.35,1.5,2.35,2.35,3.45,2.35,0.65,2.35,0.65,3.45,3.45,2.35,0.65,3.45 54.9 12.25 10.3 8.2 11.15 58.7
29,2.35,1.5,0.65,3.45,1.5,2.35,1.5,1.5,2.35,3.45,1.5,1.5,2.35,1.5,2.35,1.5,3.45,1.5,0.65,3.45,2.35,1.5,3.45,2.35 39.75 10.05 9.45 8.45 10.3 57.4
30,3.45,3.45,2.35,3.45,2.35,2.35,1.5,3.45,2.35,0.65,3.45,0.65,0.65,0.65,1.5,2.35,2.35,0.65,0.65,1.5,2.35,1.5,3.45,0.65 36 13.95 9.45 9.55 7.75 77.8
20,2.35,0.65,0.65,1.5,0.65,2.35,3.45,3.45,3.45,3.45,1.5,2.35,2.35,1.5,2.35,2.35,3.45,3.45,3.45,3.45,1.5,2.35,1.5,0.65 29.9 10.05 12.25 10.4 10.55 92.3
28,0.65,2.35,2.35,1.5,1.5,2.35,0.65,2.35,0.65,2.35,3.45,1.5,3.45,0.65,0.65,1.5,0.65,2.35,1.5,1.5,2.35,1.5,2.35,0.65 34 10.3 6.65 11.85 4.95 62.05
31,2.35,1.5,2.35,1.5,2.35,3.45,3.45,2.35,0.65,2.35,1.5,0.65,3.45,2.35,0.65,3.45,3.45,0.65,0.65,3.45,3.45,2.35,1.5,3.45 39.8 14.2 11.4 9.3 8.6 66.2
30,3.45,0.65,2.35,3.45,2.35,2.35,1.5,3.45,2.35,0.65,3.45,0.65,0.65,0.65,1.5,2.35,2.35,0.65,0.65,1.5,2.35,1.5,3.45,0.65 36 13.95 6.65 9.55 7.75 76.95
31,2.35,0.65,2.35,1.5,2.35,3.45,3.45,2.35,0.65,2.35,1.5,0.65,3.45,2.35,0.65,3.45,3.45,0.65,0.65,3.45,3.45,2.35,1.5,3.45 39.8 14.2 10.55 9.3 8.6 67.45
32,0.65,1.5,3.45,3.45,1.5,1.5,2.35,2.35,3.45,1.5,1.5,2.35,3.45,2.35,0.65,2.35,3.45,1.5,2.35,2.35,1.5,3.45,0.65,0.65 38 7.5 13.1 10.4 12.25 58.95
33,1.5,2.35,2.35,1.5,3.45,0.65,1.5,3.45,0.65,1.5,2.35,3.45,0.65,3.45,2.35,0.65,2.35,2.35,0.65,3.45,0.65,3.45,3.45,1.5 43.75 5.8 13.1 11.25 7.75 59.95
22,3.45,0.65,3.45,3.45,0.65,1.5,3.45,3.45,0.65,3.45,0.65,3.45,1.5,3.45,1.5,1.5,0.65,3.45,1.5,0.65,3.45,0.65,1.5,0.65 28.25 10.55 8.85 12.35 9.7 58.4
34,1.5,2.35,1.5,3.45,0.65,3.45,2.35,2.35,0.65,2.35,2.35,3.45,2.35,1.5,1.5,1.5,1.5,2.35,3.45,0.65,0.65,3.45,0.65,0.65 39.15 9.45 13.1 8.2 9.7 63.4
35,1.5,1.5,2.35,1.5,2.35,0.65,0.65,2.35,2.35,3.45,1.5,3.45,1.5,3.45,1.5,0.65,2.35,2.35,2.35,3.45,2.35,0.65,3.45,3.45 45.75 6.65 8.6 11 13.1 75
36,3.45,2.35,1.5,1.5,0.65,3.45,3.45,3.45,2.35,3.45,2.35,2.35,3.45,0.65,2.35,2.35,3.45,3.45,3.45,2.35,0.65,2.35,1.5,0.65 44.8 12.25 13.95 12.35 8.6 63.6
19,2.35,3.45,0.65,1.5,2.35,1.5,0.65,2.35,0.65,0.65,2.35,1.5,2.35,1.5,1.5,3.45,1.5,2.35,2.35,3.45,3.45,0.65,2.35,0.65 26.95 13.1 7.75 9.05 6.65 66.6
37,1.5,2.35,0.65,3.45,0.65,1.5,3.45,0.65,3.45,3.45,2.35,0.65,3.45,1.5,0.65,1.5,1.5,1.5,2.35,3.45,3.45,1.5,1.5,2.35 45.2 10.3 9.45 6.75 13.1 65.55
38,0.65,0.65,3.45,3.45,3.45,1.5,3.45,2.35,0.65,0.65,0.65,3.45,1.5,0.65,2.35,1.5,0.65,3.45,1.5,0.65,0.65,1.5,1.5,0.65 45.1 4.95 9.7 11.25 6.9 71.55
39,0.65,3.45,3.45,1.5,1.5,2.35,0.65,2.35,2.35,2.35,3.45,3.45,0.65,2.35,2.35,3.45,0.65,3.45,2.35,3.45,0.65,2.35,3.45,3.45 48.65 10.55 10.55 12.35 12 73.5
48,2.35,3.45,1.5,3.45,2.35,2.35,3.45,0.65,1.5,3.45,2.35,3.45,1.5,0.65,2.35,3.45,1.5,3.45,3.45,0.65,3.45,1.5,2.35,2.35 56.8 13.95 13.35 8.45 11.4 72.3
32,3.45,1.5,3.45,1.5,1.5,1.5,2.35,2.35,3.45,1.5,1.5,2.35,3.45,2.35,0.65,2.35,3.45,1.5,2.35,2.35,1.5,3.45,0.65,1.5 38 10.3 13.1 10.4 11.15 90.55
33,0.65,3.45,2.35,1.5,3.45,0.65,1.5,3.45,0.65,1.5,2.35,3.45,0.65,3.45,2.35,0.65,2.35,2.35,0.65,3.45,0.65,3.45,3.45,1.5 43.75 4.95 14.2 11.25 7.75 89.85

Chapter I: Information VS Communication Technologies
- 61 -
34,2.35,2.35,1.5,2.35,0.65,3.45,2.35,2.35,0.65,2.35,2.35,3.45,2.35,1.5,1.5,1.5,1.5,2.35,3.45,0.65,0.65,3.45,0.65,2.35 39.15 10.3 13.1 8.2 10.3 84.15
35,1.5,2.35,2.35,1.5,2.35,0.65,0.65,2.35,2.35,3.45,1.5,3.45,1.5,3.45,1.5,0.65,2.35,2.35,2.35,3.45,2.35,0.65,3.45,1.5 45.75 6.65 9.45 11 11.15 96.7
26,2.35,3.45,0.65,2.35,3.45,0.65,1.5,2.35,3.45,2.35,1.5,3.45,1.5,1.5,3.45,2.35,3.45,2.35,2.35,0.65,2.35,3.45,3.45,0.65 35.9 9.2 15.3 9.3 10.3 80.3
36,3.45,3.45,1.5,1.5,0.65,3.45,3.45,3.45,2.35,3.45,2.35,2.35,3.45,0.65,2.35,2.35,3.45,3.45,3.45,2.35,0.65,2.35,1.5,3.45 44.8 12.25 15.05 12.35 11.4 83.75
37,3.45,2.35,0.65,1.5,0.65,1.5,3.45,0.65,3.45,3.45,2.35,0.65,3.45,1.5,0.65,1.5,1.5,1.5,2.35,3.45,3.45,1.5,1.5,3.45 45.2 12.25 9.45 6.75 12.25 102.1
29,2.35,1.5,0.65,2.35,1.5,2.35,1.5,1.5,2.35,3.45,1.5,1.5,2.35,1.5,2.35,1.5,3.45,1.5,0.65,3.45,2.35,1.5,3.45,2.35 39.75 10.05 9.45 8.45 9.2 92.15
38,1.5,0.65,3.45,2.35,3.45,1.5,3.45,2.35,0.65,0.65,0.65,3.45,1.5,0.65,2.35,1.5,0.65,3.45,1.5,0.65,0.65,1.5,1.5,0.65 45.1 5.8 9.7 11.25 5.8 105.2
39,0.65,0.65,3.45,1.5,1.5,2.35,0.65,2.35,2.35,2.35,3.45,3.45,0.65,2.35,2.35,3.45,0.65,3.45,2.35,3.45,0.65,2.35,3.45,2.35 48.65 10.55 7.75 12.35 10.9 97.55
40,1.5,1.5,1.5,1.5,3.45,0.65,3.45,2.35,1.5,1.5,2.35,0.65,1.5,2.35,3.45,0.65,1.5,0.65,3.45,1.5,3.45,3.45,1.5,0.65 49.9 8.6 10.55 6.5 9.45 87.75
41,3.45,2.35,3.45,1.5,2.35,3.45,2.35,3.45,1.5,1.5,3.45,3.45,1.5,3.45,3.45,0.65,3.45,2.35,2.35,2.35,2.35,3.45,0.65,1.5 50.65 13.35 15.05 10.4 10.3 97.8
40,1.5,1.5,1.5,1.5,3.45,0.65,3.45,2.35,1.5,1.5,2.35,0.65,1.5,2.35,3.45,0.65,1.5,0.65,3.45,1.5,3.45,3.45,1.5,1.5 49.9 8.6 10.55 6.5 10.3 71.85
41,1.5,2.35,3.45,1.5,2.35,3.45,2.35,3.45,1.5,1.5,3.45,3.45,1.5,3.45,3.45,0.65,3.45,2.35,2.35,2.35,2.35,3.45,0.65,1.5 50.65 11.4 15.05 10.4 10.3 82.7
40,1.5,2.35,1.5,1.5,3.45,0.65,3.45,2.35,1.5,1.5,2.35,0.65,1.5,2.35,3.45,0.65,1.5,0.65,3.45,1.5,3.45,3.45,1.5,0.65 49.9 8.6 11.4 6.5 9.45 74.1
34,1.5,2.35,1.5,2.35,0.65,3.45,2.35,2.35,0.65,2.35,2.35,3.45,2.35,1.5,1.5,1.5,1.5,2.35,3.45,0.65,0.65,3.45,0.65,0.65 39.15 9.45 13.1 8.2 8.6 69.6
41,3.45,3.45,3.45,1.5,2.35,3.45,2.35,3.45,1.5,1.5,3.45,3.45,1.5,3.45,3.45,0.65,3.45,2.35,2.35,2.35,2.35,3.45,0.65,1.5 50.65 13.35 16.15 10.4 10.3 76.2
42,0.65,3.45,2.35,0.65,1.5,2.35,1.5,0.65,1.5,3.45,3.45,1.5,2.35,3.45,1.5,3.45,1.5,3.45,0.65,2.35,0.65,1.5,1.5,2.35 50.8 10.55 9.45 9.3 8.6 76
43,1.5,1.5,3.45,3.45,1.5,2.35,3.45,0.65,3.45,1.5,1.5,1.5,1.5,1.5,0.65,1.5,1.5,3.45,1.5,1.5,2.35,1.5,1.5,1.5 48.15 9.2 9.45 9.55 11.4 80.65
35,1.5,2.35,2.35,1.5,2.35,0.65,0.65,2.35,2.35,3.45,1.5,3.45,1.5,3.45,1.5,0.65,2.35,2.35,2.35,3.45,2.35,0.65,3.45,3.45 45.75 6.65 9.45 11 13.1 82
44,1.5,1.5,0.65,2.35,3.45,0.65,2.35,0.65,2.35,0.65,1.5,2.35,1.5,1.5,1.5,2.35,2.35,0.65,2.35,3.45,0.65,3.45,0.65,2.35 53.05 6.65 12 3.1 10.9 70.7
45,0.65,2.35,2.35,2.35,2.35,3.45,2.35,1.5,2.35,0.65,2.35,1.5,2.35,2.35,3.45,2.35,0.65,2.35,0.65,3.45,3.45,2.35,0.65,3.45 54.9 12.25 9.2 8.2 11.15 71.8
46,2.35,3.45,2.35,0.65,3.45,3.45,2.35,3.45,3.45,1.5,3.45,1.5,1.5,1.5,2.35,3.45,0.65,2.35,2.35,3.45,3.45,3.45,1.5,2.35 56.75 16.15 11.4 10.15 10.3 67.5
46,2.35,1.5,2.35,0.65,3.45,3.45,2.35,3.45,3.45,1.5,3.45,1.5,1.5,1.5,2.35,3.45,0.65,2.35,2.35,3.45,3.45,3.45,1.5,2.35 56.75 16.15 9.45 10.15 10.3 69.6
47,0.65,3.45,3.45,3.45,0.65,1.5,1.5,0.65,2.35,3.45,3.45,2.35,0.65,0.65,2.35,0.65,0.65,2.35,2.35,0.65,1.5,0.65,3.45,1.5 54.1 7.75 8.6 9.55 10.3 70.95
48,2.35,2.35,1.5,3.45,2.35,2.35,3.45,0.65,1.5,3.45,2.35,3.45,1.5,0.65,2.35,3.45,1.5,3.45,3.45,0.65,3.45,1.5,2.35,2.35 56.8 13.95 12.25 8.45 11.4 74.25
49,3.45,3.45,0.65,3.45,1.5,2.35,3.45,1.5,2.35,3.45,3.45,1.5,2.35,0.65,0.65,2.35,3.45,0.65,2.35,0.65,2.35,0.65,1.5,3.45 55.25 13.95 12.5 5.65 12.25 73.55
17,2.35,0.65,3.45,1.5,1.5,0.65,2.35,1.5,0.65,1.5,2.35,1.5,1.5,0.65,3.45,1.5,3.45,0.65,1.5,3.45,1.5,0.65,0.65,2.35 26.9 8.35 8.6 6.75 6.65 79.05
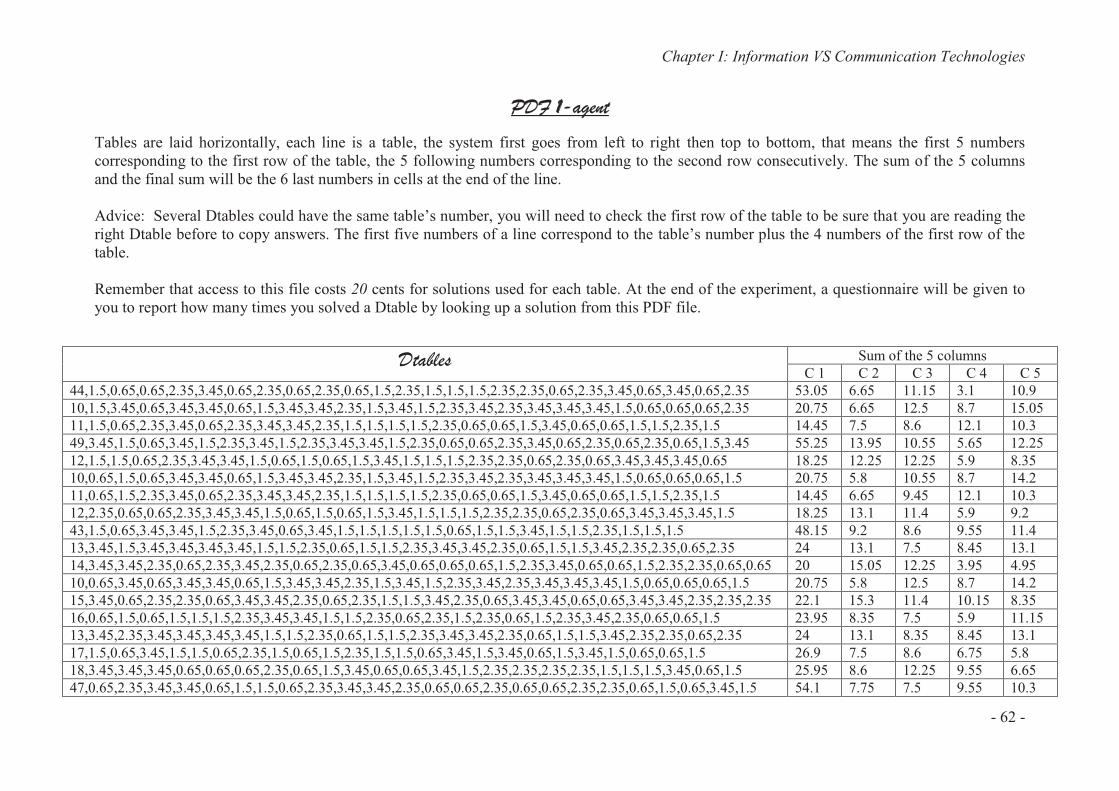
Chapter I: Information VS Communication Technologies
- 62 -
PDF 1-agent
Tables are laid horizontally, each line is a table, the system first goes from left to right then top to bottom, that means the first 5 numbers corresponding to the first row of the table, the 5 following numbers corresponding to the second row consecutively. The sum of the 5 columns and the final sum will be the 6 last numbers in cells at the end of the line. Advice: Several Dtables could have the same table’s number, you will need to check the first row of the table to be sure that you are reading the right Dtable before to copy answers. The first five numbers of a line correspond to the table’s number plus the 4 numbers of the first row of the table. Remember that access to this file costs 20 cents for solutions used for each table. At the end of the experiment, a questionnaire will be given to you to report how many times you solved a Dtable by looking up a solution from this PDF file.
Dtables Sum of the 5 columns
C 1 C 2 C 3 C 4 C 5
44,1.5,0.65,0.65,2.35,3.45,0.65,2.35,0.65,2.35,0.65,1.5,2.35,1.5,1.5,1.5,2.35,2.35,0.65,2.35,3.45,0.65,3.45,0.65,2.35 53.05 6.65 11.15 3.1 10.9
10,1.5,3.45,0.65,3.45,3.45,0.65,1.5,3.45,3.45,2.35,1.5,3.45,1.5,2.35,3.45,2.35,3.45,3.45,3.45,1.5,0.65,0.65,0.65,2.35 20.75 6.65 12.5 8.7 15.05
11,1.5,0.65,2.35,3.45,0.65,2.35,3.45,3.45,2.35,1.5,1.5,1.5,1.5,2.35,0.65,0.65,1.5,3.45,0.65,0.65,1.5,1.5,2.35,1.5 14.45 7.5 8.6 12.1 10.3
49,3.45,1.5,0.65,3.45,1.5,2.35,3.45,1.5,2.35,3.45,3.45,1.5,2.35,0.65,0.65,2.35,3.45,0.65,2.35,0.65,2.35,0.65,1.5,3.45 55.25 13.95 10.55 5.65 12.25
12,1.5,1.5,0.65,2.35,3.45,3.45,1.5,0.65,1.5,0.65,1.5,3.45,1.5,1.5,1.5,2.35,2.35,0.65,2.35,0.65,3.45,3.45,3.45,0.65 18.25 12.25 12.25 5.9 8.35
10,0.65,1.5,0.65,3.45,3.45,0.65,1.5,3.45,3.45,2.35,1.5,3.45,1.5,2.35,3.45,2.35,3.45,3.45,3.45,1.5,0.65,0.65,0.65,1.5 20.75 5.8 10.55 8.7 14.2
11,0.65,1.5,2.35,3.45,0.65,2.35,3.45,3.45,2.35,1.5,1.5,1.5,1.5,2.35,0.65,0.65,1.5,3.45,0.65,0.65,1.5,1.5,2.35,1.5 14.45 6.65 9.45 12.1 10.3
12,2.35,0.65,0.65,2.35,3.45,3.45,1.5,0.65,1.5,0.65,1.5,3.45,1.5,1.5,1.5,2.35,2.35,0.65,2.35,0.65,3.45,3.45,3.45,1.5 18.25 13.1 11.4 5.9 9.2
43,1.5,0.65,3.45,3.45,1.5,2.35,3.45,0.65,3.45,1.5,1.5,1.5,1.5,1.5,0.65,1.5,1.5,3.45,1.5,1.5,2.35,1.5,1.5,1.5 48.15 9.2 8.6 9.55 11.4
13,3.45,1.5,3.45,3.45,3.45,3.45,1.5,1.5,2.35,0.65,1.5,1.5,2.35,3.45,3.45,2.35,0.65,1.5,1.5,3.45,2.35,2.35,0.65,2.35 24 13.1 7.5 8.45 13.1
14,3.45,3.45,2.35,0.65,2.35,3.45,2.35,0.65,2.35,0.65,3.45,0.65,0.65,0.65,1.5,2.35,3.45,0.65,0.65,1.5,2.35,2.35,0.65,0.65 20 15.05 12.25 3.95 4.95
10,0.65,3.45,0.65,3.45,3.45,0.65,1.5,3.45,3.45,2.35,1.5,3.45,1.5,2.35,3.45,2.35,3.45,3.45,3.45,1.5,0.65,0.65,0.65,1.5 20.75 5.8 12.5 8.7 14.2
15,3.45,0.65,2.35,2.35,0.65,3.45,3.45,2.35,0.65,2.35,1.5,1.5,3.45,2.35,0.65,3.45,3.45,0.65,0.65,3.45,3.45,2.35,2.35,2.35 22.1 15.3 11.4 10.15 8.35
16,0.65,1.5,0.65,1.5,1.5,1.5,2.35,3.45,3.45,1.5,1.5,2.35,0.65,2.35,1.5,2.35,0.65,1.5,2.35,3.45,2.35,0.65,0.65,1.5 23.95 8.35 7.5 5.9 11.15
13,3.45,2.35,3.45,3.45,3.45,3.45,1.5,1.5,2.35,0.65,1.5,1.5,2.35,3.45,3.45,2.35,0.65,1.5,1.5,3.45,2.35,2.35,0.65,2.35 24 13.1 8.35 8.45 13.1
17,1.5,0.65,3.45,1.5,1.5,0.65,2.35,1.5,0.65,1.5,2.35,1.5,1.5,0.65,3.45,1.5,3.45,0.65,1.5,3.45,1.5,0.65,0.65,1.5 26.9 7.5 8.6 6.75 5.8
18,3.45,3.45,3.45,0.65,0.65,0.65,2.35,0.65,1.5,3.45,0.65,0.65,3.45,1.5,2.35,2.35,2.35,2.35,1.5,1.5,1.5,3.45,0.65,1.5 25.95 8.6 12.25 9.55 6.65
47,0.65,2.35,3.45,3.45,0.65,1.5,1.5,0.65,2.35,3.45,3.45,2.35,0.65,0.65,2.35,0.65,0.65,2.35,2.35,0.65,1.5,0.65,3.45,1.5 54.1 7.75 7.5 9.55 10.3

Chapter I: Information VS Communication Technologies
- 63 -
22,1.5,0.65,3.45,3.45,0.65,1.5,3.45,3.45,0.65,3.45,0.65,3.45,1.5,3.45,1.5,1.5,0.65,3.45,1.5,0.65,3.45,0.65,1.5,3.45 28.25 8.6 8.85 12.35 12.5
23,1.5,1.5,0.65,2.35,1.5,3.45,2.35,3.45,3.45,3.45,0.65,1.5,1.5,3.45,3.45,0.65,1.5,0.65,2.35,3.45,2.35,2.35,0.65,3.45 34.85 8.6 9.2 5.9 15.05
12,2.35,1.5,0.65,2.35,3.45,3.45,1.5,0.65,1.5,0.65,1.5,3.45,1.5,1.5,1.5,2.35,2.35,0.65,2.35,0.65,3.45,3.45,3.45,1.5 18.25 13.1 12.25 5.9 9.2
24,1.5,2.35,2.35,1.5,3.45,1.5,0.65,3.45,2.35,1.5,3.45,2.35,1.5,3.45,3.45,2.35,2.35,1.5,0.65,2.35,0.65,1.5,2.35,1.5 34.75 9.45 9.2 10.15 9.45
25,2.35,0.65,1.5,1.5,2.35,0.65,0.65,1.5,2.35,1.5,3.45,1.5,2.35,0.65,1.5,1.5,0.65,2.35,3.45,3.45,3.45,3.45,2.35,1.5 33.8 11.4 6.9 9.05 9.45
26,1.5,3.45,0.65,2.35,3.45,0.65,1.5,2.35,3.45,2.35,1.5,3.45,1.5,1.5,3.45,2.35,3.45,2.35,2.35,0.65,2.35,3.45,3.45,2.35 35.9 8.35 15.3 9.3 12
25,0.65,0.65,1.5,1.5,2.35,0.65,0.65,1.5,2.35,1.5,3.45,1.5,2.35,0.65,1.5,1.5,0.65,2.35,3.45,3.45,3.45,3.45,2.35,2.35 33.8 9.7 6.9 9.05 10.3
27,0.65,2.35,1.5,1.5,3.45,1.5,1.5,2.35,1.5,0.65,0.65,0.65,0.65,1.5,2.35,3.45,3.45,2.35,3.45,3.45,0.65,0.65,0.65,0.65 36.9 6.9 8.6 6.5 8.6
28,3.45,2.35,2.35,1.5,1.5,2.35,0.65,2.35,0.65,2.35,3.45,1.5,3.45,0.65,0.65,1.5,0.65,2.35,1.5,1.5,2.35,1.5,2.35,2.35 34 13.1 6.65 11.85 6.65
14,3.45,0.65,2.35,0.65,2.35,3.45,2.35,0.65,2.35,0.65,3.45,0.65,0.65,0.65,1.5,2.35,3.45,0.65,0.65,1.5,2.35,2.35,0.65,0.65 20 15.05 9.45 3.95 4.95
29,2.35,1.5,0.65,2.35,1.5,2.35,1.5,1.5,2.35,3.45,1.5,1.5,2.35,1.5,2.35,1.5,3.45,1.5,0.65,3.45,2.35,1.5,3.45,3.45 39.75 10.05 9.45 8.45 10.3
30,0.65,0.65,2.35,3.45,2.35,2.35,1.5,3.45,2.35,0.65,3.45,0.65,0.65,0.65,1.5,2.35,2.35,0.65,0.65,1.5,2.35,1.5,3.45,0.65 36 11.15 6.65 9.55 7.75
31,3.45,0.65,2.35,1.5,2.35,3.45,3.45,2.35,0.65,2.35,1.5,0.65,3.45,2.35,0.65,3.45,3.45,0.65,0.65,3.45,3.45,2.35,1.5,0.65 39.8 15.3 10.55 9.3 5.8
36,3.45,3.45,1.5,1.5,0.65,3.45,3.45,3.45,2.35,3.45,2.35,2.35,3.45,0.65,2.35,2.35,3.45,3.45,3.45,2.35,0.65,2.35,1.5,0.65 44.8 12.25 15.05 12.35 8.6
38,0.65,0.65,3.45,2.35,3.45,1.5,3.45,2.35,0.65,0.65,0.65,3.45,1.5,0.65,2.35,1.5,0.65,3.45,1.5,0.65,0.65,1.5,1.5,0.65 45.1 4.95 9.7 11.25 5.8
15,3.45,1.5,2.35,2.35,0.65,3.45,3.45,2.35,0.65,2.35,1.5,1.5,3.45,2.35,0.65,3.45,3.45,0.65,0.65,3.45,3.45,2.35,2.35,0.65 22.1 15.3 12.25 10.15 6.65
16,0.65,1.5,0.65,3.45,1.5,1.5,2.35,3.45,3.45,1.5,1.5,2.35,0.65,2.35,1.5,2.35,0.65,1.5,2.35,3.45,2.35,0.65,0.65,0.65 23.95 8.35 7.5 5.9 12.25
11,0.65,0.65,2.35,3.45,0.65,2.35,3.45,3.45,2.35,1.5,1.5,1.5,1.5,2.35,0.65,0.65,1.5,3.45,0.65,0.65,1.5,1.5,2.35,1.5 14.45 6.65 8.6 12.1 10.3
17,2.35,2.35,3.45,1.5,1.5,0.65,2.35,1.5,0.65,1.5,2.35,1.5,1.5,0.65,3.45,1.5,3.45,0.65,1.5,3.45,1.5,0.65,0.65,2.35 26.9 8.35 10.3 6.75 6.65
18,1.5,0.65,3.45,0.65,0.65,0.65,2.35,0.65,1.5,3.45,0.65,0.65,3.45,1.5,2.35,2.35,2.35,2.35,1.5,1.5,1.5,3.45,0.65,0.65 25.95 6.65 9.45 9.55 5.8
19,2.35,2.35,0.65,1.5,2.35,1.5,0.65,2.35,0.65,0.65,2.35,1.5,2.35,1.5,1.5,3.45,1.5,2.35,2.35,3.45,3.45,0.65,2.35,0.65 26.95 13.1 6.65 9.05 6.65
20,2.35,1.5,0.65,1.5,0.65,2.35,3.45,3.45,3.45,3.45,1.5,2.35,2.35,1.5,2.35,2.35,3.45,3.45,3.45,3.45,1.5,2.35,1.5,0.65 29.9 10.05 13.1 10.4 10.55
15,3.45,0.65,2.35,2.35,0.65,3.45,3.45,2.35,0.65,2.35,1.5,1.5,3.45,2.35,0.65,3.45,3.45,0.65,0.65,3.45,3.45,2.35,2.35,0.65 22.1 15.3 11.4 10.15 6.65
21,0.65,1.5,3.45,1.5,3.45,1.5,2.35,0.65,2.35,3.45,3.45,0.65,3.45,1.5,3.45,0.65,1.5,0.65,1.5,3.45,0.65,0.65,0.65,1.5 34.8 6.9 6.65 7.85 8.35
42,2.35,1.5,2.35,0.65,1.5,2.35,1.5,0.65,1.5,3.45,3.45,1.5,2.35,3.45,1.5,3.45,1.5,3.45,0.65,2.35,0.65,1.5,1.5,3.45 50.8 12.25 7.5 9.3 9.7
43,1.5,0.65,3.45,3.45,1.5,2.35,3.45,0.65,3.45,1.5,1.5,1.5,1.5,1.5,0.65,1.5,1.5,3.45,1.5,1.5,2.35,1.5,1.5,3.45 48.15 9.2 8.6 9.55 13.35
32,0.65,1.5,3.45,1.5,1.5,1.5,2.35,2.35,3.45,1.5,1.5,2.35,3.45,2.35,0.65,2.35,3.45,1.5,2.35,2.35,1.5,3.45,0.65,0.65 38 7.5 13.1 10.4 10.3
44,1.5,0.65,0.65,2.35,3.45,0.65,2.35,0.65,2.35,0.65,1.5,2.35,1.5,1.5,1.5,2.35,2.35,0.65,2.35,3.45,0.65,3.45,0.65,0.65 53.05 6.65 11.15 3.1 9.2
45,2.35,3.45,2.35,2.35,2.35,3.45,2.35,1.5,2.35,0.65,2.35,1.5,2.35,2.35,3.45,2.35,0.65,2.35,0.65,3.45,3.45,2.35,0.65,0.65 54.9 13.95 10.3 8.2 8.35
33,1.5,3.45,2.35,1.5,3.45,0.65,1.5,3.45,0.65,1.5,2.35,3.45,0.65,3.45,2.35,0.65,2.35,2.35,0.65,3.45,0.65,3.45,3.45,1.5 43.75 5.8 14.2 11.25 7.75
46,1.5,1.5,2.35,0.65,3.45,3.45,2.35,3.45,3.45,1.5,3.45,1.5,1.5,1.5,2.35,3.45,0.65,2.35,2.35,3.45,3.45,3.45,1.5,1.5 56.75 15.3 9.45 10.15 9.45
47,0.65,2.35,3.45,3.45,0.65,1.5,1.5,0.65,2.35,3.45,3.45,2.35,0.65,0.65,2.35,0.65,0.65,2.35,2.35,0.65,1.5,0.65,3.45,3.45 54.1 7.75 7.5 9.55 12.25
37,1.5,2.35,0.65,1.5,0.65,1.5,3.45,0.65,3.45,3.45,2.35,0.65,3.45,1.5,0.65,1.5,1.5,1.5,2.35,3.45,3.45,1.5,1.5,2.35 45.2 10.3 9.45 6.75 11.15
48,1.5,3.45,1.5,3.45,2.35,2.35,3.45,0.65,1.5,3.45,2.35,3.45,1.5,0.65,2.35,3.45,1.5,3.45,3.45,0.65,3.45,1.5,2.35,3.45 56.8 13.1 13.35 8.45 12.5

Chapter I: Information VS Communication Technologies
- 64 -
49,2.35,1.5,0.65,3.45,1.5,2.35,3.45,1.5,2.35,3.45,3.45,1.5,2.35,0.65,0.65,2.35,3.45,0.65,2.35,0.65,2.35,0.65,1.5,3.45 55.25 12.85 10.55 5.65 12.25
42,0.65,1.5,2.35,0.65,1.5,2.35,1.5,0.65,1.5,3.45,3.45,1.5,2.35,3.45,1.5,3.45,1.5,3.45,0.65,2.35,0.65,1.5,1.5,2.35 50.8 10.55 7.5 9.3 8.6
23,1.5,1.5,0.65,2.35,1.5,3.45,2.35,3.45,3.45,3.45,0.65,1.5,1.5,3.45,3.45,0.65,1.5,0.65,2.35,3.45,2.35,2.35,0.65,0.65 34.85 8.6 9.2 5.9 12.25
21,0.65,3.45,3.45,1.5,3.45,1.5,2.35,0.65,2.35,3.45,3.45,0.65,3.45,1.5,3.45,0.65,1.5,0.65,1.5,3.45,0.65,0.65,0.65,1.5 34.8 6.9 8.6 7.85 8.35
22,3.45,0.65,3.45,2.35,0.65,1.5,3.45,3.45,0.65,3.45,0.65,3.45,1.5,3.45,1.5,1.5,0.65,3.45,1.5,0.65,3.45,0.65,1.5,0.65 28.25 10.55 8.85 12.35 8.6
23,1.5,0.65,0.65,2.35,1.5,3.45,2.35,3.45,3.45,3.45,0.65,1.5,1.5,3.45,3.45,0.65,1.5,0.65,2.35,3.45,2.35,2.35,0.65,0.65 34.85 8.6 8.35 5.9 12.25
39,0.65,0.65,3.45,1.5,1.5,2.35,0.65,2.35,2.35,2.35,3.45,3.45,0.65,2.35,2.35,3.45,0.65,3.45,2.35,3.45,0.65,2.35,3.45,3.45 48.65 10.55 7.75 12.35 12
24,1.5,3.45,2.35,1.5,3.45,1.5,0.65,3.45,2.35,1.5,3.45,2.35,1.5,3.45,3.45,2.35,2.35,1.5,0.65,2.35,0.65,1.5,2.35,0.65 34.75 9.45 10.3 10.15 8.6
25,0.65,3.45,1.5,1.5,2.35,0.65,0.65,1.5,2.35,1.5,3.45,1.5,2.35,0.65,1.5,1.5,0.65,2.35,3.45,3.45,3.45,3.45,2.35,2.35 33.8 9.7 9.7 9.05 10.3
26,2.35,1.5,0.65,2.35,3.45,0.65,1.5,2.35,3.45,2.35,1.5,3.45,1.5,1.5,3.45,2.35,3.45,2.35,2.35,0.65,2.35,3.45,3.45,0.65 35.9 9.2 13.35 9.3 10.3
16,0.65,1.5,0.65,1.5,1.5,1.5,2.35,3.45,3.45,1.5,1.5,2.35,0.65,2.35,1.5,2.35,0.65,1.5,2.35,3.45,2.35,0.65,0.65,0.65 23.95 8.35 7.5 5.9 10.3
27,3.45,0.65,1.5,1.5,3.45,1.5,1.5,2.35,1.5,0.65,0.65,0.65,0.65,1.5,2.35,3.45,3.45,2.35,3.45,3.45,0.65,0.65,0.65,0.65 36.9 9.7 6.9 6.5 8.6
28,0.65,3.45,2.35,1.5,1.5,2.35,0.65,2.35,0.65,2.35,3.45,1.5,3.45,0.65,0.65,1.5,0.65,2.35,1.5,1.5,2.35,1.5,2.35,0.65 34 10.3 7.75 11.85 4.95
45,0.65,3.45,2.35,2.35,2.35,3.45,2.35,1.5,2.35,0.65,2.35,1.5,2.35,2.35,3.45,2.35,0.65,2.35,0.65,3.45,3.45,2.35,0.65,3.45 54.9 12.25 10.3 8.2 11.15
29,2.35,1.5,0.65,3.45,1.5,2.35,1.5,1.5,2.35,3.45,1.5,1.5,2.35,1.5,2.35,1.5,3.45,1.5,0.65,3.45,2.35,1.5,3.45,2.35 39.75 10.05 9.45 8.45 10.3
30,3.45,3.45,2.35,3.45,2.35,2.35,1.5,3.45,2.35,0.65,3.45,0.65,0.65,0.65,1.5,2.35,2.35,0.65,0.65,1.5,2.35,1.5,3.45,0.65 36 13.95 9.45 9.55 7.75
20,2.35,0.65,0.65,1.5,0.65,2.35,3.45,3.45,3.45,3.45,1.5,2.35,2.35,1.5,2.35,2.35,3.45,3.45,3.45,3.45,1.5,2.35,1.5,0.65 29.9 10.05 12.25 10.4 10.55
28,0.65,2.35,2.35,1.5,1.5,2.35,0.65,2.35,0.65,2.35,3.45,1.5,3.45,0.65,0.65,1.5,0.65,2.35,1.5,1.5,2.35,1.5,2.35,0.65 34 10.3 6.65 11.85 4.95
31,2.35,1.5,2.35,1.5,2.35,3.45,3.45,2.35,0.65,2.35,1.5,0.65,3.45,2.35,0.65,3.45,3.45,0.65,0.65,3.45,3.45,2.35,1.5,3.45 39.8 14.2 11.4 9.3 8.6
30,3.45,0.65,2.35,3.45,2.35,2.35,1.5,3.45,2.35,0.65,3.45,0.65,0.65,0.65,1.5,2.35,2.35,0.65,0.65,1.5,2.35,1.5,3.45,0.65 36 13.95 6.65 9.55 7.75
31,2.35,0.65,2.35,1.5,2.35,3.45,3.45,2.35,0.65,2.35,1.5,0.65,3.45,2.35,0.65,3.45,3.45,0.65,0.65,3.45,3.45,2.35,1.5,3.45 39.8 14.2 10.55 9.3 8.6
32,0.65,1.5,3.45,3.45,1.5,1.5,2.35,2.35,3.45,1.5,1.5,2.35,3.45,2.35,0.65,2.35,3.45,1.5,2.35,2.35,1.5,3.45,0.65,0.65 38 7.5 13.1 10.4 12.25
33,1.5,2.35,2.35,1.5,3.45,0.65,1.5,3.45,0.65,1.5,2.35,3.45,0.65,3.45,2.35,0.65,2.35,2.35,0.65,3.45,0.65,3.45,3.45,1.5 43.75 5.8 13.1 11.25 7.75
22,3.45,0.65,3.45,3.45,0.65,1.5,3.45,3.45,0.65,3.45,0.65,3.45,1.5,3.45,1.5,1.5,0.65,3.45,1.5,0.65,3.45,0.65,1.5,0.65 28.25 10.55 8.85 12.35 9.7
34,1.5,2.35,1.5,3.45,0.65,3.45,2.35,2.35,0.65,2.35,2.35,3.45,2.35,1.5,1.5,1.5,1.5,2.35,3.45,0.65,0.65,3.45,0.65,0.65 39.15 9.45 13.1 8.2 9.7
35,1.5,1.5,2.35,1.5,2.35,0.65,0.65,2.35,2.35,3.45,1.5,3.45,1.5,3.45,1.5,0.65,2.35,2.35,2.35,3.45,2.35,0.65,3.45,3.45 45.75 6.65 8.6 11 13.1
36,3.45,2.35,1.5,1.5,0.65,3.45,3.45,3.45,2.35,3.45,2.35,2.35,3.45,0.65,2.35,2.35,3.45,3.45,3.45,2.35,0.65,2.35,1.5,0.65 44.8 12.25 13.95 12.35 8.6
19,2.35,3.45,0.65,1.5,2.35,1.5,0.65,2.35,0.65,0.65,2.35,1.5,2.35,1.5,1.5,3.45,1.5,2.35,2.35,3.45,3.45,0.65,2.35,0.65 26.95 13.1 7.75 9.05 6.65
37,1.5,2.35,0.65,3.45,0.65,1.5,3.45,0.65,3.45,3.45,2.35,0.65,3.45,1.5,0.65,1.5,1.5,1.5,2.35,3.45,3.45,1.5,1.5,2.35 45.2 10.3 9.45 6.75 13.1
38,0.65,0.65,3.45,3.45,3.45,1.5,3.45,2.35,0.65,0.65,0.65,3.45,1.5,0.65,2.35,1.5,0.65,3.45,1.5,0.65,0.65,1.5,1.5,0.65 45.1 4.95 9.7 11.25 6.9
39,0.65,3.45,3.45,1.5,1.5,2.35,0.65,2.35,2.35,2.35,3.45,3.45,0.65,2.35,2.35,3.45,0.65,3.45,2.35,3.45,0.65,2.35,3.45,3.45 48.65 10.55 10.55 12.35 12
48,2.35,3.45,1.5,3.45,2.35,2.35,3.45,0.65,1.5,3.45,2.35,3.45,1.5,0.65,2.35,3.45,1.5,3.45,3.45,0.65,3.45,1.5,2.35,2.35 56.8 13.95 13.35 8.45 11.4
32,3.45,1.5,3.45,1.5,1.5,1.5,2.35,2.35,3.45,1.5,1.5,2.35,3.45,2.35,0.65,2.35,3.45,1.5,2.35,2.35,1.5,3.45,0.65,1.5 38 10.3 13.1 10.4 11.15
33,0.65,3.45,2.35,1.5,3.45,0.65,1.5,3.45,0.65,1.5,2.35,3.45,0.65,3.45,2.35,0.65,2.35,2.35,0.65,3.45,0.65,3.45,3.45,1.5 43.75 4.95 14.2 11.25 7.75

Chapter I: Information VS Communication Technologies
- 65 -
34,2.35,2.35,1.5,2.35,0.65,3.45,2.35,2.35,0.65,2.35,2.35,3.45,2.35,1.5,1.5,1.5,1.5,2.35,3.45,0.65,0.65,3.45,0.65,2.35 39.15 10.3 13.1 8.2 10.3
35,1.5,2.35,2.35,1.5,2.35,0.65,0.65,2.35,2.35,3.45,1.5,3.45,1.5,3.45,1.5,0.65,2.35,2.35,2.35,3.45,2.35,0.65,3.45,1.5 45.75 6.65 9.45 11 11.15
26,2.35,3.45,0.65,2.35,3.45,0.65,1.5,2.35,3.45,2.35,1.5,3.45,1.5,1.5,3.45,2.35,3.45,2.35,2.35,0.65,2.35,3.45,3.45,0.65 35.9 9.2 15.3 9.3 10.3
36,3.45,3.45,1.5,1.5,0.65,3.45,3.45,3.45,2.35,3.45,2.35,2.35,3.45,0.65,2.35,2.35,3.45,3.45,3.45,2.35,0.65,2.35,1.5,3.45 44.8 12.25 15.05 12.35 11.4
37,3.45,2.35,0.65,1.5,0.65,1.5,3.45,0.65,3.45,3.45,2.35,0.65,3.45,1.5,0.65,1.5,1.5,1.5,2.35,3.45,3.45,1.5,1.5,3.45 45.2 12.25 9.45 6.75 12.25
29,2.35,1.5,0.65,2.35,1.5,2.35,1.5,1.5,2.35,3.45,1.5,1.5,2.35,1.5,2.35,1.5,3.45,1.5,0.65,3.45,2.35,1.5,3.45,2.35 39.75 10.05 9.45 8.45 9.2
38,1.5,0.65,3.45,2.35,3.45,1.5,3.45,2.35,0.65,0.65,0.65,3.45,1.5,0.65,2.35,1.5,0.65,3.45,1.5,0.65,0.65,1.5,1.5,0.65 45.1 5.8 9.7 11.25 5.8
39,0.65,0.65,3.45,1.5,1.5,2.35,0.65,2.35,2.35,2.35,3.45,3.45,0.65,2.35,2.35,3.45,0.65,3.45,2.35,3.45,0.65,2.35,3.45,2.35 48.65 10.55 7.75 12.35 10.9
40,1.5,1.5,1.5,1.5,3.45,0.65,3.45,2.35,1.5,1.5,2.35,0.65,1.5,2.35,3.45,0.65,1.5,0.65,3.45,1.5,3.45,3.45,1.5,0.65 49.9 8.6 10.55 6.5 9.45
41,3.45,2.35,3.45,1.5,2.35,3.45,2.35,3.45,1.5,1.5,3.45,3.45,1.5,3.45,3.45,0.65,3.45,2.35,2.35,2.35,2.35,3.45,0.65,1.5 50.65 13.35 15.05 10.4 10.3
40,1.5,1.5,1.5,1.5,3.45,0.65,3.45,2.35,1.5,1.5,2.35,0.65,1.5,2.35,3.45,0.65,1.5,0.65,3.45,1.5,3.45,3.45,1.5,1.5 49.9 8.6 10.55 6.5 10.3
41,1.5,2.35,3.45,1.5,2.35,3.45,2.35,3.45,1.5,1.5,3.45,3.45,1.5,3.45,3.45,0.65,3.45,2.35,2.35,2.35,2.35,3.45,0.65,1.5 50.65 11.4 15.05 10.4 10.3
40,1.5,2.35,1.5,1.5,3.45,0.65,3.45,2.35,1.5,1.5,2.35,0.65,1.5,2.35,3.45,0.65,1.5,0.65,3.45,1.5,3.45,3.45,1.5,0.65 49.9 8.6 11.4 6.5 9.45
34,1.5,2.35,1.5,2.35,0.65,3.45,2.35,2.35,0.65,2.35,2.35,3.45,2.35,1.5,1.5,1.5,1.5,2.35,3.45,0.65,0.65,3.45,0.65,0.65 39.15 9.45 13.1 8.2 8.6
41,3.45,3.45,3.45,1.5,2.35,3.45,2.35,3.45,1.5,1.5,3.45,3.45,1.5,3.45,3.45,0.65,3.45,2.35,2.35,2.35,2.35,3.45,0.65,1.5 50.65 13.35 16.15 10.4 10.3
42,0.65,3.45,2.35,0.65,1.5,2.35,1.5,0.65,1.5,3.45,3.45,1.5,2.35,3.45,1.5,3.45,1.5,3.45,0.65,2.35,0.65,1.5,1.5,2.35 50.8 10.55 9.45 9.3 8.6
43,1.5,1.5,3.45,3.45,1.5,2.35,3.45,0.65,3.45,1.5,1.5,1.5,1.5,1.5,0.65,1.5,1.5,3.45,1.5,1.5,2.35,1.5,1.5,1.5 48.15 9.2 9.45 9.55 11.4
35,1.5,2.35,2.35,1.5,2.35,0.65,0.65,2.35,2.35,3.45,1.5,3.45,1.5,3.45,1.5,0.65,2.35,2.35,2.35,3.45,2.35,0.65,3.45,3.45 45.75 6.65 9.45 11 13.1
44,1.5,1.5,0.65,2.35,3.45,0.65,2.35,0.65,2.35,0.65,1.5,2.35,1.5,1.5,1.5,2.35,2.35,0.65,2.35,3.45,0.65,3.45,0.65,2.35 53.05 6.65 12 3.1 10.9
45,0.65,2.35,2.35,2.35,2.35,3.45,2.35,1.5,2.35,0.65,2.35,1.5,2.35,2.35,3.45,2.35,0.65,2.35,0.65,3.45,3.45,2.35,0.65,3.45 54.9 12.25 9.2 8.2 11.15
46,2.35,3.45,2.35,0.65,3.45,3.45,2.35,3.45,3.45,1.5,3.45,1.5,1.5,1.5,2.35,3.45,0.65,2.35,2.35,3.45,3.45,3.45,1.5,2.35 56.75 16.15 11.4 10.15 10.3
46,2.35,1.5,2.35,0.65,3.45,3.45,2.35,3.45,3.45,1.5,3.45,1.5,1.5,1.5,2.35,3.45,0.65,2.35,2.35,3.45,3.45,3.45,1.5,2.35 56.75 16.15 9.45 10.15 10.3
47,0.65,3.45,3.45,3.45,0.65,1.5,1.5,0.65,2.35,3.45,3.45,2.35,0.65,0.65,2.35,0.65,0.65,2.35,2.35,0.65,1.5,0.65,3.45,1.5 54.1 7.75 8.6 9.55 10.3
48,2.35,2.35,1.5,3.45,2.35,2.35,3.45,0.65,1.5,3.45,2.35,3.45,1.5,0.65,2.35,3.45,1.5,3.45,3.45,0.65,3.45,1.5,2.35,2.35 56.8 13.95 12.25 8.45 11.4
49,3.45,3.45,0.65,3.45,1.5,2.35,3.45,1.5,2.35,3.45,3.45,1.5,2.35,0.65,0.65,2.35,3.45,0.65,2.35,0.65,2.35,0.65,1.5,3.45 55.25 13.95 12.5 5.65 12.25
17,2.35,0.65,3.45,1.5,1.5,0.65,2.35,1.5,0.65,1.5,2.35,1.5,1.5,0.65,3.45,1.5,3.45,0.65,1.5,3.45,1.5,0.65,0.65,2.35 26.9 8.35 8.6 6.75 6.65

- 66 -

- 67 -
Chapter II: Influence costs: An experimental evidence9
9 This chapter has given rise to a paper entitled On the Merit of Equal Pay: Influence Activities & Incentive
Setting with Brice Corgnet, Ludivine Martin and Angela Sutan. This submitted paper contains some sections that we did not have opportunities to include in this chapter.

Chapter II: Influence costs
- 68 -
II1. Introduction
The use of technologies in the workplace has considerably increased in the last decades;
several firms were quick to adopt new technologies in the production, management and
communication process (Colombo and Delmastro, 1999; Ariss, 2002). The diffusion of
Informational and Communication Technologies (ICT) has engendered some organizational
changes regarding structures and work practices of firms (Black and Lynch, 2001). Empirical
evidence suggests that the implementation of ICT in the firm have to be combined with
organizational changes to realize the greatest benefits from these technologies (Milgrom and
Roberts, 1990; Brynjolfsson and Hitt, 2000). These organizational changes have encompassed
several issues such as employee involvement in decision making, compensation, teamwork,
flattering hierarchies, information sharing, ERP use, scheduling and etc. (Bertschek and
Kaiser, 2004; Falk, 2005). Even though technological and organizational changes facilitated
by these technologies contribute to the increase of firms’ productivity (Black and Lynch,
2001; Bresnahan et al., 2002; Brynjolfsson and Hitt, 2000), these changes also incurred
substantial costs (Colombo and Delmastro, 2004; Bertschek and Kaiser, 2004). Some of these
costs are generated by workers’ behaviors who are reluctant to these organizational changes
(Schaefer, 1998) or which could attempt to influence these changes in favor of their own
interests (Milgrom, 1988; Milgrom and Roberts, 1988, 1990b). So, the adoption of new
technologies engendered some organizational changes that could imply important costs with
some consequences on workers ‘productivity and organizational performance.
The manager must solicit information on the value of organizational changes from workers in
order to select the appropriate form of change (Schaefer, 1998; Matejka and De Waegenaere,
2005). However, agency theory assumes that the interests of the agent may not coincide with
those of the principal (Acemoglu et al., 2007) so, this situation may generate incentives for
the former to provide biased information to the latter. Indeed, “Where different parts of the
organization have responsibility for different pieces of information relevant to a decision, we
would expect some biases in information transmitted due to perceptual differences among the
subunits and some attempts to manipulate information as a device for manipulating the
decision.” (Cyert and March, 1963, 2013, page 67).
The issue of the manipulation of information is worthwhile for studies on impacts of ICT use
at workers’ level since empirical evidence has shown that firms have to adopt technologies
and organizational changes that push decision-making at the agent level for more efficiency

Chapter II: Influence costs
- 69 -
(Black and Lynch, 2001; Bresnahan et al., 2002; Brynjolfsson and Hitt, 2000; Garicano, 2000;
Garicano and Rossi-Hansberg, 2006; Bloom et al. (2014). This is consistent with the evidence
that a decentralized work organization positively impacts the agent’s performance (Aghion et
al., 2013; Charness et al., 2012; Sliwka, 2001). However, a decentralized work environment
which enables more autonomy for employees as they have a greater voice in decision making
could also generate more opportunities and incentives for workers to manipulate information.
By reducing communication costs, ICT allows an increase of direct interactions between
principal and agents. Thus, agents could rely more on the principal and have more
opportunities to influence the decision making. So, the implementation of ICT opens more
channels of communication and means for the agent to influence the principal’s decision.
Indeed, “in reality a worker doesn’t always need to produce more than her rival to win a
promotion tournament, but rather can create an impression well founded or otherwise, that she
has.” (Carpenter et al., 2010). The selfish reasons that lead the agent to maximize his interest
rather than the firm’s interest may entail important costs.
The literature on influence costs has highlighted the substantial costs generated when the
agent manipulates the information for selfish reasons. According to Milgrom (1988) and
Milgrom and Roberts (1988, 1990b), influence costs are costs induced by individuals’
activities to provide information which makes them look good relative to others and to affect
others’ decisions to their benefit. Milgrom and Roberts (1988) develop an economic approach
to influence activities in organizations which may bring benefits but also entail influence costs
with negative overall effects. One of the hypotheses of influence costs theory is that when the
information is only available for the agent and if the principal has discretion about the
distribution of resources, there are high incentives for a rational agent to manipulate the
information in order to increase his benefits10. The use of subjective information for the
evaluation of the performance may also generate influence activities. “A more pertinent
problem with subjective assessments in large firms may be the danger of rent seeking
activities, which refers to any actions that agents carry out that are designed to increase the
likelihood of better ratings from supervisors, but that have less value on surplus than some
other activity that they could carry out” (Prendergast, 1999, p.31). The competitions between
10The typical worker operates in a setting where efforts are exerted in the hope of a promotion, salary revision, or bonus, which are typically at the discretion of superiors. (Prendergast, 1999)
Chapter II: Influence costs
- 70 -
departments in the firm for the budget allocation, competition between workers for a
promotion for examples are some cases that could lead individuals to manipulate information.
The manipulation of the information by the agent can take many forms, “ranging from
conscious lies concerning facts, through suppression of unfavorable information, to simply
presenting the information in a way that accentuates the points supporting the interested
party’s preferred decision and then insisting on these points at every opportunity” (Milgrom
and Roberts, 1988, p.156). The costs for the firm are twice: first because the agent misuses the
resources by attempting to affect the principal's decision making and secondly because that
leads the principal to make inefficient decisions. Milgrom and Roberts (1988) present three
solutions that the organization should adopt to lower the impact of influence activities. The
first is to close communication channels for certain decisions. The limitation of the principal’s
discretion and the restriction of his ability to respond to information supplied by agents are the
second option. The last option is that, the principal may build the incentives system in such a
way that the interests of the agent coincide with his interests.
In our knowledge, there are some theoretical papers which studied influence activities, most
of them focus on the relationship between influence activities and changes in the organization.
Employees may engage in influence activities if they expect that the firm will be reorganized
(Schaefer, 1998). The firm may not implement some organizational changes even if it’s
required because the change of formal and informal rules or procedures in an organization is a
high incentive to influence activities (Matejka and De Waegenaere, 2005). If a good decision
is not implemented by the agents, it can be costly for the organization then, influence
activities don’t only degrade the quality of decision making but it could also undermine the
returns of a good decision. Influence activities generate a distortion of the allocation of
resources within the organization (Inderst et al., 2005). Most recently, Corgnet and
Rodriguez-Lara (2013) showed that influence activities increase the cost of implementing the
high level of effort and the principal may not deliberately monitor the agent in equilibrium.
Our contribution is to investigate some crucial elements of this theory by using the
experimental methodology which enables us to provide a direct test in a controlled real work
environment. This methodology is indispensable to provide data with key variables which are
often unobservable in other methodological frameworks.
The costs of influence activities depend on how the information is gathered and whether the
principal’s decision impacts the reward system in the organization. In this chapter, our aim is

Chapter II: Influence costs
- 71 -
to test some features of the influence costs theory. More precisely, we focus on the
willingness of agents to engage on timewasting activities and on the impact of these influence
activities on the principal’s discretion regarding the allocation of rewards. For this purpose,
we use the virtual organization software that embeds key features of real workplace
environment such a long, repetitive and effortful task (e.g. Dohmen and Falk, 2011; Eriksson
et al., 2009; Niederle and Vesterlund, 2007), an on-the-job leisure activities (internet
browsing) and real-time monitoring (Corgnet et al., 2014). Our workplace environment
considers organizations with one principal and three agents which can separately complete a
work task and browse the web. To mimic the influence activities, we allow agents to falsely
increase their level of production instead of work to generate value to organization in order to
have the higher piece of cake. We conducted a 2×2 design in which influence activities were
either available or not. Depending on the treatment, agents received a fixed pay (Equal pay)
or a variable pay (Discretionary pay) allocated by the principal at the end of each session. We
have measured influence activities by analyzing the time spent by agents on an activity which
enables them to artificially increase their performance. The study of the allocation of rewards
made by the principal will also has enabled us to evaluate the efficiency of his decision
(influence costs).
According to influence costs theory, we found that agents are willing to expend resources to
influence the principal’s decision and that the principal’s discretion represents a higher
incentive for agents to engage on timewasting activities. We report that agents who engaged
in influence activities spent an average of 9.28 % of their time to artificially increase their
level of production by 45.25% as observed by the principal. As the consequence, the
individual production is around $3 lower on average when influence activities are available
compared to when they are not under Discretionary pay. Unexpectedly, we also find that
agents engaged on influence activities in the fixed pay reward system. This result is consistent
with the findings of Charness et al. (2014) that status seeking may lead agents to engage in
costly actions. Regarding the influence costs, we find that influence activities lead principals
to make more inefficient decisions by giving the higher pay to the wrong agent or by
weakening incentives in presence of influences activities. Indeed, the pay of the best
performers is around $1 lower on average per period under Discretionary pay. The remainder
of the chapter is structured as follows. Section 2 describes the used software and the
experimental design. Section 3 presents our main behavioral hypotheses. The results of the
experiment are provided and discussed in section 4. Section 5 concludes.

Chapter II: Influence costs
- 72 -
II2. Experimental design and procedures
We used the Virtual organization software11 to run our experiment because this software
reproduces some relevant features of real work environment. Indeed, participants can
undertake a real effort task, monitor each other, cheating and browsing internet during the
experiment (Corgnet et al., 2014). This software enables us to record time spent on each
activity by each participant and also when and how many times they switch from one activity
to another one.
II2.1. Game design
Our virtual workplace environment considers organizations with two levels of hierarchy
referred to subject B as agent at the lower level and subject C as principal on the top of the
hierarchy. Each organization consisted of one principal and three agents, they learned about
their role at the beginning of the experiment. Participants kept the same role and the same
partners that they were randomly assigned and matched for the whole duration of the
experiment. All participants were able to undertake three different activities separately in a
different screen by choosing the corresponding option from a drop-down menu at the bottom-
right of their screens. The activities consisted to work (Task option) and browse the web
(Internet option) for both principal and agents. Agents had an additional activity that
consisted to influence (boost option) the principal while the later was able to monitor (watch
option) then. The workplace environment and activities are described in detail below.
II2.1.1. The work task
The work task consists in summing up 36 numbers in a table with 6 rows and 6 columns. It is
a long, repetitive and effortful task already used in others studies (Corgnet et al., 2015a;
2015b). This task was designed to reduce as much as possible the intrinsic motivation derived
from performing the task just for its sake. Each participant is given a same set of tables
generated randomly with the same level of difficulty. Before providing the total sum of all
numbers in the table, they have to fill in the 6 cells that correspond to the sums of the 6
columns of randomly-generated integers between zero and three (see Figure II.1).
11 https://sites.google.com/site/corgnetb/virtual-organizations.

Chapter II: Influence costs
- 73 -
Participants were not allowed to use a calculator or any other electronic, computer-based or
internet-based devices to sum up numbers. Each correct completed table provided 60 cents of
individual production while 30 cents were subtracted if the answer was incorrect. Penalties
did not apply when individual production was equal to zero12.
Figure II. 1: Task screen
II2.1.2. Leisure activity (Internet)
Our computerized firm environment enables participants to undertake a leisure activity. The
first window displayed on the computer screen of each participant at the beginning of a given
period was a Google page embedded in the software. Both agents and principal were able to
browse the internet at any time during this experiment. Participants were informed about the
confidentiality of their usage of internet, they were free to consult their email or visit any web
page. Participants can access the internet screen by clicking on the Internet option in the drop-
down menu; they were unable to undertake another activity while they were browsing the
web. This activity enables us to implement a real leisure activity at the workplace.
II2.1.3. Monitoring activities
Only the principal was allowed to use the watch option during the experiment. This activity
enabled him to observe the production of all agents at any time during the experiment by
accessing a separate window with a monitoring screen. By using the watch option, the
principal was informed in real time of the amount of individual production in cents of all
agents. He was also informed of their relative production to the total production of the
organization in percentage terms. The principal was able to observe one or all agents’
production at the same time. However, he was unable to undertake another activity during this
time. The principal was also unable to know the activities completed by agents. The principal
12 The individual production can never be negative thus could not decrease the total team’s production.

Chapter II: Influence costs
- 74 -
received a monitoring summary at the end of each period with information about the
individual and the relative productions of each agent and the last time he used the watch
option. We have to notice that information about agents’ production as observed by the
principal could be false if one or several agents were manipulating their production. However,
the principal could deduce that there is wrong information13.
II2.1.4. Influence activities
In order to implement influence activities, we gave to agents the ability to manipulate
information about their performances by pretending that they produce more than they really
do. This activity which was referred to as boost in the experiment allowed agents to
exaggerate their amount of production as observed by the principal at any time during the
experiment. To do so, they just had to select the boost option in the action menu and enter the
amount by which they wanted to increase their production as observed by the principal. After
clicking on a confirmation button, agents were unable to complete any other activity during
30 seconds. By using the boost option, agents reduce by 5% the time they should dedicate to
work. The amount by which agents exaggerated their production was recorded in the history
panel at the bottom of their screen while the amount of their actual production remains
unchanged. So agents were able to kept tract of their influence activities and evaluate their
impacts at the end of the session. This boost option has two aspects which will enable us to
measure influences activities: the time spent by agents and the total amount they entered to
artificially increase their production.
The monitoring summary of the principal also reflected this exaggeration but, as the result of
influence activities, the sum of agents’ production he observed differed from the actual total
production. So, the principal was able to know whether one or several agents had artificially
increased their production. However, the principal was unable to know neither the one who
exaggerated his production nor by which amount his production had increased if he didn’t
monitor them in real time. This is the case because the monitoring screen does not give
information about the activities completed by each subject. But, by monitoring on real time,
the principal could able to detect influence activities if someone was entering an amount
different of 60. Also, by observing on real time or by reading the monitoring summary at the
13 By observing agents, principals were able to deduce if they used the boost option when they entered an amount different of 60.
Chapter II: Influence costs
- 75 -
end of the period, the principal was able to realize whether someone increased his production
if his individual production was not a multiple of 30.
II2.1.5 Payment schemes
There are two types of payment schemes. Participants were rewarded a share of the total
production which is the sum of the individual production of the principal and the three agents
at the end of each period. The principal always gets 40% of the total production regardless the
payment scheme. Agents get the remaining 60% of Total production at the end of each period
as follow: In the Equal pay reward system, each of them always received 20% of the total
production while in the Discretionary pay reward system; principal has to divide the
remaining 60% of total production among the 3 agents according to his discretion14. In the last
row of the monitoring summary, principal decided upon the allocation by entering numbers in
the corresponding green cells. Once principal has entered the shares allocated to each agent,
all agents were informed about their pay of the total production as well as the pay they
received in the history panel at the bottom of their screen.
II2.2. Treatments
We ran a 2 x 2 experimental design resulting in four treatments. Payment schemes and
influence activities were the parameters which varied between treatments. The treatments are
outlined in the table below (Table II.1). In each treatment, participants were randomly
matched with 3 others at the beginning of the experiment and kept the same partners for the
whole duration of the experiment. In the baseline treatment also called NIEP treatment (No
influence + Equal pay), all participants are able to work, browse internet but only the
principal was able to use the watch option. The payment scheme for this treatment is Equal
pay, each agent of the same organization always has the same pay at the end of each period.
The NIDP treatment (No Influence + Discretionary pay) is the second treatment of our
experiment, this treatment differs from the first one in the payment scheme. Indeed,
Discretionary pay is the reward system for this treatment, the pay of each agent depends of
the discretion of the principal. The third treatment, IEP treatment (Influence + Equal pay) is
similar to the first one but agents have the boost option, and thus are able to artificially
14 Each subject B can be allocated a different percentage of the total production and this percentage can be changed by subject C at the end of each period.

Chapter II: Influence costs
- 76 -
increase their production. The IDP treatment (Influence + Discretionary pay) is the last
treatment, it is similar to the third one because agents had the boost option but the reward
system is the Equal pay.
Table II. 1: Summary of treatments
Payment schemes
Equal pay Discretionary pay
Influence
activities
Influence IEP treatment (16 groups) IDP treatment (16 groups)
No Influence NIEP treatment (15 groups) NIDP treatment (15 groups)
In treatments IEP and IDP, agents are able to artificially increase their production as
perceived by the principal; we will refer to these treatments as Influence treatments.
Treatments NIDP and IDP will also be called Discretionary treatments because in these 2
treatments, the pay received by agents depends on the principal’s discretion.
II2.3. Procedures
The experiment took place in March and April 2014 at the Economic Science Institute (ESI)
of Chapman University, we recruited 252 students (51.61% females) from this university. We
conducted 21 sessions with 63 groups of 4 students each but, one student left the experiment
because of a headache, so we lost the data of one organization. So, we just collected data from
62 groups (248 students). Between 12 and 24 individuals who were invited through the ESI
recruiter software participated in each session. Each session lasted around one hour and half
with 5 periods of 10 minutes. Participants’ earnings at the end of the experiment were
computed as the sum of the earnings of the 5 periods. Regardless their role, participants
earned on average $32.515 including a show-up fee of $7.
Participants had 20 minutes to read the instructions displayed on their computer screen. A
timer that indicates the remaining time to read the instructions was displayed on the
laboratory screen. A printed copy of the summary of the instructions was given to each
15 This amount also includes the earnings of the first stage in which participants were asked to sum five one-digit numbers.

Chapter II: Influence costs
- 77 -
subject two minutes before the end of the instructions round. The experimenter closed the
instructions file after the time required for the instructions reading. We noticed that
participants finished reading the instructions in less than 20 minutes. We gave the ability to
participants to require assistance if they had any questions during the instruction round or if
any difficulties arose after the experiment has begun by raising their hand, but none of them
asked questions during the instructions round. When the instructions file was closed, a pop up
inviting the subject to type their name was displayed on their computer screen.
Table II. 2: Summary of the experimental design
248 participants were matched in organization of 4 members : one
principal and three agents
Treatments IEP NIEP IDP NIDP
Equal pay Discretionary pay
Influence × Influence ×
First stage Ability test
Second stage Session ( 5 periods of 10 minutes each)
Third stage Allocation stage (at the end of each session)
Fourth stage Payment stage (at the end of the experiment)
END
The experiment started with an ability test. Before receiving instructions, participants were
invited to sum as many five one-digit numbers as they could during two minutes. Each correct
answer was rewarded 10 cents and the total earnings of this stage were added to the individual
earnings of the participants at the end of the experiment. The number of correct answers is
what we refer to as “Ability” in the rest of this chapter. A google page was displayed on the
computer screen of each subject when the experimenter launched the session, they were able
to browse internet or switch to another activity. Participants were able to get access of
information about all previous periods through the history table at the bottom of the screen.
×

Chapter II: Influence costs
- 78 -
II3. Behavioral hypotheses
Before formulating the behavioral hypotheses that we expect in our treatments, we have to
notice that our objective is to test the influence costs theory. The main prediction of this
theory is that influence activities arise when the principal has discretion over decisions with
some distributional implications (Milgrom and Roberts, 1988). We focus on the time wasting
activities and on the impact of influence activities on the principal’s decision making.
II3.1. Influence activities
The influence costs theory assumes that agents will engage on time wasting activities in order
to manipulate the information required for the principal to make decisions. If agents spend
time on influence activities, they will spend less time on productive activities. In our design,
when a participant undertakes an influence activity which helps him to artificially increase his
production, he is unable to switch to another activity during 30 seconds. This time is
subtracted from the time available for a given period which could be spent in productive or
leisure activities. According to Milgrom (1988) and Milgrom and Roberts (1988, 1990b), the
principal’s discretion is the most powerful incentive on influence activities. When the
principal’s making decision can impact the distribution of payoffs, individuals are more
willing to spend time and resources to engage on influence activities. In Discretionary
treatments, the principal has to allocate 60% of the total production between three agents that
is how we implement the principal discretion. Therefore, agents in IDP treatment should be
more willing to provide information which makes them look good relative to others in order
to get the higher pay.
Hypothesis 1: When influence activities are available, we expect that agents will devote time
to these activities and unduly overstate their productivity indicate. The highest level of
influence activities will be reached in IDP treatment.
Hypothesis 2: When influence activities are available, we expect that agents will spend less
time on productive activities. The lowest percentage of time will be reached in IDP treatment
under Discretionary treatments and Influence treatments.

Chapter II: Influence costs
- 79 -
II3.2. Influence costs
The costs for the firm are twice: first because the agent misuses time and resources by
attempting to affect the principal's decision making and secondly because that leads the
principal to make inefficient decisions (Milgrom, 1988; Milgrom and Roberts, 1988, 1993).
We will measure the individual production of each member of the organization since the time
devoted by agents to influence activities will reduce their time spent on productive activities
and may affect their performance. The analysis of the allocation of rewards made by the
principal will also enable us to evaluate the costs generated by the influence activities.
II3.2.1. Productivity
The agency theory assumes that agents will exert the minimum effort in order to maximize
their payoff if they receive a flat wage and if there is any monitoring and penalty for shirking.
Several studies in economics showed that individuals’ performance is higher in tournament
system than in other pay systems (Gneezy et al., 2003; Carpenter et al., 2010). According to
the influence costs theory, the principal’s discretion should create high incentives to influence
activities and therefore weaken the strength of this payment scheme. Therefore, the
production of the team may be lower because agents will engage on influence activities and
principals may spend more time on monitoring activity.
Hypothesis 3: We expect the individual production to be lower in IDP treatment under
Discretionary treatments.
II3.2.2. Decision making
The study of the allocation of rewards made by the principal will enable us to evaluate the
efficiency of his decision. More precisely, we define efficient decision as the allocation of the
highest pay by the principal to the best producer and so on. Influence activities lead the
principal to make inefficient decisions regarding the allocation (Milgrom, 1988; Milgrom and
Roberts, 1988, 1993). Therefore, if an agent uses the boost option, he may receive a higher
pay than he deserves. Indeed, by trusting the information on the summary screen at the end of
the session, the principal may not reward the meritocracy if a given agent artificially increased
his level of production. The watch option may be helpful for the principal to detect some
influence activities. Indeed, by monitoring on real time, the principal could detect influence
activities if an agent was entering an amount higher or different than 60 even if this amount is
Chapter II: Influence costs
- 80 -
a multiple of 30 or 6016. Also, by observing on real time or by reading the monitoring
summary at the end of the period, the principal can deduce whether someone increased his
production if his individual production was not a multiple of 30. In order to have the right
information to make the right decision, the principal in IDP treatment should face this
dilemma: either he increases the size of the cake by producing himself or spends more time on
monitoring activity.
Hypothesis 4: Under Discretionary treatments, we expect: i) Principals in IDP treatment to
make more inefficient decisions regarding the allocation of pay. ii) Principals in IDP
treatment to spend more time on monitoring activity and less time on productive activity. iii)
Principals to identify and punish some influences activities in IDP treatment.
II4. Results
This section includes descriptive statistics and econometric analysis of experimental data. We
thus consider a total of 320 observations for each of the influence treatments and 300
observations for each treatment without influence activities. These observations are related for
the 5 periods, three fourths correspond to data on agents while the remaining observations
correspond to principals. We start the section by comparing agents’ time dedication on each
activity across treatments; we also report p-values of the clustered t-tests (Wilcoxon rank-sum
test) on the difference of means. The second part of this section presents an econometric
analysis of the effect of influence activities on principals’ decisions by using linear panel
regressions with random effects and clustered standard errors to consider the fact that
observations may not be entirely independent.
II4.1. Descriptive statistics of time dedication on each activity per treatments
We provide descriptive statistics regarding influence activities as well as work and leisure
activities.
16The principal can observe on real time the difference in the production if an agent chooses an amount higher than 60 which the amount generated by each correct table.

Chapter II: Influence costs
- 81 -
II4.1.1. Influence activities (Time and amount)
The figure below displays the average time spent by agents of each treatment on each activity;
remember that each participant could undertake separately 3 different activities in each
period.
Figure II. 2: Time dedication on each activity per treatments
We can see on Figure II.2 that agents in IDP treatment devoted more time on influence
activities on average than agents on IEP treatment (5.66% > 3.69%). This difference between
influence treatments is statistically significant (z = 2.34, p = 0.02). Agents who engaged on
influence activities in IDP treatment spent an average of 9.28 % of their time by using the
boost option in a given period. It follows that the average total amount by which agents
artificially increased their production was also higher in IDP treatment (85.72 cents) than in
IEP treatment (52.32 cents). This result is statistically significant (z = 2.16, p = 0.03). Figure
II.3 shows the average total amount chosen by agents in influence treatments to exaggerate
their production. We can observe that agents in IDP treatment entered an amount higher than
60 cents (the equivalent of one correct table) on average. This amount was equal to 148 cents
(the equivalent of 2.5 correct tables) on average for agents who used the boost option. These
influence activities represented almost the half (45.25%) of their production level as observed
by the principals and increased over time. These results confirm that the rent seeking was the
reason why agents engaged on influence activities. These findings are in line with the
predictions theory and with our expectations (see Hypothesis 1).
2.62% 97.38%
4.19% 95.81%
3.69%
2.58%93.73%
5.66%3.71%
90.63%
0 20 40 60 80 100Time (percentage)
NIEP
NIDP
IEP
IDP
Influence Leisure
Work

Chapter II: Influence costs
- 82 -
Figure II. 3: Average amount of influence activities in cents
Unexpectedly, we can also notice that agents on IEP treatment also engaged on influence
activities even if there was no consequence on their payoffs. Figure II.3 also shows that they
exaggerated their production by an amount lower than 60 cents on average. This result is
consistent with the finding that status seeking could lead people to engage in costly actions
(Charness et al., 2014). We also suggest that a proportion of these influence activities resulted
from agents’ curiosity regarding the boost option or from demand effects (Zizzo, 2010).
However, the dynamic of influence activities in this treatment seems to suggest that agents
were more concerned by their relative status than the satisfaction of their curiosity.
II4.1.2. Work and internet time
We can see on Figure II.5 that on average, agents in IDP treatment devoted the lowest
percentage of time on productive activity than others 90.63% < 93.73% < 95.81% < 97.38%
respectively IEP, NIDP and NIEP treatments. We find a significant difference between the
average time spent on this activity by agents under Discretionary pay (95.81% > 90.63% with
z = -3.41, p < 0.01). The percentage of time spent on productive activity by agents who used
the boost option was equal to 86.25%. This result highlights that the competition leads agents
to work hard but the influence activities weaken the strength of this reward system. We also
find a significant difference when we compare agents in influence treatments (z = -2.60, p <
0.01), agents in IDP treatment worked less than agents in IEP treatment. These results are
consistent with our Hypothesis 2, agents in IDP treatment spent less time on productive
activities than others agents under Discretionary treatments as well as under Influence
treatments.
20
40
60
80
1 2 3 4 5Periods
IDP IEP

Chapter II: Influence costs
- 83 -
Regarding internet usage, we find a significant difference between the average time spent by
agents on leisure activity under Equal pay. Agents in NIEP treatment devoted more time on
internet usage than agents on IEP treatment (z = -2.12, p = 0.03). The surprising part of this
finding is to observe that agents on IEP treatment spent more time on influence activities
(3.69% of their time) than on leisure activity (2.58% of their time). As discussed above, status
seeking, curiosity and demand effects may explain this result. Our findings are summarized as
follows:
Results 1: influence activities
i. Influence activities (time and amount) are highest in IDP treatment.
ii. Agents in IDP treatment spend less time on productive activity than others when we
compare agents on Discretionary treatments as well as Influence treatments.
iii. Surprisingly, agents also engage in influence activities on Equal pay reward system.
II4.2. Influence costs
Influence costs result from timewasting activities of agents and inefficient decisions made by
principals. In order to have the right information to make the right decision, principals may
spend more time on monitoring activity; thus the organizational performance may suffer
because principals and agents will spend less time on productive activities. In the following
sections, we present econometric analysis regarding influence costs.
II4.2.1. Productivity of the organization
The production is defined as the number of correct answers multiplied by 60 minus the
number of incorrect answers multiplied by 30. We report regressions which analyze the effect
of influence activities on principals and agents’ production in Table II.3. We introduce
dummy variables Influence treatments and Discretionary treatments that take value one if a
given participant was involved in treatments with boost option or in treatments with
Discretionary pay and zero otherwise. We also include a proxy of participants’ summation
skills which refers to the results of the summing up five one-digit numbers during two
minutes.

Chapter II: Influence costs
- 84 -
Table II. 3: Linear panel regression for individual production for Discretionary and all treatments
Production
Discretionary treatments
All treatments
(1) (2)
Discretionary treatments 46.62*
(26.25)
IDP treatment -77.42**
(34.99)
Influence treatments -67.36*** 13.28
(25.89) (22.96)
Trend 32.10*** 30.23***
(5.00) (3.39)
Ability 20.92*** 20.83***
(1.79) (1.81)
Male dummy 32.71 12.76
(30.26) (19.69)
Constant 82.20** 51.26*
(37.81) (29.99)
Observations 620 1220
Number of subjects 124 244
Number of teams 31 61
R2 overall 0.305 0.283
Model test chi2 (6) 208.32*** 277.49***
Notes: Estimation output using robust standard errors clustered at the team level (in parentheses). Coefficients * significant at 10%; ** significant at 5%; *** significant at 1%.
In line with Hypothesis 3, we report a negative and significant effect of influence activities on
teams’ production (see dummy Influence treatments in column (1)). By contrast, the
coefficient related to influence activities is not negative when considering all treatments (see
dummy Influence treatments in column (2)). This result follows from the fact that the
incentive effect of Discretionary pay reward system is weaker than Equal pay in presence of
influence activities17. However, we observe a negative and significant effect of influence
activities in IDP treatment and a positive and significant effect of Discretionary pay on
17 Table II.6 in appendix II also shows that the individual production was on average $1.70 lower in the IDP treatment than in IEP treatment. But, this difference is not significant.

Chapter II: Influence costs
- 85 -
teams’ production (see dummy variables in column (2)). Indeed, the level of production was
decreased by $2.98 under Discretionary pay when influence activities were available18. As
principals and agents spent less time on working activity in IDP treatment, they were less
productive than others19. We also observe that the level of production was 12.63 % higher in
Discretionary pay compared to Equal pay in absence of influence activities (z = 1.7, p =
0.09). These results suggest that Discretionary pay is the most incentive reward system. This
is consistent with studies of Gneezy et al. (2003) and Carpenter et al. (2010) which have
shown that people are more productive in a competitive reward system. Nevertheless, our
results also show that the presence of influence activities weakens the strength of this reward
system. In line with learning effects (Charness and Campbell, 1988), we observe a positive
trend in individual production regardless regressions. The relationship between individual
production and summation skills (Ability) is also positive and significant in both regressions.
This suggests that summation skills were driving agents’ performance.
II4.2.2. Decision making
In this section, we analyze the effect of influence activities on principals’ decision regarding
the allocation of pay. We study the pay20 received by agents from principals at the end of each
period in Discretionary treatments. We create the variable “Actual contribution” which refers
to the share (in percentage) of the relative agents’ actual production on total production minus
principals’ production. We include the variable “observed production” which is the sum of
the individual production and the amount by which agents exaggerated his level of
production21. We also define variables Best producer, Second producer and Least producer
which refer to the ranking agents according the observed production which is the production
as perceived by principals during the monitoring activity and on the summary screen.
18 The individual production was 11.56 % lower on average in IDP treatment compared to NIDP treatment (see Table II.6 in appendix II); this difference is significant (z = -1.8, p = 0.07). 19 Principals also spent less time on working activity in IDP treatment (90.75%) compared to principals in NIDP treatment (93.19%) and principals in IEP treatment (93.36%). The difference is only significant when we compare the time spent on working activity by principals under Discretionary treatments (z = -2.17, p = 0.03). 20 The pay is computed as the relative share on remaining 60% of the total production allocated by the principal to each agent. 21 The observed production is equal to the actual production in NIDP treatment.

Chapter II: Influence costs
- 86 -
Table II. 4: Linear panel regression for pays allocated by the principal in Discretionary treatments
Pay
IDP NIDP IDP NIDP
(1) (2) (3) (4)
Actual contribution 0.34*** 0.43**
(0.093) (0.218)
Observed production -0.00*** 0.01 -0.00*** 0.01**
(0.000) (0.005) (0.000) (0.006)
Trend -0.07 -0.18 -0.07 -0.45*
(0.078) (0.176) (0.109) (0.270)
Ability -0.03 0.51** 0.01 0.28
(0.194) (0.217) (0.174) (0.247)
Male dummy 1.35 -1.99 0.98 -1.09
(2.211) (0.314) (1.591) (1.756)
Best producer 2.84 6.82***
(2.095) (2.357)
Least producer -7.50*** -5.72***
(2.164) (1.403)
Constant 22.18*** 9.78** 34.72*** 24.49***
(2.967) (4.904) (2.830) (3.029)
Observations 240 225 240 225
Number of agents 48 45 48 45
Number of teams 16 15 16 15
R2 overall 0.244 0.546 0.202 0.527
Model test chi2 (4) 9613.77*** 58.34*** 14352.21*** 115.92***
Notes: Estimation output using robust standard errors clustered at the team level (in parentheses). Coefficients * significant at 10%; ** significant at 5%; *** significant at 1%.
The first two models of Table II.4 analyze the effect of Actual contribution and observed
production on pay for IDP treatment (column 1) and NIDP treatment (column 2). The
coefficient of Actual contribution is positive and significant in each treatment. This means
that agents were rewarded according their performance but, the coefficient is higher in NIDP
treatment. The relationship between individual production and pay is lower in treatment with
influence activities (0.43 > 0.34). We also observe that the pay has a negative relationship
with variables observed production and Ability in IDP treatment. The opposite is observed in
NIDP treatment, variables observed production have a positive effect on agents’ pay.
However, these relationships are only significant for observed production IDP treatment and

Chapter II: Influence costs
- 87 -
for and Ability in NIDP treatment. We suggest that principals did not always rely on what they
observed to make their decision or were negatively influenced by observed production in IDP
treatment. While summation skills were driving agents’ performance and pay in absence of
influence activities.
Results in columns (3) and (4) study the allocation of pay by principals between three agents.
We find that the Best producer received a significant higher pay and the Least producer
received a significant lower pay relative to the second contributor in the NIDP treatment (see
dummy variables in column 4). This suggests that agents were rewarded according their
performance in the treatment without influence activities. In the treatment with influence
activities, the Least producer also received a significant lower pay relative to the second
contributor but, the difference between the Best producer and the second contributor is
positive but not significant. It appears that principals seem to distrust the best contributor
according to what they observed by allocating to him a lower pay proportionally to his
contribution. It follows that the observed production is negatively related to agents’ pay.
We find support of this interpretation. Indeed, the percentage of times that principals allocated
the higher pay to the Second producer and the second pay to the Best producer was equal to
25.49% in IDP treatment compared to 12.92% in NIDP treatment. This result is statistically
significant (proportion test, p-value = 0.006). More interestingly, agents’ pay was $ 2.29
lower on average than their observed production in IDP treatment. The difference between
the production as observed by principals and the pay was equal to $ 1.30 in NIDP treatment,
this result is statistically significant (z = 2.24, p = 0.03). We suggest that this difference22 is so
high because some principals mimicked the Equal pay in the Discretionary treatments.
Consistent with our Hypothesis 4i, the influence activities lead principals to make more
inefficient decisions regarding the allocation of pays.
Regarding the time spent by principals between working and monitoring activities, we find
that on average, principals on IDP treatment spent less time on productive activity than
principals on NIDP treatment, this difference is also significant (z = -2.17, p = 0.03). We do
not find any significant result regarding the monitoring activity. Principals did not spend more
time on this activity when influence activities were available. It seems that they chose to
22 The difference between the production as observed by the principal and pay could be negative if principals allocated a pay proportionally lower than the observed production. As the calculator was not allowed, we suggest that principals in both treatments did not always allocate the right pay proportionally to agents’ contribution.

Chapter II: Influence costs
- 88 -
increase the size of cake rather than monitoring agents. This result is consistent with the
finding of Corgnet and Rodriguez-Lara (2013); the principal may not deliberately monitor the
agent in the presence of influence activities.
We start to test Hypothesis 4iii by creating the variable undetectable influence which takes the
value 1 if the agent chose an amount multiple of 30 when using the boost option and 0
otherwise. We differentiate influences activities since each correct answer generated 60 cents
while an incorrect answer implied a penalty of 30 cents. So influence activities were easily
detectable whether an agent entered an amount which was not a multiple of 30.
Table II. 5: Linear panel regression for pay allocated by the principal in IDP treatment
Pay
(1) (2)
Periods 1& 2 Periods 3 to 5
Actual contribution 0.34*** 0.19**
(0.621) (0.094)
Undetectable influence 5.99** -0.94
(2.756) (2.416)
Ability -0.46 0.12
(0.296) (0.232)
Male dummy 0.92 2.64
(2.235) (3.679)
Constant 27.28*** 23.67***
(4.240) (4.012)
Observations 44 82
Number of agents 31 33
Number of teams 31 31
R2 overall 0.506 0.08
Model test chi2 (4) 49.13*** 13.60***
Notes: Estimation output using robust standard errors clustered at the team level (in parentheses). Coefficients * significant at 10%; ** significant at 5%; *** significant at 1%.
In Table II. 5, we analyze the effect of undetectable influence activities on agents’ pay for the
first two periods (column 1) and for the last three periods (column 2). We control for the
variable Actual contribution as it appears to be the main driver of agents’ pay. These

Chapter II: Influence costs
- 89 -
regressions analysis allow us to study whether principals did detect influence activities or not.
We observe that the performance is better rewarded at the first two periods (see variable
Actual contribution in Table II. 5, 0.34 > 0.19). We also observe a positive and significant
effect of undetectable influence at the first two periods (see dummy variable in column (1)).
The undetectable influence seems to help in the first two periods only. Indeed, the coefficient
of undetectable influence is negative but not significant for the last three periods. It seems that
principals detected and punished the undetectable influence during the last periods. However,
the R2 is very low showing that the model does not explain agents’ pay any more for these
periods. We summarize our last finding as follows.
Result 2: Impact of influence activities
i. The individual production is lower in IDP treatment under Discretionary pay as well
as under influence activities.
ii. Principals in IDP treatment make more inefficient decisions regarding the allocation of
pay.
iii. Unexpectedly, principals on IDP treatment do not spend more time on monitoring
activity under Discretionary pay but they devote less time on productive activity than
principals on NIDP treatment.
iv. The positive effect of undetectable influence activities vanishes over time.
II5. Conclusion
The adoption of new technologies has to be combined with organizational changes for a better
firm efficiency (Milgrom and Roberts, 1990; Brynjolfsson and Hitt, 2000). These changes
positively affect workers’ performance but also entail some costs for firms (Colombo and
Delmastro, 2004; Bertschek and Kaiser, 2004). A part of these costs may be generated by
workers’ behaviors who are reluctant to these changes or who can try to influence changes on
their interests (Milgrom, 1988; Milgrom and Roberts, 1988, 1990b; Schaefer, 1998). The
investigation of these costs is worthwhile for technologies issues because the use of ICT at
workplace opens more channels of communication and means for workers to influence
managers’ decision. Indeed, some technologies push down the decision making at the level of
workers by decreasing the costs of acquiring information. So, the implementation of
technologies at work may create more opportunities for employees to engage on
counterproductive behaviors.

Chapter II: Influence costs
- 90 -
In this chapter, our contribution was to use the experimental methodology for testing some
conjectures of influence costs theory which highlights the substantial costs generated by
workers when they can manipulate information to influence managers’ decision. According to
Milgrom and Roberts (1988), managerial discretion is the most important incentive for
influence activities. Our experimental design consisted of two treatments in which agents
were allowed to engage on timewasting activities with and without managerial discretion
regarding the allocation of pays. We also ran treatments with a fixed wage reward system to
study agents’ behavior regarding influence activities when there is any managerial discretion.
We measured influence activities by analyzing the time spent and the amount entered by
agents on an activity which enabled them to artificially increase their performance.
Our findings are consistent with the theoretical predictions of the influence costs literature.
Workers wasted time on unproductive activities in order to influence managers’ decision. We
report that agents who engaged in influence activities spent almost 10% of their time on
average to artificially increase their level of production. As the consequence, they spent less
time to work and team production was 12.63% lower on average when the influence activities
were available than when they were unavailable under Discretionary pay. Unexpectedly, we
also found that workers also engaged in time wasting activities in Equal pay reward system.
The willingness to engage on influence activities may also be driven by non-monetary
incentives. This result seems to be consistent with recent research showing that status seeking
may also lead people to misbehave at work.
We showed that influence activities dampen strength incentives of competition and lead
managers to weaken the meritocracy. Indeed, the team production was higher in Equal pay
than in Discretionary pay in presence of influence activities whereas the opposite was true
when influence activities were unavailable. As influence costs, we also found that influence
activities led managers to make more inefficient decisions by giving the higher pay to the
wrong worker or by mimicking the Equal pay reward system.
Some limitations of our work should be mentioned. The virtual organization software doesn’t
allow for negative individual production. Indeed, penalties were not applied when individual
production was equal to zero. We probably lost information about influence costs since the
individual production could lower the production of the team. Our experimental design
allowed participants to enter the amount they wanted to increase their production. Certainly,
that enabled us to implement situation in which some employees fail to influence their

Chapter II: Influence costs
- 91 -
manager, but we also suggest that employees who entered a detectable amount to increase
their production didn’t well understand how the boost option worked.
According to Antonelli (2003), influence activities are self-limiting and can improve the
performance of the organization. Therefore, influence activities can have some benefits which
could be higher than costs and may be preferable for firms in some cases. More research is
needed to address the benefits of influence activities. The implementation of Information
technologies leads to a wider span of control for managers (Bloom et al., 2014); further
research could assess the relationship between influence costs and the size of the span of
control. Another study may investigate the relationship between influence activities and the
degree of managerial discretion.
The main managerial implication is to close communication channels for certain decisions
since the use of ICT allows more opportunities for workers to influence managers’ decision
(Milgrom and Roberts, 1988). Firms should clarify task assignment and processes of
information sharing in the organizational guidelines. Another implication is that limiting
managerial discretion may be optimal to deter influence activities (Milgrom, 1988; Milgrom
and Roberts, 1988; Bloom and Van Reenen, 2007). However, influence activities also prevail
in organizations with non-monetary incentives. We suggest that firms have to take advantage
of the technology-based monitoring which provides a heightened transparency of the work
process and the instant availability of indicators of workers’ performance.

Chapter II: Influence costs
- 92 -
References
Acemoglu, D., Aghion, P., Lelarge C., Van Reenen, J., and F. Zilibotti (2007) ‘Technology, Information, and the Decentralization of the Firm.’ Quarterly Journal of Economics 122(4), 1759–99.
Aghion, P., Bloom, N., and J. Van Reenen (2014) ‘Incomplete contracts and the internal organization of firms.’ Journal of Law, Economics, and Organization 30(s 1), i37-i63.
Antonelli, M. (2003) ‘Efficient influence activities with endogenous rent.’ Public Choice 114, 219-23.
Black, S. E., and L.M. Lynch (2001) ‘How to compete: The impact of workplace practices and information technology on productivity.’ The Review of Economics and Statistics 83(3), 434-445.
Bertschek I., and U. Kaiser (2004) ‘Productivity effects of organizational change:
Microeconometric evidence.’ Management Science 50(3), 394-404.
Bresnahan, T. F., E. Brynjolfsson, and L.M. Hitt (2002) ‘Information technology, workplace organization, and the demand for skilled labor: Firm-level evidence.’ The Quarterly
Journal of Economics 117(1), 339-376.
Brynjolfsson, E., and L.M. Hitt (2000) ‘Beyond computation: Information technology, organizational transformation and business performance.’ The Journal of Economic
Perspectives 14(4), 23-48.
Carpenter, J., Matthews, P. and J. Schirm (2010) ‘Tournaments and Office Politics: Evidence from A Real Effort Experiment.’ American Economic Review 100, 504-517.
Charness, N., and J. Campbell (1988) ‘Acquiring skill at mental calculation in adulthood: a task decomposition.’ Journal of Experimental Psychology: General 117, 115-129.
Charness, G., Cobo-Reyes, R., Jinénez, N., Lacomba, J. A, and F. Lagos (2012) ‘The Hidden Advantage of Delegation: Pareto-improvements in a Gift-exchange Game.’ American
Economic Review 102(5), 2358-2379. Charness, G. Masclet, D., and M.-C. Villeval (2014) ‘The Dark Side of Competition for
Status.’ Management Science 60(1), 38-55.
Colombo, M.G., and M. Delmastro (1999) ‘Some stylized facts on organization and its evolution.’ Journal of Economic Behavior and Organization 40, 255-274.
Colombo, M.G., and M. Delmastro (2004) ‘The determinants of organizational change and structural inertia: technological and organizational factors.’ Journal of Economics and
Management Strategy 11(4), 595-635. Corgnet B., and I. Rodriguez-Lara (2013) ‘Are You a Good Employee or Simply a Good
Guy? Influence Costs and Contract Design.’ Journal of Economic Behavior and
Organization 92, 259-272.

Chapter II: Influence costs
- 93 -
Corgnet, B., Hernán-González, R., and E. Schniter (2015) ‘Why real leisure really matters: Incentive effects on real effort in the laboratory.’ Experimental Economics 18(2), 284-301.
Corgnet, B., Hernán-González, R., and S. Rassenti (2015) ‘Firing threats: Incentive effects
and impression management.’ Games and Economic Behavior 91, 97-113. Correa, L. (2006) ‘The economic impact of telecommunications diffusion on UK productivity
growth.’ Information Economics and Policy 18(4), 385–404. Cyert, R., and J. March (1963) ‘A Behavioral Theory of the Firm.’ Englewood Cliffs, NJ:
Prentice-Hall.
Dohmen, T., and A. Falk (2011) ‘Performance pay and multi-dimensional sorting: Productivity, preferences and gender.’ The American Economic Review 101(2), 556-590.
Eriksson, T., A. Poulsen, and M.-C. Villeval (2009) ‘Feedback and incentives: Experimental evidence.’ Labour Economics 16(6), 679-688.
Falk, M., ( 2005) ‘ICT-linked firm reorganisation and productivity gains.’ Technovation 25(11), 1229- 1250.
Garicano, L. (2000) ‘Hierarchies and the organization of knowledge in production.’ Journal
of Political Economy 108(5), 874-904.
Garicano, L., and E. Rossi-Hansberg (2006) ‘Organization and inequality in a knowledge economy.’ The Quarterly Journal of Economics 121(4), 1383-1435.
Gneezy, Uri; Muriel Niederle, and A. Rustichini (2003) ‘Performance in competitive environments: Gender differences.’ Quarterly Journal of Economics 118(3), 1049-1074.
Inderst, R., Müller, H., and K. Wärneryd (2005) ‘Influence costs and hierarchy’ Economics of
Governance 6(2), 177-197.
Jorgenson, D.W., (2001) ‘Information technology and the US economy.’ American Economic
Review 91(1), 1–32.
Matejka, M. and A. DeWaegenaere (2005) ‘Influence costs and implementation of organizational changes.’ Journal of Management Accounting Research 17, 43-52.
Milgrom, P. (1988) ‘Employment contracts, influence activities and efficient organization design.’ Journal of Political Economy 96, 42–60.
Milgrom, P. and J. Roberts (1988) ‘An economic approach to influence activities in organization.’ American Journal of Sociology 94, 154–179.
Milgrom, P., and J. Roberts (1990) ‘The economics of modern manufacturing technology,
strategy and organisation.’ The American Economic Review 511–528.
Milgrom, P. and J. Roberts (1990b) ‘The efficiency of equity in organizational decision processes.’ The American Economic Review-Papers and Proceeding 80(2), 154-159.

Chapter II: Influence costs
- 94 -
Niederle, M., and L. Vesterlund (2007) ‘Do women shy away from competition? Do men compete too much?’ The Quarterly Journal of Economics 3(8), 1067-1101.
Prendergast, C. (1999) ‘The provision of incentives in firms.’ Journal of Economic Literature 37, 7–63.
Schaefer, S. (1998) ‘Influence costs, structural inertia, and organizational change.’ Journal of
Economics and Management Strategy 7(2), 237–63.
Sliwka, D. (2001) ‘On the Costs and Benefits of Delegation in Organizations.’ Journal of
Institutional and Theoretical Economics 157(4), 568-590.
Zizzo, D. J. (2010) ‘Experimenter demand effects in economic experiments.’ Experimental
Economics 13(1), 75-98.

Chapter II: Influence costs
- 95 -
Appendix II
Table II. 6: Individual production per treatment for 5 periods
Treatments Average Standard
deviation
P-values
Ranksum test Influence activities
Discretionary pay
Influence (IDP) 456.10 209.10 z = -1.8
p = 0.07 No Influence (NIDP) 515.5 223.65
Equal pay
Influence (IEP) 489.28 213.88 z = 1.2
p = 0.22 No Influence (NIEP) 457.7 211.63

Chapter II: Influence costs
- 96 -
INSTRUCTIONS (NIEP)
n You have exactly 20 minutes to go through the instructions. You will have enough
time to read the instructions carefully. A timer is displayed on the room monitor that indicates the remaining time to read the instructions.
n After that, the experimenter will close the current document and you will be able to access the experiment. Please do not close the current document and do not access the experiment before the end of the instruction round.
n A printed copy with a short summary of the instructions will be given to you at the end of the instruction round.
n This is an experiment in decision making. You will be paid in cash for your participation at the end of the experiment. Different participants may earn different amounts. What you earn depends on your decisions and the decisions of others.
n The experiment will take place through computer terminals at which you are seated. If you have any questions during the instruction round, raise your hand and a monitor will come by to answer your question. If any difficulties arise after the experiment has begun, raise your hand, and someone will assist you.
(Timing of the experiment)
n This experiment involves 4 subjects and consists of 5 periods of 10 minutes each.
There are two types of subjects referred to as B and C.
n 3 subjects will be subjects B and one will be subject C. You will learn the type of subject you are when the experiment starts.
n Your individual earnings at the end of the experiment are computed as the sum of your
earnings in the 5 periods.
n In each period of this experiment both subjects B and subject C will be able to: sum up numbers in a table (work task) or browse the web.
n Subject C will have access to another activity that consists in monitoring other subjects.
n To switch from one activity to another you just have to click on the corresponding
option of the action menu displayed on your screen.
n The activities are referred to as Task (sum up numbers in a table), Internet (browse the web), Watch (monitor subjects B contributions – only available to C). Each activity is undertaken separately, in a different screen.
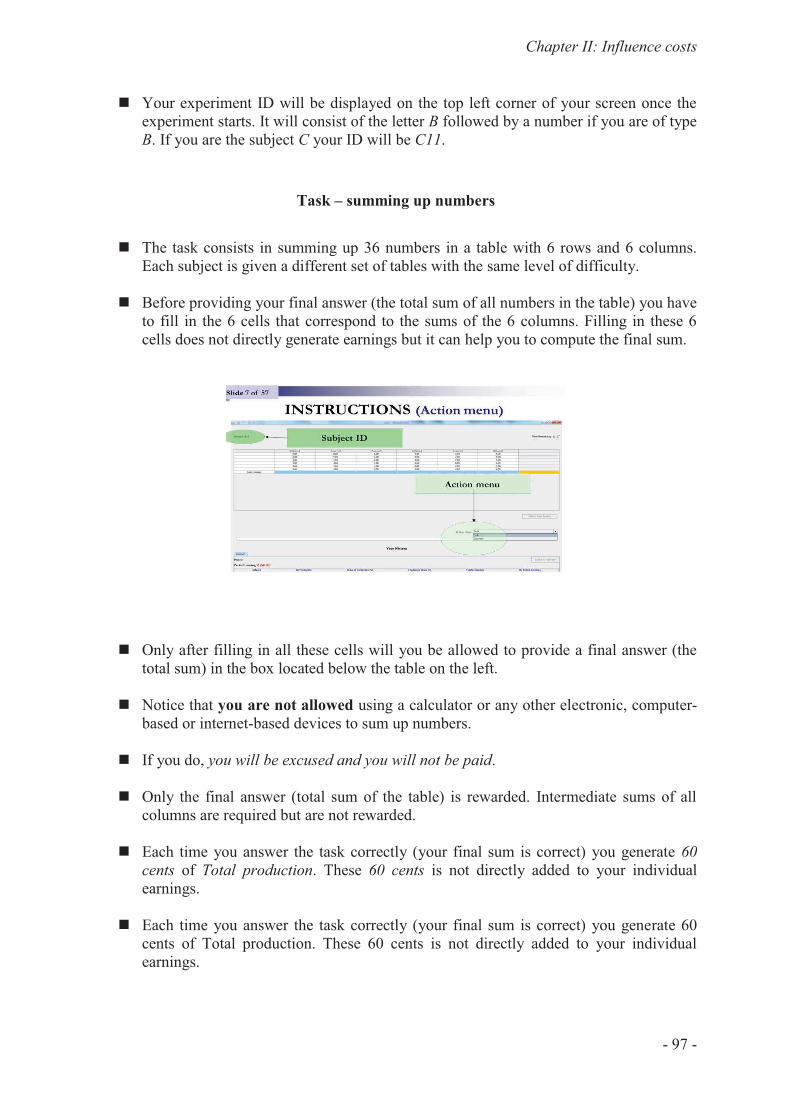
Chapter II: Influence costs
- 97 -
n Your experiment ID will be displayed on the top left corner of your screen once the experiment starts. It will consist of the letter B followed by a number if you are of type B. If you are the subject C your ID will be C11.
Task – summing up numbers
n The task consists in summing up 36 numbers in a table with 6 rows and 6 columns.
Each subject is given a different set of tables with the same level of difficulty.
n Before providing your final answer (the total sum of all numbers in the table) you have to fill in the 6 cells that correspond to the sums of the 6 columns. Filling in these 6 cells does not directly generate earnings but it can help you to compute the final sum.
n Only after filling in all these cells will you be allowed to provide a final answer (the total sum) in the box located below the table on the left.
n Notice that you are not allowed using a calculator or any other electronic, computer-based or internet-based devices to sum up numbers.
n If you do, you will be excused and you will not be paid.
n Only the final answer (total sum of the table) is rewarded. Intermediate sums of all columns are required but are not rewarded.
n Each time you answer the task correctly (your final sum is correct) you generate 60
cents of Total production. These 60 cents is not directly added to your individual earnings.
n Each time you answer the task correctly (your final sum is correct) you generate 60 cents of Total production. These 60 cents is not directly added to your individual earnings.

Chapter II: Influence costs
- 98 -
n Subject C always gets 40% of Total production while each subject B gets 20% of the total profit contributed by all subjects undertaking the task.
n The amount of money you generate by undertaking the task is displayed in the second column “My Production” of the history table at the bottom of the screen.
n The total amount of money generated by all 4 subjects (subject C + 3 subjects B) on the task is displayed in the sixth column “Total Production” of the history table at the bottom of the screen.
n If you sum up the numbers of a table correctly then each subject in the experiment (including yourself) gets 60 cents times the percentage of Total production that he or she is assigned.
- If you are subject C you get 24 cents (40%×60 cents). - If you are one of the subjects B you get 12 cents (20%×60 cents).
n If you answer the task incorrectly you generate a penalty of 30 cents that is subtracted from Total production. So when you answer incorrectly your individual earnings decrease by 12 cents (40%×30) if you are Subject C and by 6 cents (20%×30) if you are Subject B.
(Your Production can never be less than 0.)
(Browsing the internet)
n Whether you are a subject B or subject C, you can browse the internet at any time
during this experiment. Browsing the web is one of the basic activities that you can perform during this experiment, along with summing up numbers.
n You can access the internet screen by clicking on the Internet option in the action menu.
n Notice that while using the internet you are not allowed to download additional software. You are also expected to close pop-up windows when they appear on the screen.
n Your usage of the internet is strictly confidential. No one can see the web pages you are consulting (for example, your email).
Monitoring: only for subject C
n If and only if you are subject C, you can monitor the contribution of the three subjects
B at any time during this experiment. You can do so by clicking on the Watch option in the action menu.
n You will be faced with a monitoring screen with 3 columns, each of them corresponding to one of the subjects B in the experiment. The head of each column indicates the experiment ID of the subject.

Chapter II: Influence costs
- 99 -
n For example, to monitor subject B12, you have to click on the column header “B12”
displayed in green. The column header turns red once you click on the Yes button on the pop-up message: “Ready to watch?”
n You can monitor all subjects’ contributions at the same time by clicking on the following button displayed in the top right corner of the screen:
n You can stop monitoring all subjects B by clicking:
n To stop monitoring a given subject you have to click on the corresponding column header.
n You will be informed in real time of the observed production and contribution to Total
production (in % terms) of the selected subject B.
n You will not know the activities completed by this subject, however.
INSTRUCTIONS (Earnings)
n Your individual earnings correspond to the following sum over the 5 periods:
¨ Your percentage of Total production that has been generated by all 4 subjects
(C subject + 3 B subjects) summing up numbers during the experiment.
n You will learn the exact amount of your individual earnings at the end of each 10-
minute period.
Earnings
n In the pop-up window, your individual earnings in dollars for the current period will
be displayed.
n You will click on the OK button to continue to next period.

Chapter II: Influence costs
- 100 -
n Your earnings in cents for the current period will be also displayed in the last column of the history table at the bottom of your screen. This column is labeled “My Period
Earnings”.
n You will also see the share of production of all other subjects at the top of your screen
n EXAMPLE: In the first period you provided 7 correct answers completing the task while providing 3 incorrect answers. Also, the other three subjects in the experiment provided a total of 24 correct answers in the task while providing 5 incorrect answers.
n Your earnings (“My Period Earnings”) for that period are equal to:
n Earnings: 20%×(31×60 - 8×30)= 324 cents if you are a subject B
n Earnings: 40%×(31×60 - 8×30)= 648 cents if you are subject C
Summary
n This experiment involves 4 subjects and consists of 5 periods of 10 minutes each. There are two types of subjects referred to as B and C, respectively.
n 3 subjects will be subjects B and one subject will be subject C.
n In each period, both subjects B and subject C will be able to: sum up numbers in a table or browse the web.
n Only subject C will be able to monitor other subjects.
n Your individual earnings will depend on the task which consists in summing up numbers in a table.
n The total earnings generated by all 4 subjects (subject C + 3 subjects B) on the task will be divided as follows.
n Each subject B will get 20% of the total amount of money generated by all subjects while subject C always will get 40% of the total amount of money generated.

Chapter II: Influence costs
- 101 -

Chapter II: Influence costs
- 102 -
INSTRUCTIONS (Treatment NIDP)
n You have exactly 20 minutes to go through the instructions. You will have enough time to read the instructions carefully. A timer is displayed on the room monitor that indicates the remaining time to read the instructions.
n After that, the experimenter will close the current document and you will be able to access the experiment. Please do not close the current document and do not access the experiment before the end of the instruction round.
n A printed copy with a short summary of the instructions will be given to you at the end of the instruction round.
n This is an experiment in decision making. You will be paid in cash for your participation at the end of the experiment. Different participants may earn different amounts. What you earn depends on your decisions and the decisions of others.
n The experiment will take place through computer terminals at which you are seated. If you have any questions during the instruction round, raise your hand and a monitor will come by to answer your question. If any difficulties arise after the experiment has begun, raise your hand, and someone will assist you.
(Timing of the experiment)
n This experiment involves 4 subjects and consists of 5 periods of 10 minutes each. There are two types of subjects referred to as B and C.
n 3 subjects will be subjects B and one will be subject C. You will learn the type of subject you are when the experiment starts.
n Your individual earnings at the end of the experiment are computed as the sum of your earnings in the 5 periods.
n In each period of this experiment both subjects B and subject C will be able to: sum up numbers in a table (work task) or browse the web.
n Subject C will have access to another activity that consists in monitoring other subjects.
n To switch from one activity to another you just have to click on the corresponding option of the action menu displayed on your screen.
n The activities are referred to as Task (sum up numbers in a table), Internet (browse the web), Watch (monitor subjects B contributions – only available to C). Each activity is undertaken separately, in a different screen.
n Your experiment ID will be displayed on the top left corner of your screen once the experiment starts. It will consist of the letter B followed by a number if you are of type B. If you are the subject C your ID will be C11.

Chapter II: Influence costs
- 103 -
Task – summing up numbers
n The task consists in summing up 36 numbers in a table with 6 rows and 6 columns. Each subject is given a different set of tables with the same level of difficulty.
n Before providing your final answer (the total sum of all numbers in the table) you have to fill in the 6 cells that correspond to the sums of the 6 columns. Filling in these 6 cells does not directly generate earnings but it can help you to compute the final sum.
n Only after filling in all these cells will you be allowed to provide a final answer (the total sum) in the box located below the table on the left.
n Notice that you are not allowed using a calculator or any other electronic, computer-based or internet-based devices to sum up numbers.
n If you do, you will be excused and you will not be paid.
n Only the final answer (total sum of the table) is rewarded. Intermediate sums of all columns are required but are not rewarded.
n Each time you answer the task correctly (your final sum is correct) you generate 60
cents of Total production. These 60 cents is not directly added to your individual earnings.
n Subject C always gets 40% of Total production while subjects B get the remaining 60% of Total production at the end of each period.
n At the end of each period, subject C will divide the remaining 60% of Total production among the 3 subjects B involved in the experiment. So, each subject B gets a percentage of the total profit contributed by all subjects undertaking the task.
n The amount of money you generate by undertaking the task is displayed in the second column “My Production” of the history table at the bottom of the screen.
n The total amount of money generated by all 4 subjects (subject C + 3 subjects B) on the task is displayed in the sixth column “Total Production” of the history table at the bottom of the screen.

Chapter II: Influence costs
- 104 -
n If you sum up the numbers of a table correctly then each subject in the experiment (including yourself) gets 60 cents times the percentage of Total production that he or she is assigned.
n If you are subject C you get 24 cents (40%×60 cents).
n If you are subject B you get a percentage (allocated to you at the end of the period by subject C) of the 60 cents.
n If you answer the task incorrectly you generate a penalty of 30 cents that is subtracted from Total production. So when you answer incorrectly your individual earnings (as well as other subjects’ earnings) decrease.
(Your Production can never be less than 0.)
(Browsing the internet)
n Whether you are a subject B or subject C, you can browse the internet at any time during this experiment. Browsing the web is one of the basic activities that you can perform during this experiment, along with summing up numbers.
n You can access the internet screen by clicking on the Internet option in the action menu.
n Notice that while using the internet you are not allowed to download additional software. You are also expected to close pop-up windows when they appear on the screen.
n Your usage of the internet is strictly confidential. No one can see the web pages you are consulting (for example, your email).
Monitoring: only for subject C
n If and only if you are subject C, you can monitor the contribution of the three subjects B at any time during this experiment. You can do so by clicking on the Watch option in the action menu.
n You will be faced with a monitoring screen with 3 columns, each of them corresponding to one of the subjects B in the experiment. The head of each column indicates the experiment ID of the subject.
n For example, to monitor subject B12, you have to click on the column header “B12” displayed in green. The column header turns red once you click on the Yes button on the pop-up message: “Ready to watch?”
n You can monitor all subjects’ contributions at the same time by clicking on the following button displayed in the top right corner of the screen:
n You can stop monitoring all subjects B by clicking:

Chapter II: Influence costs
- 105 -
n To stop monitoring a given subject you have to click on the corresponding column header.
n You will be informed in real time of the observed production and contribution to Total
production (in % terms) of the selected subject B.
n You will not know the activities completed by this subject, however.
INSTRUCTIONS (Earnings)
n Your individual earnings correspond to the following sum over the 5 periods: o Your percentage of Total production that has been generated by all 4 subjects
(C subject + 3 B subjects) summing up numbers during the experiment.
n You will learn the exact amount of your individual earnings at the end of each 10-
minute period.
Earnings
n In the pop-up window, your individual earnings in dollars for the current period will be displayed.
n You will click on the OK button to continue to next period. n Your earnings in cents for the current period will be also displayed in the last column
of the history table at the bottom of your screen. This column is labeled “My Period
Earnings”.
n You will also see the share of production of all other subjects at the top of your screen

Chapter II: Influence costs
- 106 -
Allocation of Total production
n At the end of each of the 5 periods subject C allocates a percentage of Total
production to each B subject. Given that subject C gets a fixed percentage of 40% of Total production at the end of each period, there is 60% of Total production to divide among the 3 subjects B.
n Notice that each subject B can be allocated a different percentage of Total production. Also, this percentage can be changed by the C subject at the end of each period.
n B subjects do not know this percentage until the end of a given period.
n In the last row of the monitoring summary, subject C will decide upon the allocation of Total production among the 3 subjects B by entering numbers in the corresponding green cells in the last row of the summary screen.
n EXAMPLE: subject C allocates the remaining 60% of Total production among subjects B as follows:
n B11 gets 15%, B12 gets 25%, B13 gets 20%,
n Notice that all percentages sum up to 60%.
n Once subject C has entered the percentages allocated to each subject B, all subjects B are informed about their share of Total production in the history panel at the bottom of their screen.
n EXAMPLE: In the first period you provided 7 correct answers completing the task while providing 3 incorrect answers. Also, the other three subjects in the experiment provided a total of 24 correct answers in the task while providing 5 incorrect answers.
n Also, imagine that you are subject B12 and that subject C has allocated to you 25% of Total production at the end of the first period. Your earnings (“My Period
Earnings”) for that period are equal to:
Earnings Calculation
n EXAMPLE: In the first period you provided 7 correct answers completing the task while providing 3 incorrect answers. Also, the other three subjects in the experiment provided a total of 24 correct answers in the task while providing 5 incorrect answers.
n Also, imagine that you are subject B12 and that subject C has allocated to you 25% of Total production at the end of the first period. Your earnings (“My Period Earnings”) for that period are equal to:
n Earnings: 25%×(31×60 - 8×30)= 405 cents if you are subject B12
n Earnings: 40%×(31×60 - 8×30)= 648 cents if you are subject C11

Chapter II: Influence costs
- 107 -
Summary
n This experiment involves 4 subjects and consists of 5 periods of 10 minutes each. There are two types of subjects referred to as B and C, respectively.
n 3 subjects will be subjects B and one subject will be subject C.
n In each period, both subjects B and subject C will be able to: sum up numbers in a table or browse the web.
n Only subject C will be able to monitor other subjects.
n Your individual earnings will depend on the task which consists in summing up numbers in a table.
n At the end of each period, subject C always gets 40% of the total amount of money generated by all 4 subjects (C subject + 3 B subjects) and decides how to allocate the remaining 60% among the 3 subjects B.

Chapter II: Influence costs
- 108 -
INSTRUCTIONS (IEP)
n You have exactly 20 minutes to go through the instructions. You will have enough
time to read the instructions carefully. A timer is displayed on the room monitor that indicates the remaining time to read the instructions.
n After that, the experimenter will close the current document and you will be able to access the experiment. Please do not close the current document and do not access the experiment before the end of the instruction round.
n A printed copy with a short summary of the instructions will be given to you at the end
of the instruction round.
n This is an experiment in decision making. You will be paid in cash for your participation at the end of the experiment. Different participants may earn different amounts. What you earn depends on your decisions and the decisions of others.
n The experiment will take place through computer terminals at which you are seated. If you have any questions during the instruction round, raise your hand and a monitor will come by to answer your question. If any difficulties arise after the experiment has begun, raise your hand, and someone will assist you.
(Timing of the experiment)
n This experiment involves 4 subjects and consists of 5 periods of 10 minutes each.
There are two types of subjects referred to as B and C.
n 3 subjects will be subjects B and one will be subject C. You will learn the type of subject you are when the experiment starts.
n Your individual earnings at the end of the experiment are computed as the sum of your
earnings in the 5 periods.
n In each period of this experiment both subjects B and subject C will be able to: sum up numbers in a table (work task) or browse the web.
n Subject C will have access to another activity that consists in monitoring other subjects.
n Subjects B will have access to an activity in which they will be able to exaggerate their
performance on the work task.
n To switch from one activity to another you just have to click on the corresponding option of the action menu displayed on your screen.
n The activities are referred to as Task (sum up numbers in a table), Internet (browse the
web), Watch (monitor subjects B contributions – only available to C) and Boost
(exaggerate task production as observed by subject C – only available to Bs). Each activity is undertaken separately, in a different screen.

Chapter II: Influence costs
- 109 -
n Your experiment ID will be displayed on the top left corner of your screen once the
experiment starts. It will consist of the letter B followed by a number if you are of type B. If you are the subject C your ID will be C11.
Task – summing up numbers
n The task consists in summing up 36 numbers in a table with 6 rows and 6 columns.
Each subject is given a different set of tables with the same level of difficulty.
n Before providing your final answer (the total sum of all numbers in the table) you have to fill in the 6 cells that correspond to the sums of the 6 columns. Filling in these 6 cells does not directly generate earnings but it can help you to compute the final sum.
n Only after filling in all these cells will you be allowed to provide a final answer (the total sum) in the box located below the table on the left.
n Notice that you are not allowed using a calculator or any other electronic, computer-based or internet-based devices to sum up numbers.
n If you do, you will be excused and you will not be paid.
n Only the final answer (total sum of the table) is rewarded. Intermediate sums of all columns are required but are not rewarded.
n Each time you answer the task correctly (your final sum is correct) you generate 60
cents of Total production. These 60 cents is not directly added to your individual earnings.
n Subject C always gets 40% of Total production while each subject B gets 20% of the total profit contributed by all subjects undertaking the task.

Chapter II: Influence costs
- 110 -
n The amount of money you generate by undertaking the task is displayed in the second column “My Production” of the history table at the bottom of the screen.
n The total amount of money generated by all 4 subjects (subject C + 3 subjects B) on the task is displayed in the sixth column “Total Production” of the history table at the bottom of the screen.
n If you sum up the numbers of a table correctly then each subject in the experiment (including yourself) gets 60 cents times the percentage of Total production that he or she is assigned.
n If you are subject C you get 24 cents (40%×60 cents).
n If you are one of the subjects B you get 12 cents (20%×60 cents).
n If you answer the task incorrectly you generate a penalty of 30 cents that is subtracted from Total production. So when you answer incorrectly your individual earnings decrease by 12 cents (40%×30) if you are Subject C and by 6 cents (20%×30) if you are Subject B.
(Your Production can never be less than 0.)
(Browsing the internet)
n Whether you are a subject B or subject C, you can browse the internet at any time
during this experiment. Browsing the web is one of the basic activities that you can perform during this experiment, along with summing up numbers.
n You can access the internet screen by clicking on the Internet option in the action menu.
n Notice that while using the internet you are not allowed to download additional software. You are also expected to close pop-up windows when they appear on the screen.
n Your usage of the internet is strictly confidential. No one can see the web pages you are consulting (for example, your email).
Monitoring: only for subject C
n If and only if you are subject C, you can monitor the contribution of the three subjects
B at any time during this experiment. You can do so by clicking on the Watch option in the action menu.
n You will be faced with a monitoring screen with 3 columns, each of them corresponding to one of the subjects B in the experiment. The head of each column indicates the experiment ID of the subject.

Chapter II: Influence costs
- 111 -
n For example, to monitor subject B12, you have to click on the column header “B12” displayed in green. The column header turns red once you click on the Yes button on the pop-up message: “Ready to watch?”
n You can monitor all subjects’ contributions at the same time by clicking on the following button displayed in the top right corner of the screen:
n You can stop monitoring all subjects B by clicking:
n To stop monitoring a given subject you have to click on the corresponding column header.
n You will be informed in real time of the observed production and contribution to Total
production (in % terms) of the selected subject B.
n You will not know the activities completed by this subject, however.
INSTRUCTIONS (Boost)
n If and only if you are subject B, you can exaggerate your production, as observed by
subject C, at any time during this experiment.
n To do so, you just have to select the Boost option in the action menu.
n To exaggerate your observed production, you have to enter the amount by which you want to increase it.
n After clicking on OK, you will not be able to complete any other activity for 30 seconds. This is how your screen will look like during these 30 seconds:

Chapter II: Influence costs
- 112 -
n The amount by which you boosted your observed production will appear in the Boost column at the bottom of your screen.
n The My Production column will remain unchanged, however.
n For example, consider the situation in which the production of subject B12 is 120¢ while the other three subjects have produced a total of 270¢. In that case, Total
production is equal to 390¢ and subject B12 contribution to Total production is equal to 31% (120¢/390¢).
n Consider now that subject B12 exaggerates his or her observed production by 60¢ using the boost option.
n As a consequence, the production of subject B12 as observed by subject C will immediately increase from its current level of 120¢ to 180¢. Also, the observed contribution of subject B12 will increase from 31% to 38% (180¢/390¢) and the observed contributions of subjects B11and B13 will decrease.
n The monitoring screen of subject C will reflect this increase in observed production
and contribution of subject B12.
n As a result of subject B12 boosting his or her observed production, the sum of subjects’ observed productions will be different from the actual Total production in the monitoring summary.

Chapter II: Influence costs
- 113 -
n The monitor will be able to know whether one or several subjects B have boosted their observed production. However, the monitor will not know which subject(s) exaggerated their observed production and by which amount.
n This is the case because the monitor will not be informed of the activities completed by each subject.
n Instead, the monitor will be informed of the observed production and contribution of the monitored subjects B at that moment in time.
INSTRUCTIONS (Earnings)
n Your individual earnings correspond to the following sum over the 5 periods: ¨ Your percentage of Total production that has been generated by all 4 subjects
(C subject + 3 B subjects) summing up numbers during the experiment.
n You will learn the exact amount of your individual earnings at the end of each 10-
minute period.
n In the pop-up window, your individual earnings in dollars for the current period will be displayed.
n You will click on the OK button to continue to next period.
n Your earnings in cents for the current period will be also displayed in the last column of the history table at the bottom of your screen. This column is labeled “My Period Earnings”.
n You will also see the share of production of all other subjects at the top of your screen
n EXAMPLE: In the first period you provided 7 correct answers completing the task while providing 3 incorrect answers. Also, the other three subjects in the experiment provided a total of 24 correct answers in the task while providing 5 incorrect answers.
n Your earnings (“My Period Earnings”) for that period are equal to:
n Earnings: 20%×(31×60 - 8×30)= 324 cents if you are a subject B
n Earnings: 40%×(31×60 - 8×30)= 648 cents if you are subject C
n Note that the amount displayed in the Boost column increased your production as observed by subject C without changing either the value of the My Production and Total production columns.
Summary
n This experiment involves 4 subjects and consists of 5 periods of 10 minutes each. There are two types of subjects referred to as B and C, respectively.

Chapter II: Influence costs
- 114 -
n 3 subjects will be subjects B and one will be subject C.
n In each period, both subjects B and subject C will be able to: sum up numbers in a table or browse the web.
n Only subjects B will be able to exaggerate their production and contribution as observed by subject C by using the boost option.
n Only subject C will be able to monitor other subjects.
n Your individual earnings will depend on the task which consists in summing up numbers in a table.
n The total earnings generated by all 4 subjects (subject C + 3 subjects B) on the task will be divided as follows.
n Each subject B will get 20% of the total amount of money generated by all subjects while subject C always will get 40% of the total amount of money generated.

Chapter II: Influence costs
- 115 -
INSTRUCTIONS (IDP)
n You have exactly 20 minutes to go through the instructions. You will have enough
time to read the instructions carefully. A timer is displayed on the room monitor that indicates the remaining time to read the instructions.
n After that, the experimenter will close the current document and you will be able to access the experiment. Please do not close the current document and do not access the experiment before the end of the instruction round.
n A printed copy with a short summary of the instructions will be given to you at the end
of the instruction round.
n This is an experiment in decision making. You will be paid in cash for your participation at the end of the experiment. Different participants may earn different amounts. What you earn depends on your decisions and the decisions of others.
n The experiment will take place through computer terminals at which you are seated. If you have any questions during the instruction round, raise your hand and a monitor will come by to answer your question. If any difficulties arise after the experiment has begun, raise your hand, and someone will assist you.
(Timing of the experiment)
n This experiment involves 4 subjects and consists of 5 periods of 10 minutes each.
There are two types of subjects referred to as B and C.
n 3 subjects will be subjects B and one will be subject C. You will learn the type of subject you are when the experiment starts.
n Your individual earnings at the end of the experiment are computed as the sum of your
earnings in the 5 periods.
n In each period of this experiment both subjects B and subject C will be able to: sum up numbers in a table (work task) or browse the web.
n Subject C will have access to another activity that consists in monitoring other subjects.
n Subjects B will have access to an activity in which they will be able to exaggerate their
performance on the work task.
n To switch from one activity to another you just have to click on the corresponding option of the action menu displayed on your screen.
n The activities are referred to as Task (sum up numbers in a table), Internet (browse the
web), Watch (monitor subjects B contributions – only available to C) and Boost
(exaggerate task production as observed by subject C – only available to Bs). Each activity is undertaken separately, in a different screen.

Chapter II: Influence costs
- 116 -
n Your experiment ID will be displayed on the top left corner of your screen once the
experiment starts. It will consist of the letter B followed by a number if you are of type B. If you are the subject C your ID will be C11.
Task – summing up numbers
n The task consists in summing up 36 numbers in a table with 6 rows and 6 columns.
Each subject is given a different set of tables with the same level of difficulty.
n Before providing your final answer (the total sum of all numbers in the table) you have to fill in the 6 cells that correspond to the sums of the 6 columns. Filling in these 6 cells does not directly generate earnings but it can help you to compute the final sum.
n Only after filling in all these cells will you be allowed to provide a final answer (the total sum) in the box located below the table on the left.
n Notice that you are not allowed using a calculator or any other electronic, computer-based or internet-based devices to sum up numbers.
n If you do, you will be excused and you will not be paid.
n Only the final answer (total sum of the table) is rewarded. Intermediate sums of all columns are required but are not rewarded.
n Each time you answer the task correctly (your final sum is correct) you generate 60
cents of Total production. These 60 cents is not directly added to your individual earnings.
n Subject C always gets 40% of Total production while subjects B get the remaining 60% of Total production at the end of each period.

Chapter II: Influence costs
- 117 -
n At the end of each period, subject C will divide the remaining 60% of Total production among the 3 subjects B involved in the experiment. So, each subject B gets a percentage of the total profit contributed by all subjects undertaking the task.
n The amount of money you generate by undertaking the task is displayed in the second column “My Production” of the history table at the bottom of the screen.
n The total amount of money generated by all 4 subjects (subject C + 3 subjects B) on the task is displayed in the sixth column “Total Production” of the history table at the bottom of the screen.
n If you sum up the numbers of a table correctly then each subject in the experiment (including yourself) gets 60 cents times the percentage of Total production that he or she is assigned.
n If you are subject C you get 24 cents (40%×60 cents).
n If you are subject B you get a percentage (allocated to you at the end of the period by subject C) of the 60 cents.
n If you answer the task incorrectly you generate a penalty of 30 cents that is subtracted from Total production. So when you answer incorrectly your individual earnings (as well as other subjects’ earnings) decrease.
(Your Production can never be less than 0.)
(Browsing the internet)
n Whether you are a subject B or subject C, you can browse the internet at any time
during this experiment. Browsing the web is one of the basic activities that you can perform during this experiment, along with summing up numbers.
n You can access the internet screen by clicking on the Internet option in the action menu.
n Notice that while using the internet you are not allowed to download additional software. You are also expected to close pop-up windows when they appear on the screen.
n Your usage of the internet is strictly confidential. No one can see the web pages you are consulting (for example, your email).
Monitoring: only for subject C
n If and only if you are subject C, you can monitor the contribution of the three subjects
B at any time during this experiment. You can do so by clicking on the Watch option in the action menu.

Chapter II: Influence costs
- 118 -
n You will be faced with a monitoring screen with 3 columns, each of them corresponding to one of the subjects B in the experiment. The head of each column indicates the experiment ID of the subject.
n For example, to monitor subject B12, you have to click on the column header “B12” displayed in green. The column header turns red once you click on the Yes button on the pop-up message: “Ready to watch?”
n You can monitor all subjects’ contributions at the same time by clicking on the following button displayed in the top right corner of the screen:
n You can stop monitoring all subjects B by clicking:
n To stop monitoring a given subject you have to click on the corresponding column header.
n You will be informed in real time of the observed production and contribution to Total
production (in % terms) of the selected subject B.
n You will not know the activities completed by this subject, however.
INSTRUCTIONS (Boost)
n If and only if you are subject B, you can exaggerate your production, as observed by
subject C, at any time during this experiment.
n To do so, you just have to select the Boost option in the action menu.
n To exaggerate your observed production, you have to enter the amount by which you want to increase it.
n After clicking on OK, you will not be able to complete any other activity for 30 seconds. This is how your screen will look like during these 30 seconds:

Chapter II: Influence costs
- 119 -
n The amount by which you boosted your observed production will appear in the Boost column at the bottom of your screen.
n The My Production column will remain unchanged, however.
n For example, consider the situation in which the production of subject B12 is 120¢ while the other three subjects have produced a total of 270¢. In that case, Total
production is equal to 390¢ and subject B12 contribution to Total production is equal to 31% (120¢/390¢).
n Consider now that subject B12 exaggerates his or her observed production by 60¢ using the boost option.
n As a consequence, the production of subject B12 as observed by subject C will immediately increase from its current level of 120¢ to 180¢. Also, the observed contribution of subject B12 will increase from 31% to 38% (180¢/390¢) and the observed contributions of subjects B11and B13 will decrease.
n The monitoring screen of subject C will reflect this increase in observed production
and contribution of subject B12.
n As a result of subject B12 boosting his or her observed production, the sum of subjects’ observed productions will be different from the actual Total production in the monitoring summary.

Chapter II: Influence costs
- 120 -
n The monitor will be able to know whether one or several subjects B have boosted their observed production. However, the monitor will not know which subject(s) exaggerated their observed production and by which amount.
n This is the case because the monitor will not be informed of the activities completed by each subject.
n Instead, the monitor will be informed of the observed production and contribution of the monitored subjects B at that moment in time.
INSTRUCTIONS (Earnings)
n Your individual earnings correspond to the following sum over the 5 periods: ¨ Your percentage of Total production that has been generated by all 4 subjects
(C subject + 3 B subjects) summing up numbers during the experiment.
n You will learn the exact amount of your individual earnings at the end of each 10-
minute period.
n In the pop-up window, your individual earnings in dollars for the current period will be displayed.
n You will click on the OK button to continue to next period.
n Your earnings in cents for the current period will be also displayed in the last column of the history table at the bottom of your screen. This column is labeled “My Period Earnings”.
n You will also see the share of production of all other subjects at the top of your screen
Allocation of Total production
n At the end of each of the 5 periods subject C allocates a percentage of Total
production to each B subject. Given that subject C gets a fixed percentage of 40% of Total production at the end of each period, there is 60% of Total production to divide among the 3 subjects B.
n Notice that each subject B can be allocated a different percentage of Total production. Also, this percentage can be changed by the C subject at the end of each period.
n B subjects do not know this percentage until the end of a given period.
n In the last row of the monitoring summary, subject C will decide upon the allocation of Total production among the 3 subjects B by entering numbers in the corresponding green cells in the last row of the summary screen.

Chapter II: Influence costs
- 121 -
n EXAMPLE: subject C allocates the remaining 60% of Total production among subjects B as follows:
n B11 gets 15%, B12 gets 25%, B13 gets 20%,
n Notice that all percentages sum up to 60%.
n Once subject C has entered the percentages allocated to each subject B, all subjects B are informed about their share of Total production in the history panel at the bottom of their screen.
n EXAMPLE: In the first period you provided 7 correct answers completing the task
while providing 3 incorrect answers. Also, the other three subjects in the experiment provided a total of 24 correct answers in the task while providing 5 incorrect answers.
n Also, imagine that you are subject B12 and that subject C has allocated to you 25% of Total production at the end of the first period. Your earnings (“My Period
Earnings”) for that period are equal to:
Earnings Calculation
n EXAMPLE: In the first period you provided 7 correct answers completing the task while providing 3 incorrect answers. Also, the other three subjects in the experiment provided a total of 24 correct answers in the task while providing 5 incorrect answers.
n Also, imagine that you are subject B12 and that subject C has allocated to you 25% of Total production at the end of the first period. Your earnings (“My Period Earnings”) for that period are equal to:
n Earnings: 25%×(31×60 - 8×30)= 405 cents if you are subject B12
n Earnings: 40%×(31×60 - 8×30)= 648 cents if you are subject C11
Summary
n This experiment involves 4 subjects and consists of 5 periods of 10 minutes each. There are two types of subjects referred to as B and C, respectively.
n 3 subjects will be subjects B and one will be subject C.
n In each period, both subjects B and subject C will be able to: sum up numbers in a table or browse the web.
n Only subjects B will be able to exaggerate their production and contribution as observed by subject C by using the boost option.
n Only subject C will be able to monitor other subjects.

Chapter II: Influence costs
- 122 -
n Your individual earnings will depend on the task which consists in summing up
numbers in a table.
n The total earnings generated by all 4 subjects (subject C + 3 subjects B) on the task will be divided as follows.
n At the end of each period, subject C always gets 40% of the total amount of money generated by all 4 subjects (C subject + 3 B subjects) and decides how to allocate the remaining 60% among the 3 subjects B.

- 124 -
Chapter III: On the impact of technology-based
monitoring on workers’ behavior: An experimental
investigation23
23 This chapter has given rise to a paper entitled Surveillance informatique versus surveillance classique : une
expérience d’effort réel with Brice Corgnet, Ludivine Martin and Angela Sutan. This paper which has been accepted in the Revue économique contains some sections that we did not have opportunities to include in this chapter.

Chapter III: IT monitoring
- 125 -
III1. Introduction
The introduction of Information and Communication Technologies (ICT) at workplace has
generated new ways to create, collect and share information as well as a growing use of
technological tools by firms to monitor employees (Ariss, 2002; Bloom et al., 2014; West and
Bowman, 2014). According to the American Management Association study (AMA, 2007),
73% of US organizations have engaged on technology monitoring. Indeed, the advancement
in ICT has led to the ease of the monitoring of employees by technologies (Ariss, 2002; Alder
and Ambrose, 2005; Sarpong and Rees, 2014; West and Bowman, 2014). The technology-
based monitoring system (IT monitoring) allows firms to automatically record indicators of
employees’ effort and performance (Aral et al., 2012; Bloom et al., 2014; Gallie et al., 2001).
Therefore, managers can easily access this performance data for rewarding or for sanctioning
employees.
Although more than 80% of organizations inform employees that they monitor keystrokes,
time spent on keyboard and review computer files, at least 28% of employers have fired
workers for e-mail and internet misuses (AMA, 2007). One can think that employees are not
really aware of the extent of the technology-based monitoring system (Ariss, 2002). These
misuses of computer systems and technology resources have a negative impact on
productivity of the firm (Koch and Nafziger, 2015). According to Sarpong and Rees (2014),
the misuse of e-mail by employees accounts more than $2 billion in losses annually. A better
understanding of how technology monitoring affects workers’ performance might be useful to
minimize the misuse of technologies at work and make workers perform at their peak. The
purpose of this chapter is to investigate in lab how technologies monitoring affect the
workers’ behaviors.
Organizational changes due to ICT have considerably led firms to use technologies for their
protection but also for the monitoring of the firm’s production (Sarpong and Rees, 2014).
Consequently, managers have access to a new way to monitor employees’ performance thanks
to technological advances in technologies. Indeed, the use of technologies to monitor
workers’ performance is not new but the technology monitoring system is ever more
sophisticated and still in constant innovation (Sarpong and Rees, 2014; West and Bowman,
2014). Software like ERP (Enterprise Resource Planning) or CPM (Computer Monitoring
performance) continuously and instantaneously keep details about workers’ attendance (log-in
account), time coded log of all activities performed from their computer terminal, time and

Chapter III: IT monitoring
- 126 -
length of time website visited, overtime, and break time (Ariss, 2002; Alder and Ambrose,
2005; Pierce et al. 2015; West and Bowman, 2014). More precisely, “…any action performed
on a company computer may subject to monitoring even if it is not transmitted over a network
nor stored in a file” (Ariss, 2002, p.554).
The technology-based monitoring provides a heightened transparency of the work process and
instant availability of employees’ performance indicators (Sarpong and Rees, 2014). Thereby,
reliable and fair information on employees’ productivity generated by technology monitoring
is objective for both employees and managers to reward their performance. However, some
studies on organizational changes shed light on the potential of the ICT to produce serious
stress and health problems (Ariss, 2002; Aubert et al., 2004; Alder and Ambrose, 2005;
Sarpong and Rees, 2014). Employees often feel stressed, and distrusted because their privacy
is violated by being closely monitored (Ariss, 2002). The technology monitoring invades
worker privacy, increases work pressure, creates an atmosphere of mistrust, and undermines
employees’ loyalty (Alder and Ambrose, 2005).
Therefore, the IT monitoring system could negatively impact workers’ performance and
consequently the productivity of the firm. According to Falk and Kosfeld (2006), the decision
to control agents significantly reduces their willingness to act in the principal’s interest if they
believe that their employer mistrusts them. If agents perceive they have become ‘pawns’ of
the principal, they reciprocate by reducing their effort: this is known as the crowding out
effect (Deci, 1975; Fehr and Gächter, 2001; Frey, 1993; Frey and Oberholzer-Gee, 1997; Van
Herpen and al., 2005). So, the invasive and pervasive monitoring system led by the advance in
technologies could fail to increase agents’ effort and reduce shirking behaviors at the
workplace.
The investigation of the technology-based monitoring system is also interesting since
evidence suggests that firms should promote the use of technologies which provide greater
information access to agents (Black and Lynch, 2001; Bresnahan et al., 2002; Brynjolfsson
and Hitt, 2000; Garicano, 2000; Garicano and Rossi-Hansberg, 2006; Bloom et al., 2014);
while influence costs theory assumes that agents will not perform at their peak because they
will waste time by trying to manipulate information as a device to influence the manager’s
decision (Milgrom 1988; Milgrom and Roberts, 1988, 1990b). Individuals who have
opportunities to cheat can create the impression that they are the best performers instead of
actual hard work (Carpenter et al., 2010). This willingness to manipulate information will lead

Chapter III: IT monitoring
- 127 -
to substantial costs for the firm (Milgrom 1988; Milgrom and Roberts, 1988, 1990b; Schaefer,
1998; Corgnet and Rodriguez-Lara, 2013; Inderst et al., 2005). So, technologies that allow
more autonomy for agents may entail a costly loss of control for the principal since agents and
the principal’s interests are not perfectly aligned (Acemoglu et al., 2007). Nevertheless, the
implementation of ICT at the workplace has enabled more agility for agents to make
autonomous decisions as well as a higher control by the principal and (Bloom et al., 2014).
Therefore, the firm may not face a tradeoff between loss of control by the principal and more
autonomy for the agent (Aghion and Tirole, 1997) by taking advantage of the IT monitoring.
This is consistent with the agency theory which states that agents will not perform at their
peak without constant monitoring. In fact, monitoring is effective to increase agents’ effort
and productivity because they will work hard to avoid the sanction if they get caught shirking:
this is known as the disciplining effect (Alchian and Demsetz, 1972; Calvo and Wellisz, 1978;
Dickinson and Villeval, 2008; Jung, 2014; Nagin et al., 2002; Prendergast, 1999). Therefore,
the technology-based monitoring system could be effective to increase agents’ effort and
reduce shirking behaviors at the workplace. The monitoring software may also be crucial
since some technologies devices provide several leisure options like games or internet access
to social networks which could lead the agent to misbehave at workplace (West and Bowman,
2014). Schnedler and Vadovic (2011) reported that about 78% of agents accessed the internet
for unproductive purposes such as personal use or entertainment while at work according to
the 2005 Internet Usage Study. Despite the fact that every employee signs the IT charter of
the hiring firm, some cases of firing because of internet abuse or misuse suggest that they are
unaware about the extent of the technology monitoring system24.
So far, existing literature on the impact of the technology monitoring on workers suggests that
this monitoring system is neutral and offers a profitable situation for both managers and
workers since it is embedded in ICT (Alder and Ambrose, 2005; Sarpong and Rees, 2014;
West and Bowman, 2014). Indeed, IT monitoring allows managers to evaluate more easily
agents’ performance; therefore, they could detect shirking behaviors more effortlessly. On the
employees’ side, IT monitoring might not lead to stressful conditions since it is embedded in
the technology tool. So, this monitoring system could overcome the constraints of traditional
monitoring and decrease the hidden costs of monitoring. However, Pierce et al. (2015)
24Engel, (2010) reports a story of Toquir Choudhri, a 14-year veteran worker of the New York City Department of Education who got fired for using the internet for personal matters.

Chapter III: IT monitoring
- 128 -
showed that the technology monitoring is likely to reduce cheating behaviors and to improve
workers’ productivity. This finding is inconsistent with the idea that stressful conditions due
to IT monitoring will lead workers to decrease their effort. So, the technology-based
monitoring may have several effects which could generate opposite results. So, some
questions arise as: how IT monitoring impacts workers’ behaviors? What is the overall effect
of technology monitoring on workers’ productivity?
Our main contributions to the literature are twofold. First, we investigate the technology
monitoring on the lab. Second, we investigate monitoring in setting with three activities that
workers can undertake in a real workplace environment to disentangle the effect of IT
monitoring on working, cheating and web browsing activities. Existing experimental studies
on monitoring focused on the control of the output by the principal and designed the
monitoring system as a probability or a frequency chosen by the principal to audit agents’
output (Dickinson and Villeval, 2008; Engel, 2010; Jung, 2014; Nagin et al., 2002). Thereby,
the agent performs the task after being informed about this monitoring rate, there is no
monitoring while the task is being performed and only the output is monitored. The agent
perceives the monitoring level as a signal of trust or distrust and reciprocates. During the
experiment, the principal does not have any information about activities undertaken by the
agent. Although firms resort to IT monitoring which provides detailed information about
workers’ activities, this form of monitoring has not hitherto been studied in the literature.
Unlike previous experiments which study the impact of monitoring, our experimental design
embeds both real leisure and cheating alternatives into the workplace environment.
The aim of this chapter is to use a controlled laboratory experiment to analyze the impact of
the technology-based monitoring on agents’ behaviors through working, web browsing and
cheating activities. While principal behavior is largely neglected in existing literature, we also
investigate how the principal’s behavior is impacted by the IT monitoring system. For this
purpose, we conducted an experiment using virtual organization that includes on-the-job
shirking activities into the work environment (Corgnet et al., 2014). This software enables us
to introduce a real-effort work task (e.g. Dohmen and Falk, 2011; Eriksson et al., 2009;
Niederle and Vesterlund, 2007) as well as technology monitoring and real-time access to
leisure and cheating activities. We design a workplace environment which consists of
organizations with one principal and three agents which can simultaneously complete a work
task and browse the internet. Only agents are allowed to falsely increase their level of
production as observed by the principal (cheating activity). Depending on the treatment, the

Chapter III: IT monitoring
- 129 -
principal could monitor agents’ level of production only (Traditional monitoring) or all
agents’ activities on top of their production level (IT monitoring). We conducted a 2x2 design
in which we varied the monitoring system and the payment scheme (equal pay or
discretionary pay). The discretionary pay is an incentive since the principal can reward
(punish) agents according his discretion by allowing a higher (lower) pays.
According to previous experimental studies, we find that the IT monitoring system also
implies a disciplining effect as agents on IT monitoring treatments are more productive and
spend less time on cheating activity compared to agents on treatments without IT monitoring.
However, the disciplining effect of IT monitoring is evanescent since the workers’
productivity which was 11.42% higher on average during the first three periods in the
treatment with IT monitoring compared to the treatment without, decreased to 2.5% the last
two periods under discretionary pay. Also, agents on IT monitoring treatment cheated less
during the first three periods and more for the last two periods compared to agents on
treatment without IT monitoring when the sanction was available. Unexpectedly, we also find
that the average time spent by agents on the internet was 97.67% higher in treatment with IT
monitoring than the time devoted to this activity by agents on treatment without IT monitoring
when the sanction was unavailable. Nevertheless, these agents were more productive on
average than agents in others treatments. This result is consistent with the finding of Koch and
Nafziger, (2015) and Martin and Omrani, (2015) that workers are willing to work harder when
internet access is available without any sanction for using it. The remainder of the chapter is
structured as follows: Section 2 presents our behavioral hypotheses. Section 3 describes the
software that we used and the experimental design. Results of the experiment are presented in
section 4. Section 5 concludes.
III2. Behavioral hypotheses
The aim of this chapter is to investigate the effect of the technology-based monitoring on
agents and principals’ behaviors. We derive our behavioral hypotheses from the agency theory
and the literature on the technology-based monitoring. We put forward hypotheses based on
working, cheating and leisure activities that workers can undertake at the workplace. We also
formulate hypotheses about time spent by principals on monitoring activity and principals’
production.
Chapter III: IT monitoring
- 130 -
III2.1. Agents’ behaviors
We are interested on how the IT monitoring system affects agents’ willingness to work, cheat
or browse the web at the workplace. Contrary to a monitoring system in which only the
agents’ outputs are audited, this monitoring system provides detailed information about
agents’ activities. We expect that both monitoring systems may lead to the disciplining effect.
We also expect that this effect should be more pronounced under IT monitoring system,
particularly when the sanction is available.
III2.1.1. Working activity
According to Frey (1993) and Falk and Kosfeld (2006), the principal’s decision to tightly
monitor agents can be perceived as a signal of distrust and may be counterproductive. But,
evidence suggests that the disciplining effect occurs when the principal’s monitoring is
considered legitimate by agents (Schnedler and Vadovic, 2011; Dickinson and Villeval, 2008;
Nagin et al., 2002). The fact that the IT monitoring is embedded in the computer-based
systems of the firm may legitimize its use by the principal. Also, agents might not feel
stressed and distrusted since the technology-based monitoring is invisible (Alder and
Ambrose, 2005; Sarpong and Rees, 2014; West and Bowman, 2014). According to the agency
theory literature, the principal’s monitoring should lead agents to raise their level of effort to
avoid the sanction resulting from counterproductive behaviors (Calvo and Wellisz, 1978).
Consequently, the disciplining effect should be more pronounced when the sanction is
available. Because agents know that all their activities are monitored, the IT monitoring
should be more effective to discipline agents than the monitoring system in which only the
agents’ outputs are monitored. We formulated our hypotheses as follow:
Hypothesis 1: We expect that agents will be more productive and will spend more time on
working in presence of IT monitoring. The disciplining effect will be more pronounced in the
presence of the sanction.
III2.1.2. Cheating activity
According to Carpenter et al. (2010), employees are able to create the impression that they are
the best performers instead of working hard for rent-seeking concerns. Nagin et al. (2002)
showed that agents are more likely to engage in cheating behavior when it is hard to detect.
The IT monitoring system is more effective to reduce cheating (Pierce et al., 2015). Since the

Chapter III: IT monitoring
- 131 -
monitoring software provides detailed information about agents’ activities, agents may be less
willing to cheat in presence of this monitoring system. Also, when the principal only monitors
agents’ outputs, it can be hard to detect cheating. We also suggest that if agents are punished
because of cheating, they will work harder at the following period.
Hypothesis 2: We expect that: i) Agents will cheat less in presence of IT monitoring. ii)
Sanctioned cheaters will be more productive at the next period.
III2.1.3. Leisure activity
Numerous leisure activities exist at the workplace, e.g. coffee and cigarette breaks, personal
calls. Some technological devices also provide options like games or internet access which
could lead the agent to misbehave at the workplace. Individuals spend time on browsing the
web when internet access is available (Corgnet et al., 2014). Schnedler and Vadovic (2011)
reported findings of the Internet Usage Study of 2005 which show that about 78% of
employees browse the web for unproductive purposes such as personal use or entertainment
during working time. So, agents will spend time on leisure activities regardless the monitoring
system. But, if they know that all their activities are monitored, they may spend less time on
leisure compared to the situation in which only outputs are monitored.
Hypothesis 3: We expect that agents will spend less time on leisure activity in presence of IT
monitoring compared to when IT monitoring will be unavailable.
III2.2. Principal’s behaviors: monitoring and working
The monitoring is costly for the principal (Dickinson and Villeval, 2008). Nevertheless, the
technology-based monitoring eased the detection of shirking behaviors. Consequently, the
principal may devote a larger portion of time on monitoring activity if they can monitor all
agents ‘activities. Moreover, if the principal has a discretionary power regarding agents’ pay,
they will be more willing to collect the right information for decision making. This may
negatively affect their level of production. The monitoring software enables principals to
clearly know if a given agent is working or cheating. So, principals may be less productive in
presence of IT monitoring.
Hypothesis 4: We expect that principals will spend more time to monitor agents and may be
less productive in presence of IT monitoring. This effect should be more pronounced whether
they are able to sanction agents or not.

Chapter III: IT monitoring
- 132 -
III3. Experimental design
We used the virtual organization software (Corgnet et al., 2014) to run our experiment. This
software enabled us to reproduce some relevant features of a real work setting. The virtual
organization software also allowed us to record time spent by participants on each activity
that they are able to undertake and how many times they switch from one activity to other.
We designed organizations with one principal denoted Subject C and three agents denoted
Subjects B. Participants learned about their role at the beginning of the experiment and kept
the same role and the same partners that they were randomly assigned and matched for the
whole duration of the experiment.
III3.1. Design of the activities
Our experimental design allowed participants to undertake three different activities separately
in a screen by choosing the corresponding option from a drop-down menu at the bottom-right
of their screen. These activities25 consisted of a real effort task (work task) in a limited time
and browsing the internet (leisure activity) that all participants can undertake by clicking on
the Task or Internet options respectively. Agents had an additional activity that consisted of
increasing their level of production artificially (cheating activity)26 by using the boost option,
while the principal was able to monitor agents’ activities (monitoring activity) by using the
watch option. These activities are described in detail below.
III3.1.1. The work task
The task is a long, repetitive and effortful one (Dohmen and Falk, 2011; Ericksson et al.,
2009; Niederle and Vesterlund, 2007). This task was designed to reduce as much as possible
the intrinsic motivation derived from performing the task just for its sake (Corgnet et al.,
2014). Participants had to sum up several tables of 36 numbers without using pens, scratch
paper, calculators or any other electronic devices. Each table had six rows and six columns of
randomly-generated integers between zero and three. Before providing the final answer in the
bottom-right cell, participants had to provide a separate subtotal for all of the 6 columns. Each
correct completed table provided 60 cents of individual production while 30 cents were
25 These activities are similar to those activities in the experimental design of chapter II. We set up a new monitoring system which is the added value in this chapter. 26 This activity is the same that the influence activities in chapter II.
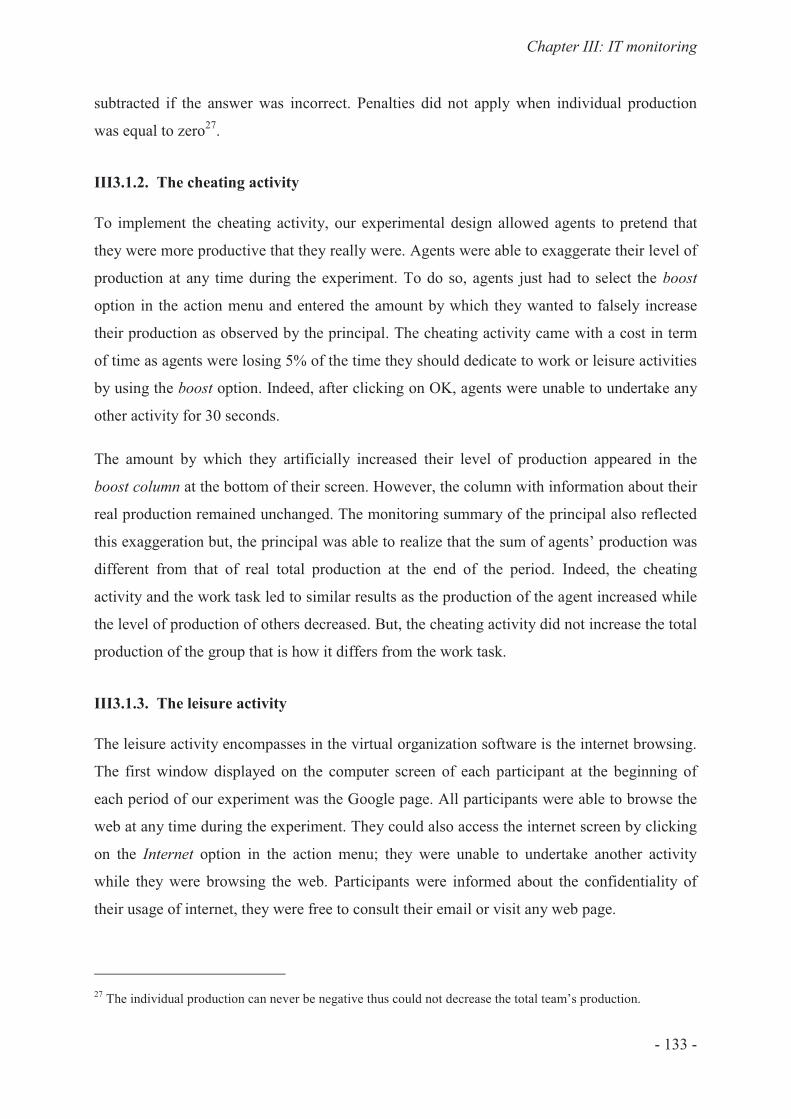
Chapter III: IT monitoring
- 133 -
subtracted if the answer was incorrect. Penalties did not apply when individual production
was equal to zero27.
III3.1.2. The cheating activity
To implement the cheating activity, our experimental design allowed agents to pretend that
they were more productive that they really were. Agents were able to exaggerate their level of
production at any time during the experiment. To do so, agents just had to select the boost
option in the action menu and entered the amount by which they wanted to falsely increase
their production as observed by the principal. The cheating activity came with a cost in term
of time as agents were losing 5% of the time they should dedicate to work or leisure activities
by using the boost option. Indeed, after clicking on OK, agents were unable to undertake any
other activity for 30 seconds.
The amount by which they artificially increased their level of production appeared in the
boost column at the bottom of their screen. However, the column with information about their
real production remained unchanged. The monitoring summary of the principal also reflected
this exaggeration but, the principal was able to realize that the sum of agents’ production was
different from that of real total production at the end of the period. Indeed, the cheating
activity and the work task led to similar results as the production of the agent increased while
the level of production of others decreased. But, the cheating activity did not increase the total
production of the group that is how it differs from the work task.
III3.1.3. The leisure activity
The leisure activity encompasses in the virtual organization software is the internet browsing.
The first window displayed on the computer screen of each participant at the beginning of
each period of our experiment was the Google page. All participants were able to browse the
web at any time during the experiment. They could also access the internet screen by clicking
on the Internet option in the action menu; they were unable to undertake another activity
while they were browsing the web. Participants were informed about the confidentiality of
their usage of internet, they were free to consult their email or visit any web page.
27 The individual production can never be negative thus could not decrease the total team’s production.

Chapter III: IT monitoring
- 134 -
III3.1.4. The monitoring activity
The experimental design of this chapter differs from that of chapter 2 by the new monitoring
system that we set up. Indeed, there were two types of monitoring systems in this design: the
traditional monitoring and the technology-based monitoring (IT monitoring). The traditional
monitoring system was similar to the monitoring system used in previous experimental
studies as the principal was only able to monitor agents’ outputs (Dickinson and Villeval,
2008; Engel, 2010; Jung, 2014; Nagin et al., 2002). The IT monitoring system collected and
recorded information about all activities undertook by each agent at any time during the
experiment when the principal used the watch option. In both monitoring systems, the
principal was informed in real time of agents’ production in cents and of their relative
production to the total production of the organization in terms of percentage. However, the
principal was able to monitor all subjects’ activities at the same time with the IT monitoring
system only. So, the principal with the IT monitoring was informed in real time of the activity
undertaken by all agents and also when they switched from one activity to another at any time
(see Figure III. 1).
Figure III. 1: Example of principals’ screen for IT monitoring and Traditional monitoring

Chapter III: IT monitoring
- 135 -
As the consequence of the IT monitoring system, the principal was distinctly able to know if a
given agent was cheating or browsing the web by observing agents on real time. The principal
was also able to deduce the amount by which the agent had falsely increased his level of
production. Conversely, the principal with the traditional monitoring system was able to
detect the cheating activity only if a given agent was entering an amount different of 60 by
monitoring agents on real time. By reading the monitoring summary at the end of the period,
the principal with both monitoring systems was able to deduce if someone increased his level
of production when the individual production was not a multiple of 30 with28. Nevertheless,
the principal was unable to know which one(s) exaggerated his observed production and by
which figures if he didn’t monitor them on real time.
III3.2. Treatments
We ran a 2 x 2 experimental design resulting in four treatments (see Table III.1). Reward
systems and monitoring systems were the parameters which varied between treatments. Our
experimental design allowed for the same payment schemes of chapter 2. The principal was
still rewarded 40% of the total production regardless the payment scheme while agents
received the remaining 60% of the total production. In the equal pay reward system, each
agent received 20% of the total production at the end of each period. The principal decided
how to allocate the whole remaining 60% of total production among the three agents29 at the
end of each period in the discretionary pay reward system. Each agent was informed of his
pay, once the principal validated the percentage allocated to him at the end of each period.
The principal in the discretionary pay reward system was able to mimic the equal pay reward
system by giving 20% of the total production to each agent.
The baseline treatment named TMDP treatment implemented the traditional monitoring and
discretionary pay. The TMEP treatment (traditional monitoring + equal pay) was the second
treatment. These two treatments were similar to Influence treatments in chapter 2. The third
treatment, ITDP treatment (IT monitoring + discretionary pay) was similar to the first one but
differed from the motoring system. The ITEP treatment (IT monitoring + equal pay) was the
28 Each correct answer generates 60 cents of individual production while 30 cents is subtracted from individual production for each incorrect answer. So, by cheating with an amount equals to 60 or multiple of 30, agents may not be caught by the principal. 29Each subject B can receive a different or a same percentage of the total production according to the discretion of subject C.

Chapter III: IT monitoring
- 136 -
last treatment. We will refer to treatments with IT monitoring system and discretionary pay as
IT treatments and discretionary treatments respectively. The figure below summarizes these
treatments.
Table III. 1: Summary of treatments
III3.3. Experimental procedures
Our experiment took place at the laboratory of the Economic Science Institute (ESI) at
Chapman University in the city of Orange (California). A total of 248 students (52.42%
females) divided in 62 organizations of 4 individuals each participated to this experiment. We
conducted 24 sessions in spring 2014. Each session lasted almost one hour and half with 5
periods of 10 minutes. The whole experiment consisted of three stages. The first stage was the
summation skills test, participants were asked to sum as many five one-digit numbers as they
could during two minutes. Each correct answer was rewarded 10 cents and the total earnings
of this stage were added to the individual earnings of participants at the end of the experiment.
The number of correct answers of each participant at this stage is what we will refer to as
Ability in our regressions.
The second stage was the instructions round; the instructions were displayed on participants’
computer screens. Participants had 20 minutes to read the instructions carefully on the
computer screen. A timer that indicated the remaining time to read the instructions was
displayed on the laboratory screen. A printed copy of the summary of instructions was given
to each subject, two minutes before the end of the instructions round. The instructions file was
closed after the countdown was finished. We have to notice that participants have finished
reading the instructions in less than 20 minutes. Participants were able to require assistance if
they had any questions during the instructions round or if any difficulties arose after the
experiment had begun, but none of them asked questions. In the third stage, participants were
Treatments
(Numbers of participants )
Reward systems
Equal pay Discretionary pay
traditional monitoring TMEP (64) TMDP (64)
IT monitoring ITEP (60) ITDP (60)

Chapter III: IT monitoring
- 137 -
able to undertake one of the three activities mentioned above. Participants learned about their
role in this stage.
The individual earnings were computed as the sum of the earnings for five periods added up
to the earnings of the summation skills stage. The exact amount of individual earnings in
dollars for a given period was displayed in a pop-up window at the end of the period.
Participants were able to access information about their earnings of previous periods through
the history table on their screen at any time during the experiment. Regardless their role,
participants earned on average $26.5 including a show-up fee of $7.
Table III. 2: Summary of the experimental design
248 participants were matched in organization of 4 members : one
principal and three agents
Treatments ITEP TMEP ITDP TMDP
Parameters Equal pay Discretionary pay
IT monitoring TM monitoring IT monitoring TM monitoring
First stage Summation skills test
Second stage Session ( 5 periods of 10 minutes each)
Third stage Allocation stage (at the end of each session)
Payment of participants
III4. Results
We start this section by presenting descriptive statistics on how agents devoted their time
among shirking activities across treatments; we also report p-values for significance tests
(clustered version of the Wilcoxon rank-sum test) on the observed mean differences. The
second part of this section presents an econometric analysis of the impact of IT monitoring
system on agents’ and principals’ behaviors towards working, leisure, cheating and
×

Chapter III: IT monitoring
- 138 -
monitoring activities. We use linear panel regressions with random effects and clustered
standard errors at the organization level to analyze our data. This allowed us to take into
account the fact that the performance of subjects in the same team may be correlated. We
consider a total of 300 observations (60 participants ´ 5 periods) for each of the IT treatments
and 320 observations (64 participants ´ 5 periods) for each treatment without IT monitoring.
Three fourths of these observations correspond to data on agents while the remaining
observations correspond to principals.
III4.1. Descriptive statistics
We present descriptive statistics for cheating and leisure activities regarding 90 agents of IT
treatments and 96 agents of treatments without IT monitoring across the five periods. The
software we used enabled us to collect data about the time dedicated by each participant on
each activity. We report the average proportion of time spent (in percentage) by agents on
each of shirking activities per period and per treatment.
Figure III. 2: Time dedication by agents on shirking activities per treatments
Descriptive statistics show that the time spent by agents on cheating activity is lower in
treatments with IT monitoring compared to treatments without. Under discretionary (equal)
pay, agents allocated on average 3.88% (2.53%) of their time to cheating activity in presence
of IT monitoring compared to 5.66% (3.69%) when IT monitoring was unavailable.
Nevertheless, these differences are not statistically significant. In line with hypothesis 2, a
lower proportion of agents (40.22%) engaged at least once on cheating activity when IT
Equal pay
Discretionary pay
3.71
5.66
2.31
3.88
2.58
3.69
5.10
2.53
02
46
81
0
TMDP ITDP TMEP ITEP
cheating leisure

Chapter III: IT monitoring
- 139 -
monitoring was available compared to 45.83% in absence of IT monitoring (proportion test, p-
value = 0.08)30.
The time spent by agents on leisure activity is also lower in presence of IT monitoring than
the time spent on this activity when it is unavailable, but only under discretionary pay.
Surprisingly and in contrast with our hypothesis 3, a higher proportion of agents (21.11%)
browsed the web at least once in IT treatments compared to 15% in treatments without IT
monitoring (proportion test, p-value = 0.02). However, the proportion of agents who browsed
the web at least once is equal to 17.77% in treatment with IT monitoring compared to 17.50%
in treatment without under discretionary pay (proportion test, p-value = 0.47). Indeed, under
equal pay, 24.44% of agents engaged at least once on leisure activity in treatment with IT
monitoring compared to 12.5% in treatment without IT monitoring (proportion test, p-value =
0.001). The time spent by agents on leisure activity in treatment with IT monitoring is about
twofold higher compared to the time spent on this activity by agents in treatment without
under equal pay31. This difference is statistically significant (z = -1.73, p = 0.08). This result
shows that IT monitoring may have different effects according to the availability of the
sanction. When the sanction is available, agents spend less time on internet because they
could get caught and punished in the meantime. Nevertheless, when the sanction is
unavailable, they are more willing to spend time on internet even if they could get caught.
Another interesting finding is that agents in treatment with IT monitoring and equal pay who
spend more time on internet are more productive compared to agents on other treatments32. It
seems that employees are more willing to perform at their peak when they could enjoy
internet. This finding is consistent with recent evidence showing that agents are willing to
work harder when they have internet access without any sanction for using it (Koch and
Nafziger, 2015; Martin and Omrani, 2015). In absence of IT monitoring, we also surprisingly
observe that agents spent more time on cheating activity than on leisure activity (3.69% >
2.58%) under equal pay. It is surprising because agents may enjoy browsing the web rather
30 The effect of IT monitoring is more pronounced under discretionary pay, 43.55% of agents engaged at least once on cheating activity when IT monitoring was available compared to 55.42% in absence of IT monitoring (proportion test, p-value = 0.01). 31 Agents on treatment with the IT monitoring system devoted more than 5% of their time on average to browse the internet under equal pay. 32 Agents on ITEP treatment produced on average 503.47 > 500.67 (ITDP) > 497.63(TMEP) > 459.25(TMDP) however, they devoted less time on productive activity (91.87 %) than agents on TMEP (93.36%) and ITDP (93.73%) only. So they produced more than others by spending less time on working activity than they do.

Chapter III: IT monitoring
- 140 -
than waste time on cheating activity since there are no incentives to cheat. It may be due to
their curiosity or/and the demand effect may also explain this result (Corgnet et al., 2015).
III4.2. Econometric results
We report regression estimates for the impact of the IT monitoring on agents’ and principals’
behaviors. We create dummy variables IT treatments and discretionary treatments that take
value one if a given participant was involved on treatments with IT monitoring or treatments
with discretionary pay or zero otherwise. The production is defined as the total number of
correct tables completed by a given participant discounted by the number of incorrect tables.
We also include a proxy of participants’ summation skills named Ability. This variable refers
to the results of the summing up of five one-digit numbers during two minutes that
participants were asked for before reading the instructions.
III4.2.1. Working activity
Table III.3 presents the results of five panels for regressions which analyze the effect of IT
monitoring on agents’ behaviors regarding the working activity. To assess the impact of IT
monitoring on agents’ performance, we create the variable Productivity. This variable is
computed as the percentage of correct tables on total tables completed by a given agent. We
define the variable "Working_time" as the time devoted by agents to working activity.
The first two models of Table III.3 are related to agents’ productivity in discretionary
treatments for the first three and the last two periods respectively. Under discretionary pay,
the productivity is higher in the treatment with IT monitoring compared to treatment without
(see dummy IT treatments in columns [1] and [2]). The relationship between IT monitoring
dummy and agents’ productivity is higher and significant for the first three periods only.
Indeed, agents’ productivity was 11.42% higher on average in the treatment with IT
monitoring than in treatment without for these periods (z = -2.6, p = 0.04). During the last two
periods, the productivity was also higher in the treatment with IT monitoring compared to
treatment without, but the difference decreased to 2.5% (z = -0.9, p = 0.32). This result is
consistent with our hypothesis 1. We observe that the relationship between the productivity
and the variable Ability is positive for the first three periods and negative for the last two
periods. It seems that agents’ ability was not driving their performance during the second part
of the experiment.
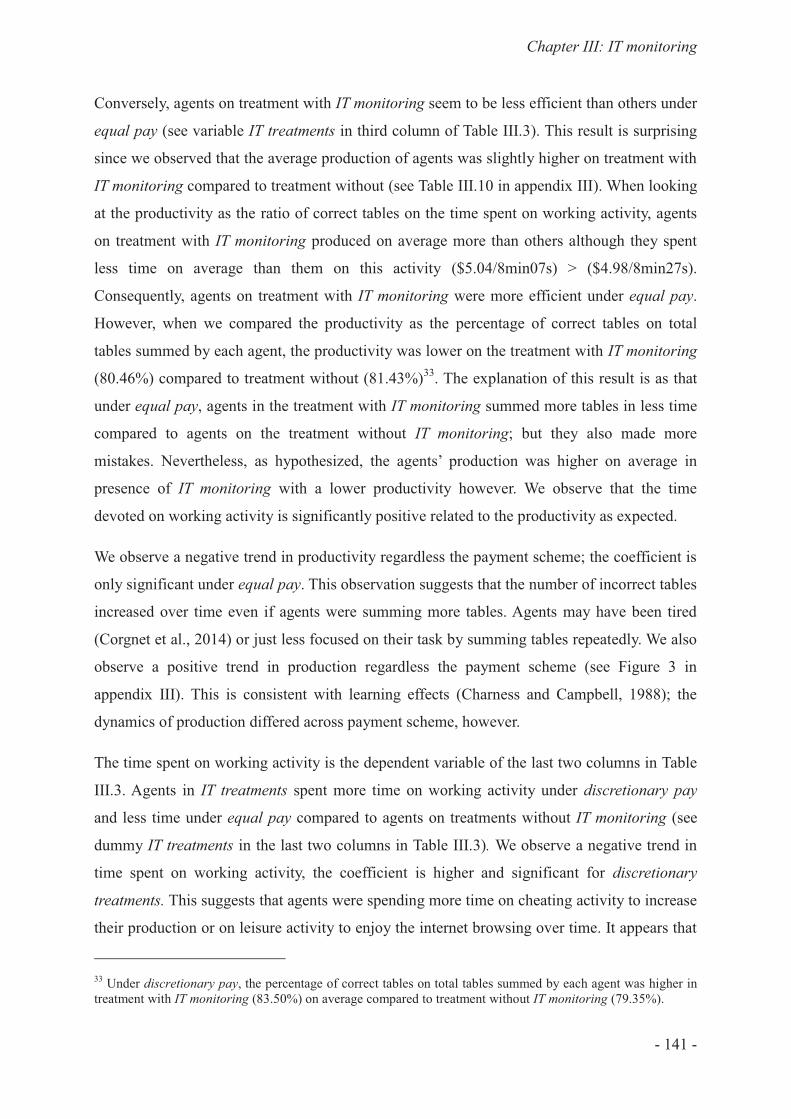
Chapter III: IT monitoring
- 141 -
Conversely, agents on treatment with IT monitoring seem to be less efficient than others under
equal pay (see variable IT treatments in third column of Table III.3). This result is surprising
since we observed that the average production of agents was slightly higher on treatment with
IT monitoring compared to treatment without (see Table III.10 in appendix III). When looking
at the productivity as the ratio of correct tables on the time spent on working activity, agents
on treatment with IT monitoring produced on average more than others although they spent
less time on average than them on this activity ($5.04/8min07s) > ($4.98/8min27s).
Consequently, agents on treatment with IT monitoring were more efficient under equal pay.
However, when we compared the productivity as the percentage of correct tables on total
tables summed by each agent, the productivity was lower on the treatment with IT monitoring
(80.46%) compared to treatment without (81.43%)33. The explanation of this result is as that
under equal pay, agents in the treatment with IT monitoring summed more tables in less time
compared to agents on the treatment without IT monitoring; but they also made more
mistakes. Nevertheless, as hypothesized, the agents’ production was higher on average in
presence of IT monitoring with a lower productivity however. We observe that the time
devoted on working activity is significantly positive related to the productivity as expected.
We observe a negative trend in productivity regardless the payment scheme; the coefficient is
only significant under equal pay. This observation suggests that the number of incorrect tables
increased over time even if agents were summing more tables. Agents may have been tired
(Corgnet et al., 2014) or just less focused on their task by summing tables repeatedly. We also
observe a positive trend in production regardless the payment scheme (see Figure 3 in
appendix III). This is consistent with learning effects (Charness and Campbell, 1988); the
dynamics of production differed across payment scheme, however.
The time spent on working activity is the dependent variable of the last two columns in Table
III.3. Agents in IT treatments spent more time on working activity under discretionary pay
and less time under equal pay compared to agents on treatments without IT monitoring (see
dummy IT treatments in the last two columns in Table III.3). We observe a negative trend in
time spent on working activity, the coefficient is higher and significant for discretionary
treatments. This suggests that agents were spending more time on cheating activity to increase
their production or on leisure activity to enjoy the internet browsing over time. It appears that
33 Under discretionary pay, the percentage of correct tables on total tables summed by each agent was higher in treatment with IT monitoring (83.50%) on average compared to treatment without IT monitoring (79.35%).

Chapter III: IT monitoring
- 142 -
the positive effect of IT monitoring was lower over time. The relationship between the
variable working_time and the agents’ ability is negative regardless the payment scheme; the
coefficients are higher and significant for discretionary treatments.
Table III. 3: Linear panel regression assessing the impact of the IT monitoring on agents’ behavior for working activity.
We decide to deeply examine results about the agents’ ability by performing 4 regressions
reported on Table III.10 (see appendix III). We create the variable Low_Ability which takes
the value one if the production of a given agent at the summation skills stage was in the
bottom 30% of the distribution or zero otherwise. The dependent variable of the first two
columns in Table III.10 is the agents’ production in IT treatments and treatments without IT
Productivity Working_time
Discretionary treatments Equal. Discretionary. Equal.
Periods 1-3 Periods 4-5 Periods 1-5 Periods 1-5 Periods 1-5
(1) (2) (3) (4) (5)
Working_time 0.09*** 0.06** 0.07***
(0.02) (0.03) (0.02)
IT treatments 4.28* 0.83 -0.38 1.87 -14.48
(2.48) (3.11) (2.61) (12.62) (11.77)
Trend -0.69 -1.75 -1.04*** -7.12** -3.21
(1.09) (1.64) (0.47) (3.14) (2.91)
Ability 0.38** -0.04 0.19 -2.29* -0.10
(0.18) (0.22) (0.15) (1.22) (0.88)
Male dummy -2.09 0.16 -0.61 -2.04 -9.11
(2.29) (2.61) (2.76) (10.67) (12.52)
Production 0.31*** 0.24***
(0.05) (0.04)
Constant 33.72*** 61.92*** 47.62*** 390.96*** 394.10***
(11.42) (15.48) (12.59) (23.16) (21.28)
Observations 279 186 465 465 465
Number of agents 93 93 93 93 93
Number of teams 31 31 31 31 31
R2 overall 0.226 0.250 0.179 0.370 0.335
Model test chi2 (5) 24.35*** 5.76 11.49** 83.78*** 92.04***
Notes: Estimation output using robust standard errors clustered at the team level (in parentheses). Coefficients * significant at 10%; ** significant at 5%; *** significant at 1%.

Chapter III: IT monitoring
- 143 -
monitoring respectively. This table also reports results from regressions with controls for low-
ability agents, agents’ production, trend and gender about the agents’ pay for discretionary
treatments. We can see that low-ability agents were more productive on IT treatments and
significantly less productive on treatments without IT monitoring (see variable Low_Ability in
the first two columns in Table III.10). Indeed, the production of low-ability agents was 7.77%
higher than the production of high-ability agents on IT treatments. On treatments without IT
monitoring, the production of low-ability agents was 37.57% lower than the production of
high-ability agents (z = 4.92, p = 0.000). It seems that IT monitoring led low-ability agents to
work harder, but we did not predict such a disciplining effect. The coefficient associated to the
relationship between pay and low ability dummy is positive and significant on IT treatments
and negative for treatments without IT monitoring. These findings suggest that low-ability
agents were more productive and more rewarded on IT treatments.
Our results are consistent with the evidence from previous experiments and suggest that the
two monitoring systems lead to a disciplining effect (Dickinson and Villeval, 2008; Nagin et
al., 2002; Engel, 2010). However, this effect is more pronounced under IT monitoring
system34. We showed that agents on IT treatments produced more than agents in treatments
without IT monitoring system. Also, regardless the payment scheme, there were less free-
riders35 in IT treatments (3.11%) compared to treatments when IT monitoring was not
available (3.95%). But, contrary to many of the results in lab experiments, we find that the
disciplining effect appears to be more pronounced in the first part of the experiment and under
discretionary pay only. This disciplining effect of the IT monitoring was mitigated under
equal pay since agents spent less time on working activity in presence of IT monitoring
compared to treatment without. Also, the proportion of free-riders was higher (4.44%) in
treatment with IT monitoring compared to treatment without (3.33%) under equal pay36.
These results are partly inconsistent with our hypothesis 1. It appears that the monitoring
system requires the imposition of the punishment to be more effective (Calvo and Wellisz,
1978). We summarize our findings related working activity as follows:
34We observe on Table III.2 that agents on IT monitoring treatments were more productive than others regardless the payment scheme ITEP (503.47) > TMEP (497.63) and ITDP (500.67) > TMDP (459.25). We notice that subjects in ITEP treatment were the best producers. 35 We define free-rider as the agent which spent less than 50% of his time on working activity. 36 The proportion of free-riders was lower (1.77%) in treatment with IT monitoring compared to treatment when IT monitoring was unavailable (4.58%) under discretionary pay (proportion test, p-value = 0.09).

Chapter III: IT monitoring
- 144 -
Results 1: Working activity
i) Agents in IT treatments were more productive and spent more time on working
activity than others under discretionary pay. This effect was more pronounced for
the first three periods.
ii) Agents in treatment with the IT monitoring were more productive but spend less
time on working activity than agents in treatment without IT monitoring.
iii) IT monitoring system led low ability skills agents to perform better than high
ability skills agents.
III4.2.2. Cheating activity
Next, we investigate the impact of IT monitoring on cheating activity for discretionary
treatments only. Remember that by using the boost option, agents were unable to undertake
another activity during 30 seconds but could artificially increase their production by one or
several tables at the same time. We examine the amount by which agents increased their
performance and the time they spent to cheat. We also analyze the pay received by cheaters
on treatment with discretionary pay and IT monitoring only37. We define variables
"cheating_time" and "cheating_amount" which respectively refer to the time spent by a given
agent on cheating activity and to the amount entered by agents to increase their apparent
production respectively. We also created the variable ''caught_cheating'' which takes the value
one if a given agent was caught while using the boost option or zero otherwise.
The effect of IT monitoring on agents’ behaviors under discretionary pay seems to change
over time (see dummy IT treatments of the first 2 columns in Table III.4). The fact that the
coefficient of IT treatments is positive and significant for the last two periods relates to the
fact that agents on treatment with IT monitoring cheated more than others at the second part of
the experiment. Indeed, for the first three periods, agents who used the boost option on IT
monitoring treatment increased their production by an amount equals to $1.16 on average
compared to $1.44 for agents on treatment without IT monitoring. Conversely, this average
amount was equal to $2.69 in treatment with IT monitoring compared to $1.68 in treatment
without IT monitoring for the last two periods. Figure III.4 (see appendix III) perfectly
reflects this change; these results are not significant however.
37 The principal was able to clearly detect a shirking behavior on ITDP treatment. So, we decide to study this treatment only.

Chapter III: IT monitoring
- 145 -
Table III. 4: Linear panel regression assessing the impact of IT monitoring on agents’ and principals’ behaviors regarding
cheating activity for discretionary treatments.
Cheating_amount Pay Production
Discretionary treatments ITDP Periods 1-3 Periods 4-5 Periods 1-5
(1) (2) (3) (4)
IT treatments -13.99 54.41*
(20.46) (32.78)
Cheating_time 2.20*** 2.34***
(0.19) (0.80)
Cheating_amount 0.01**
(0.01)
Production -0.03 -0.11 0.02***
(0.04) (0.09) (0.00)
Pay(t-1) 0.33 2.15* 7.03***
(0.79) (1.32) (1.26)
Trend 19.85* 6.62 -1.21*** 10.16
(12.04) (25.17) (0.24) (7.06)
Ability 1.69 2.18 -0.45** 4.01
(2.90) (4.52) (0.18) (5.36)
Male dummy -4.32 -18.04 1.04 -36.54
(19.11) (40.03) (1.61) (42.75)
Caught_cheating -12.24***
(3.89)
caught_cheating(t-1) 164.32***
(37.95)
Constant -46.16 -36.98 30.63*** 199.40**
(91.80) (156.84) (2.36) (90.42)
Observations 186 186 225 180 Number of agents 93 93 45 45
Number of teams 31 31 15 15
R2 overall 0.455 0.215 0.418 0.254
Model test chi2 175.54*** 18.20*** 92.68*** 64.43*** Notes: Estimation output using robust standard errors clustered at the team level (in parentheses). Coefficients * significant at 10%; ** significant at 5%; *** significant at 1%.

Chapter III: IT monitoring
- 146 -
We can notice that the amount by which agents increased their production was more than
twice as high during the two last periods in treatment with IT monitoring (compared to the
first three periods), and exceeded by $ 1.01 the amount in treatment without IT monitoring38.
This result echoes our finding that the disciplining effect of the IT monitoring is more
effective during the first periods. The relation between cheating_time and cheating_amount is
significantly positive; the coefficient is higher for the last two periods. This observation
supports the finding that agents cheated more during the last periods. As the results, the
relationship between the variable cheating_amount and the pay for previous period is higher
and significant for the last two periods. These results show the positive effects of cheating on
agents’ pay. However, we observe a positive trend in cheating_amount but the coefficient is
higher and only significant for the first three periods. It seems that as there was more cheating
during last periods, more agents were caught cheating since principals were clearly and easily
able to detect cheaters with IT monitoring. Consequently, the implementation of sanction by
principals (by allocating a lower pay) was dampening the agents’ willingness to cheat.
Results in the last two tables of Table III.4 provide support for this explanation. Indeed, the
cheating was punished by principals and agents caught on this activity produced more than
others after the sanction as predicted in our hypothesis 2ii (see dummies Caught_cheating and
L1.Caught_cheating in the last 2 columns of Table III.4). Actually, the average pay for agents
who got caught was equal to $2.35 compared to $3.99 for agents who did not get caught on
cheating activity. Nevertheless, the average production as observed by principals for agents
caught on cheating activity was higher ($7.29) compared to $6.36 for agents who were not
caught. So, agents caught on cheating activity received a lower pay than others although their
average production as observed by principals was higher. These results confirm that principals
punished cheating behavior by allocating a lower pay to agents. We notice that the proportion
of agents who get caught by using the boost option is equal to 12.24%. Production and
cheating_amount have a positive relation with pay; the relationship with production is higher
however. This shows that the incentive to cheat was not large enough to sidestep the positive
effect of IT monitoring. This observation also suggests that agents’ performance was more
profitable than cheating (see dummy pay(t-1) in the last column compared to first two columns
of Table III.4). We also observe a negative trend in pay; we suggest that principals offer
38 We notice that a lower proportion of agents (50%) cheated at least once in presence of IT monitoring compared to 62.5% of agents in treatment without IT monitoring for the last 2 periods (proportion test, p-value = 0.09).

Chapter III: IT monitoring
- 147 -
lower-powered incentives to decrease cheating behavior (Corgnet et al., 2015). The
relationship between agents’ ability and the pay is negative and significant (see dummy
Ability of the third column in Table III.4). This result supports the finding that low-ability
agents received a higher pay than others as we showed previously. We can conclude that IT
monitoring was useful to detect a cheating activity and to lead agents to work at their peak.
The IT monitoring is quite successful at reducing shirking (Engel, 2010) but, it could fail to
increase agents’ effort since its disciplining effect lessens over time.
Results 2: Cheating activity
i) Agents in IT treatments engaged less on cheating activity.
ii) The amount by which agents falsely increased their production was lower on
treatment with IT monitoring for the first periods only.
iii) For the last two periods, agents on IT monitoring treatment cheated more (amount)
than others under discretionary pay.
iv) The IT monitoring was useful to detect cheating behaviors and to lead agents to
increase their level of effort after the sanction.
III4.2.3. Leisure activity
The regressions in Table 5 provide the impact of IT monitoring on agents’ behaviors
regarding leisure activity. We create the variable Internet_time which refers to the time spent
on leisure activity by participants. We also create the variable "caught_internet" which takes
the value 1 if the subject got caught on internet (0 otherwise) in the treatment with IT
monitoring and discretionary pay. Results on the first two columns of the table below confirm
our findings in descriptive statistics (see dummy IT treatments in the first two columns of
Table III.5). The time spent by agents on leisure activity was lower on treatment with IT
monitoring compared to treatment without IT monitoring under discretionary pay. Agents
spent more time on leisure activity when IT monitoring was available compared to agents in
treatment when it was not under equal pay. As expected, the relationship between
Internet_time and time spent on others activities is negative; these coefficients are higher for
discretionary treatments. We also observe a positive trend in time spent on internet; however
the coefficient is higher and only significant for discretionary treatments. It appears that the
gap of time spent on internet between periods is higher on discretionary treatments. This may
suggest that the willingness to take a break increased since the task was effortful or simply

Chapter III: IT monitoring
- 148 -
agents were forgetting the extent of IT monitoring with time. The disciplining effect of the IT
monitoring is effective under discretionary pay only. We notice that 30% of agents were
getting caught while browsing the web.
Table III. 5: Linear panel regression assessing the time spent on internet by agents and agents’ pay in ITDP treatment.
The last panel regression of Table III.5 shows that the pay of agents which were got caught on
internet was lower compared to the pay of others in treatment with IT monitoring and
discretionary pay (see dummy Caught_internet in the last column of Table III.5).
Nevertheless, when looking at the production as observed by the principals, we observe that
agents’ production was 28.01% lower on average for agents who got caught on internet
Internet_time Pay
Discretionary. Equal. ITDP
(1) (2) (3)
IT treatments -0.39 10.72**
(4.50) (4.70)
Working_time -0.59*** -0.46***
(0.13) (0.09)
Cheating_time -0.68*** -0.36***
(0.13) (0.13)
Production 0.01 -0.00 0.02***
(0.01) (0.01) (0.00)
Trend 4.25** 2.61 -1.05***
(1.85) (2.18) (0.25)
Ability 0.07 -0.13 -0.42**
(0.51) (0.37) (0.19)
Male dummy 7.79 -3.11 1.59
(5.13) (3.51) (1.71)
Caught_internet -2.31
(2.75)
boostamount 0.01
(0.01)
Constant 295.41*** 241.81*** 29.22***
(60.23) (39.19) (3.02)
Observations 465 465 225 Number of agents 93 93 45
Number of teams 25 25 15
R2 overall 0.578 0.480 0.343
Model test chi2 (7/6) 53.26*** 88.54*** 42.14*** Notes: Estimation output using robust standard errors clustered at the team level (in parentheses). Coefficients * significant at 10%; ** significant at 5%; *** significant at 1%.

Chapter III: IT monitoring
- 149 -
compared to those who were not. Also, the actual production of agents who get caught by
using the Internet option was 38.75% lower on average compared to those who were not
caught. Consequently, agents caught on internet received a lower pay ($2.58) on average
compared than others ($3.72). These results are not significant however.
Results 3: Internet use
i) Agents in IT treatments spent less time on internet than others under discretionary
pay.
ii) Agents in IT treatments spent more time on internet than others under equal pay.
iii) Agents caught on internet were less productive and received a lower pay compared to
others in treatment with IT monitoring and discretionary pay.
The table below summarizes the main effects of IT monitoring on agents’ behavior. The
impact of the technology-based monitoring is clear for the production and the time spent on
cheating but mitigated regarding the time spent on productive and leisure activities and
cheating (amount).
Table III. 6: Main effects of IT monitoring on agents’ behavior.
IT vs TM Work Cheating leisure
Time production time amount time
Discretionary pay +39 + - -40 -
Equal pay - + - +41 +
global ? + - ? ?
39 Symbols + and – refer to the effect of technology monitoring agents’ behaviors compared to the traditional monitoring. 40 The cheating (amount) was lower on average for the five periods in presence of IT monitoring. More precisely, the cheating was only lower during the first three periods but higher for the last 2 periods when IT monitoring was available compared to when it was not under discretionary pay. 41 The cheating (amount) was higher on average during the five periods in presence of IT monitoring under equal pay.

Chapter III: IT monitoring
- 150 -
III4.2.4. Principal's behavior
We start by presenting summary statistics regarding principals’ behaviors. Under
discretionary (equal) pay, principals on IT treatments devoted 81.59% (92.56%) of time on
average to working activity compared to principals without IT monitoring 90.74% (93.19%).
Principals on IT treatments also spent less time on average (at least half) on leisure activity
than others. Indeed, the average time spent on internet was equal 0.58% (0.40%) under
discretionary (equal) pay for principals with IT monitoring compared to 1.41% (0.81%) for
principals in treatments without IT monitoring. We notice that principals’ pay was 5.30%
(6.25%) higher on average under discretionary (equal) pay for principals in IT treatments
compared to principals’ pay on treatments without IT monitoring. These results are not
statistically significant.
We report regressions analyzing the effect of IT monitoring on monitoring activity and
principals’ production in Table III.7. We define the variable "monitoring_time" which is the
time devoted on monitoring activity by principals. Consistent with our hypothesis 4,
principals on IT treatments spend more time on monitoring activity compared to principals in
other treatments (see dummy IT treatments in last first columns of Table III.7). The regression
coefficient is higher and significant for discretionary treatments (see dummy IT treatments in
the first two columns of Table III.7). Indeed, under discretionary pay, principals allocated
17.83% of their time to monitor agents in presence of IT monitoring compared to 7.85% when
IT monitoring was unavailable (z = -1.89, p = 0.06). As expected, the relationship between
principals’ production and monitoring_time is negative regardless of the payment scheme; the
coefficient is only significant under equal pay. We observe a negative trend on time spent by
principals on monitoring activity regardless the reward system; the relationship is higher
under equal pay. However, these results are not statistically significant.

Chapter III: IT monitoring
- 151 -
Table III. 7: Linear panel regression assessing the effects of IT
monitoring on principals behavior regarding production and monitoring.
Results on the last two panels of the table above show that principals with IT monitoring are
more productive compared to principals in treatments without, under equal pay only (see
variable IT treatments on first two columns of Table III.7)42. Indeed, the principals’
production was 18.56% higher under equal pay and 2.29% lower under discretionary pay
when IT monitoring was available compared to treatments without. The coefficients of
relationships between variables working_time, pay and principals’ production are positive and
significant regardless the payment scheme. These coefficients are higher on equal pay (see
dummies working_time and pay in the last two columns of Table III.7). These observations
42 On average, principals on IT treatments devote less time (87.23%) to working activity compared to 91.97% for principals on treatments without IT monitoring but their production is 8.34% higher on average.
Watching_time Production
Discretionary. Equal. Discretionary. Equal.
(1) (2) (3) (4)
Production -0.1 -0.08***
(0.07) (0.02)
IT treatments 49.05** 12.85 -2.74 53.94
(20.51) (10.01) (39.68) (49.81)
Working_time 0.57*** 0.82***
(0.12) (0.12)
Pay 0.39*** 0.66***
(0.06) (0.12)
Trend -2.18 -3.02 14.65* -10.29
(4.45) (2.14) (8.16) (8.34)
Ability 1.72 0.64 4.50 1.26
(2.22) (1.17) (0.30) (6.55)
Male dummy -23.64 5.99 37.52 -21.45
(21.83) (12.01) (45.06) (47.25)
Constant 75.28* 61.56*** -230.23*** -421.61***
(43.42) (18.94) (71.47) (117.31)
Observations 155 155 155 155 Number of principals 31 31 31 31
Number of teams 31 31 31 31
R2 overall 0.265 0.181 0.479 0.477
Model test chi2 (5/6) 13.79** 38.88*** 177.77*** 138.82*** Notes: Estimation output using robust standard errors clustered at the team level (in parentheses). Coefficients * significant at 10%; ** significant at 5%; *** significant at 1%.

Chapter III: IT monitoring
- 152 -
suggest that principals on discretionary treatments spent on average less time on working
activity and received a lower pay compared to the principals on treatments with equal pay
reward system. These observations also shed light on the power of the IT monitoring. Indeed,
principals on IT treatments were spending less time on productive activity compared to
principals on treatments without IT monitoring while their pay was higher on average
compared to those of principals without IT monitoring regardless the payment scheme. We
observe a positive trend in production under discretionary pay; this relation is negative under
equal pay43. It appears that the gap of principals’ production between periods was higher
under discretionary pay since they devoted less time to monitoring activity. We also observe
that the relationship between principals’ production and the variable Ability is positive.
Conversely to agents, it seems that principals’ ability was driving their performance. This
relationship is higher under discretionary pay; these results are not statistically significant.
Results 4: The principal's behavior
i) Principals on IT treatments spent more time on monitoring activity.
ii) Principals on IT treatments were less productive than principals in treatments
without IT monitoring under discretionary pay.
iii) Principals on IT treatments were more productive than others under equal pay.
The table below summarizes the main effects of the technology-based monitoring on
principals’ behavior. The impact of IT monitoring is clear for the time spent on activities but
mitigate regarding the production.
Table III. 8: Main effects of IT monitoring on principals’ behavior.
IT vs TM Work monitoring leisure
Time production time time
Discretionary pay -44 - + -
Equal pay - + + -
global - ? + -
43 The trend of principals’ production under equal pay is positive until the fourth period. 44 Symbols + and – refer to the effect of technology monitoring agents’ behaviors compared to the traditional monitoring.

Chapter III: IT monitoring
- 153 -
III5. Discussion and Conclusion
The technology-based monitoring continuously and instantaneously keeps details about
workers’ attendance, time coded log of all activities performed from their computer terminal,
time and length of time website visited, overtime, and break time. So, this monitoring system
could seriously impact workers’ performance. Although the diffusion of ICT at workplace has
generated a widespread use of technological tools to monitor employees, the technology
monitoring has never been really studied in the economic literature. Also, some cases of firing
because of computer systems and technology resources misuses suggest that workers may not
really be aware of the extent of the technology monitoring system, even if they signed the IT
charter of the firm.
In this chapter, our first contribution to the agency theory literature was to investigate the
impact of the technology monitoring on agents’ and principals’ behaviors in the lab. We
believe that a better understanding of how technology monitoring affects workers’
performance might be useful to minimize costs of technologies misuses at work. While
previous experimental works studied the monitoring rate chosen by the principal to audit
agents’ output; the principal was able to monitor agents’ output (Traditional monitoring) or all
agents’ activities on top of their output (IT monitoring) depending on the treatment, in our
experiment. We designed a workplace environment in which agents were able to complete a
work task, browse the internet and cheat; we addressed the effect of IT monitoring on agents’
behaviors through these three activities. We conducted a 2x2 design in which we varied the
monitoring system and the payment scheme (equal pay or discretionary pay). The
discretionary pay was an incentive system as the principal was able to reward or punish
agents according to his discretion by giving higher or lower pays.
Consistent with previous studies, we found that the disciplining effect occurs in presence of
the technology monitoring when the sanction is available. But, the most important finding is
that this effect varies over time. Indeed, when the technology monitoring was available,
agents produced more compared to treatment without this monitoring system. But, the gap
between the productions of two treatments was 4 times lower in the last two periods compared
to the first three periods. Moreover, agents cheated more in presence of the technology
monitoring compared to the situation without during the last two periods. Since the
technology monitoring is invisible, it seems that employees forgot the extent of this
monitoring system over time. This could explain why there are several cases where agents get

Chapter III: IT monitoring
- 154 -
fired because of internet abuse or misuse despite the fact that they know the IT charter.
Nevertheless, the disciplining effect of the technology-based monitoring reappears after a
sanction.
The disciplining effect of the technology monitoring differed whether the sanction was
available or not. Indeed, this effect was mitigated in absence of sanction. Although agents
produced more and spent less time on cheating in presence of the technology monitoring, they
spent less time on productive activity and more time on leisure activity compared to others.
These results mostly stand in contrast to our hypotheses. Nevertheless, the most productive
agents were those who spent more time on internet. In our experimental design, the
availability of internet did not depend on the principal’s discretion (Koch and Nafziger, 2015).
So, we cannot conclude that agents reciprocated by working hard. We suggest that the moral
cleansing effect (performing a good deed after doing a bad one) could explain this result
(Sachdeva et al. 2009, Branas-Garza et al. 2012). Indeed, by browsing the web, the moral
capital of agents was debited and they work hard after by crediting their moral capital to
compensate.
We found two others surprising results regarding the impact of the monitoring software. The
first is related to agents with low summation skills. We found that they were more productive
compared to others with high skills. It seems that the technology monitoring system lead
agents to work harder. The second result is related to cheating, agents were more effective to
cheat when the technology monitoring was available. Indeed, regardless of the payment
scheme, agents spent less time to cheat but they entered a higher amount on average to
increase their production compared to others. We suggest that they were trying to reduce the
probability to get caught as it was easy to detect the cheating with the monitoring software. It
appears that agents were adapting to the technology.
The second contribution of our paper concerns principal’s behavior that is often neglected in
the literature. We found that the technology monitoring is costly in terms of time as principals
spent more time to monitor agents in presence of this monitoring system compared to others.
As the result, principals spent less time to work but also on leisure activity compared to
others. However, the overall effect of the technology monitoring is positive since the
production of the organization as well as principals’ pay are higher when IT monitoring is
available than when it is not. The monitoring software is also more effective in terms of time
to clearly detect and punish shirking behaviors at work.

Chapter III: IT monitoring
- 155 -
One managerial implication of this chapter is that managers should use detailed information
provided by the monitoring software in order to get workers aware of the extent of this
monitoring system. For example, give some feedbacks about workers’ productivity or internet
use should be better to get them motivated and focused on their work. Another implication is
that the use of technology tools to monitor agents need to be adapted to a specific payment
scheme in order to reap more potential benefits from the use of ICT. In this chapter we
examined the effect of technology monitoring compared to the classic monitoring system but
we did not design a treatment in which principals could give a monitoring rate to agents. Also,
our design of the monitoring software was imperfect as principals were unable to have
information about workers’ activities without monitoring them in real time. The technology-
based monitoring records continuously and instantaneously data about workers even if the
principal is absent. Further researches could focus on the threshold in which the disciplining
effect of technology monitoring lessens. The frequency and type of feedbacks that principals
can give to agents in order to constantly get them aware of the extent of the technology-based
monitoring could be studied also.

Chapter III: IT monitoring
- 156 -
References
Alchian, A. A., and H. Demsetz (1972) ‘Production, information costs, and economic organization.’ The American Economic Review 62(5), 777–795.
Alder, G. S., and Ambrose, M. L. (2005) ‘An examination of the effect of computerized performance monitoring feedback on monitoring fairness, performance, and satisfaction.’ Organizational Behavior and Human Decision Processes, 97, 161-177.
Aral, S., E. Brynjolfsson, and L. Wu (2012) ‘Three-way complementarities: Performance pay, human resource analytics, and information technology.’ Management Science 58(5), 913–931.
Ariss, S. S (2002) ‘Computer Monitoring: Benefits and Pitfalls Facing Management.’
Information and Management 39(7), 553-558.
Black, S. E., and L.M. Lynch (2001) ‘How to compete: The impact of workplace practices and information technology on productivity.’ The Review of Economics and Statistics 83(3), 434-445.
Bloom, N., L. Garicano, R. Sadun, and J. Van Reenen (2014) ‘The distinct effects of
information technology and communication technology on firm organization.’ Management Science 60(12), 2859–2885.
Bresnahan, T. F., E. Brynjolfsson, and L.M. Hitt (2002) ‘Information technology, workplace
organization, and the demand for skilled labor: Firm-level evidence.’ The Quarterly
Journal of Economics 117(1), 339-376.
Brynjolfsson, E., and L.M. Hitt (2000) ‘Beyond computation: Information technology, organizational transformation and business performance.’ The Journal of Economic
Perspectives 14(4), 23-48. Calvo, G.A., and S. Wellisz (1978) ‘Supervision, loss of control, and the optimum size of the
firm.’ The Journal of Political Economy 86(5), 943–952. Carpenter, J., P. Matthews, and J. Schirm (2010) ‘Tournaments and office politics: Evidence
from a real effort experiment.’ The American Economic Review 100(1), 504–517. Charness, N., and J. Campbell (1988) ‘Acquiring skill at mental calculation in adulthood: a
task decomposition.’ Journal of Experimental Psychology: General 117, 115-129.
Corgnet, B., B. Gunia, and R. Hernan-Gonzalez (2014) ‘Surf’s up: Reducing internet abuse without demotivating employees.’ Academy of Management Best Paper Proceedings, Forthcoming.
Corgnet B., and I. Rodriguez-Lara (2013) ‘Are You a Good Employee or Simply a Good
Guy? Influence Costs and Contract Design.’ Journal of Economic Behavior and
Organization 92, 259-272.
Corgnet, B., Hernán-González, R., and E. Schniter (2015) ‘Why real leisure really matters: Incentive effects on real effort in the laboratory.’ Experimental Economics 18(2), 284-301.

Chapter III: IT monitoring
- 157 -
Corgnet, B., Martin, L., Ndodjang, P., and A. Sutan (2015) ‘On the merit of equal pay: When influence activities interact with incentive setting.’ ESI Working Paper 15-09. Retrieved from http://digitalcommons.chapman.edu/esi_working_papers/158
Deci, E. L. (1975) ‘Intrinsic Motivation.’ New York, NY: Plenum Press. Dickinson, D., and M.-C. Villeval (2008) ‘Does monitoring decrease work effort? The
complementarity between agency and crowding-out theories.’ Games and Economic
Behavior 63(1), 56–76. Dohmen, T., and A. Falk (2011) ‘Performance pay and multi-dimensional sorting:
Productivity, preferences and gender.’ The American Economic Review 101(2), 556–590. Engel, R. (2010) ‘Why work when you can shirk? Worker productivity in an experimental
setting.’ Journal of Applied Business and Economics 11(2), 104–119.
Eriksson, T., A. Poulsen, and M.-C. Villeval (2009) ‘Feedback and incentives: Experimental evidence.’ Labour Economics 16(6), 679–688.
Falk, A., and M. Kosfeld (2006) ‘The hidden costs of control.’ The American Economic
Review 96(5), 1611–1630. Fehr, E., and S. Gächter (2001) ‘Do incentive contracts crowd out voluntary cooperation?’
CEPR Discussion Papers 3017, Center for Economic Policy Research. Frey, B. S. (1993) ‘Does monitoring increase work effort? The rivalry between trust and
loyalty.’ Economic Inquiry 31(4), 663–670. Frey, B. S., and F. Oberholzer-Gee (1997) ‘The cost of price incentives: An empirical analysis
of motivation crowding-out.’ The American Economic Review 87(4), 746–755. Gallie, D., A. Felstead, and F. Green (2001) ‘Employer policies and organizational
commitment in Britain 1992-97.’ Journal of Management Studies 38(8), 1081–1101. Garicano, L. (2000) ‘Hierarchies and the organization of knowledge in production.’ Journal
of Political Economy 108(5), 874-904. Garicano, L., and E. Rossi-Hansberg (2006) ‘Organization and inequality in a knowledge
economy.’ The Quarterly Journal of Economics 121(4), 1383-1435. Hubbard, R.G. (1998) ‘Capital-market imperfections and investment.’ Journal of Economic
Literature 36(1), 193–225. Inderst, R., Müller, H., and K. Wärneryd (2005) ‘Influence costs and hierarchy.’ Economics of
Governance 6(2), 177-197.
Jung, S. (2014) ‘Risk attitudes and shirking on the quality of work under monitoring: Evidence from a real-effort task experiment.’ Thema Working Paper 2014-26, Thema, Université de Cergy Pontoise.

Chapter III: IT monitoring
- 158 -
Koch, A. K., and J. Nafziger (2015) ‘A Real-Effort Experiment on Gift Exchange with Temptation.’ IZA Discussion Paper No. 9084.
Martin, L., and N. Omrani (2015) ‘An Assessment of Trends in Technology Use, Innovative
Work Practices and Employees’ Attitudes in Europe.’ Applied Economics 47 (6), 623–638. Milgrom, P. (1988) ‘Employment contracts, influence activities and efficient organization
design.’ Journal of Political Economy 96, 42–60. Milgrom, P., and J. Roberts (1988) ‘An economic approach to influence activities in
organization.’ American Journal of Sociology 94, 154–179.
Milgrom, P. and J. Roberts (1990b) ‘The efficiency of equity in organizational decision processes.’ The American Economic Review-Papers and Proceeding 80(2), 154-159.
Nagin, D. S., J. B. Rebitzer, S. Sanders, and L. J. Taylor (2002) ‘Monitoring, motivation, and
management: The determinants of opportunistic behavior in a field experiment.’ The
American Economic Review 92(4), 850–873. Niederle, M., and L. Vesterlund (2007) ‘Do women shy away from competition? Do men
compete too much?’ The Quarterly Journal of Economics 3(8), 1067–1101. Pierce, L., Snow, D., and A. McAfee (2015) ‘Cleaning house: The impact of information
technology monitoring on employee theft and productivity.’ Management Science 61(10), 2299-2319.
Prendergast, C. (1999) ‘The provision of incentives in firms.’ Journal of Economic Literature
37(1), 7–63. Sarpong, S., and D. Rees (2014) ‘Assessing the effects of “big brother” in a workplace: The
case of WAST.’ European Management Journal 32, 216-222.
Schaefer, S (1998) ‘Influence costs, structural inertia, and organizational change.’ Journal of
Economics and Management Strategy. 7(2), 237–63. Schnedler, W., and R. Vadovic (2011) ‘Legitimacy of control.’ Journal of Economics and
Management Strategy 20(4), 985–1009. Van Herpen, M., M. Van Praag, and K. Cools (2005) ‘The effects of performance
measurement and compensation on motivation: An empirical study.’ De Economist 153(3), 303–329.
West, J. P., and J. S. Bowman (2016) ‘Electronic surveillance at work an ethical analysis.’ Administration & Society 48(5), 628-651.

Chapter III: IT monitoring
- 159 -
Appendix III
Table III. 9: Comparison of agents’ production over payment scheme.
Figure III. 3: Agents’ production on average over payment scheme in cents
400
450
500
550
1 2 3 4 5Period trend
Discretionary pay
Equal pay
Treatments Average Median Standard deviation
P-values Ranksum test
Equal pay Traditional (TMEP) 497.63 495 216.49 z = -0.51 p = 0.60 IT (ITEP) 503.47 480 262.50
Discretionary pay
Traditional (TMDP) 459.25 450 220.70 z = -1.18 p = 0.23 IT (ITDP) 500.67 510 224.59

Chapter III: IT monitoring
- 160 -
Table III. 10: Linear panel regression with regarding production and pay for low ability agents.
Production Pay IT treatments TM treatments ITDP TMDP (1) (2) (3) (4)
Working_time 1.06*** 1.08***
(0.02) (0.06)
Discretionary treat. -13.95 -10.77
(36.67) (25.42)
Low_Ability 36.11 -163.24*** 5.61** -2.78
(42.62) (28.56) (2.73) (2.44)
Trend 22.58*** 23.52*** -1.02*** -0.54**
(4.35) (3.85) (0.26) (0.27)
Male dummy -41.43 -9.36 1.79 0.88
(39.46) (23.07) (1.94) (1.95)
Production 0.02*** 0.02***
(0.00) (0.00)
Cheating_amount 0.01 0.00
(0.01) (0.01)
Constant -67.50 -71.92* 21.37*** 26.78***
(46.33) (39.71) (2.76) (3.11)
Observations 450 480 225 240 Number of agents 90 96 45 48
Number of teams 30 32 15 16
R2 overall 0.348 0.475 0.349 0.172
Model test chi2 (6/5) 144.33*** 394.96*** 38.76** 38.16*** Notes: Estimation output using robust standard errors clustered at the team level (in parentheses). Coefficients * significant at 10%; ** significant at 5%; *** significant at 1%.
Figure III. 4: Agents cheating (amount in cents) on average over discretionary treatments
20
40
60
80
100
1 2 3 4 5Period trend
TMDP
ITDP

Chapter III: IT monitoring
- 161 -
INSTRUCTIONS of TMEP and TMDP treatments are the same than those of IEP and IDP in Chapter II. We just reported instructions related to ITEP and ITDP in this section.
INSTRUCTIONS (ITEP)
n You have exactly 20 minutes to go through the instructions. You will have enough
time to read the instructions carefully. A timer is displayed on the room monitor that indicates the remaining time to read the instructions.
n After that, the experimenter will close the current document and you will be able to access the experiment. Please do not close the current document and do not access the experiment before the end of the instruction round.
n A printed copy with a short summary of the instructions will be given to you at the end
of the instruction round.
n This is an experiment in decision making. You will be paid in cash for your participation at the end of the experiment. Different participants may earn different amounts. What you earn depends on your decisions and the decisions of others.
n The experiment will take place through computer terminals at which you are seated. If you have any questions during the instruction round, raise your hand and a monitor will come by to answer your question. If any difficulties arise after the experiment has begun, raise your hand, and someone will assist you.
(Timing of the experiment)
n This experiment involves 4 subjects and consists of 5 periods of 10 minutes each.
There are two types of subjects referred to as B and C.
n 3 subjects will be subjects B and one will be subject C. You will learn the type of subject you are when the experiment starts.
n Your individual earnings at the end of the experiment are computed as the sum of your
earnings in the 5 periods.
n In each period of this experiment both subjects B and subject C will be able to: sum up numbers in a table (work task) or browse the web.
n Subject C will have access to another activity that consists in monitoring other subjects’ activities.
n Subjects B will have access to an activity in which they will be able to exaggerate their
performance on the work task.
n To switch from one activity to another you just have to click on the corresponding option of the action menu displayed on your screen.

Chapter III: IT monitoring
- 162 -
n The activities are referred to as Task (sum up numbers in a table), Internet (browse the
web), Watch (monitor subjects B contributions – only available to C) and Boost
(exaggerate task production as observed by subject C – only available to Bs). Each activity is undertaken separately, in a different screen.
n Your experiment ID will be displayed on the top left corner of your screen once the experiment starts. It will consist of the letter B followed by a number if you are of type B. If you are the subject C your ID will be C11.
Task – summing up numbers
n The task consists in summing up 36 numbers in a table with 6 rows and 6 columns.
Each subject is given a different set of tables with the same level of difficulty.
n Before providing your final answer (the total sum of all numbers in the table) you have to fill in the 6 cells that correspond to the sums of the 6 columns. Filling in these 6 cells does not directly generate earnings but it can help you to compute the final sum.
n Only after filling in all these cells will you be allowed to provide a final answer (the total sum) in the box located below the table on the left.
n Notice that you are not allowed using a calculator or any other electronic, computer-based or internet-based devices to sum up numbers.
n If you do, you will be excused and you will not be paid.
n Only the final answer (total sum of the table) is rewarded. Intermediate sums of all columns are required but are not rewarded.
n Each time you answer the task correctly (your final sum is correct) you generate 60
cents of Total production. These 60 cents is not directly added to your individual earnings.
Chapter III: IT monitoring
- 163 -
n Subject C always gets 40% of Total production while each subject B gets 20% of the
total profit contributed by all subjects undertaking the task.
n The amount of money you generate by undertaking the task is displayed in the second column “My Production” of the history table at the bottom of the screen.
n The total amount of money generated by all 4 subjects (subject C + 3 subjects B) on the task is displayed in the sixth column “Total Production” of the history table at the bottom of the screen.
n If you sum up the numbers of a table correctly then each subject in the experiment (including yourself) gets 60 cents times the percentage of Total production that he or she is assigned.
n If you are subject C you get 24 cents (40%×60 cents).
n If you are one of the subjects B you get 12 cents (20%×60 cents).
n If you answer the task incorrectly you generate a penalty of 30 cents that is subtracted from Total production. So when you answer incorrectly your individual earnings decrease by 12 cents (40%×30) if you are Subject C and by 6 cents (20%×30) if you are Subject B.
(Your Production can never be less than 0.)
(Browsing the internet)
n Whether you are a subject B or subject C, you can browse the internet at any time
during this experiment. Browsing the web is one of the basic activities that you can perform during this experiment, along with summing up numbers.
n You can access the internet screen by clicking on the Internet option in the action menu.
n Notice that while using the internet you are not allowed to download additional software. You are also expected to close pop-up windows when they appear on the screen.
n Your usage of the internet is strictly confidential. No one can see the web pages you are consulting (for example, your email).
Monitoring: only for subject C
n If and only if you are subject C, you can monitor the contribution of the three subjects
B at any time during this experiment. You can do so by clicking on the Watch option in the action menu.

Chapter III: IT monitoring
- 164 -
n You will be faced with a monitoring screen with 3 columns, each of them corresponding to one of the subjects B in the experiment. The head of each column indicates the experiment ID of the subject.
n For example, to monitor subject B12, you have to click on the column header “B12” displayed in green. The column header turns red once you click on the Yes button on the pop-up message: “Ready to watch?”
n You can monitor all subjects’ contributions at the same time by clicking on the following button displayed in the top right corner of the screen:
n You can stop monitoring all subjects B by clicking:
n To stop monitoring a given subject you have to click on the corresponding column header.
n At the end of each period, subject C will also receive a summary of his or her monitoring activities.
n You will be informed in real time of the observed production and contribution to Total
production (in % terms) of the selected subject B.
n You will be informed in real time of the activities undertaken and time expended on each activity by the selected subject: Internet (browsing the web), Task 2 (summing up numbers in a table) or Boost (exaggerating task production). All this information will be saved on the monitoring screen until you switched to another activity.
n You will be informed when a subject enter a number to sum a column before providing Task 2 final answer. This is referred to as Sum Column in the monitoring screen.
n In addition, you will be informed in real time of the observed production and contribution to Total production (in % terms) of the selected subject B.
INSTRUCTIONS (Boost)
n If and only if you are subject B, you can exaggerate your production, as observed by
subject C, at any time during this experiment.

Chapter III: IT monitoring
- 165 -
n To do so, you just have to select the Boost option in the action menu.
n To exaggerate your observed production, you have to enter the amount by which you
want to increase it.
n After clicking on OK, you will not be able to complete any other activity for 30 seconds. This is how your screen will look like during these 30 seconds:
n The amount by which you boosted your observed production will appear in the Boost column at the bottom of your screen.
n The My Production column will remain unchanged, however.
n For example, consider the situation in which the production of subject B12 is 120¢ while the other three subjects have produced a total of 270¢. In that case, Total
production is equal to 390¢ and subject B12 contribution to Total production is equal to 31% (120¢/390¢).
n Consider now that subject B12 exaggerates his or her observed production by 60¢ using the boost option.
n As a consequence, the production of subject B12 as observed by subject C will immediately increase from its current level of 120¢ to 180¢. Also, the observed contribution of subject B12 will increase from 31% to 38% (180¢/390¢) and the observed contributions of subjects B11and B13 will decrease.
n The monitoring screen of subject C will reflect this increase in observed production
and contribution of subject B12.
n As a result of subject B12 boosting his or her observed production, the sum of subjects’ observed productions will be different from the actual Total production in the monitoring summary.

Chapter III: IT monitoring
- 166 -
n The monitor will be able to know whether one or several subjects B have boosted their observed production. However, the monitor will not know which subject(s) exaggerated their observed production and by which amount.
n This is the case because the monitor will not be informed of the activities completed by each subject.
n Instead, the monitor will be informed of the observed production and contribution of the monitored subjects B at that moment in time.
INSTRUCTIONS (Earnings)
n Your individual earnings correspond to the following sum over the 5 periods: ¨ Your percentage of Total production that has been generated by all 4 subjects
(C subject + 3 B subjects) summing up numbers during the experiment.
n You will learn the exact amount of your individual earnings at the end of each 10-
minute period.
n In the pop-up window, your individual earnings in dollars for the current period will be displayed.
n You will click on the OK button to continue to next period.
n Your earnings in cents for the current period will be also displayed in the last column of the history table at the bottom of your screen. This column is labeled “My Period Earnings”.
n You will also see the share of production of all other subjects at the top of your screen
n EXAMPLE: In the first period you provided 7 correct answers completing the task while providing 3 incorrect answers. Also, the other three subjects in the experiment provided a total of 24 correct answers in the task while providing 5 incorrect answers.
n Your earnings (“My Period Earnings”) for that period are equal to:
n Earnings: 20%×(31×60 - 8×30)= 324 cents if you are a subject B

Chapter III: IT monitoring
- 167 -
n Earnings: 40%×(31×60 - 8×30)= 648 cents if you are subject C
n Note that the amount displayed in the Boost column increased your production as observed by subject C without changing either the value of the My Production and Total production columns.
Summary
n This experiment involves 4 subjects and consists of 5 periods of 10 minutes each.
There are two types of subjects referred to as B and C, respectively.
n 3 subjects will be subjects B and one will be subject C.
n In each period, both subjects B and subject C will be able to: sum up numbers in a table or browse the web.
n Only subjects B will be able to exaggerate their production and contribution as observed by subject C by using the boost option.
n Only subject C will be able to monitor other subjects’ activities.
n Your individual earnings will depend on the task which consists in summing up numbers in a table.
n The total earnings generated by all 4 subjects (subject C + 3 subjects B) on the task will be divided as follows.
n Each subject B will get 20% of the total amount of money generated by all subjects while subject C always will get 40% of the total amount of money generated.

Chapter III: IT monitoring
- 168 -
INSTRUCTIONS (ITVP)
n You have exactly 20 minutes to go through the instructions. You will have enough
time to read the instructions carefully. A timer is displayed on the room monitor that indicates the remaining time to read the instructions.
n After that, the experimenter will close the current document and you will be able to access the experiment. Please do not close the current document and do not access the experiment before the end of the instruction round.
n A printed copy with a short summary of the instructions will be given to you at the end
of the instruction round.
n This is an experiment in decision making. You will be paid in cash for your participation at the end of the experiment. Different participants may earn different amounts. What you earn depends on your decisions and the decisions of others.
n The experiment will take place through computer terminals at which you are seated. If you have any questions during the instruction round, raise your hand and a monitor will come by to answer your question. If any difficulties arise after the experiment has begun, raise your hand, and someone will assist you.
(Timing of the experiment)
n This experiment involves 4 subjects and consists of 5 periods of 10 minutes each.
There are two types of subjects referred to as B and C.
n 3 subjects will be subjects B and one will be subject C. You will learn the type of subject you are when the experiment starts.
n Your individual earnings at the end of the experiment are computed as the sum of your
earnings in the 5 periods.
n In each period of this experiment both subjects B and subject C will be able to: sum up numbers in a table (work task) or browse the web.
n Subject C will have access to another activity that consists in monitoring other subjects’ activities.
n Subjects B will have access to an activity in which they will be able to exaggerate their
performance on the work task.
n To switch from one activity to another you just have to click on the corresponding option of the action menu displayed on your screen.
n The activities are referred to as Task (sum up numbers in a table), Internet (browse the
web), Watch (monitor subjects B contributions – only available to C) and Boost
(exaggerate task production as observed by subject C – only available to Bs). Each activity is undertaken separately, in a different screen.

Chapter III: IT monitoring
- 169 -
n Your experiment ID will be displayed on the top left corner of your screen once the
experiment starts. It will consist of the letter B followed by a number if you are of type B. If you are the subject C your ID will be C11.
Task – summing up numbers
n The task consists in summing up 36 numbers in a table with 6 rows and 6 columns.
Each subject is given a different set of tables with the same level of difficulty.
n Before providing your final answer (the total sum of all numbers in the table) you have to fill in the 6 cells that correspond to the sums of the 6 columns. Filling in these 6 cells does not directly generate earnings but it can help you to compute the final sum.
n Only after filling in all these cells will you be allowed to provide a final answer (the total sum) in the box located below the table on the left.
n Notice that you are not allowed using a calculator or any other electronic, computer-based or internet-based devices to sum up numbers.
n If you do, you will be excused and you will not be paid.
n Only the final answer (total sum of the table) is rewarded. Intermediate sums of all columns are required but are not rewarded.
n Each time you answer the task correctly (your final sum is correct) you generate 60
cents of Total production. These 60 cents is not directly added to your individual earnings.
n Subject C always gets 40% of Total production while subjects B get the remaining 60% of Total production at the end of each period.
Chapter III: IT monitoring
- 170 -
n At the end of each period, subject C will divide the remaining 60% of Total production among the 3 subjects B involved in the experiment. So, each subject B gets a percentage of the total profit contributed by all subjects undertaking the task.
n The amount of money you generate by undertaking the task is displayed in the second column “My Production” of the history table at the bottom of the screen.
n The total amount of money generated by all 4 subjects (subject C + 3 subjects B) on the task is displayed in the sixth column “Total Production” of the history table at the bottom of the screen.
n If you sum up the numbers of a table correctly then each subject in the experiment (including yourself) gets 60 cents times the percentage of Total production that he or she is assigned.
n If you are subject C you get 24 cents (40%×60 cents).
n If you are subject B you get a percentage (allocated to you at the end of the period by subject C) of the 60 cents.
n If you answer the task incorrectly you generate a penalty of 30 cents that is subtracted from Total production. So when you answer incorrectly your individual earnings (as well as other subjects’ earnings) decrease.
(Your Production can never be less than 0.)
(Browsing the internet)
n Whether you are a subject B or subject C, you can browse the internet at any time
during this experiment. Browsing the web is one of the basic activities that you can perform during this experiment, along with summing up numbers.
n You can access the internet screen by clicking on the Internet option in the action menu.
n Notice that while using the internet you are not allowed to download additional software. You are also expected to close pop-up windows when they appear on the screen.
n Your usage of the internet is strictly confidential. No one can see the web pages you are consulting (for example, your email).
Monitoring: only for subject C
n If and only if you are subject C, you can monitor the contribution of the three subjects
B at any time during this experiment. You can do so by clicking on the Watch option in the action menu.

Chapter III: IT monitoring
- 171 -
n You will be faced with a monitoring screen with 3 columns, each of them corresponding to one of the subjects B in the experiment. The head of each column indicates the experiment ID of the subject.
n For example, to monitor subject B12, you have to click on the column header “B12” displayed in green. The column header turns red once you click on the Yes button on the pop-up message: “Ready to watch?”
n You can monitor all subjects’ contributions at the same time by clicking on the following button displayed in the top right corner of the screen:
n You can stop monitoring all subjects B by clicking:
n To stop monitoring a given subject you have to click on the corresponding column header.
n At the end of each period, subject C will also receive a summary of his or her monitoring activities.
n You will be informed in real time of the observed production and contribution to Total
production (in % terms) of the selected subject B.
n You will be informed in real time of the activities undertaken and time expended on each activity by the selected subject: Internet (browsing the web), Task 2 (summing up numbers in a table) or Boost (exaggerating task production). All this information will be saved on the monitoring screen until you switched to another activity.
n You will be informed when a subject enter a number to sum a column before providing Task 2 final answer. This is referred to as Sum Column in the monitoring screen.
n In addition, you will be informed in real time of the observed production and contribution to Total production (in % terms) of the selected subject B.
INSTRUCTIONS (Boost)
n If and only if you are subject B, you can exaggerate your production, as observed by
subject C, at any time during this experiment.

Chapter III: IT monitoring
- 172 -
n To do so, you just have to select the Boost option in the action menu.
n To exaggerate your observed production, you have to enter the amount by which you
want to increase it.
n After clicking on OK, you will not be able to complete any other activity for 30 seconds. This is how your screen will look like during these 30 seconds:
n The amount by which you boosted your observed production will appear in the Boost column at the bottom of your screen.
n The My Production column will remain unchanged, however.
n For example, consider the situation in which the production of subject B12 is 120¢ while the other three subjects have produced a total of 270¢. In that case, Total
production is equal to 390¢ and subject B12 contribution to Total production is equal to 31% (120¢/390¢).
n Consider now that subject B12 exaggerates his or her observed production by 60¢ using the boost option.
n As a consequence, the production of subject B12 as observed by subject C will immediately increase from its current level of 120¢ to 180¢. Also, the observed contribution of subject B12 will increase from 31% to 38% (180¢/390¢) and the observed contributions of subjects B11and B13 will decrease.
n The monitoring screen of subject C will reflect this increase in observed production
and contribution of subject B12.
n As a result of subject B12 boosting his or her observed production, the sum of subjects’ observed productions will be different from the actual Total production in the monitoring summary.

Chapter III: IT monitoring
- 173 -
n The monitor will be able to know whether one or several subjects B have boosted their observed production. However, the monitor will not know which subject(s) exaggerated their observed production and by which amount.
n This is the case because the monitor will not be informed of the activities completed by each subject.
n Instead, the monitor will be informed of the observed production and contribution of the monitored subjects B at that moment in time.
INSTRUCTIONS (Earnings)
n Your individual earnings correspond to the following sum over the 5 periods: ¨ Your percentage of Total production that has been generated by all 4 subjects
(C subject + 3 B subjects) summing up numbers during the experiment.
n You will learn the exact amount of your individual earnings at the end of each 10-
minute period.
n In the pop-up window, your individual earnings in dollars for the current period will be displayed.
n You will click on the OK button to continue to next period.
n Your earnings in cents for the current period will be also displayed in the last column of the history table at the bottom of your screen. This column is labeled “My Period Earnings”.
n You will also see the share of production of all other subjects at the top of your screen
Allocation of Total production
n At the end of each of the 5 periods subject C allocates a percentage of Total
production to each B subject. Given that subject C gets a fixed percentage of 40% of Total production at the end of each period, there is 60% of Total production to divide among the 3 subjects B.

Chapter III: IT monitoring
- 174 -
n Notice that each subject B can be allocated a different percentage of Total production. Also, this percentage can be changed by the C subject at the end of each period.
n B subjects do not know this percentage until the end of a given period.
n In the last row of the monitoring summary, subject C will decide upon the allocation of Total production among the 3 subjects B by entering numbers in the corresponding green cells in the last row of the summary screen.
n EXAMPLE: subject C allocates the remaining 60% of Total production among subjects B as follows:
n B11 gets 15%, B12 gets 25%, B13 gets 20%,
n Notice that all percentages sum up to 60%.
n Once subject C has entered the percentages allocated to each subject B, all subjects B are informed about their share of Total production in the history panel at the bottom of their screen.
n EXAMPLE: In the first period you provided 7 correct answers completing the task
while providing 3 incorrect answers. Also, the other three subjects in the experiment provided a total of 24 correct answers in the task while providing 5 incorrect answers.
n Also, imagine that you are subject B12 and that subject C has allocated to you 25% of Total production at the end of the first period. Your earnings (“My Period
Earnings”) for that period are equal to:
Earnings Calculation
n EXAMPLE: In the first period you provided 7 correct answers completing the task while providing 3 incorrect answers. Also, the other three subjects in the experiment provided a total of 24 correct answers in the task while providing 5 incorrect answers.
n Also, imagine that you are subject B12 and that subject C has allocated to you 25% of Total production at the end of the first period. Your earnings (“My Period Earnings”) for that period are equal to:
n Earnings: 25%×(31×60 - 8×30)= 405 cents if you are subject B12
n Earnings: 40%×(31×60 - 8×30)= 648 cents if you are subject C11
Summary
n This experiment involves 4 subjects and consists of 5 periods of 10 minutes each.
There are two types of subjects referred to as B and C, respectively.

Chapter III: IT monitoring
- 175 -
n 3 subjects will be subjects B and one will be subject C.
n In each period, both subjects B and subject C will be able to: sum up numbers in a table or browse the web.
n Only subjects B will be able to exaggerate their production and contribution as observed by subject C by using the boost option.
n Only subject C will be able to monitor other subjects’ activities.
n Your individual earnings will depend on the task which consists in summing up numbers in a table.
n The total earnings generated by all 4 subjects (subject C + 3 subjects B) on the task will be divided as follows.
n At the end of each period, subject C always gets 40% of the total amount of money generated by all 4 subjects (C subject + 3 B subjects) and decides how to allocate the remaining 60% among the 3 subjects B.

General Conclusion
- 177 -
General Conclusion
The introduction of Information and Communication Technologies at workplace has lowered
information and communication costs (Milgrom and Roberts, 1990; Garicano, 2000) and has
also entailed some organizational changes. These technological and organizational have
positively impacted the firms’ efficiency (Black and Lynch, 2001; Bresnahan et al., 2002;
Brynjolfsson and Hitt, 2000) but the effects of ICT use at the level of workers are unclear.
Indeed, the implementation of technologies generated several changes which can have
opposite effects at the workers’ level (Garicano, 2000; Bertschek and Kaiser, 2004; Garicano
and Rossi-Hansberg, 2006; Bloom et al., 2014; Martin and Omrani, 2015; Sun, 2016). This
dissertation explores impacts of Information and Communication Technologies (ICT) use on
workers’ behaviors. There are a few papers which showed positive effects of the ICT use at
the level of workers but none used the experimental method. Investigating issues of ICT use
regarding workers is crucial because technological and organizational changes incurred some
costs for firms that should be minimized.
Our first contribution was to feel the gap of the lack of studies on ICT use at the workers’
level by testing the “knowledge hierarchy” (Garicano, 2000) and influence costs theories
(Milgrom, 1988; Milgrom and Roberts 1988, 1990b) in the lab. The first theory states that
firms have foster investments Information technologies which provide more autonomy and
lead to a higher workers’ performance. While the literature on influence costs argues that
workers will engage on influence activities if they have opportunities to manipulate
information in order to maximize their profit. We also assessed how technologies could
reduce influence costs by studying the effects of the pervasive and invasive technology
monitoring on workers’ behaviors.
Consistent with Bloom et al. (2014), our findings supported theoretical predictions of IT
versus CT impacts on workers’ performance. Information technologies users were more
productive than non-users and CT users were less productive than non-users. One of our most
important contributions was to investigate workers’ preference between these two
technologies. Employees are more willing to use Information technologies. This is consistent
with the finding that when workers have a higher scope of decision making, they feel more
autonomous, their sense of responsibility increases and they reciprocate by increasing their
performance (Sliwka, 2001; Charness et al., 2012). Communication technologies centralize

General Conclusion
- 178 -
decision making by leading agents to rely more on the principal for help. This situation is
detrimental for both managers and workers. The solicitation of managers by workers to solve
problems negatively impacted their production. As expected, teams with IT users were more
productive than teams with CT users. However, Information technologies may provide more
opportunities for workers to engage on counterproductive behaviors.
We also found support of theoretical predictions regarding influence costs. Workers are
willing to manipulate information in order to influence their manager’s decisions. This
willingness was higher when the principal had discretion over decisions with distributional
implications. We also found that influence activities led managers to make inefficient
decisions and set low-powered incentives. Costs for the firm are substantial since influence
activities dampen strong incentives of competition and lead the principal to weaken
meritocracy. One important solution advocated by the influence costs theory is that
bureaucratic rules which limit the managerial discretion may be optimal to reduce influence
costs. Nevertheless, we also found that employees also engaged on time wasting activities in
the fixed wage reward system; showing that influence activities are also pervasive in absence
of monetary incentives.
we also showed that the IT monitoring implied a disciplining effect (Dickinson and Villeval,
2008; Nagin et al., 2002; Engel, 2010). However, our most important result was to highlight
that the disciplining effect of technology monitoring is salient at the beginning and lessens
over time. Since IT monitoring is invisible, employees seem to forget its extent. This could
explain why there are several cases of employees who get fired because of internet abuse or
misuse, even though they signed the IT charter of the firm. Surprisingly, we also observed
that low summation skills workers were more productive than those with high summation
skills regardless the payment scheme. The technology-based monitoring does not eradicate
counterproductive behavior but it is quite successful to reduce cheating and internet abuse.
We also found that IT monitoring was useful for the principal to detect and punish cheating
behavior. IT monitoring is helpful to make more efficient decision, but it is costly in terms of
time for the principal. The technology-based monitoring is also efficient for time saving
because IT helps to get the right information on workers’ counterproductive behaviors. This
mitigates the negative effect of the monitoring costs.
Our results showed that the most productive employees were those who spent more time on
Internet (Koch and Nafziger, 2015). When there is neither restriction nor sanction for

General Conclusion
- 179 -
browsing the web, workers seems to reciprocate with a higher effort. The moral cleansing
effect could also explain this finding.
We have to mention some limitations of our work. Our experimental designs were a little
complex or incomplete. Indeed, we did not implement Communication technologies between
workers and one PDF file could have been enough to reproduce Information technologies.
Our design also lacked one treatment with the classic monitoring for a better comparison with
the technology monitoring system. The virtual organization software did not allow for
negative individual production. This led us to lose information about influence costs since the
individual production could lower the production of the team. Our implementation of the
monitoring software was imperfect as principals were unable to record information about
workers’ activities without monitoring them in real time.
Managerial implications and research avenues
Technologies are now indispensable at workplace. ICT is used at all spheres in the production
process. It is crucial for managers to learn more about ICT effects on workers’ behaviors in
order to reap the full potential of these technologies.
This thesis draws attention on some negative consequences of Communication technologies
on workers’ autonomy and teams’ production. The allocation of decision making in the firm
may be adapted according to the technologies (Information or communication) used or vice
versa in order to avoid counterproductive effects. Workers prefer Information technologies
which foster their autonomy. These technologies also provide instant heightened indicators of
their performance which are useful for monitoring. So, firms may prioritize the use of
technologies which empower workers. However, managers may sensitize them on the extent
of the technology-based monitoring in order to reduce shirking behaviors and increase their
performance.
Browsing the web for personal use at workplace may have positive effect on workers’
performance. When there is any restriction on internet access, employees seem to reciprocate
with high effort. Nevertheless, managers have to take advantage of IT monitoring to prevent
internet abuse.
Managers have to take account that status seeking may also lead workers to engage on
unproductive activities in order to maintain a good reputation even if it is costly for the firm.

General Conclusion
- 180 -
Therefore, the limitation of managerial discretion may not be enough to reduce influence
activities.
In this work, we focused on the communication between principal and agents. Further
researches could include communication between employees. Indeed, employees could share
solution of problems that they already faced to help coworkers. This could increases teams’
production and improves cooperation in teamwork (Isaac and Walker 1988; Sutter and
Strassmair 2009; Cason et al. 2012). The negative effect of Communication technologies
could be mitigated. The use of Information technologies leads to a wider span of control for
managers (Bloom et al., 2014). It could be interesting to assess the relationship between
influence costs and the size of the span of control.
The technology-based monitoring records continuously and instantaneously data about
workers even if the principal is absent. Further researches could focus on the threshold in
which the disciplining effect of technology monitoring lessens. Future researches could
investigate how workers should be sensitized on the extent of IT monitoring in order to
prevent technologies misuses and abuses. For example the type of feedbacks and the
frequency in which these feedbacks should be provided to workers can be the object of
another study. Assessing how the internet browsing could enhance workers’ performance may
be worthwhile.
It is also necessary to run an experiment with classic monitoring and IT monitoring in order to
build a unified theory of monitoring. Although the experimental methodology enabled us to
implement some features of real work environment, the use of cellphones (which provide the same
leisure options than computers) at workplace shows that capturing the reality in the lab is more
complex.

General Conclusion
- 181 -
References
Black, S. E., and L. M. Lynch (2001) ‘How to compete: The impact of workplace practices and information technology on productivity.’ The Review of Economics and Statistics 83(3), 434–445.
Bertschek I., and U. Kaiser (2004) ‘Productivity effects of organizational change: Microeconometric evidence.’ Management Science 50(3), 394-404.
Bloom, N., L. Garicano, R. Sadun, and J. Van Reenen (2014) ‘The distinct effects of
information technology and communication technology on firm organization’, Management Science 60(12), 2859-2885.
Bresnahan, T. F., E. Brynjolfsson, and L. M. Hitt (2002) ‘Information technology, workplace
organization, and the demand for skilled labor: Firm-level evidence.’ The Quarterly
Journal of Economics 117(1), 339–376.
Brynjolfsson, E., and L. M. Hitt (2000) ‘Beyond computation: Information technology, organizational transformation and business performance.’ The Journal of Economic
Perspectives 14(4), 23–48.
Carpenter, J., P. Matthews, and J. Schirm (2010) ‘Tournaments and office politics: Evidence from a real effort experiment.’ The American Economic Review 100(1), 504–517.
Cason, T.N., Sheremet, R.M. and J. Zhang (2012) ‘Communication and efficiency in competitive coordination games’, Games and Economic Behavior, 76, 26-43.
Charness, G., Cobo-Reyes, R., Jinénez, N., Lacomba, J. A and F. Lagos, (2012) ‘The Hidden Advantage of Delegation: Pareto-improvements in a Gift-exchange Game’, American
Economic Review 102(5): 2358-2379. Dickinson, D., and M.-C. Villeval (2008) ‘Does monitoring decrease work effort? The
complementarity between agency and crowding-out theories.’ Games and Economic
Behavior 63(1), 56–76. Engel, R. (2010) ‘Why work when you can shirk? Worker productivity in an experimental
setting.’ Journal of Applied Business and Economics 11(2), 104–119. Garicano, L. (2000) ‘Hierarchies and the organization of knowledge in production’, Journal
of Political Economy 108(5), 874-904. Garicano, L., and E. Rossi-Hansberg (2006) ‘Organization and inequality in a knowledge
economy’, The Quarterly Journal of Economics 121(4), 1383-1435.
Issac, R.M. and J.M. Walker (1988) ‘Communication and free-riding behavior: VCM’, Economic Inquiry, 26(4), 585-608.
Koch, A. K., and J. Nafziger (2015) ‘A Real-Effort Experiment on Gift Exchange with Temptation’. IZA Discussion Paper No. 9084.

General Conclusion
- 182 -
Milgrom, P., and J. Roberts (1988) ‘An Economic Approach to Influence Activities in Organization’ American Journal of Sociology 94 (S), 154-179.
Milgrom, P., and Roberts, J. (1990). The economics of modern manufacturing technology,
strategy and organisation. The American Economic Review, 311–328.
Martin, L., and N., Omrani (2015) ‘An assessment of trends in technology use, innovative work practices and employees' attitudes in Europe.’ Applied Economics 74 (6), 623-638.
Nagin, D. S., J. B. Rebitzer, S. Sanders, and L. J. Taylor (2002) ‘Monitoring, motivation, and
management: The determinants of opportunistic behavior in a field experiment.’ The
American Economic Review 92(4), 850–873. Sliwka, D. (2001) ‘On the Costs and Benefits of Delegation in Organizations’, Journal of
Institutional and Theoretical Economics 157(4), 568-590. Sutter, M. and C. Strassmair (2009) ‘Communication, cooperation and collusion in team
tournaments—An experimental study’ Games and Economic Behavior, 66, 506-525.
Sun, J. (2016) ‘The effect of information technology on IT-facilitated coordination, IT-facilitated autonomy, and decision-makings at the individual level’. Applied Economics, 1-18.

- 184 -
L’impact des Technologies de l’Information et de la Communication sur le
comportement des travailleurs : Une approche expérimentale
Cette thèse explore l’impact des technologies de l'information et de la communication (TIC) sur le comportement des employés. Alors que la théorie néoclassique de la croissance considère les TIC comme un outil utilisé dans le processus de production, nous nous sommes basés sur une théorie qui stipule que les technologies ont deux aspects différents. Les technologies de la communication centralisent la prise de décision tandis que les technologies de l'information déplacent la prise de décision au niveau de l'employé. Nous avons abordé les questions du meilleur type de technologies pour l’amélioration de la performance des employés, des coûts engendrés par l'utilisation de ce type de technologies et de l’impact de la surveillance informatique dans la réduction de ces coûts. Nous avons utilisé la méthode expérimentale pour répondre à ces questions. Nos résultats montrent que les employés préfèrent utiliser les technologies de l'information et ceux qui les utilisent sont plus productifs que les autres. Nous trouvons également que l’environnement de travail et les technologies qui poussent la prise de décision au niveau de l'employé pourraient engendrer des coûts importants pour l’entreprise. Cependant, la surveillance informatique est efficace pour réduire ces coûts mais son effet diminue au fil du temps. Nos résultats montrent que les employés les plus productifs sont ceux qui ont passé le plus de temps sur internet. Donner aux employés les informations constantes et détaillées (sur leur performance) produites par les technologies pourrait être une façon efficace de les sensibiliser sur l’ampleur de la surveillance informatique afin de les rendre plus performants.
Mots clés : Economie comportementale ; Economie expérimentale ; Technologies de l’Information et de la Communication ; Surveillance ; Performance ; Incitations
Impact of Information and Communication Technologies on workers’ behavior:
An experimental Investigation
This dissertation explores the impact of the use of Information and Communication Technologies (ICT) on employees’ behaviors. While the neoclassical growth theory considers ICT as an input used in the production process, we relied on the knowledge hierarchy literature which states that technologies have two different key aspects. Information technologies push down the decision making at the employee level while Communication technologies centralize the decision making. We addressed the issues of the more efficient technologies for workers’ performance, the costs generated by using the most efficient type of technologies and how the technology-based monitoring may be useful to reduce those costs. We used the experimental methodology since the collection of individuals and team's production is hard with survey data. Our results show that employees prefer Information technologies and those who use it are more productive than others. We also show that work organization and technologies which push down the decision making at the employee level could entail some substantial costs for the firm. However IT monitoring is quite successful at reducing those costs. Technology monitoring implies a disciplining effect at the beginning when the sanction is available but this effect lessens over time. Our results show that employees are more productive when they spend more time on internet. Giving constant heightened feedbacks (about their productivity) provided by ICT to workers should be the better way to sensitize them about the extent of technology monitoring and to increase their performance.
Keywords: Behavioral economics; Experimental economics; Information and Communication Technologies; Monitoring; Performance; Incentives
Peguy Ndodjang - UMR LAMETA, Avenue Raymond Dugrand, 34960 Montpellier, France