impact of the tarp financing choice on existing preferred ... finance .pdf · impact of the tarp...
TRANSCRIPT

1
Impact of the TARP Financing Choice on Existing Preferred Stock
Dong H. Kim and
Duane Stock* Michael F. Price College of Business
University of Oklahoma Division of Finance
307 W.Brooks, Suite 205A Norman, OK 73019-0450
Tel: (405)325-5591; Fax: (405)325-7688
Email: [email protected]
October 13, 2010
JEL Classification: G32, G34, G39
Key Words: priority, TARP, preferred stock, bankruptcy
*Corresponding author

2
Abstract
The October 14, 2008 TARP program mandated a forced issuance of TARP preferred stock
by the largest U.S. banks. Soon after, many smaller banks were not forced but chose to issue
TARP preferred stock after being approved for issuance. We investigate the impact of TARP
preferred on two different types of outstanding preferred stock. These two different types of
preferred stock are (1) trust preferred stock, which is senior to TARP preferred stock, and (2)
non-trust preferred stock, which has equal claim to TARP preferred stock. Consistent with the
priority rule, we find that trust preferred enjoyed greater benefits from TARP issuance than
did non-trust preferred for both forced and non-forced banks on October 14. In contrast, there
is no clear priority rule effect on the approval dates for non-forced banks.

3
Introduction
On October 14th, 2008, the U. S. Treasury announced that the largest U.S. banks
would necessarily receive TARP capital through forced issuance of preferred stock and that
other (smaller) banks could later apply to issue TARP preferred stock but would not be forced
to issue preferred stock. The financing choice, preferred stock, was surprising and anticipated
by very few if any. According to Landler and Dash (2008), even the bank CEOs present at
the meeting were surprised and some had to be coaxed into the plan to issue preferred stock.
Pre-existing preferred stockholders would seem obviously affected by TARP
preferred issuance. Interestingly, Veronesi and Zingales (2009) estimate that there was a
greater absolute total impact upon existing preferred stock than upon common stock in the
forced banks.1 In their analysis of preferred, Veronesi and Zingales (2009) correctly maintain
that many shares of preferred stock do not trade frequently enough to make a credible
analysis of the change in value of each outstanding preferred stock and thus their estimate of
the impact upon total preferred stock valuation of a firm is based only upon the most recently
issued preferred stock of the bank that was actively traded. In contrast, we find trading in
numerous other preferred shares was quite active thus allowing us to analyze important
differential preferred valuation impacts described below.
Many banks issuing TARP preferred had various different issues of preferred stock
outstanding with widely varying features. For example, among forced banks, Bank of
America had 56 issues outstanding where there was great variation in features. One broad
and important way to classify preferred is trust preferred (TP) versus non-trust preferred
(NTP). Trust preferred stock is a relatively new and controversial instrument that has been a
popular way for banks to raise capital in recent years.
The purpose of this research is to determine the impact of the largest government
1 The large banks in their study were Bank of America, Bank of NY Mellon, Citigroup, Goldman Sachs,
JPMorgan Chase, Merrill Lynch, Morgan Stanley, State Street Corporation, Wachovia, and Wells Fargo.

4
financial intervention ever upon different types of existing bank preferred stock.
Fundamental theory says that any security issuance should be a concern to those with claims
on the firm’s cash flows where one may be particularly concerned about claims of similar
seniority. We focus upon the above two classes of preferred. That is, what were the
differential impacts of TARP upon the value of pre-existing 1.) trust preferred (TP) and 2.)
non-trust preferred (NTP) of banks issuing TARP preferred stock? We present alternative
theory and hypotheses for the impact of TARP on these two classes of preferred stock. TP
may have the strongest reaction because the issuance of TARP preferred created more assets
financed by a lower priority claim. There is no such clear positive priority effect for NTP
because TARP preferred had equal seniority to NTP. Alternatively, NTP may exhibit the
stronger reaction because the announcement of TARP preferred issuance may have more
strongly reduced the near term probability of runs and loss due to default for lower priority
claims such as NTP.
As pointed out by Myers and Majluf (1984) and Miller and Rock (1985), new
issuance may convey unfavorable endogenous information thus confounding tests of the
priority rule. New information suggested by issuance of a particular type of security affects
other security prices by revising investor forecasts about the value of the issuing firm. For
example, issuance of junior debt may convey unfavorable information about the value of the
firm, thereby negatively affecting the value of senior debt. In such a setting, priority rule
effects will not be cleanly tested since it is very difficult to separate the priority rule effect
from the endogenous information effects. Therefore, previous studies that have investigated
the impact of the issuance of a type of security on the other type of security might fail to
separate the priority rule effect from the information effect.
Our study overcomes this problem by comparing the impacts of the issuance of TARP
preferred stock on the two types of existing preferred stock with different priorities of claims.
5
Any potential differential impacts on TP and NTP result from the difference in seniority of
TP and NTP. Therefore, comparing the differential impacts of TARP preferred stock issuance
on TP versus NTP provides an ideal setting to purely test the impact of the priority rule on
the values of individual classes of claims.
Of course, one may ask the same questions of both forced and non-forced banks.
Additionally, did the impact of TARP issuance on non-forced smaller banks differ from that
of forced banks? We ask this because conditions surrounding TARP issuance for non-forced
were much different than for forced banks. Obviously, non-forced banks had to be approved,
and had a choice of whether to issue or not issue.
Making the situation even more interesting, the news that a non-forced bank applied
and was approved to issue reflected very complex information.2 That is, some investors may
have perceived approval to issue as a sign of weakness (the bank needed special access to
capital) while other investors may have seen the approval as a strong indication that the bank
was healthy enough to be permitted to issue TARP preferred. Furthermore, some investors
may have seen TARP as a smart, inexpensive subsidized way to raise capital while, on the
other hand, other investors may have seen it as an unwelcome opportunity for the
government to impose undesirable restrictions and regulations on the bank which would
reduce future flexibility and profitability.
Relatively little attention has been paid to preferred equity issuance in the finance
literature. However, according to Kallberg, Liu, and Villupuram (2008), from 1999 to 2005
U.S. firms issued over $868 billion in preferred stock while raising only $374 billion through
common equity IPOs and only $590 billion through seasoned equity offerings. TARP
preferred stock substantially increased the amount of outstanding bank preferred stock. For
example, the TARP plan increased the outstanding preferred stock of JPMorgan Chase from
2 The public was not informed that a bank had applied and not been approved. Only eventual acceptance of an
application was public.

6
$8.1 billion (third quarter of 2008) to $31.94 billion (fourth quarter of 2008). Furthermore,
State Street bank had no preferred stock outstanding. We note that the impact of preferred
stock issuance on the banking firm’s capital structure had become an important issue even
before October 2008. Kwan (2009) notes that due to economic conditions occurring before
October 2008, many banks were raising capital by issuing preferred stock. Salutric and
Wilcox (2009) report a very strong growth in number of bank holding companies with
preferred stock outstanding in the last decade.
We find that consistent with the priority rule, TP for forced banks clearly enjoyed
greater returns than NTP for forced banks on October 14. TP appears to have benefited more
from the forced TARP preferred issuance than NTP because the TARP issuance provided an
additional asset base for TP. Any potential greater reduction in default risk for NTP was not
strong enough to dominate this effect. In addition, weaker forced banks realized greater
benefits from TARP.
With regard to the difference between TP and NTP for non-forced banks, TP had a
stronger positive return for the October 14 TARP announcement but not for the approval
announcement. It appears that the market expected some banks to apply for and receive
TARP upon the October 14 announcement. For non-forced banks the evidence regarding TP
and NTP pooled is that there was a positive return for the announcement of approval to issue
TARP preferred. That is, the market seems to have perceived approval to issue TARP
preferred as net favorable information. Like weaker forced banks, we find that weaker non-
forced banks realized greater benefits.
Section one describes the financial crisis that peaked in 2008 and alternative
hypotheses about the impact of TARP preferred upon previously existing preferred. We
include financial theory and hypotheses for why announcement effects may differ due to
firm-specific and security-specific characteristics such as TP and NTP, and, also, why the

7
pattern of TARP announcement effects may differ across forced and non-forced banks. The
second section describes the data and the results are reported in the third section. We present
conclusions in the last section.
1. The Crisis and Hypotheses
In 2008 the U. S. financial system was frequently in turmoil where one of the most
important events was the September 15 Chapter 11 bankruptcy of Lehman Brothers. It was
the largest bankruptcy filing in U. S. history and made some suspect that the world’s financial
system was at risk of failing. A few days later, September 18, in an effort to convince world
markets that the U.S. financial system would not fail, the U. S. Treasury proposed a $700
billion system wide plan to provide any needed rescue where the plan was called TARP
(Troubled Asset Relief Program). Previous (summer 2008) preliminary plans had frequently
advocated using the rescue funds for government purchase of troubled assets, such as
stressed mortgage backed securities, from banks. The plan was very controversial in
numerous ways and on September 30, the House of Representatives defeated President
Bush’s TARP plan. On October 3, 2008, TARP finally passed Congress assuring that $700
billion of some type of aid was forthcoming. However, this legislation did not designate how
the aid would be administered. The U.S. stock market did not seem impressed with the TARP
plan as stock indices declined dramatically in the week after the October 3 TARP passage; for
example, the S&P 500 declined more than 10%.
How would the $700 billion of aid be administered and how would it affect bank
balance sheets? Purchase of troubled assets was allowed by the October 3 passage of TARP
but was very controversial. Some suggested the Treasury should buy common stock of banks
but this was strongly criticized partially because, for example, common stock ownership
would give a strong appearance of government-owned banks due to common stock holder

8
voting rights.
The surprising final form of the TARP program for banks turned out to be U. S.
Treasury purchase of bank preferred stock. More specifically, the preferred was NTP stock
paying a 5% dividend for the first five years where, after five years, the rate would be reset at
9%. The TARP preferred stock had no maturity date (perpetuity) and qualified as Tier 1
capital. Importantly, the priority ranking of payment was equal to NTP but junior to TP.3
There were no voting rights except for authorization of shares senior to senior preferred.4
Warrants to purchase common stock (with a term of 10 years) having aggregate market price
of 15% of TARP preferred were attached. Redemption rules were complex as it was not
redeemable for three years except from a qualified common equity offering which resulted in
gross proceeds to the bank of not less than 25% of the issue price of TARP preferred. After
three years, it was redeemable in whole or in part at any time.
1.1 Hypotheses on the Impact of TARP Preferred Issuance: Forced Banks
Previously existing preferred stock on bank balance sheets (before October 2008)
was heterogeneous with regard to seniority. See Table I for seniority variation of bank claims.
Rose and Hudgins (2010) report that preferred stock had increased its share of bank financing
in the early part of the century partially due to the emergence of TP which is a hybrid security.
To issue a trust preferred stock, a firm creates a trust. The trust issues preferred stock to
investors and loans the proceeds to the issuing firm who, in turn, issues junior subordinated
debt to the trust. This process explains why TP stock has higher priority than NTP stock. Very
importantly, TP was considered Tier 1 capital and was particularly popular for large banks.
Classification as Tier 1 was controversial where many analysts suggested it should be
disallowed where we note that Dodd-Franks legislation passed in 2010 does not permit TP to
3 See http://bankbryancave.com/tarp-capitial-faq/ 4 Also, there were voting rights for amendments to the rights of senior preferred and mergers and other events
which could adversely affect rights of senior preferred.

9
be considered Tier 1 capital.
It is clear that bank preferred stockholders had much to fear in the fall of 2008 as
many preferred stockholders suffered large losses when firms failed or were reorganized just
prior to October 2008. Lehman Brothers, Washington Mutual, Fannie Mae and Freddie Mac
were all cases where preferred claims were essentially erased by the resolution of firm
failure.5
Numerous researchers have empirically examined the impact of an issuance of one
type of security on the value of common equity. For example, with respect to the impact of
security issuance on common equity, Mikkelson and Partch (1986) and Eckbo (1986)
document an insignificant common equity price reaction to debt issuance. Spiess and
Affleck-Graves (1999) find that straight and convertible debt issuance lead to significantly
negative abnormal common equity returns in the long-term.6 In contrast, the impact of
security issuance upon existing preferred stock is scarce.7
Relative to our first hypothesis, given below, and the impact of security issuance on
outstanding debt, Linn and Stock (2005) investigate the impact of the issuance of a lower
priority claim, junior debt, upon a higher claim, senior unsecured debt. First, they
hypothesize that if junior debt is issued to replace bank debt, senior unsecured is enhanced
because claims of higher standing (bank debt) are eliminated. Second, and particularly
relevant to our analysis of preferred issuance, they hypothesize that if junior debt is issued for
investment purposes, the new issue provides an additional asset base for the senior unsecured
5 See Spence (2008) and Bary (2009). 6 According to the signaling theory of Ross (1977) and the pecking order theory of Myers and Majluf (1984),
issuances of securities disclose information on the value of the issuing firm. For example, the signaling model
of Ross (1977) predicts that leverage-increasing announcement conveys favorable information. On the other
hand, the pecking order theory of Myers and Majluf (1984) suggests that external financing announcements
convey unfavorable information. Denis (2004) argues that managers signal their confidence in the firm’s
prospects by agreeing to issue a senior claim like preferred stock. 7 Harvey, Collins, and Wansley (2003) find positive impacts of trust-preferred issuance on both equity and debt.
Kallberg, Liu, and Villupuram (2008) also investigate the impact of preferred issuance on both equity and debt.

10
debt, thus enhancing the value of senior unsecured debt.8
We present four hypotheses where the first and second apply to forced banks and the
third and fourth apply to non-forced banks.
Hypothesis 1a. Trust preferred (TP) stock of forced banks should have greater
returns than non-trust preferred (NTP) stock.
Table I shows the seniority of claims on banks where TP is senior to NTP. If the
priority rule holds, TP stockholders may benefit more from the October 14th announcement
than NTP stockholders because the issuance of TARP preferred stock, which is junior to TP,
provides an additional asset base. That is, there are more assets to a.) generate greater
revenue to service TP and b.) distribute to TP in event of bankruptcy. This effect is similar to
an issuance of common stock reducing the risk of the firm’s debt because the firm has greater
assets and is less levered. 9
Hypothesis 1b. Non-trust preferred (NTP) stock should have greater returns than
trust preferred (TP) stock.
8 Of course, numerous studies examine the impact of capital structure changes on the relationships among
different classes of securities that hold claims on firm value. Masulis (1980) considers the impact of an exchange of debt for existing preferred stock on existing preferred stockholder wealth. He argues that existing preferred stockholders could be better off by the conversion of preferred stock claims into debt claims. This is because the existing preferred stockholders replace lower priority claims with higher priority claims. In contrast, given incomplete protective covenants, existing debt holders could be hurt because lower priority claims are elevated to equal priority claims. Relatedly, Nash, Netter and Poulsen (2003) point out that issuing higher priority debt weakens an existing bondholder’s position in the stakeholder pecking order. 9 Another reason for TP returns to be greater than NTP returns is that conditions surrounding TARP preferred
issuance may be viewed as roughly similar to the conditions describing debt overhang (underinvestment).
Related to this, Veronisi and Zingales (2009) refer to a co-insurance effect. Banks were highly levered in
October 2008 and economic conditions suggested potential future scenarios where debt holders would not be
paid in full. Many U.S. Treasury and Federal Reserve economists likely hoped the banks would issue more
common equity to reduce the turmoil in financial markets but banks would certainly have to sell common equity
at depressed prices if they could sell common equity at all. A common equity issuance would likely have
benefitted claims on bank debt more than bank common equity claims; in other words, common equity would
potentially transfer wealth to bond holders and the value of existing common equity may have declined. The
same logic can be applied to existing NTP stock as NTP is, like common equity, a lower claim than debt. Thus
the value of existing preferred NTP could have declined upon TARP issuance whereas TP would not be affected
in such a process. In fact, TP may have benefitted at the expense of NTP in this process as TP is a higher claim.
The fact that the U.S. government intervened may have reduced the magnitude of debt overhang effects upon
returns but not eliminated debt overhang effects.
11
Given the uncertainty about the soundness of the financial system and how effective
TARP would be, we suggest there was very significant default (bankruptcy) and “run” risk
for both types of preferred stock before the October TARP plan was announced. In general,
one might expect lower priority claims to likely be more sensitive to changes in the firm’s
outlook. For example, common stock is typically thought to be more sensitive to changes in a
firm’s outlook than the firm’s debt and, furthermore, junior debt is typically thought more
sensitive to changes in the firm’s outlook than senior debt. Similarly, if the October 14 TARP
announcement reduced the overall default (run) risk of banks, then lower priority (NTP)
preferred stock claims may be more enhanced than higher priority (TP) preferred stock
claims.
To provide more details of how the default risk of NTP could be more reduced by
TARP, consider Figure 1 which gives comparative distributions of the value of the banking
firm first before (VB) and then after (VA) the October 14 announcement. Consistent with
Table I, we include the priority of different claims below the distributions. Before the
announcement (upper distribution) we suggest the expected value of the firm was lower and
the distribution had greater variance than after (lower distribution). Consider that before the
October announcement, any realized value of the firm below ����∗ meant a loss on NTP and
any value of the firm below ���∗ meant a loss for TP. Of course, the probability of a loss for
NTP is greater. The difference in areas (area below ����∗ compared to the area below
���∗ ) is the difference in default risk and this is Area (1) in the upper distribution. When these
critical values of the firm are applied to the lower (after announcement) distribution, which
has greater expected value and lower variance, the difference in probability of a loss has
declined to something less as given by Area (2). Thus, default and bankruptcy risk has
declined more on NTP than TP.
Figure 2 further illustrates the situation where, reflecting Area (1) above, we suggest
12
the difference in default risk between NTP and TP is DNB – DTB before the October 14
announcement. After the announcement, default risk declines to DNA for NTP and DTA for TP.
NTP default risk may have declined more such that DNB-DTB > DNA-DTA reflecting Area (1)
being greater than Area (2) in the prior figure. As given in the figure, the default discount of
NTP relative to TP has declined and NTP may thus enjoy a greater return from the
announcement that TARP preferred stock would be issued by the forced banks.
As evidence that default risk could potentially decline more for NTP than TP, we
consider a day where assumedly favorable news reducing the likelihood of default was
released. As mentioned above, on September 18, 2008 the Treasury announced that the
government was very willing to provide an injection of funds into the financial system to
prevent widespread panic but, as stated above, did not specify the nature of the injection.
This was apparently received as very positive news because bank stock prices rose
dramatically soon after September 18.
We gathered matching pairs of September 18, 2008 TP and NTP raw returns. For the
match, we first required the two matched preferred stocks to have the same issuer. Second,
the matches were required to have similar maturities and dividend yields. We allowed a
maximum of one year’s difference for maturity. For a perpetuity, our match required at least
59 years maturity. Regarding dividend yield, we allow a maximum of one percent difference.
These criteria resulted in sixteen TP/NTP pairs as given in panel A of Table II. In
nine of these pairs, the raw return for NTP was greater than TP and, also, the average return
(0.137) for NTP was greater than the average return (0.102) for TP in panel B of Table II.
Furthermore, we additionally treated each firm’s preferred stock as a portfolio of individual
returns in which case there were four portfolios where NTP was greater and one portfolio
where TP was greater. In summary, this table suggests that there clearly are cases where NTP
returns can be stronger than TP returns due to news that can be construed as reducing credit

13
risk and default potential. Of course, unlike the October 14 announcement, this particular
news event did not have an indication that preferred stock would be issued.
Hypothesis 2: The greater the Treasury OVERPAYMENT for TARP preferred
stock, the greater the returns to pre-existing preferred stock.
There was strong agreement that the U.S. Treasury overpaid for TARP preferred
stock by purchasing 5% dividend yield preferred. According to Wilson and Wu (2009), just
prior to the government capital infusion, the preferred stock of many of the banks receiving
TARP funds traded at yields between 9.62 percent and 11.7 percent.10 The government’s
overpayment for TARP preferred stock thus led to a favorable, low cost of funds for the
banks. Such a favorable funding source may have resulted in an increase in preferred
stockholders’ wealth. Table III shows average preferred stock yields and overpayment,
defined as the difference in preferred yield just before TARP and the 5% of the TARP
preferred.
We suggest that the degree of overpayment may be related to the idea that some
forced banks voluntarily participated (VB banks) in TARP while others were largely
involuntary participants (IVB banks). VBs are roughly represented by those associated with
greater overpayment in Table III whereas IVBs are those with lesser overpayment. Preferred
stock yields reflect risk premia and a bank paying a higher risk premium was more likely to
benefit from the government rescue and overpaying for TARP preferred. Based on this
reasoning, we classify Morgan Stanley, Citigroup, and Bank of America as VBs, and, in
contrast, Goldman Sachs, JPMorgan Chase, Bank of NY Mellon, and Wells Fargo as IVBs.
VBs may realize greater returns than IVBs as they more clearly needed the help and paid for
the needed funding at below market yields.
10 See Wilson and Wu (2009) and Veronesi and Zingales (2009).

14
1.2 Hypotheses on the Impact of TARP Preferred Issuance: Non-Forced Banks
Non-forced banks were also part of the TARP preferred stock program and some of
the above theory and hypotheses obviously also applies to non-forced banks. However, we
now note some important differences for analysis of non-forced banks. Smaller banks were
not forced to issue preferred stock, i.e. they had an option of applying or not applying.
Additionally, the U.S. Treasury announced that banks that were particularly weak and in
danger of failing would not be approved. Some banks may have applied to issue TARP
preferred stock in order to signal to the market that they were healthy enough to receive
TARP. On the other hand, some banks likely took pride in not applying for TARP funds and
thought that the lack of need for TARP signaled strength. If a bank did apply, the Treasury
would grant (or not) preliminary approval. If a bank was denied, there was no public
announcement. In summary, for non-forced banks, we observe that the timing of the non-
forced TARP issuance was not a surprise (exogenous) financing requirement forced on the
bank. Instead, for a non-forced bank, TARP financing was an endogenous decision of the
non-forced bank. Assumedly this decision was based on what was thought best for the non-
forced bank in a complex economic environment where factors exogenous to the particular
bank were important.
For purposes of brevity, we call our sample of smaller banks with actively traded
existing preferred stock outstanding that subsequently soon issued TARP preferred (before
2009) non-forced banks. Of course the same questions plus additional questions can be posed
about their participation and the impact on their existing preferred stock.
Consideration of two obviously separate events for non-forced banks (that ultimately
issued TARP preferred stock) leads to the following hypothesis. These two events are a.) the
October 14 announcement and b.) the subsequent approval day for a non-forced bank. See
Figure 3.
15
Hypothesis 3a: Any potential difference in returns between TP and NTP resulting
from hypothesis 1a (priority effect) or hypothesis 1b (default effect) occurred on the October
14 TARP announcement date. That is, expectations were formed on October 14 with regard
to which non-forced banks would apply for and receive TARP.
Simply put, the October TARP announcement contained information that TARP
capital would also be available to other “healthy” banks that would apply for TARP. If the
market expected a particular bank to apply for and receive TARP upon the October 14
announcement, the prices of TP and NTP would reflect this expectation on the October 14
announcement date.11
Hypothesis 3b: Any potential difference in returns between TP and NTP resulting
from hypothesis 1a (priority effect) or hypothesis 1b (default effect) occurred on the date the
bank was approved to issue TARP preferred.
That is, on October 14 the market for bank preferred stocks may have been slow to
realize the application procedures for non-forced banks to issue TARP preferred. Furthermore,
banks themselves may have been indecisive concerning the wisdom of applying for TARP.
Thus, any potential impact on TP versus NTP, described in hypothesis 1a (priority effect) or
hypothesis 1b (default effect), may have been delayed until approval date. In other words,
only weak expectations were formed on October 14 with regard to which non-forced banks
would be approved for TARP.
Given the complexities surrounding TARP issuance for non-forced banks, an
important question is whether the announcement of TARP approval was good or bad news
for existing preferred stockholders.
Hypothesis 4a: The approval day impact upon the pool of preferred stock (TP and
11 O’Hara and Shaw (1990) examined how the announcement that some banks were “too big to fail” affected
stock prices of banks. They find that investors reacted to Wall Street Journal reports of a list of banks that were
expected to be announced as too big to fail by the Comptroller of the Currency. Curiously, the Wall Street
Journal list turned out to be different from the Comptroller’s list.
16
NTP pooled) was positive.
As mentioned above, announcement of approval could be construed as good news by
investors if it meant the bank had passed a test as being healthy enough to issue TARP.
Also, approval may be construed as good news because the bank may have found an
inexpensive source of preferred financing where this is clearly related to the government
overpayment for TARP preferred.
Hypothesis 4b: The approval day impact upon the pool of preferred stock (TP and
NTP pooled) was negative.
On the other hand, the news of approval to issue TARP preferred may have been
negative because investors may have perceived such an announcement as an admission that
the bank needed help, and furthermore, the government would be inefficiently intervening in
the management of the bank. More specifically, TARP issuance forced such banks to accept
government regulations that could hinder future bank profitability and reduce returns for
preferred stockholders. For example, banks taking TARP funds had to accept limits on
employee pay where the common complaint was that banks could not retain and attract the
best talent. According to Ertimur, Ferri, and Stubben (2010), firms receiving TARP funds
must hold an annual advisory vote on executive compensation. Furthermore, the TARP
program imposed complex dividend restrictions on preferred stock. Finally, the government
had the right to change the terms of the TARP issuance at any time until the funds were
repaid.12
12 Yet another interesting question concerns the size of the issue relative to total assets for non-forced banks.
For forced banks, the amount of TARP to be issued was prescribed and forced by the Treasury such that the
banking firm had no choice on size of issue. We suggested above that some forced banks wanted to issue TARP
preferred whereas others did not (voluntary versus involuntary). If a forced bank had been permitted to choose
the size of issue and also clearly needed a preferred capital infusion (VB), it could well be that the more TARP
preferred the better for the bank. On the other hand, if a forced bank did not want to issue any TARP preferred
(IVB), the less the better. The scenario for non-forced banks was different. That is, it is logical to assume the
bank, having an option, actually wanted to issue TARP preferred and also chose, up to the mandated limit, the
amount thought optimal for the bank. Non-forced banks choosing to issue more TARP apparently foresaw
greater benefit to the optional government program. However, size of issue for non-forced banks turned out to
not have a significant effect in our empirical results.

17
2. Data and Methodology
The data for forced preferred stock prices, TP versus NTP classification, maturity,
dividend yield, and rating were obtained from the Bloomberg information system. We restrict
the sample to nonconvertible preferred stock that traded on more than 100 dates before TARP
in the period November 1, 2007 to October 6, 2008 in order to assure credible pricing
information. The forced-bank sample includes 121 preferred stocks of which 53 are TP while
68 are NTP. Maturities range from November 30, 2009 to perpetual maturity. Preferred
stock ratings obtained from S&P preferred stock ratings range from upper medium class to
very speculative class.
The forced sample with respect to issuing bank, TP versus NTP, callability, and
dividend are summarized in Panel A of Table IV. Bank of America clearly had the most
different preferred shares outstanding with 56 while Morgan Stanley had 22. Note that State
Street had no preferred (neither TP nor NTP) outstanding. Bank of NY Mellon had only TP
outstanding. The Bank of America preferred stock included preferred stock of Merrill Lynch
while Wells Fargo preferred stock included preferred stock of Wachovia as it was announced
Bank of America (Wells Fargo) would take over Merrill Lynch (Wachovia) before October 14,
2008.13
For non-forced banks, the data is similarly gathered from Bloomberg and given in
Panel B of Table IV. The criteria for inclusion in the sample of non-forced banks were the
same as for forced: traded on more than 100 dates before TARP in the period November 1,
2007 to October 6, 2008. The TARP preferred in the non-forced sample was announced as
approved between October 24 and December 23, 2008.
13 In regressions reported later, firm characteristics of Bank of America and Wells Fargo were combined with
those of Merrill Lynch and Wachovia.

18
To measure returns or abnormal returns for each preferred stock we used raw returns,
the mean-adjusted return, and the OLS market model returns.14 Mean-adjusted returns, as
described by Brown and Warner (1980, 1985) and others, are the returns over the event
windows less the average returns from a recent extended time frame. For our analysis, we use
the average of November 1, 2007 to October 6, 2008. The S&P preferred index was used as
the market index. The beta was estimated using daily returns from November 1, 2007 to
October 6, 2008. We calculated raw returns or abnormal returns for four different windows
where we emphasize the two-day event window (-1,0); that is, the period from close October
12 to close October 14. This is because U.S. Treasury Secretary Henry Paulson held a
meeting with the CEOs of the nine largest banks on October 13th and the Treasury announced
its plan to purchase bank preferred stock on October 14th.15
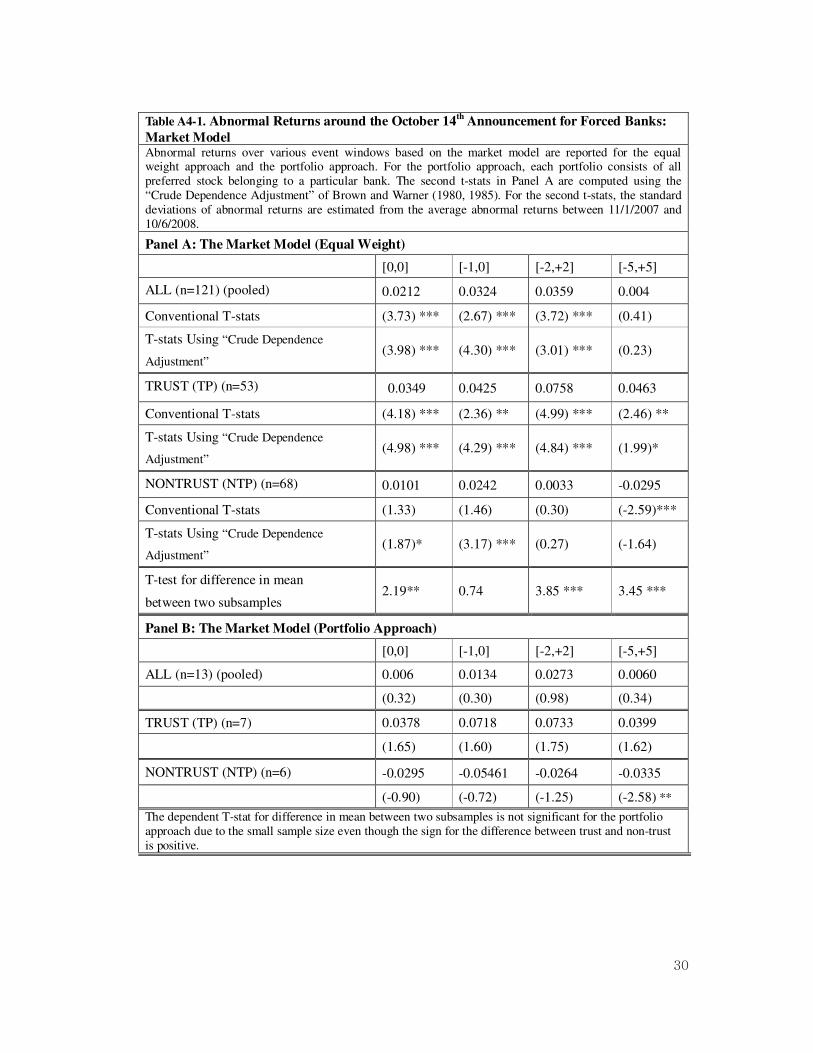
Even though we report raw, mean-adjusted, and market model returns, we feel the
following comment critical of market model returns is appropriate where we note market
model returns are reported in the appendix. If one estimates the excess return on existing
preferred with a market model, where betas are estimated, the positive impact of the October
14 announcement is clearly underestimated because the market return was strongly
(positively) affected by the announcement. That is, the market model leads to biased results if
the event study focuses on the impact of an event on abnormal returns and the event
14 See Brown and Warner (1985) for a comparison between the mean-adjusted model and the market model.
Linn and Pinegar (1988) used the mean-adjusted model in their examination of the effects of preferred stock
issuance on preferred stock returns. On the other hand, Veronesi and Zingales (2009) used the market model
based on the S&P 500 index in their event study on preferred stock. Our market model is based on the S&P
preferred index. The S&P preferred index represents the U.S. preferred stock market by including all preferred
stocks issued by U.S. corporations and those trading in major exchanges. To our best knowledge, no previous
event study on preferred stock has been done using the S&P preferred index. 15
U.S. Treasury Secretary Henry Paulson called the CEOs of the nine largest banks to a meeting at 3:00 p.m.
on October 13th, and the CEOs turned in their time sheets by 6:30 p.m. According to the Dow Jones News
Service, at 5:10 p.m. on October 13th, the Wall Street Journal reported that the nine largest banks would receive
TARP capital through issuance of preferred stock. On October 14th, the Treasury announced its plan to purchase
preferred stock of the nine largest banks.
19
influences the market index. If this is the case, it does not make sense to control for the
market movement since the market movement was also affected by the event.16 In light of
the above, it would seem that using mean-adjusted returns and, also, using raw returns, are
better approaches than the market model because they do not underestimate the response of
our sample preferred stocks.
3. Empirical Results
We now examine the realized reaction of different preferred stock issues to the
October TARP announcement in Tables V through IX with forced results reported in Tables V
to VII and non-forced results reported in Tables VIII and IX. Did TP or NTP experience
greater returns? We first report the event study for banks forced to issue TARP preferred. We
immediately follow this event study with a cross-sectional regression of forced banks to help
analyze how the effects may have varied due to firm and issue-specific effects such as TP
versus NTP, Treasury overpayment for TARP preferred, and such control variables as
callability, maturity, and credit rating.
After the analysis of forced banks, we then examine the reaction of non-forced banks
that announced they had been approved to issue TARP preferred stock soon after the October
TARP announcement. Did any difference in TP and NTP returns occur on the October 14
announcement, or the approval day, or both? Did the approval announcement have a positive
or negative impact on non-forced returns? These questions about non-forced banks are
answered with event studies (for both October 14 and approval day) followed by regression
analysis of returns.
16 We attempted to create an index consisting of only non-financial institutions. However, we note that non-
financial institutions also showed high raw returns on Oct. 13 and Oct. 14. The average raw returns for non-
financial institutions whose preferred stock price information was available on Bloomberg was 17.88% on [-1,0]
while those for financial institutions was 20.74%.
20
3.1 Forced Bank Empirical Results
Table V represents the event study results for forced banks. There are four different
windows (0,0), (-1,0) (-2,+2), and (-5,+5) where (0,0) is the close of October 13 to close of
October 14 and (-1,0) is the close of October 12 to close of October 14. There are four panels
composed of raw and mean adjusted returns. For each type of return there is 1.) an equal
weighted return which is an average of all individual preferred stocks and 2.) a portfolio-
based return which is the portfolio (all preferred of a particular bank) average return of all
forced banks. In Panels B and D for portfolio returns, the ALL portfolio has only 13
portfolios where each bank (except Bank of New York Mellon) had a portfolio of both TP
and NTP.17 Thus, there are only 7 TP portfolios and 6 NTP portfolios in Panels B and D.
The first line in each of the four panels (All) does not distinguish between TP and
NTP and thus reflects the generalized average reaction of all (TP and NTP pooled) preferred
stock. For example, the raw returns for all preferred stock in the (-1,0) window of Panel A is
0.2467 (24.67%). Immediately below that line we give both the conventional T-statistics and,
also, T-statistics using the crude dependence adjustment of Brown and Warner (1980, 1985).
For the (-1,0) window the conventional T-statistic is 15.68 and the crude dependence
adjustment T-statistic is 9.53 where both are clearly positive and significant. Thus the impact
of the October 14 announcement upon TP and NTP treated as a combined pool of preferred
stock is to enhance existing preferred stock value.18
17 As noted above, Bank of New York Mellon had only TP and State Street had no preferred outstanding.
18 There are two reasons for expecting a pooled positive reaction. First, in early October 2008, the risk that
some banks could become bankrupt thus causing default for some claim holders, including preferred stock, was significant. Veronesi and Zingales (2009) computed the probability of early bankruptcy less that of later bankruptcy and suggested the difference is an indicator of the likelihood of a run on the bank. Here a strong likelihood of a run suggests near term bankruptcy. In fact, for the forced banks, Veronesi and Zingales (2009) show that Citigroup, Wachovia and all three investment banks showed clear indications of a run. In our work, if TARP preferred issuance potentially reduces the near term risk of runs and early bankruptcy for existing preferred, then the impact could be positive. In other words, forestalled bankruptcy may have had a positive impact on existing preferred stock. A second reason to expect a positive reaction is that there was a strong agreement that the U.S. Treasury overpaid for TARP preferred stock. On the other hand, the effect could have been negative. That is, the requirement that large banks would have to issue preferred stock could be perceived as negative news for preferred stockholders because banks may have chosen alternative ways, mentioned above, to receive aid. Some may have wanted the Treasury to instead purchase troubled assets, as was commonly

21
3.2. Forced TP versus NTP Returns
The next lines in each panel show similar results for trust preferred (TP) returns
(only). Below that, non-trust (NTP) returns (only) are shown. Finally, we report a T-statistic
for the difference in mean between TP and NTP. For example, in the (-1,0) window, the T-
statistic for the difference is 5.72 which is clearly significant suggesting that TP returns are
stronger than NTP. Thus, hypothesis 1a is supported and hypothesis 1b is not supported. In
other words, the results support the priority rule hypothesis that TARP issuance provided a
significant additional margin of safety (asset base) for TP where this effect dominated any
potential stronger reduction in default risk of NTP. Note that in Panels B and D the small
sample sizes for the portfolio approach makes it extremely difficult to find statistical
significance. Still, the signs are positive as in Panels A and C and there is a large positive
difference in TP versus NTP.
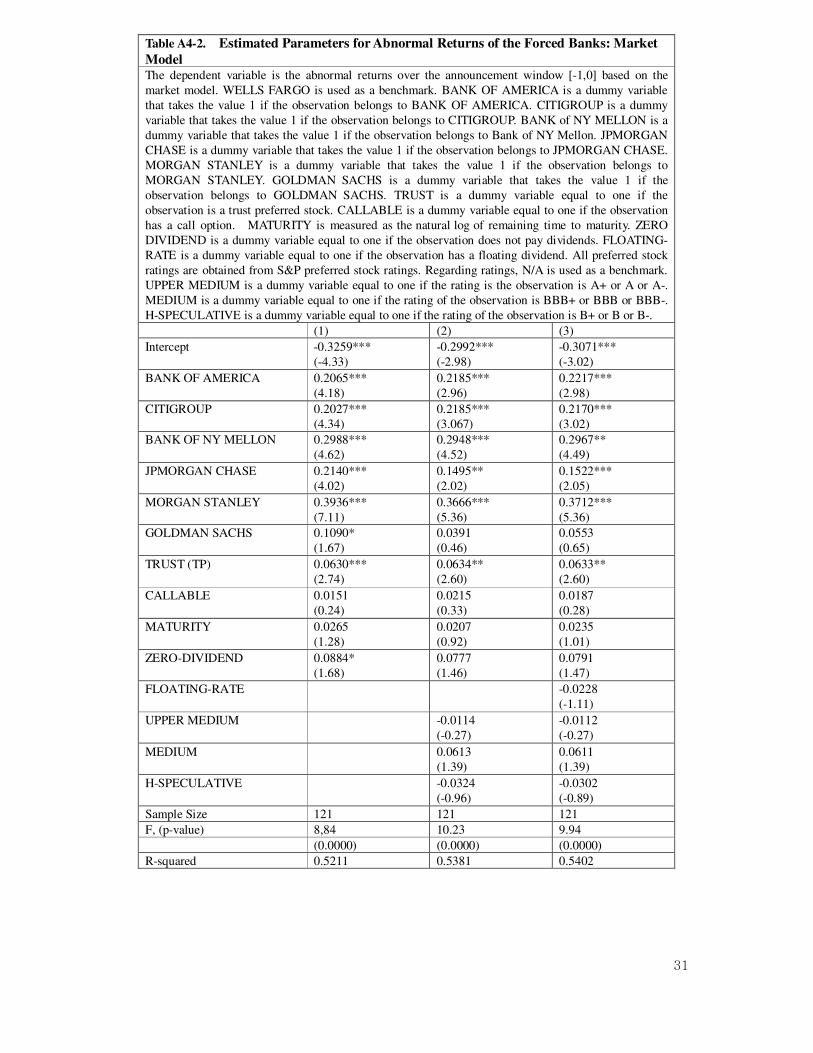
Table VI represents cross-sectional regression results of returns. Firm specific
characteristics are controlled by using dummy variables that refer to particular bank names.
Wells Fargo is used as the benchmark. Since Wells Fargo is one of Involuntary Banks (IVBs),
positive signs on Voluntary Banks (VBs) are expected. There are two panels consisting of
raw (Panel A) and mean adjusted (Panel B) returns. There are three different regression
specifications where certain independent variables are omitted. For our purposes, the most
important factor is the TP / NTP dummy where TP has value one and NTP is zero.
We include numerous control variables that may affect returns where the most
interesting control variable may be callability. That is, some preferred stock has an embedded
call option where the firm can redeem the claim at a specified price. The value of preferred
stock with a call will tend to decline with greater call value as the claim holder is short
(issuer is long) in the call option. One might suggest that callable preferred stock had greater
expected in the months before the October TARP program. Some forced banks were clearly not happy with the TARP preferred stock program and had to be coaxed to accept it.

22
returns than non-callable preferred stock due to the October 14 announcement. To support
this suggestion, King (2002) maintains that there is a positive relationship between default
risk and option value in bonds because of a higher volatility in the underlying instrument that
occurs due to greater default risk. If TARP reduces default risk and related volatility on
preferred stock, the call option value decreases and returns for callable preferred stock may
thus be higher than returns for non-callable preferred stock.
Alternatively, callable preferred stock may have lower returns than non-callable
preferred stock, as suggested by Lakshmivarahan, Stock, and Qian (2009). They note that the
preferred stock and any call value is extinguished upon default. Therefore, if TARP reduces
default risk, the call option value may increase and returns for callable preferred stock may
thus be lower than non-callable preferred stock.
We also control for other factors in addition to callability. Remaining time to
maturity is included as longer maturity securities would be expected to be more sensitive to
news. Also, a zero dividend is a dummy variable where the value is 1 if no dividend exists.
This is included as a volatility proxy because Bessembinder, Kahle, Maxwell, and Xu (2009)
argue that zero-coupon bonds are more volatile. Some stocks are floating rate and a floating-
rate dividend is a dummy variable equal to one although we have no particular expected sign.
Upper medium credit quality is a dummy variable equal to one if the rating is A+ , A or A-.
Medium is a dummy for middle range credit quality and H-Speculative is for B+, B and B-.
We use no rating (NA) as the omitted class.
Consistent with results in the above event study, Table VI shows that TP enjoys
greater returns than NTP. For example, the coefficients of TRUST in the three columns of
Panel A based upon raw returns are 0.1064, 0.1080, and 0.1073, respectively where all are
positive and clearly significant. Existing preferred stockholders of voluntary banks (VBs)
enjoy higher returns (and VBs have larger coefficients) than those of involuntary banks

23
(IVBs). As previously mentioned, Morgan Stanley, Citigroup, and Bank of America are
defined as VBs while Goldman Sachs, JPMorgan Chase, Bank of NY Mellon, and Wells
Fargo are defined as IVBs. Consistent with the idea that VBs (weaker banks) enjoyed greater
benefit, the coefficients on Morgan Stanley, Citigroup, and Bank of America are all
significant and positive when Wells Fargo (an IVB) is used as a benchmark. This supports
hypothesis 2.
Callable preferreds enjoyed greater returns than noncallable preferreds. This result is
consistent with the idea that there is a positive relation between default risk and option value.
That is, it seems likely that TARP strongly reduced default risk and volatility for preferred
stock and therefore reduced call option values. Zero-dividend preferred stocks show higher
returns than non-zero-dividend preferred stocks which is consistent with the idea that zero
dividend preferred is more volatile than preferred with a dividend. Preferred stocks with
longer maturity show higher returns, perhaps because preferred stock with longer maturity
enjoyed the reduction in the overall default risk of forced banks more than preferred stock
with shorter maturity; longer maturity instruments tend to be more sensitive to TARP.19 The
sign on the highest credit rating (upper medium) is negative suggesting that stronger credit
quality securities did not need the capital infusion as much as weaker quality securities.
Table VII presents an alternative cross-sectional specification. As opposed to the
previous table, which uses the particular bank names, firm specific characteristics are
included. That is, government overpayment for preferred (OVERPAY) and the ratio of TARP
capital infusion to total assets (SIZE) are included. Like the previous set of regressions, there
are panels for both raw and mean adjusted regressions and there are three different
specifications (columns) where certain independent variables are omitted.
The main results are again that TP enjoys stronger positive returns than NTP in all
19 For example, longer time bonds are more price sensitive to inflation and interest rate news as their coupon
stream is longer.
24
specifications. Furthermore, the greater the government overpayment, the greater the return.
However, the coefficient of size is not significant. Other results of Table VII are similar to the
previous regression. For a robustness check of Table VII, we also ran a separate regression to
correct for any potential clustering problem. Appendix Table A.1 shows that the TRUST
coefficient is robust and remains positive and significant.
We furthermore tried many other variables in the regressions of forced banks to
determine if they had significant effects but none were significant. For example, in Appendix
Table A.2, we show results for including Tier 1 capital as an explanatory variable.
Specifically, Tier 1 capital is defined as a bank’s Tier 1 capital divided by its total risk-
weighted assets. We included Tier 1 because one may have expected that banks with lower
Tier 1 capital ratios may have enjoyed a stronger return from issuing TARP preferred as it
was counted in Tier 1. However, the regressions do not show significance for this variable.
3.3 Non-Forced Bank Empirical Results
Table VIII contains analysis for banks not forced to issue preferred stock but who
chose to apply for approval after October 14 and were approved. As in Table V, Table VIII
shows panels composed of raw and mean adjusted returns. Again, for each type of return,
there are both the equal weight (individual issue) approach and the portfolio (all preferred of
a particular bank) approache. The difference from Table V is that Table VIII has two
windows as reflected in the last two columns. See Figure 3 for the windows used. The first
window is (-1,0) which is the same window (reflecting the October 14 announcement) as the
forced banks. The second window is the day the bank announced that it had received
preliminary approval for TARP preferred issuance.20
20
The sample sizes of all pooled preferred, TP, and NTP are different for (-1,0) and “upon approval”
announcement because a preferred stock is included in the sample only if trading occurs on the event window.
For example, in panel A, 54 preferred stocks traded in (-1,0) while only 50 preferred stocks traded on the
announcement window of approval for TARP.

25
As we did for forced banks, we first consider the impact of the announcement upon
all (pooled) preferred stock in Table VIII. For the October 14 window, which is the (-1,0)
window of the table, the announcement has positive and significant impact in the first lines of
Panels A,B, C, and D. The results for the approval window are also positive which supports
hypothesis 4a; that is, the preferred stockholders perceived the information that a firm was
approved for TARP preferred as positive news.
Did any differential between TP and NTP occur in the (-1,0) window because the
market expected non-forced banks to soon issue TARP preferred? Or, did any differential in
TP and NTP occur upon approval to issue TARP preferred? The results for comparing TP
versus NTP returns are that TP enjoyed greater returns than NTP only in the (-1,0) window
but not in the “approval” window which supports hypothesis 3a. For example, the T-statistic
for difference in mean between TP and NTP in Panel A is 5.27 in the (-1,0) window, but 0.00
in the “approval” window.21
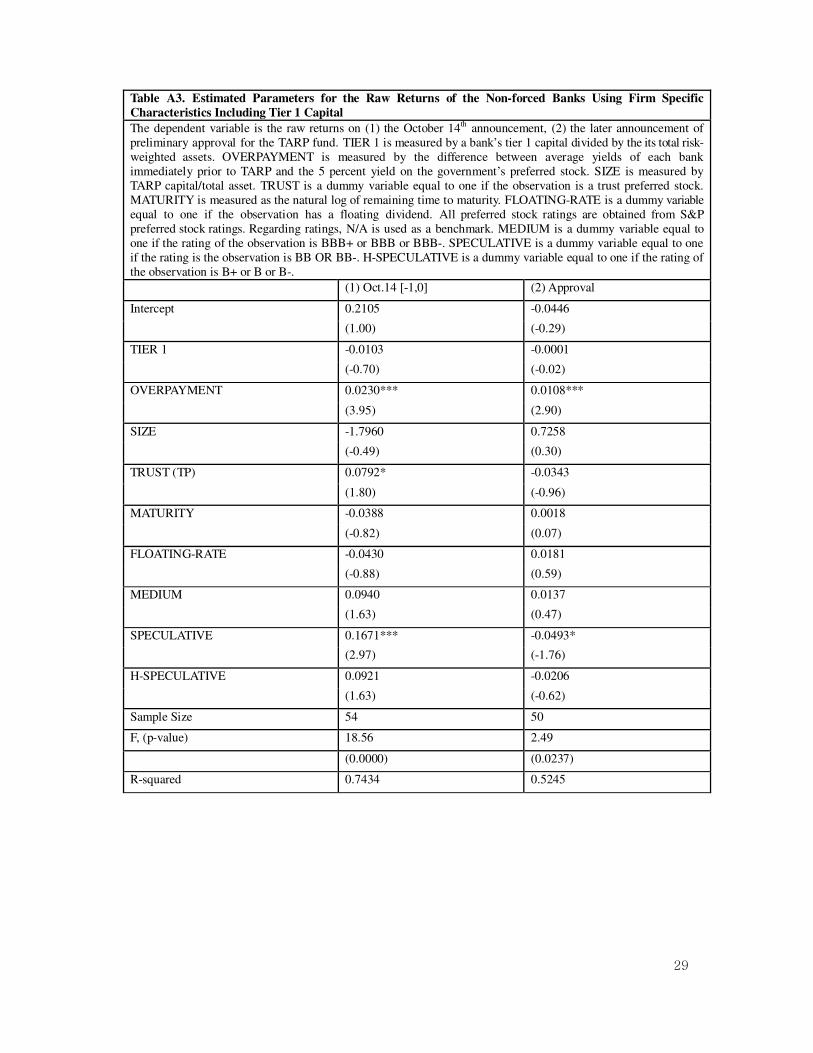
Table IX presents cross-sectional regression results for non-forced banks. Given that
non-forced banks tend to have fewer different preferred issues outstanding, it is
econometrically impossible to use bank names to control for firm specific effects. Instead,
firm specific characteristics such as OVERPAYMENT and SIZE are included. As for the
forced bank results, there are panels representing regressions for both raw and mean adjusted
returns for the two different windows. Table A3 of the appendix shows the results are robust
for adding such variables as Tier 1 capital.
The main results are that the non-forced banks show evidence of higher returns for TP
than NTP on October 14 but not their approval dates. In addition, supporting hypothesis 2,
we find strong evidence that OVERPAYMENT affected preferred stock return on October 14
and, also, the approval day. The other results are similar to those for forced banks.
21 The value is 8.29 for the T-statistic using crude dependence adjustment in the (-1,0) window.
26
4. Summary and Conclusion
The 2008 TARP program to stabilize the financial system resulted in large issuances
of preferred stock by numerous banks. We examine the impact upon the valuation of existing
preferred stock for two groups of banks: large forced banks and smaller non-forced banks.
The forced group provided evidence that TP stock experienced higher returns relative to NTP
stock for the October 14 TARP announcement, consistent with the priority rule. TP stock
appears to have benefited more from the TARP preferred issuance than NTP stock because
the TARP issuance provided an additional asset base for the TP. Any potential greater
reduction in default risk for NTP was not strong enough to dominate this effect.
For non-forced banks it appears that the market expected some banks to apply for and
receive TARP upon the October 14 announcement. In addition, the evidence regarding non-
forced pooled preferred stock is that there was a positive return for the announcement of
approval to issue TARP preferred. The market seems to have perceived application and
approval to issue TARP preferred as favorable information for preferred stockholders even
though government interference in bank ownership concerned many investors.
In summary, TARP benefited some investor groups more than other investor groups.
Existing preferred stockholders of more voluntary banks likely enjoyed higher returns than
those of involuntary banks. This might explain why Wells Fargo chairman Richard
Kovacevich said that Wells Fargo, which was classified as one of the involuntary banks in the
sample, would not have issued TARP preferred if Wells Fargo had not been forced to.
In addition, it seems likely that TARP transferred wealth from one group to another
group. Our results are consistent with the perception of government overpayment for
preferred stock. In other words, TARP transferred wealth from taxpayers to preferred
shareholders. Taxpayers seemed to specially subsidize preferred stockholders of selected
weaker banks.

27
Appendix
Table A1. Regressions Adjusting for Clustering for Forced banks
The dependent variable is the abnormal returns based on the mean-adjusted model. Abnormal returns are
corrected for heteroskedasticity and clustering. TRUST is a dummy variable equal to one if the
observation is a TP. CALLABLE is a dummy variable equal to one if the observation has a call option.
MATURITY is measured as the natural log of remaining time to maturity. ZERO DIVIDEND is a
dummy variable equal to one if the observation does not pay dividends. FLOATING-RATE is a dummy
variable equal to one if the observation has a floating dividend.
(1) (2)
Intercept
0.0844***
(2.69)
0.0785**
(2.58)
TRUST (TP) 0.1350***
(2.88)
0.1319***
(2.99)
CALLABLE 0.1342*
(1.83)
0.1305*
(1.77)
MATURITY -0.0024
(-0.10)
0.0024
(0.11)
ZERO-DIVIDEND 0.0548
(1.15)
0.0564
(1.15)
FLOATING-RATE -0.0431
(-0.96)
Sample Size 121 121
R-squared 0.2699 0.2752

28
Table A2.... Estimated Parameters for the Raw Returns of the Forced Banks Using Firm Specific
Characteristics Including Tier 1 Capital
The dependent variable is the raw returns over the announcement window. TIER 1 is measured by a bank’s tier 1
capital divided by its total risk-weighted assets. OVERPAYMENT is measured by the difference between average
yields of each bank immediately prior to TARP and the 5 percent yield on the government’s preferred stock. SIZE
is measured by TARP capital infusion over total assets, TRUST is a dummy variable equal to one if the
observation is a trust preferred stock. CALLABLE is a dummy variable equal to one if the observation has a call
option. MATURITY is measured as the natural log of remaining time to maturity. ZERO DIVIDEND is a dummy
variable equal to one if the observation does not pay dividends. FLOATING-RATE is a dummy variable equal to
one if the observation has a floating dividend. All preferred stock ratings are obtained from S&P preferred stock
ratings. Regarding ratings, N/A is used as a benchmark. UPPER MEDIUM is a dummy variable equal to one if
the rating is the observation is A+ or A or A-. MEDIUM is a dummy variable equal to one if the rating of the
observation is BBB+ or BBB or BBB-. H-SPECULATIVE is a dummy variable equal to one if the rating of the
observation is B+ or B or B.
(1) (2)
Intercept -0.6067*** -0.6391***
(-5.43) (-5.62)
TIER 1 1.0363 0.7276
(1.03) (0.70)
OVERPAYMENT 0.0681*** 0.0733***
(6.81) (6.77)
SIZE -0.3499 3.0632
(-0.06) (0.50)
TRUST (TP) 0.1295*** 0.1297***
(5.33) (5.22)
CALLABLE 0.1912*** 0.1956***
(3.47) (3.55)
MATURITY 0.0416** 0.0352**
(2.55) (2.17)
ZERO-DIVIDEND 0.0910** 0.0888**
(2.14) (2.11)
FLOATING-RATE -0.0586**
(-2.24)
UPPER MEDIUM -0.0788** -0.0810**
(-2.38) (-2.45)
MEDIUM 0.0418 0.0446
(0.92) (0.94)
H-SPECULATIVE -0.0950** -0.0971**
(-2.50) (-2.55)
Sample Size 121 121
F, (p-value) 48.79 43.39
(0.0000) (0.0000)
R-squared 0.7288 0.7205
29
Table A3. Estimated Parameters for the Raw Returns of the Non-forced Banks Using Firm Specific
Characteristics Including Tier 1 Capital
The dependent variable is the raw returns on (1) the October 14th announcement, (2) the later announcement of preliminary approval for the TARP fund. TIER 1 is measured by a bank’s tier 1 capital divided by the its total risk-weighted assets. OVERPAYMENT is measured by the difference between average yields of each bank immediately prior to TARP and the 5 percent yield on the government’s preferred stock. SIZE is measured by TARP capital/total asset. TRUST is a dummy variable equal to one if the observation is a trust preferred stock. MATURITY is measured as the natural log of remaining time to maturity. FLOATING-RATE is a dummy variable equal to one if the observation has a floating dividend. All preferred stock ratings are obtained from S&P preferred stock ratings. Regarding ratings, N/A is used as a benchmark. MEDIUM is a dummy variable equal to one if the rating of the observation is BBB+ or BBB or BBB-. SPECULATIVE is a dummy variable equal to one if the rating is the observation is BB OR BB-. H-SPECULATIVE is a dummy variable equal to one if the rating of the observation is B+ or B or B-.
(1) Oct.14 [-1,0] (2) Approval
Intercept 0.2105 -0.0446
(1.00) (-0.29)
TIER 1 -0.0103 -0.0001
(-0.70) (-0.02)
OVERPAYMENT 0.0230*** 0.0108***
(3.95) (2.90)
SIZE -1.7960 0.7258
(-0.49) (0.30)
TRUST (TP) 0.0792* -0.0343
(1.80) (-0.96)
MATURITY -0.0388 0.0018
(-0.82) (0.07)
FLOATING-RATE -0.0430 0.0181
(-0.88) (0.59)
MEDIUM 0.0940 0.0137
(1.63) (0.47)
SPECULATIVE 0.1671*** -0.0493*
(2.97) (-1.76)
H-SPECULATIVE 0.0921 -0.0206
(1.63) (-0.62)
Sample Size 54 50
F, (p-value) 18.56 2.49
(0.0000) (0.0237)
R-squared 0.7434 0.5245
30
Table A4-1. Abnormal Returns around the October 14th
Announcement for Forced Banks:
Market Model Abnormal returns over various event windows based on the market model are reported for the equal weight approach and the portfolio approach. For the portfolio approach, each portfolio consists of all preferred stock belonging to a particular bank. The second t-stats in Panel A are computed using the “Crude Dependence Adjustment” of Brown and Warner (1980, 1985). For the second t-stats, the standard deviations of abnormal returns are estimated from the average abnormal returns between 11/1/2007 and 10/6/2008.
Panel A: The Market Model (Equal Weight)
[0,0] [-1,0] [-2,+2] [-5,+5]
ALL (n=121) (pooled) 0.0212 0.0324 0.0359 0.004
Conventional T-stats (3.73) *** (2.67) *** (3.72) *** (0.41)
T-stats Using “Crude Dependence
Adjustment” (3.98) *** (4.30) *** (3.01) *** (0.23)
TRUST (TP) (n=53) 0.0349 0.0425 0.0758 0.0463
Conventional T-stats (4.18) *** (2.36) ** (4.99) *** (2.46) **
T-stats Using “Crude Dependence
Adjustment” (4.98) *** (4.29) *** (4.84) *** (1.99)*
NONTRUST (NTP) (n=68) 0.0101 0.0242 0.0033 -0.0295
Conventional T-stats (1.33) (1.46) (0.30) (-2.59)***
T-stats Using “Crude Dependence
Adjustment” (1.87)* (3.17) *** (0.27) (-1.64)
T-test for difference in mean
between two subsamples 2.19** 0.74 3.85 *** 3.45 ***
Panel B: The Market Model (Portfolio Approach)
[0,0] [-1,0] [-2,+2] [-5,+5]
ALL (n=13) (pooled) 0.006 0.0134 0.0273 0.0060
(0.32) (0.30) (0.98) (0.34)
TRUST (TP) (n=7) 0.0378 0.0718 0.0733 0.0399
(1.65) (1.60) (1.75) (1.62)
NONTRUST (NTP) (n=6) -0.0295 -0.05461 -0.0264 -0.0335
(-0.90) (-0.72) (-1.25) (-2.58) **
The dependent T-stat for difference in mean between two subsamples is not significant for the portfolio approach due to the small sample size even though the sign for the difference between trust and non-trust is positive.
31
Table A4-2. Estimated Parameters for Abnormal Returns of the Forced Banks: Market
Model The dependent variable is the abnormal returns over the announcement window [-1,0] based on the
market model. WELLS FARGO is used as a benchmark. BANK OF AMERICA is a dummy variable
that takes the value 1 if the observation belongs to BANK OF AMERICA. CITIGROUP is a dummy
variable that takes the value 1 if the observation belongs to CITIGROUP. BANK of NY MELLON is a
dummy variable that takes the value 1 if the observation belongs to Bank of NY Mellon. JPMORGAN
CHASE is a dummy variable that takes the value 1 if the observation belongs to JPMORGAN CHASE.
MORGAN STANLEY is a dummy variable that takes the value 1 if the observation belongs to
MORGAN STANLEY. GOLDMAN SACHS is a dummy variable that takes the value 1 if the
observation belongs to GOLDMAN SACHS. TRUST is a dummy variable equal to one if the
observation is a trust preferred stock. CALLABLE is a dummy variable equal to one if the observation
has a call option. MATURITY is measured as the natural log of remaining time to maturity. ZERO
DIVIDEND is a dummy variable equal to one if the observation does not pay dividends. FLOATING-
RATE is a dummy variable equal to one if the observation has a floating dividend. All preferred stock
ratings are obtained from S&P preferred stock ratings. Regarding ratings, N/A is used as a benchmark.
UPPER MEDIUM is a dummy variable equal to one if the rating is the observation is A+ or A or A-.
MEDIUM is a dummy variable equal to one if the rating of the observation is BBB+ or BBB or BBB-.
H-SPECULATIVE is a dummy variable equal to one if the rating of the observation is B+ or B or B-.
(1) (2) (3)
Intercept -0.3259***
(-4.33)
-0.2992***
(-2.98)
-0.3071***
(-3.02)
BANK OF AMERICA 0.2065***
(4.18)
0.2185***
(2.96)
0.2217***
(2.98)
CITIGROUP 0.2027***
(4.34)
0.2185***
(3.067)
0.2170***
(3.02)
BANK OF NY MELLON 0.2988***
(4.62)
0.2948***
(4.52)
0.2967**
(4.49)
JPMORGAN CHASE 0.2140***
(4.02)
0.1495**
(2.02)
0.1522***
(2.05)
MORGAN STANLEY 0.3936***
(7.11)
0.3666***
(5.36)
0.3712***
(5.36)
GOLDMAN SACHS 0.1090*
(1.67)
0.0391
(0.46)
0.0553
(0.65)
TRUST (TP) 0.0630***
(2.74)
0.0634**
(2.60)
0.0633**
(2.60)
CALLABLE 0.0151
(0.24)
0.0215
(0.33)
0.0187
(0.28)
MATURITY 0.0265
(1.28)
0.0207
(0.92)
0.0235
(1.01)
ZERO-DIVIDEND 0.0884*
(1.68)
0.0777
(1.46)
0.0791
(1.47)
FLOATING-RATE -0.0228
(-1.11)
UPPER MEDIUM -0.0114
(-0.27)
-0.0112
(-0.27)
MEDIUM 0.0613
(1.39)
0.0611
(1.39)
H-SPECULATIVE -0.0324
(-0.96)
-0.0302
(-0.89)
Sample Size 121 121 121
F, (p-value) 8,84 10.23 9.94
(0.0000) (0.0000) (0.0000)
R-squared 0.5211 0.5381 0.5402
32
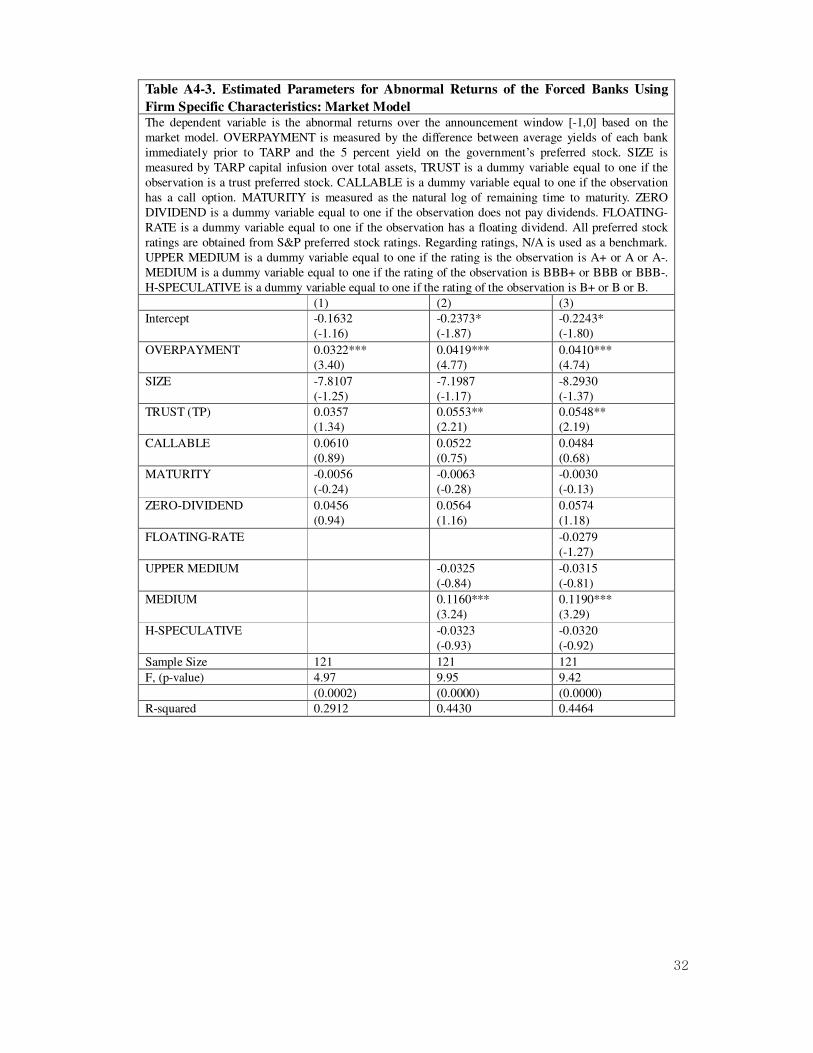
Table A4-3.... Estimated Parameters for Abnormal Returns of the Forced Banks Using
Firm Specific Characteristics: Market Model The dependent variable is the abnormal returns over the announcement window [-1,0] based on the
market model. OVERPAYMENT is measured by the difference between average yields of each bank
immediately prior to TARP and the 5 percent yield on the government’s preferred stock. SIZE is
measured by TARP capital infusion over total assets, TRUST is a dummy variable equal to one if the
observation is a trust preferred stock. CALLABLE is a dummy variable equal to one if the observation
has a call option. MATURITY is measured as the natural log of remaining time to maturity. ZERO
DIVIDEND is a dummy variable equal to one if the observation does not pay dividends. FLOATING-
RATE is a dummy variable equal to one if the observation has a floating dividend. All preferred stock
ratings are obtained from S&P preferred stock ratings. Regarding ratings, N/A is used as a benchmark.
UPPER MEDIUM is a dummy variable equal to one if the rating is the observation is A+ or A or A-.
MEDIUM is a dummy variable equal to one if the rating of the observation is BBB+ or BBB or BBB-.
H-SPECULATIVE is a dummy variable equal to one if the rating of the observation is B+ or B or B.
(1) (2) (3)
Intercept -0.1632
(-1.16)
-0.2373*
(-1.87)
-0.2243*
(-1.80)
OVERPAYMENT 0.0322***
(3.40)
0.0419***
(4.77)
0.0410***
(4.74)
SIZE -7.8107
(-1.25)
-7.1987
(-1.17)
-8.2930
(-1.37)
TRUST (TP) 0.0357
(1.34)
0.0553**
(2.21)
0.0548**
(2.19)
CALLABLE 0.0610
(0.89)
0.0522
(0.75)
0.0484
(0.68)
MATURITY -0.0056
(-0.24)
-0.0063
(-0.28)
-0.0030
(-0.13)
ZERO-DIVIDEND 0.0456
(0.94)
0.0564
(1.16)
0.0574
(1.18)
FLOATING-RATE -0.0279
(-1.27)
UPPER MEDIUM -0.0325
(-0.84)
-0.0315
(-0.81)
MEDIUM 0.1160***
(3.24)
0.1190***
(3.29)
H-SPECULATIVE -0.0323
(-0.93)
-0.0320
(-0.92)
Sample Size 121 121 121
F, (p-value) 4.97 9.95 9.42
(0.0002) (0.0000) (0.0000)
R-squared 0.2912 0.4430 0.4464

33
Table A4-4. Abnormal Returns of Non-forced Banks for Different Windows: Market
Model Abnormal returns on the October 14th TARP announcement and the later announcement of bank specific
approval for TARP capital based on the market model are reported for the equal weight approach and the
portfolio approach. For the portfolio approach, each portfolio consists of all preferred stock belonging to
a particular bank. The second t-stats in Panel A are computed using the “Crude Dependence Adjustment”
of Brown and Warner (1980,1985). For the second t-stats, the standard deviations of abnormal returns are
estimated from the average abnormal returns between 11/1/2007 and 10/6/2008.
Panel A: The Market Model (Equal Weight)
Oct. 14 [-1,0] Approval
ALL (pooled) -0.0052 0.0427
Conventional T-stats (-0.39) (3.55) ***
T-stats Using “Crude Dependence Adjustment”
(-0.17) (4.59) ***
(n=54) (n=50)
TRUST (TP) 0.0096 0.0446
Conventional T-stats (0.45) (3.51) ***
T-stats Using “Crude Dependence Adjustment”
(0.59) (3.91) ***
(n=38) (n=36)
NONTRUST (NTP) -0.0403 0.0381
Conventional T-stats (-1.88) * (1.34)
T-stats Using “Crude Dependence Adjustment”
(-2.99)*** (3.34)***
(n=16) (n=14)
T-test for difference in mean
between two subsamples 1.65 0.21
Panel B: The Market Model (Portfolio Approach)
Oct. 14 [-1,0] Approval
ALL (pooled) 0.0023 0.0415
(0.0114) (2.73) ***
(n=30) (n=29)
TRUST (TP) 0.0214 0.0371
(0.79) (2.52) **
(n=20) (n=19)
NONTRUST (NTP) -0.0421 0.0498
(-1.39) (1.43)
(n=10) (n=10)
T-test for difference in mean
between two subsamples 1.46 -0.30

34
Table A4-5. Estimated Parameters for Abnormal Returns of the Non- Forced Banks:
Market Model
The dependent variable is the abnormal returns based on the market model on (1) the October 14th
announcement, (2) the later announcement of preliminary approval for the TARP fund.
OVERPAYMENT is measured by the difference between average yields of each bank immediately prior
to TARP and the 5 percent yield on the government’s preferred stock. SIZE is measured by TARP
capital/total asset. TRUST is a dummy variable equal to one if the observation is a trust preferred stock.
MATURITY is measured as the natural log of remaining time to maturity. FLOATING-RATE is a
dummy variable equal to one if the observation has a floating dividend. All preferred stock ratings are
obtained from S&P preferred stock ratings. Regarding ratings, N/A is used as a benchmark. MEDIUM is
a dummy variable equal to one if the rating of the observation is BBB+ or BBB or BBB-.
SPECULATIVE is a dummy variable equal to one if the rating is the observation is BB OR BB-. H-
SPECULATIVE is a dummy variable equal to one if the rating of the observation is B+ or B or B-.
(1) Oct. 14 [-1,0] (2) Approval
Intercept
0.3817*
(1.96)
-0.0163
(-0.15)
OVERPAYMENT
-0.0035
(-0.94)
0.0129***
(4.25)
SIZE
-1.4083
(-0.42)
-0.8653
(-0.39)
TRUST (TP)
-0.0151
(-0.40)
-0.0436
(-1.58)
MATURITY -0.0848**
(-2.06)
0.0038
(0.15)
FLOATING-RATE -0.1397***
(-3.10)
0.0077
(0.24)
MEDIUM 0.0148
(0.32)
0.0181
(0.63)
SPECULATIVE 0.0834*
(1.78)
-0.0483*
(-1.84)
H-SPECULATIVE
0.0395
(1.35)
-0.0210
(-0.15)
Sample Size 54 50
F, (p-value) 4.35 5.07
(0.0000) (0.0002)
R-squared 0.3707 0.4973

35
We are grateful for helpful comments received from Louis Ederington, Griffin Brown, Fan Chen,
Veljko Fotak, Sridhar Gogineni, Kate Holland, Anthony May, Scott Linn, Pradeep Yadav, Vahap
Uysal, Tor-Erik Bakke, Linus Wilson, Wayne Thomas, Robert Lipe, and Vikas Raman. Helpful
comments from presentations at the University of Oklahoma, Utrecht University (Clement Kool), and
the University of Gottingen (Olaf Korn) are very much appreciated. The first author acknowledges
financial support from the Michael F. Price College of Business Doctoral Summer Research fund.
36
References
Bary, A., 2009, It only looks like a wipeout, Barron’s, February 9, 2009.
Bessembinder, H., K. Kahel, W. Maxwell, and D. Xu, 2009. Measuring abnormal bond
performance, Review of Financial Studies 22, 4219-4258.
Brown, S., and J. Warner, 1980, Measuring security price performance, Journal of Financial
Economics 8, 205-258.
Brown, S., and J. Warner, 1985, Using daily stock returns: The case of Event Studies, Journal
of Financial Economics 14, 3-31.
Denis, D., 2004, Entrepreneurial finance: an overview of the issues and evidence, Journal of
Corporate Finance 10, 301-326.
Eckbo, E., 1986, Information asymmetries and valuation effects of corporate debt offerings,
Journal of Financial economics 15, 119-151.
Ertimur, Y., F. Ferri, and S. Stubben, 2010, Board of directors’ responsiveness to
shareholders: Evidence from shareholder proposals, Journal of Corporate Finance 16,
53-72.
Harvey, K., M. Collins, and J. Wansley, 2003, The impact of trust-preferred issuance on bank
default risk and cash flow: evidence from the debt and equity securities markets, The
Financial Review 38, 235-256.
Kallberg, J., C. Liu, and S. Villupuram, 2008, Preferred Stock: Some Insights into Capital
Struscute, working paper, New York University and Arizona State University
King, T., 2002, An empirical examination of call option values implicit in US corporate
bonds, Journal of Financial and Quantitative Analysis 37, 693–721.
Kwan, S., 2009, Capital structure in banking, Federal Reserve Bank of San Francisco
Economic Letter 37.
37
Lakshmivarahan, S., S. Qian, and D. Stock, 2009, A multiple default threshold model of the
complex structure of yields for bonds with both default and call risk, working
paper, University of Oklahoma.
Landler, M., and E. Dash, 2008, Drama behind a $250 billion banking deal, The New
York Times, October 15, 2008
Linn, S., and J. Pinegar, 1988, The effect of issuing preferred stock on common and preferred
stockholder wealth, Journal of Financial Economics 22, 155-184
Linn, S., and D. Stock, 2005, “The impact of junior debt issuance on senior unsecured
debt’s risk premiums.” Journal of Banking and Finance 29, 1585-1609.
Masulis, R., 1980. The effects of capital structure changes on security prices: a study of
exchange offers, Journal of Financial Economics 8, 139-178.
Mikkelson, W., and M. Partch, 1986, Valuation effects of security offerings and the
issuance process, Journal of Financial Economics, 15, 31-60.
Myers, S., and N. Majluf, 1984, Corporate investment and financing decisions when firms
have information that investors do not have, Journal of Financial Economics, 13,
187- 222.
Miller , M., and K. Rock, 1985, “Dividend policy under asymmetric information, Journal of
Finance 40, 1021-1051
Nash, R., J. Netter, and A. Poulsen, 2003, Determinants of contractual relations between
shareholders and bondholders: investment opportunities and restrictive covenants,
Journal of Corporate Finance 9, 201-232.
O'Hara, M., and W. Shaw, 1990, Deposit insurance and wealth effects: the value of being
“too big to fail”, Journal of Finance 45, 1587-1600.
Rose, P., and S. Hudgins, 2010, Bank management & Financial Services, Irwin/McGraw-Hill.
Ross, S., 1977. The determination of financial structure: the incentive signaling approach
Bell Journal of Economics 8, 23-40.

38
Salutric, J., and J. Wilcox, 2009, Emerging issues regarding trust preferred securities, SRC
Insights, Federal Reserve Bank of Philadelphia, September 15, 2009
Spence, J., 2008, Preferred shares offer tempting yields for brave investors, Dow Jones News
Service, November 10, 2008.
Spiess, K., and J. Affleck-Graves, 1999. The long run performance of stock returns
following debt offerings, Journal of Financial Economics 54, 45–73.
Veronesi, P., and L. Zingales, 2009, Paulson’s gift. Working paper, University of Chicago.
Wilson, L., and W. Wu, 2009, Common (Stock) Sense about Risk-Shifting and Bank
Bailouts, Working paper, University of Louisiana and Wilfrid Laurier University.

39
VB : Firm value before TARP, VA : Firm value after TARP Area of (1) (= DNB - DTB ) > Area of (2) (= DNA - DTA ) where DNB: Default Risk of NTP before TARP, DTB: Default Risk of TP before TARP, DNA: Default Risk of NTP after TARP, and
DTA: Default Risk of TP after TARP
���∗ ����
∗
����∗ ���
∗
The Increase in
Expected Firm Value
(2)
VB
VA
Insured/ Uninsured Deposits
Common
Stock TP NTP
Senior/ Junior Debt
(1)
Default Risk of
NTP before TARP
Figure 1
Distributions of Firm Value Before and After Oct. 14
Default Risk of
NTP after TARP

40
Figure 2
Representation of change in default risk of trust and non-trust preferred.
Before TARP After TARP
DNB: Default Risk of Non-Trust Preferred (NTP) Stock before the October 14 Announcement
DTB: Default Risk of Trust Preferred Stock (TP) before TARP before the October 14 Announcement
DNA: Default Risk of Non-Trust Preferred Stock (NTP) after TARP before the October 14 Announcement
DTA: Default Risk of Trust Preferred Stock (TP) after TARP before the October 14 Announcement
} After TARP DNA-DTA
(DNA - DTA) (DNB – DTB)
DTA
DNA
DNB - DTB
DTB
DNB
}
Discount of NTP to TP
Difference in Default
Risk of TP and NTP

41
Figure 3
Representation of different windows for non-forced banks
-1 (Oct. 13) 0 (Oct. 14) Upon Approval
Window (-1,0) and Regression (1)
(for both forced and non-forced)
Approval
Window
and
regression (2)
(for non-
forced only)

42
Table I. The Ranking Order of Claims on Bank
This table describes the priority of claims on banks. Non-Trust preferred (NTP) and TARP preferred have
equal priority and both have a lower claim than Trust preferred (TP).
Priority of Claims Claims on Bank
1 Insured Deposits
2 Uninsured Deposits
3 Senior Debt
4 Junior Subordinated Debt
5 Trust Preferred (TP) Stock
6 Non-trust Preferred (NTP) Stock and TARP Preferred
Stock
7 Common Stock

43
Table II. Matching Pairs of NTP and TP Raw Returns based on September 18 announcement
Panel A presents matching pairs of each type of preferred stock according to the issuer, maturity, and dividend yield. The two matched preferred stocks are required to have the same issuer, similar maturities, and similar dividend yields. For the match, we allowed a maximum of one year’s difference for maturity. For a perpetuity, our match required at least 59 years maturity. Regarding dividend yield, we allow a maximum of one percent difference. Panel B shows the average raw returns of each type of preferred stock and compares returns of TP and NTP.
Panel A: Matching Pairs of each type of preferred stock
Firm TP/NTP Maturity (years) Dividend Yield (%) Raw Returns
Bank of America NTP 24 8.125 0.221
TP 25 8.1 0.095
Bank of America NTP 24 6.5 -0.011
TP 25 6.75 -0.019
Bank of America NTP 25 5.875 0.043
TP 25 5.875 0.081
Bank of America NTP 25 5.5 0.126
TP 25 6 0.014
Bank of America NTP 26 6 0.097
TP 26 6 0.075
Bank of America NTP perpetual 6.7 0.151
TP perpetual 7 0.077
Bank of America NTP perpetual 7.25 -0.113
TP perpetual 7.28 0.12
Bank of America NTP perpetual 7.25 0.146
TP perpetual 7.28 0.121
Citigroup NTP perpetual 8.125 0.18
TP 59 7.25 0.229
Citigroup NTP perpetual 8.5 0.221
TP 59 7.875 0.105
Goldman Sachs NTP perpetual float 0.085
TP perpetual float 0.109
Goldman Sachs NTP perpetual float 0.095
TP perpetual flooat 0.109
JPMorgan Chase NTP 24 7 0.147
TP 23 7.2 0.04
JPMorgan Chase NTP perpetual 6.1 0.021
TP 69 6.875 0.033
Wells Fargo NTP perpetual 7.25 0.31
TP 59 7.85 0.405
Wells Fargo NTP perpetual 8 0.476
TP 60 7.875 0.036

44
Panel B: Average of Raw Returns of Each Type of Preferred Stock
NTP TP Total
Equal Weight (Individual Issues) 0.137 0.102 0.119
(number of shares with higher raw returns) 9 7 16
Portfolio Approach (portfolio of all issues
by same firm) 0.17 0.121 0.145
(number of banks with higher raw returns) 4 1 5

45
Table III. Average Preferred Stock Yields and Overpayment of the banks
OVERPAYMENT is measured by the difference between average preferred stock yields of each bank on
10/6/2008, prior to TARP, and the 5 percent yield on the government’s preferred stock purchase. Preferred stock
yields were obtained from the Bloomberg information system.
Bank of
America
Morgan
Stanley
Wells
Fargo
JPMorgan
Chase Citigroup
Goldman
Sachs
Bank of NY
Mellon
Mean 12.09 14.55 10.07 9.22 12.48 8.26 9.38
OVERPAYMENT
(Mean less 5%)
7.09 9.55 5.07 4.22 7.48 3.26 4.38

46
Table IV.... Description of Preferred Stock Outstanding
Panel A shows the number of each type of preferred stock in the largest banks. Since Bank of America(Wells Fargo) announced that they would take over Merrill Lynch
(Wachovia) before October 14, 2008, the sample of Bank of America includes preferred stock of Merrill Lynch. On the other hand, State Street Corporation did not have any
preferred stock outstanding before October 14, 2008. Panel B shows the number of each type of preferred stock of the non-forced banks that announced that they had received
preliminary approval for TARP issuance. Some banks are excluded because they did not have any preferred stock outstanding or their preferred stock price information was
not obtainable from Bloomberg.
Panel A: Type of preferred stock outstanding for the forced banks
Trust Non-trust Callable Non-callable Zero-Dividend Fixed-rate Floating-rate Total Sample
Bank of America 20 36 41 15 14 34 8 56
Citigroup 11 2 13 0 0 13 0 13
Goldman Sachs 1 3 4 0 0 1 3 4
JPMorgan Chase 4 9 13 0 0 12 1 13
Morgan Stanley 6 16 10 12 9 12 1 22
Bank of NY Mellon 2 0 2 0 0 2 0 2
Wells Fargo 9 2 11 0 0 11 0 11
Total Sample 53 68 94 27 23 85 13 121

47
Panel B: Type of preferred stock outstanding of the non-forced banks that announced that they had received preliminary approval for the TARP fund
Trust Non-trust Callable Non-callable Zero-Dividend Fixed-rate Floating-rate Total Sample Associated Bancorp 1 0 1 0 0 1 0 1 BB&T 2 0 2 0 0 2 0 2 Popular Inc 1 3 4 0 0 4 0 4 Capital One 1 0 1 0 0 1 0 1 Citizens Republic Bancorp 1 0 1 0 0 1 0 1 First Bancorp 0 5 5 0 0 5 0 5 Fifth Third Bancorp 3 0 3 0 0 0 3 3 Huntington Bancshares Inc 0 1 1 0 0 1 0 1 Independent Banc Corp 0 1 1 0 0 1 0 1 Keycorp 5 0 5 0 0 5 0 5 M&T Bank Corp 1 0 1 0 0 1 0 1 National Penn Bancshares Inc 1 0 1 0 0 1 0 1 Old National Bancorp 1 0 1 0 0 1 0 1 Old Second Bancorp 1 0 1 0 0 1 0 1 PNC Financial Services Group 5 1 6 0 0 5 1 6 Regions Financial Corporation 1 0 1 0 0 1 0 1 Sterling Bancshares Inc 1 0 1 0 0 1 0 1 Southern Community Financial Corp 0 1 1 0 0 1 0 1 SVB Financial Group 1 0 1 0 0 1 0 1 SunTrust Banks 1 1 2 0 0 1 1 2 Sterling Bancorp 1 0 1 0 0 1 0 1 Susquehanna Bancshares Inc 0 1 1 0 0 0 1 1 Taylor Capital Group Inc 1 0 1 0 0 1 0 1 U.S. Bancorp 7 1 8 0 0 7 1 8 Valley National Bancorp 1 0 1 0 0 1 0 1 Webster Financial Corp 0 1 1 0 0 1 0 1 Zions Bancorp 1 1 2 0 0 1 1 2 Total Sample 38 17 55 0 0 47 8 55

48
Table V. Returns around the October 14th
Announcement for Forced Banks Raw returns and the mean-adjusted returns over various event windows are reported for the equal weight
approach and the portfolio approach. For the portfolio approach, each portfolio consists of all preferred stock
belonging to a particular bank. The second t-stats in Panel A and Panel C are computed using the “Crude
Dependence Adjustment” of Brown and Warner (1980,1985).
Panel A: The Raw Returns (Equal Weight)
[0,0] [-1,0] [-2,+2] [-5,+5]
ALL (n=121) (pooled) 0.0911 0.2467 0.1808 0.0743
Conventional T-stats (13.25) *** (15.68) *** (12.19) *** (5.81) ***
T-stats Using “Crude Dependence
Adjustment” (4.97)*** (9.53)*** (4.41)*** (1.22)
TRUST (TP) (n=53) 0.1329 0.3404 0.2832 0.1496
Conventional T-stats (12.22) *** (13.80) *** (12.89) *** (7.18) ***
T-stats Using “Crude Dependence
Adjustment” (5.31)*** (9.63)*** (5.06)*** (1.80)*
NONTRUST (NTP) (n=68) 0.0585 0.1737 0.1010 0.0156
Conventional T-stats (8.92) *** (11.23) *** (7.29) *** (1.31)
T-stats Using “Crude Dependence
Adjustment” (4.39)*** (9.23)*** (3.39)*** (0.35)
T-test for difference in mean
between two subsamples (5.85) *** (5.72) *** (7.01) *** (5.59) ***
Panel B: The Raw Returns (Portfolio Approach)
[0,0] [-1,0] [-2,+2] [-5,+5]
ALL (n=13) (pooled) 0.0888 0.2638 0.2008 0.0924
(3.96) *** (5.51) *** (4.42) *** (3.52) ***
TRUST (TP) (n=7) 0.1174 0.3140 0.2433 0.1239
(3.29) *** (3.76) *** (3.32) *** (3.06) ***
NONTRUST (NTP) (n=6) 0.0554 0.2053 0.1513 0.0556
(2.73) ** (6.79) *** (3.15) *** (1.99) *
The dependent T-stat for difference in mean between two subsamples is not significant for the portfolio
approach due to the small sample size even though the sign for the difference between trust and non-trust is
positive.
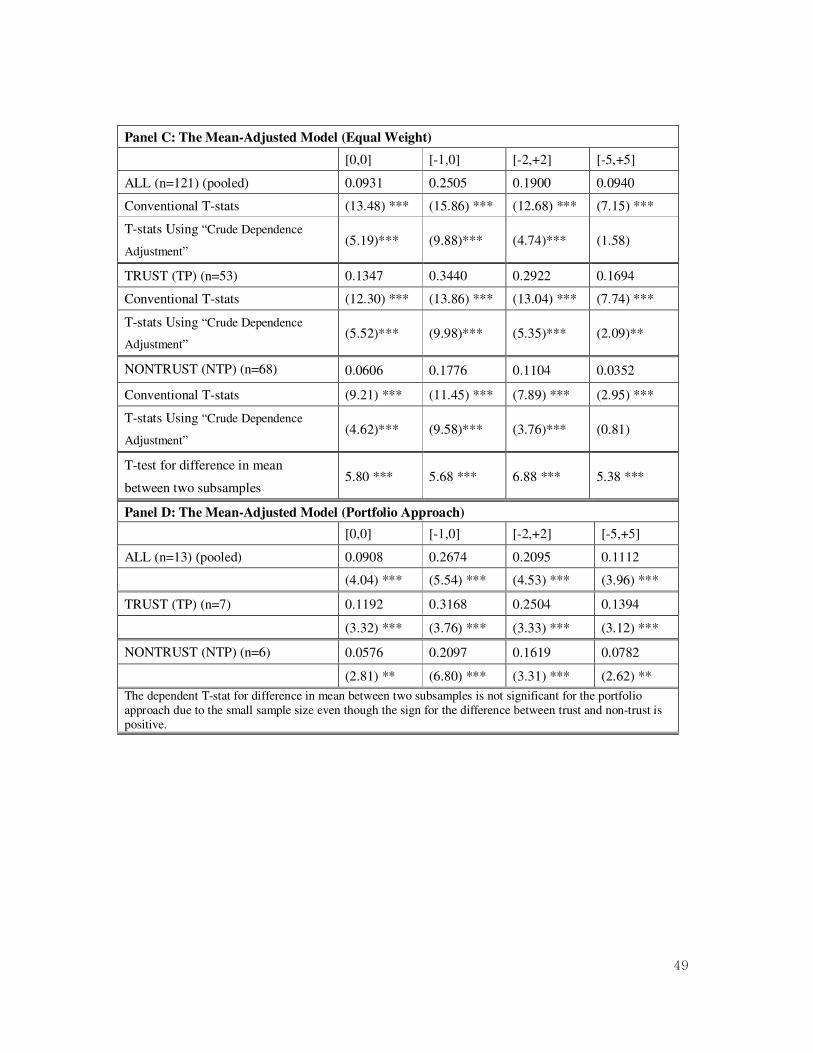
49
Panel C: The Mean-Adjusted Model (Equal Weight)
[0,0] [-1,0] [-2,+2] [-5,+5]
ALL (n=121) (pooled) 0.0931 0.2505 0.1900 0.0940
Conventional T-stats (13.48) *** (15.86) *** (12.68) *** (7.15) ***
T-stats Using “Crude Dependence
Adjustment” (5.19)*** (9.88)*** (4.74)*** (1.58)
TRUST (TP) (n=53) 0.1347 0.3440 0.2922 0.1694
Conventional T-stats (12.30) *** (13.86) *** (13.04) *** (7.74) ***
T-stats Using “Crude Dependence
Adjustment” (5.52)*** (9.98)*** (5.35)*** (2.09)**
NONTRUST (NTP) (n=68) 0.0606 0.1776 0.1104 0.0352
Conventional T-stats (9.21) *** (11.45) *** (7.89) *** (2.95) ***
T-stats Using “Crude Dependence
Adjustment” (4.62)*** (9.58)*** (3.76)*** (0.81)
T-test for difference in mean
between two subsamples 5.80 *** 5.68 *** 6.88 *** 5.38 ***
Panel D: The Mean-Adjusted Model (Portfolio Approach)
[0,0] [-1,0] [-2,+2] [-5,+5]
ALL (n=13) (pooled) 0.0908 0.2674 0.2095 0.1112
(4.04) *** (5.54) *** (4.53) *** (3.96) ***
TRUST (TP) (n=7) 0.1192 0.3168 0.2504 0.1394
(3.32) *** (3.76) *** (3.33) *** (3.12) ***
NONTRUST (NTP) (n=6) 0.0576 0.2097 0.1619 0.0782
(2.81) ** (6.80) *** (3.31) *** (2.62) **
The dependent T-stat for difference in mean between two subsamples is not significant for the portfolio approach due to the small sample size even though the sign for the difference between trust and non-trust is positive.

50
Table VI. Estimated Parameters for Returns of the Forced Banks
The dependent variable is the raw returns and the mean-adjusted returns over the announcement
window. WELLS FARGO is used as a benchmark. BANK OF AMERICA is a dummy variable that
takes the value 1 if the observation belongs to BANK OF AMERICA. CITIGROUP is a dummy
variable that takes the value 1 if the observation belongs to CITIGROUP. BANK of NY MELLON is a
dummy variable that takes the value 1 if the observation belongs to Bank of NY Mellon. JPMORGAN
CHASE is a dummy variable that takes the value 1 if the observation belongs to JPMORGAN CHASE.
MORGAN STANLEY is a dummy variable that takes the value 1 if the observation belongs to
MORGAN STANLEY. GOLDMAN SACHS is a dummy variable that takes the value 1 if the
observation belongs to GOLDMAN SACHS. TRUST is a dummy variable equal to one if the
observation is a trust preferred stock. TRUST is a dummy variable equal to one if the observation is a
trust preferred stock. CALLABLE is a dummy variable equal to one if the observation has a call option.
MATURITY is measured as the natural log of remaining time to maturity. ZERO DIVIDEND is a
dummy variable equal to one if the observation does not pay dividends. FLOATING-RATE is a dummy
variable equal to one if the observation has a floating dividend. All preferred stock ratings are obtained
from S&P preferred stock ratings. Regarding ratings, N/A is used as a benchmark. UPPER MEDIUM is
a dummy variable equal to one if the rating is the observation is A+ or A or A-. MEDIUM is a dummy
variable equal to one if the rating of the observation is BBB+ or BBB or BBB-. H-SPECULATIVE is a
dummy variable equal to one if the rating of the observation is B+ or B or B-.
Panel A: The Raw Returns Based on [-1,0]
(1) (2) (3)
Intercept -0.2412***
(-3.63)
-0.1586**
(-2.06)
-0.1701**
(-2.24)
BANK OF AMERICA 0.1300***
(5.57)
0.1381**
(2.37)
0.1443**
(2.50)
CITIGROUP 0.2390***
(12.15)
0.2574***
(4.52)
0.2538***
(4.46)
BANK OF NY MELLON 0.1497***
(6.35)
0.1501***
(6.09)
0.1530***
(6.13)
JPMORGAN CHASE 0.0569*
(1.69)
-0.0952
(-1.28)
-0.0922
(-1.28)
MORGAN STANLEY 0.3979***
(9.33)
0.3334***
(5.36)
0.3406***
(5.54)
GOLDMAN SACHS 0.0044
(0.09)
-0.1602*
(-1.88)
-0.1287
(-1.58)
TRUST (TP) 0.1064***
(4.64)
0.1080***
(4.26)
0.1073***
(4.34)
CALLABLE 0.1909***
(3.13)
0.1911***
(3.42)
0.1881***
(3.36)
MATURITY 0.0360**
(2.45)
0.0370**
(2.04)
0.0411**
(2.25)
ZERO-DIVIDEND 0.1000*
(1.77)
0.0864**
(2.12)
0.0880**
(2.15)
FLOATING-RATE -0.0466
(-1.64)
UPPER MEDIUM -0.0878**
(-2.39)
-0.0882**
(-2.40)
MEDIUM 0.0773
(1.22)
0.0781
(1.27)
H-SPECULATIVE -0.1160**
(-2.35)
-0.1120**
(-2.27)
Sample Size 121 121 121
F, (p-value) 40.67 45.53 48.60
(0.0000) (0.0000) (0.0000)
R-squared 0.6980 0.7577 0.7627

51
Panel B: The Mean-Adjusted Model Based on [-1,0]
(1) (2) (3)
Intercept -0.2386***
(-3.59)
-0.1434*
(-1.88)
-0.1546**
(-2.04)
BANK OF AMERICA 0.1323***
(5.68)
0.1280**
(2.24)
0.1341**
(2.37)
CITIGROUP 0.2403***
(12.15)
0.2384***
(4.37)
0.2349***
(4.31)
BANK OF NY MELLON 0.1489***
(5.82)
0.1463***
(5.55)
0.1492***
(5.59)
JPMORGAN CHASE 0.0559*
(1.66)
-0.1027
(-1.36)
-0.0998
(-1.36)
MORGAN STANLEY 0.4010***
(9.37)
0.3268***
(5.26)
0.3338***
(5.43)
GOLDMAN SACHS 0.0084
(0.17)
-0.1617*
(-1.89)
-0.1311
(-1.60)
TRUST (TP) 0.1078***
(4.87)
0.1102***
(4.34)
0.1095***
(4.41)
CALLABLE 0.1888***
(3.09)
0.1879***
(3.37)
0.1850***
(3.31)
MATURITY 0.0363***
(2.46)
0.0332*
(1.88)
0.0372**
(2.09)
ZERO-DIVIDEND 0.0991*
(1.75)
0.0863**
(2.11)
0.0878**
(2.14)
FLOATING-RATE -0.0452
(-1.62)
UPPER MEDIUM -0.0844**
(-2.30)
-0.0848**
(-2.31)
MEDIUM 0.0884
(1.40)
0.0891
(1.45)
H-SPECULATIVE -0.0977**
(-2.15)
-0.0940**
(-2.08)
Sample Size 121 121 121
F, (p-value) 40.20 42.43 44.78
(0.0000) (0.0000) (0.0000)
R-squared 0.6986 0.7552 0.7599

52
Table VII.... Estimated Parameters for Returns of the Forced Banks Using Firm Specific
Characteristics
The dependent variable is the raw returns and the mean-adjusted returns over the announcement
window. OVERPAYMENT is measured by the difference between average yields of each bank
immediately prior to TARP and the 5 percent yield on the government’s preferred stock. SIZE is
measured by TARP capital infusion over total assets. TRUST is a dummy variable equal to one if the
observation is a trust preferred stock. CALLABLE is a dummy variable equal to one if the observation
has a call option. MATURITY is measured as the natural log of remaining time to maturity. ZERO
DIVIDEND is a dummy variable equal to one if the observation does not pay dividends. FLOATING-
RATE is a dummy variable equal to one if the observation has a floating dividend. All preferred stock
ratings are obtained from S&P preferred stock ratings. Regarding ratings, N/A is used as a benchmark.
UPPER MEDIUM is a dummy variable equal to one if the rating is the observation is A+ or A or A-.
MEDIUM is a dummy variable equal to one if the rating of the observation is BBB+ or BBB or BBB-.
H-SPECULATIVE is a dummy variable equal to one if the rating of the observation is B+ or B or B.
Panel A: The Raw Returns Based on [-1,0]
(1) (2) (3)
Intercept -0.5895***
(-5.09)
-0.6361***
(-6.16)
-0.5975***
(-5.88)
OVERPAYMENT 0.0703***
(6.99)
0.0812***
(9.53)
0.0788***
(9.44)
SIZE 5.0420
(1.12)
4.2262
(0.74)
1.3474
(0.23)
TRUST (TP) 0.0979***
(4.15)
0.1242***
(5.09)
0.1246***
(5.23)
CALLABLE 0.1911***
(3.41)
0.1927***
(3.55)
0.1882***
(3.45)
MATURITY 0.0299*
(1.91)
0.0367**
(2.21)
0.0426**
(2.48)
ZERO-DIVIDEND 0.0770
(1.64)
0.0869**
(2.13)
0.0874**
(2.14)
FLOATING-RATE -0.0505*
(-1.83)
UPPER MEDIUM -0.0881**
(-2.59)
-0.0867**
(-2.56)
MEDIUM 0.0615
(1.55)
0.0638
(1.63)
H-SPECULATIVE -0.1068**
(-2.57)
-0.1098***
(-2.67)
Sample Size 121 121 121
F, (p-value) 22.49 49.25 56.15
(0.0000) (0.0000) (0.0000)
R-squared 0.6043 0.7270 0.7334

53
Panel B: The Mean-Adjusted Model Based on [-1,0]
(1) (2) (3)
Intercept -0.5777***
(-4.91)
-0.6029***
(-5.64)
-0.5641***
(-5.36)
OVERPAYMENT 0.0698***
(6.92)
0.0791***
(9.23)
0.0767***
(9.11)
SIZE 4.8954
(1.05)
2.8630
(0.47)
0.0123
(0.00)
TRUST (TP) 0.1014***
(4.39)
0.1318***
(5.38)
0.1321***
(5.52)
CALLABLE 0.1892***
(3.37)
0.1914***
(3.52)
0.1869***
(3.42)
MATURITY 0.0296*
(1.89)
0.0363**
(2.22)
0.0417**
(2.48)
ZERO-DIVIDEND 0.0755
(1.62)
0.0840**
(2.05)
0.0844**
(2.06)
FLOATING-RATE -0.0497*
(-1.84)
UPPER MEDIUM -0.0823**
(-2.49)
-0.0804**
(-2.43)
MEDIUM 0.0586
(1.55)
0.0619*
(1.67)
H-SPECULATIVE -0.1094***
(-2.77)
-0.1115***
(-2.84)
Sample Size 121 121 121
F, (p-value) 22.64 49.11 54.45
(0.0000) (0.0000) (0.0000)
R-squared 0.6019 0.7193 0.7254
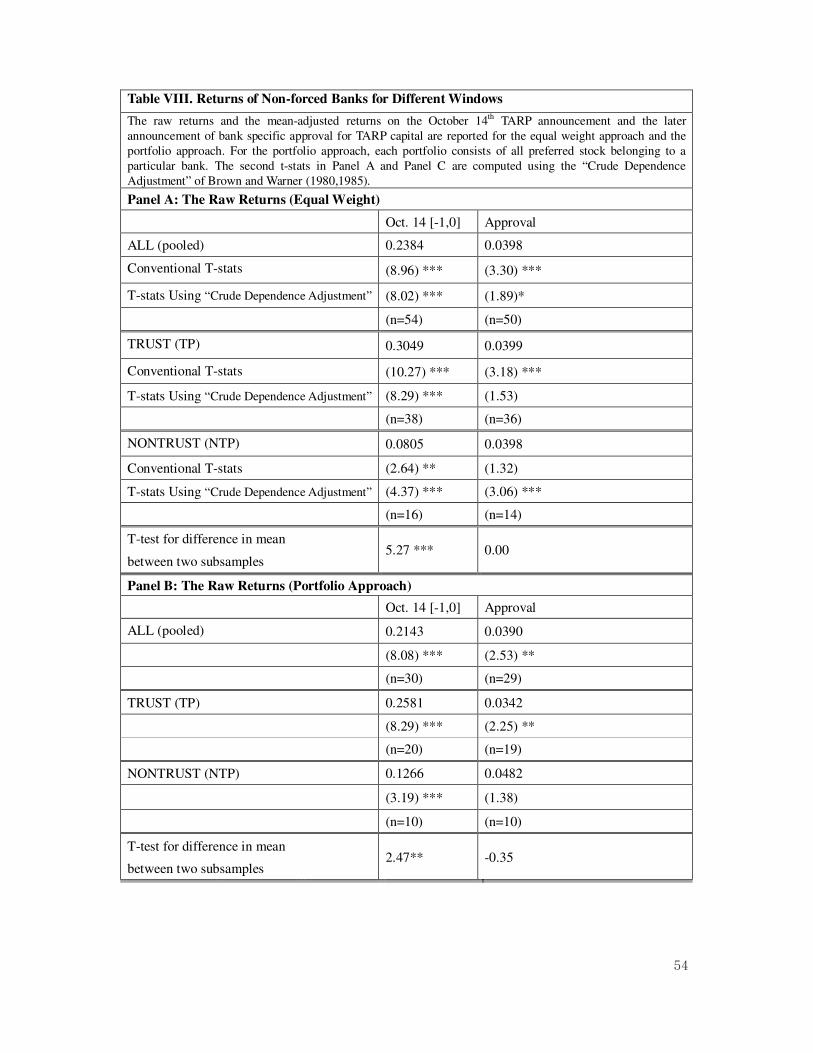
54
Table VIII. Returns of Non-forced Banks for Different Windows
The raw returns and the mean-adjusted returns on the October 14th TARP announcement and the later
announcement of bank specific approval for TARP capital are reported for the equal weight approach and the
portfolio approach. For the portfolio approach, each portfolio consists of all preferred stock belonging to a
particular bank. The second t-stats in Panel A and Panel C are computed using the “Crude Dependence
Adjustment” of Brown and Warner (1980,1985).
Panel A: The Raw Returns (Equal Weight)
Oct. 14 [-1,0] Approval
ALL (pooled) 0.2384 0.0398
Conventional T-stats (8.96) *** (3.30) ***
T-stats Using “Crude Dependence Adjustment” (8.02) *** (1.89)*
(n=54) (n=50)
TRUST (TP) 0.3049 0.0399
Conventional T-stats (10.27) *** (3.18) ***
T-stats Using “Crude Dependence Adjustment” (8.29) *** (1.53)
(n=38) (n=36)
NONTRUST (NTP) 0.0805 0.0398
Conventional T-stats (2.64) ** (1.32)
T-stats Using “Crude Dependence Adjustment” (4.37) *** (3.06) ***
(n=16) (n=14)
T-test for difference in mean
between two subsamples 5.27 *** 0.00
Panel B: The Raw Returns (Portfolio Approach)
Oct. 14 [-1,0] Approval
ALL (pooled) 0.2143 0.0390
(8.08) *** (2.53) **
(n=30) (n=29)
TRUST (TP) 0.2581 0.0342
(8.29) *** (2.25) **
(n=20) (n=19)
NONTRUST (NTP) 0.1266 0.0482
(3.19) *** (1.38)
(n=10) (n=10)
T-test for difference in mean
between two subsamples 2.47** -0.35

55
Panel C: The Mean-Adjusted Model (Equal Weight)
Oct. 14 [-1,0] Approval
ALL (pooled) 0.2428 0.0414
Conventional T-stats (9.00) *** (3.41) ***
T-stats Using “Crude Dependence
Adjustment” (8.21) *** (1.98)*
(n=54) (n=50)
TRUST (TP) 0.3098 0.0424
Conventional T-stats (10.28) *** (3.33) ***
T-stats Using “Crude Dependence
Adjustment” (8.49) *** (1.64)
(n=38) (n=36)
NONTRUST (NTP) 0.0838 0.0388
Conventional T-stats (2.70) *** (1.32)
T-stats Using “Crude Dependence
Adjustment” (4.56) *** (2.98) ***
(n=16) (n=14)
T-test for difference in mean
between two subsamples 5.22 *** 0.11
Panel D: The Mean-Adjusted Model (Portfolio Approach)
Oct. 14 [-1,0] Approval
ALL (pooled) 0.2143 0.0390
(8.08) *** (2.53) **
(n=30) (n=29)
TRUST (TP) 0.2581 0.0342
(8.29) *** (2.25) **
(n=20) (n=19)
NONTRUST (NTP) 0.1266 0.0482
(3.19) *** (1.38)
(n=10) (n=10)
T-test for difference in mean
between two subsamples 2.44** -0.33
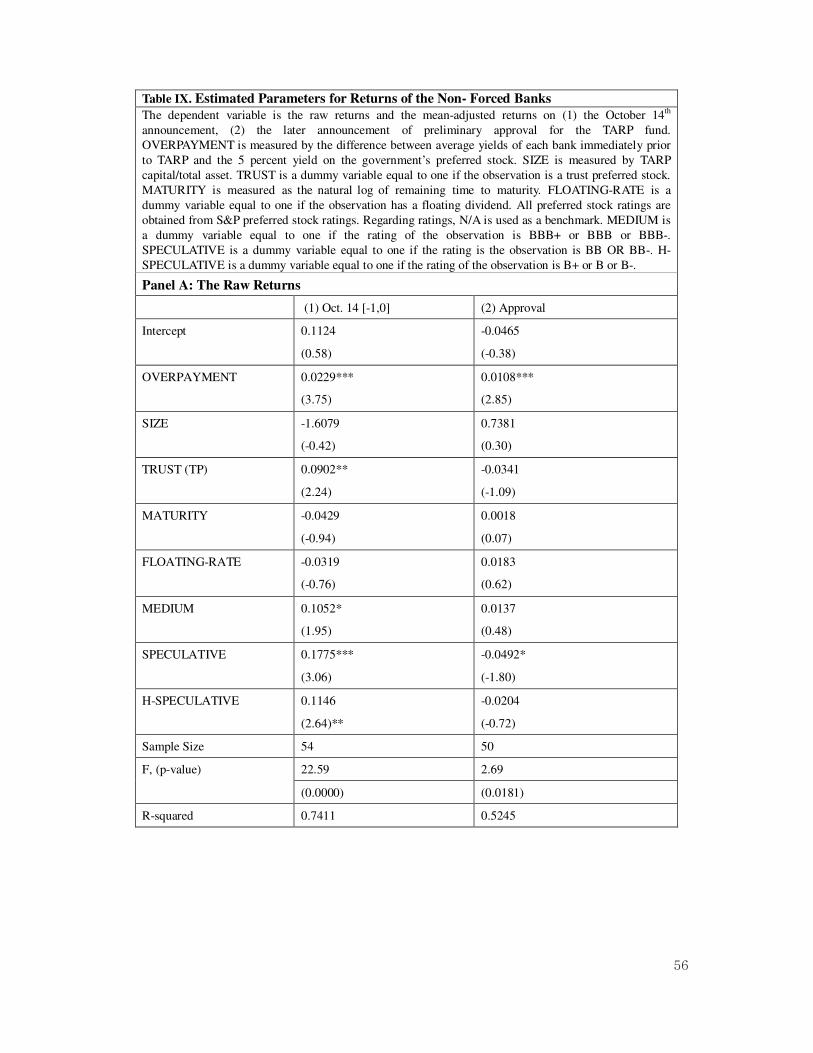
56
Table IX. Estimated Parameters for Returns of the Non- Forced Banks
The dependent variable is the raw returns and the mean-adjusted returns on (1) the October 14th
announcement, (2) the later announcement of preliminary approval for the TARP fund.
OVERPAYMENT is measured by the difference between average yields of each bank immediately prior
to TARP and the 5 percent yield on the government’s preferred stock. SIZE is measured by TARP
capital/total asset. TRUST is a dummy variable equal to one if the observation is a trust preferred stock.
MATURITY is measured as the natural log of remaining time to maturity. FLOATING-RATE is a
dummy variable equal to one if the observation has a floating dividend. All preferred stock ratings are
obtained from S&P preferred stock ratings. Regarding ratings, N/A is used as a benchmark. MEDIUM is
a dummy variable equal to one if the rating of the observation is BBB+ or BBB or BBB-.
SPECULATIVE is a dummy variable equal to one if the rating is the observation is BB OR BB-. H-
SPECULATIVE is a dummy variable equal to one if the rating of the observation is B+ or B or B-.
Panel A: The Raw Returns
(1) Oct. 14 [-1,0] (2) Approval
Intercept
0.1124
(0.58)
-0.0465
(-0.38)
OVERPAYMENT
0.0229***
(3.75)
0.0108***
(2.85)
SIZE
-1.6079
(-0.42)
0.7381
(0.30)
TRUST (TP)
0.0902**
(2.24)
-0.0341
(-1.09)
MATURITY -0.0429
(-0.94)
0.0018
(0.07)
FLOATING-RATE -0.0319
(-0.76)
0.0183
(0.62)
MEDIUM 0.1052*
(1.95)
0.0137
(0.48)
SPECULATIVE 0.1775***
(3.06)
-0.0492*
(-1.80)
H-SPECULATIVE
0.1146
(2.64)**
-0.0204
(-0.72)
Sample Size 54 50
F, (p-value) 22.59 2.69
(0.0000) (0.0181)
R-squared 0.7411 0.5245

57
Panel B: The Mean-Adjusted Model
(1) Oct. 14 [-1,0] (2) Approval
Intercept
0.1103
(0.56)
-0.0679
(-0.59)
OVERPAYMENT
0.0235***
(3.82)
0.0109***
(2.95)
SIZE
-1.6500
(-0.43)
0.7760
(0.32)
TRUST (TP)
0.0909**
(2.24)
-0.0277
(-0.98)
MATURITY -0.0429
(-0.94)
0.0060
(0.23)
FLOATING-RATE -0.0295
(-0.70)
0.0212
(0.71)
MEDIUM 0.1051*
(1.94)
0.0127
(0.45)
SPECULATIVE 0.1779***
(3.05)
-0.0495*
(-1.80)
H-SPECULATIVE
0.1163**
(2.67)
-0.0178
(-0.59)
Sample Size 54 50
F, (p-value) 23.67 2.90
(0.0000) (0.0116)
R-squared 0.7440 0.5272