impact of tilt angle on system economics for area ... · impact of tilt angle on system economics...
TRANSCRIPT
Impact of Tilt Angle on System Economics for Area Constrained Rooftops
by Matthew Culligan and Jonathan Botkin2007

2
EXECUTIVE SUMMARY
E X E C U T I V E S U M M A R Y
Traditional practice in Europe has focused on maximizing output at the module level, which dictates tilting at
or close to 30 degrees depending on latitude. To optimize cost and customer return, economics need to be
evaluated at a system level. With the goal of minimum energy cost and maximum social benefit, PowerLight
has pursued the development of lightweight PV systems for large-scale flat rooftop installations. Rooftops
offer attractive sites because the installation of a PV system can take advantage of otherwise unused space
near utility connection point and energy usage. However, rooftops tend to limit the size of PV systems due
to limited available area. Lightweight, ballasted systems provide lower material costs and require less
labor than traditional ballasted or rackmounted systems. Lightweight installation need to be mechanically
contiguous, therefore increased separation distance, i.e. lower ground coverage ratio (GCR), associated
with a higher tilt angle, leads to higher cost as well as smaller systems. In a constrained space with an
unconstrained feed-in tariff, a lightweight system with a lower tilt angle will provide the best economic
return. This paper will explore the relationship between tilt angle, system GCR, system size, system cost
and customer return on investment within constrained area rooftop systems operating under current and
proposed market conditions.

3S E C T I O N 1 INTRODUCT ION
Lightweight, ballasted PV systems are designed to bemounted on flat roofs without the need for anchors thatpenetrate the water-proof membrane. This allows rooftop PV systems to be installed without the risk of creating costly leaks. These systems can use PV modules that are horizontal or tilted. As with any type of system, the size of the system is governed by the ground coverage ratio (GCR).
The GCR is the area of the PV modules divided bythe roof area occupied by the PV system. As tilt angleincreases, GCR must decrease to prevent reductions inenergy capture due to shading. For systems with longcontinuous East-West rows, GCR can be calculated based on the width of the PV modules divided by the separation distance of the rows, or A/B as shown in Figure 1.
Figure 1: Comparison of GCR and tilt angles
PV systems installed on commercial roofs are often limited in size by the available area of the roof. In these sites, a lower GCR will also decrease the size of the PV system that can be installed since each PV module is occupying more space on the roof.
In traditional ballasted or rack-mounted PV systems, the GCR may have little effect on the cost of the system. Wiring costs may be somewhat affected, but otherwise, the modules can be closer together or further apart without significantly changing the balance-of-system (BOS) cost. In the case of lightweight, non-penetrating, ballasted systems, however, the ability of each PV module to resist wind loads is dependent on interconnection with the rest of the array. As GCR decreases, and rows of modules are moved further apart, the cost of the mounting materials will increase. Likewise, in such systems, as tilt angle increases, the cost of the mounting system will increase.
Another effect of increased tilt and decreased GCR is a decrease in wind performance. The ability of these systems to resist wind forces is sensitive to the height of the array, the tilt angle, and the separation of the modules. The effect of this on the cost of the system is harder to quantify. It will eliminate some portion of potential sites from consideration or it will require the system to be anchored through the roof membrane or to the parapet.
INTRODUCTION
The cost of a rooftop PV system is affected by the size of the system and the proportion of fixed costs to variable
costs. When system size is constrained by the available roof area, the economic benefit of the system will not
necessarily be generated by the configuration that maximizes the output of each PV module, i.e. the system that
has a maximum tilt angle, nor by the configuration that maximizes the capacity of the system.
S E C T I O N 1

4S E C T I O N 1 INTRODUCT ION
For many PV systems, tilt angle and GCR are chosen to optimize the energy output of each module. This maximizes the return on the most expensive component of the system. However, as PV module costs have decreased over time, the BOS cost has become a more significant portion of the overall system cost. The search for the minimum levelized cost of energy (LCOE) may lead to a significantly different decision on optimum tilt angle and GCR.
The goal of this paper is to discuss a model of system economics that we have created that allows us to compare the economic benefit of roof-constrained systems in various locations at differing tilt angles and GCRs. Specific results of actual LCOE calculations will vary from one manufacturer or installer to another, but we believe that the overall trend will be the same. In order to make a generic comparison, we have applied our model to systems in a variety of geographic locations and then normalized the results. This allows us to make comparisons that can be used to make development decisions for products that will be used in a wide variety of site conditions, and which will then provide the best configuration for system economics.
S E C T I O N 1

5S E C T I O N 2 MODEL ING METHOD
Levelized Cost of Energy (LCOE)LCOE represents the total cost ($/kWh) of the energy produced by the PV system over the useful life of that system. LCOE calculation is a useful tool for measuring economic performance because it represents the final product of the PV system and includes all costs and performance factors that determine the value of installing a PV system on a commercial rooftop:
1. System Capital Cost 2. Financing3. Operations & Maintenance Cost4. System Performance5. System Life
LCOE is calculated by assuming current market conditions and a fixed period during which the PV system will be generating electricity. All costs incurred in the construction and maintenance of the PV system are calculated in terms of today’s costs in real dollars ($). The total present day cost of the system is then divided by the total life time energy in kilowatt-hours (kWh) of the system. The end result is in the total energy cost in today’s real dollars per kilowatt-hour ($/kWh).
Key assumptions in the LCOE model are as follows:
1. 30-year system life2. 20-year financing term / 6.0% financing3. 25% equity / 75% debt financing 4. 1% annual performance degradation 5. 2.5% inflation rate6. 5.5% discount rate7. 28% federal tax rate / 5% state tax rate8. Annual O&M costs (fixed and variable)9. Insurance cost (fixed and variable)
To calculate LCOE, we must determine the capacity of the system and the expected energy output, and then we must estimate the total cost. The system capacity will depend on the GCR and the available roof area. Energy output will then depend on location and tilt angle.
Ground Coverage Ratio (GCR)For our analysis, Ground Coverage Ratio (GCR) is defined as the total PV area divided by the total system area.
GCR = PV area (m²) / System area (m²)
MODELING METHOD
Our goal is to model the economic structure of a typical rooftop project as realistically as possible. For the most
accurate measurement of the economic benefit supplied by an installed system, we first calculate the levelized
cost of energy (LCOE) over the life of the PV system. Once we can model LCOE, we use the concept of economic
surplus to measure and compare the value of different system configurations. The economic surplus is the difference
between the maximum system cost that will provide a target LCOE and the actual system cost.
The economic surplus represents extra value that is produced by a project over its lifetime. This value can be
captured by the installer or manufacturer as margin, by a customer as savings on energy expense, by an investor
as profit, or by other third parties such as a utility or government. Who captures the economic surplus arising from
a given project depends on exactly how the deal is structured
S E C T I O N 2

6S E C T I O N 2 MODEL ING METHOD
PV area is defined as the sum of all module surfacearea in the system. System area is defined as the totalfootprint of the system on the roof including any spacebetween modules to account for shading but forsimplicity sake excluding perimeter buffer.
Figure 2: GCR calculation
Because we assume contiguous rows, GCR is onlyaffected by spacing in the north/south direction.Therefore, a shortcut for GCR can be obtained by looking at one dimension (distance) rather than two dimensions (area) where GCR equals length of PV panels divided by row spacing.
System AreaOur analysis assumes that we are dealing with spaceconstrained roofs, i.e. the system size is limited by the total rooftop area available for installation. Thisassumption is especially appropriate for the Europeanmarket where feed-in tariffs do not impose caps on system size. This is in contrast to the U.S. market, wherea distributed model based on net-metering means system size is frequently constrained by limited customerdemand or regulatory caps on net-metering rather than constraints on available area. Nevertheless, in allmarkets, it is most often the case that available spacedictates system size.
For our study, we considered a discrete set of rooftopsizes (1,000 m², 2,000 m², 5,000 m²m 10,000 m², and 20,000 m²) upon which we can install PV systemsvarying in terms of tilt and GCR configurations. Because the denominator of the GCR calculation issystem area, the product of the available space and GCR will result in the total area of the PV panels (m²) that can be installed. Then, a module efficiency number multiplied by PV panel area will produce the PV systemsize (kWp). Error! Reference source not found. showsthe relationship between system size and GCR for asample roof size.
Figure 3: System capacity vs. GCR
S E C T I O N 2

7S E C T I O N 2 MODLE ING METHOD
Tilt AngleThe tradeoff between tilt angle and GCR is the cruxof our analysis. Tilt and GCR are intimately relatedbecause an increase in tilt angle requires row spacing to increase to avoid inter-row shading. So, if tilt increases, GCR will decrease as row spacing gets wider. We want to find the optimal tilt and GCR combination formaximizing value of a rooftop system.
For the purpose of this study, we are considering onlyrooftop systems arranged in East-West rows, with PVpanels at a fixed tilt and angled toward due south. Tiltdescribes the angle above horizontal at which the PVpanel is mounted. To study a variety of possible systemconfigurations, we have modeled scenarios with system tilts of 0° (flat), 5°, 10°, 15°, 20°, 25° & 30°.
Energy SimulationTo determine the expected output of the modeledsystems, we used a proprietary PV simulation tool thataccounts for critical inter-row shading as well asindustry-standard performance factors including weather, PV cell and module characteristics, system losses, soiling, and more. With this tool, we ran multiplesimulations for each combination of tilt angle and GCR. For each location we ran 105 scenarios where the tilt and GCR were varied as shown in the representative location below.
We ran a full set of 105 simulation for the followingsix locations world wide
1. Rome, Italy2. Munich, Germany3. Seville, Spain4. Seoul, Korea5. Sacramento, California6. Newark, New Jersey
Energy generation at each of the simulation sites atvarying tilt and GCR is shown in Figure 4.
Figure 4: Energy generation at varying tilt and GCR
System Cost ModelWe modeled system costs using a proxy representative rooftop system as defined by current SunPower Corporation practices as a starting point. The representative system is a 500-kWp rooftop commercial installation using a ballasted, non-penetrating mounting
S E C T I O N 2
GCR Flat 5° 10° 15° 20° 25° 30°
10% 1,139 1,188 1,229 1,260 1,281 1,293 1,295
35% 1,139 1,188 1,229 1,260 1,281 1,292 1,292
40% 1,139 1,188 1,229 1,260 1,280 1,290 1,288
45% 1,139 1,188 1,229 1,260 1,279 1,287 1,282
50% 1,139 1,188 1,229 1,259 1,276 1,280 1,267
55% 1,139 1,188 1,229 1,257 1,270 1,263 1,218
60% 1,139 1,188 1,228 1,255 1,255 1,212 1,174
65% 1,139 1,188 1,226 1,244 1,207 1,172 1,134
70% 1,139 1,188 1,224 1,206 1,168 1,129 1,088
75% 1,139 1,187 1,212 1,166 1,123 1,081 1,039
80% 1,139 1,186 1,168 1,118 1,069 1,035 993
85% 1,139 1,182 1,121 1,057 1,014 973 937
90% 1,139 1,144 1,052 986 930 897 870
95% 1,139 1,073 947 879 841 818 804
100% 1,139 905 764 692 678 700 712
8S E C T I O N 2 MODLE ING METHOD
system and SunPower high efficiency 210-watt panels installed on a large, flat rooftop similar to a U.S. big-box national retailer. System costs are standardized in order to be applicable to markets across a wide geographical range and to include all expenses required to install and commission a turn-key commercial rooftop PV system. Cost build-up includes the following elements: PV modules, inverters, meters, monitoring system, mounting system, mechanical installation labor, electrical components, electrical installation labor, shipping, insurance, warranty, site preparation, project management and administration, sales tax or VAT, and any other costs that are incurred in the construction and commissioning of a rooftop PV system.
The next step in our cost analysis is to determine how costs scale with system size for a particular product configuration and create a scale factor that will accurately predict cost at varying system size. Our scale factor is calculated based on historical cost analysis of over 250 commercial rooftop projects, representing over 50 MW of capacity, that have been installed over the past 10 years by PowerLight Corporation, a subsidiary of SunPower Corporation. The scale factor is not applied to the PV module costs because we assume PV to be a commodity, so that price does not vary with system size. In practice, our scale factor only applies to a specific portion of the balance of system (BOS) costs, and therefore only those costs that demonstrate economies of scale in real life projects are subjected to the scaling factor. In other words, we only scale those costs for which a larger system size results in a smaller $/Wp installation cost due to the distribution of fixed project costs over larger capacity. Examples of cost categories that scale with size include labor, shipping, design, engineering, inverters, electrical equipment, site preparation, warranty, operation and maintenance.All cost categories that scale with size were identified through the detailed cost analysis through which the
scale factors were derived as mentioned above. To ensure consistency in this analysis, we are careful to apply the scale factor to the same cost categories used to derive the scale factor.
In addition to the scaling factor discussed above, system cost will change as product configuration changes to provide varying tilt angle and GCR. With a system in which all components of an array are interconnected, cost will increase as rows move farther apart since the amount of material and the size of the support members must increase. Also, as tilt angle increases, loads will increase, requiring more material or more complex structures, which also increase cost. In order to model these cost variations, we used known configurations as a baseline and then increased or decreased cost of materials or fabrication as tilt angle and GCR varied.
Economic SurplusNow that we have our cost model and our prediction of energy output, we can calculate LCOE as described above. Then we can calculate the economic surplus of the various configurations. To derive economic surplus, we first set LCOE target cost ($/kWh) and then back-calculate the maximum system cost that will produce the target LCOE for a given system configuration defined by location, GCR and tilt angle. The difference between this maximum cost and the calculated system cost based on standard costs and system size scaling factor is the economic surplus. In this study, we have not attempted to determine specific economic surplus values or system costs. Rather, we attempted to tie together these elements to evaluate relative value of economic surplus given different system configurations. Specifically, the aim of this analysis is to show how panel tilt and ground coverage ratio affect economic surplus in the real world.
S E C T I O N 2
9
S E C T I O N 3
RESULTS AND DISCUSSION
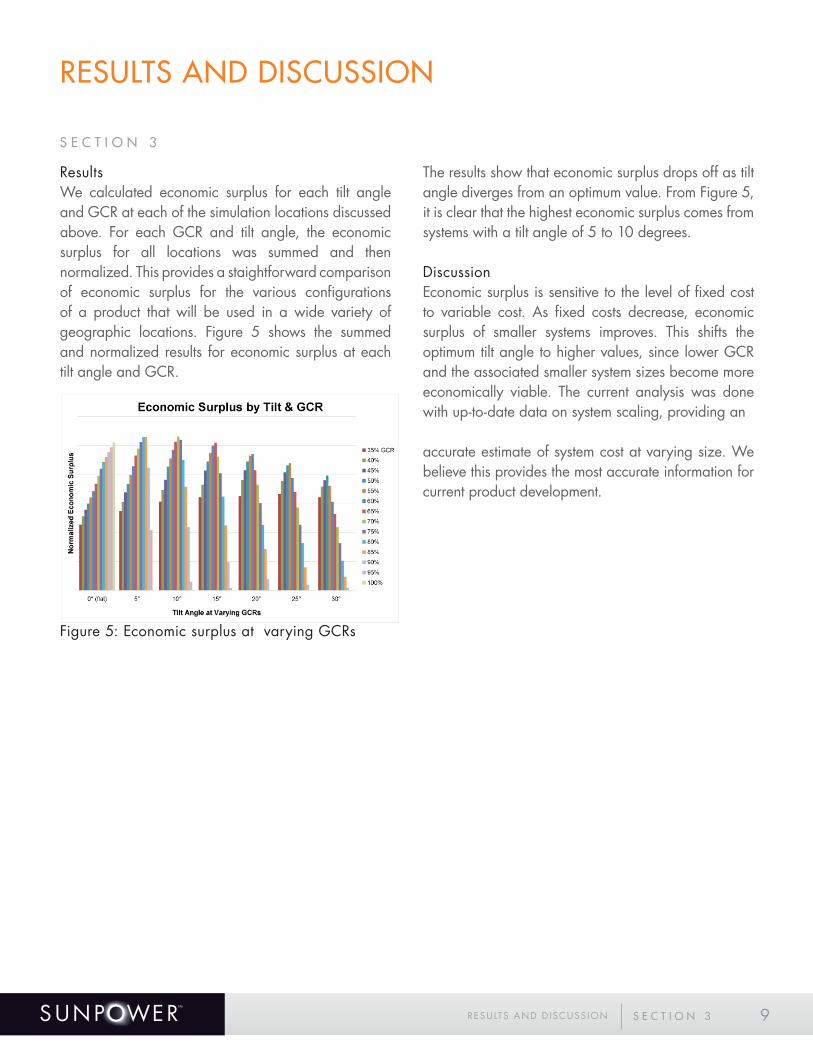
ResultsWe calculated economic surplus for each tilt angle and GCR at each of the simulation locations discussed above. For each GCR and tilt angle, the economic surplus for all locations was summed and then normalized. This provides a staightforward comparison of economic surplus for the various configurations of a product that will be used in a wide variety of geographic locations. Figure 5 shows the summed and normalized results for economic surplus at each tilt angle and GCR.
Figure 5: Economic surplus at varying GCRs
The results show that economic surplus drops off as tilt angle diverges from an optimum value. From Figure 5, it is clear that the highest economic surplus comes from systems with a tilt angle of 5 to 10 degrees.
DiscussionEconomic surplus is sensitive to the level of fixed cost to variable cost. As fixed costs decrease, economic surplus of smaller systems improves. This shifts the optimum tilt angle to higher values, since lower GCR and the associated smaller system sizes become more economically viable. The current analysis was done with up-to-date data on system scaling, providing an
accurate estimate of system cost at varying size. We believe this provides the most accurate information for current product development.
S E C T I O N 3 RESULTS AND D ISCUSS ION

10S E C T I O N 4 CONCLUS IONS AND RECOMMENDAT IONS
S E C T I O N 4
CONCLUSIONS AND RECOMMENDATIONS
The goal of this analysis is not to determine one combination of tilt angle and GCR that will be correct for
every product developer or installer. Rather, we wish to demonstrate that for rooftop systems that require array
interconnection in order to maintain structural integrity, the highest tilt angle does not provide the maximum
economic benefit. It can be seen from the comparison of economic surplus at the various tilt angles and GCRs
that, particularly for systems in which the size is constrained by the available roof area, economic benefit will be
maximized at a relatively low tilt angle and high GCR

1111
SUNPOWER CORPORATION3939 North 1st StreetSan Jose, CA 95134 1.800.SUNPOWER (1.800.786.7693)sunpowercorp.com
SUNPOWER and the SUNPOWER logo are trademarks or registered trademarks of SunPower Corporation.© February 2011 SunPower Corporation. All rights reserved.