impacts of climate change on the tualatin river basin nathan vanrheenen, erin clancy, richard...
Post on 20-Dec-2015
213 views
TRANSCRIPT

Impacts of Climate Change on the Tualatin River Basin
Nathan VanRheenen, Erin Clancy,
Richard Palmer, PhD, PE
Dept. of Civil and Environmental EngineeringUniversity of Washington
www.tag.washington.edu

Talk Overview
Background
Research Approach
Impacts on Meteorology
Impacts on Hydrology
Impacts on System Yield
Final Conclusions


Insight from a Notable American Philosopher
The future ain't what it used to be.
-Yogi Berra

It's time for those of us who work on climate change to help the public and policymakers understand the evidence: Climate change is real, well underway, and poses severe risks to the United States and the world.
Dr. Peter GleickDirector, The Pacific Institute 2003 MacArthur Fellowship Award Winner

Translating the Challenge to Regional Analysis
What are the likely impacts of climate change on regional watersheds?
Types of impacts Magnitude of impacts Mitigation responses Case Studies
Seattle Water Department Portland Water Bureau Tualatin Basin

Setting
Rain-driven watershed (no snow impacts)
Multiple uses: M&I, Ag, Fish, Recreation 500,000 customers (M&I) Agriculturally productive Water Quality Concerns (temperature)
Current system is fully allocated M&I demands expected to increase 400% by 2050 Ag demands, 50% by 2050
System highly sensitive to changes in summer flows
System expansion is under consideration


Models for Evaluating Climate Change
General Circulation Models
Tualatin River Integrated Management System (TRIMS)
Hydrology Model, EPA BASINS
Tualatin River Integrated Management System (TRIMS)

Impacts on Meteorology

•Global climate models operate at a scale of 2-5° latitude
•Global data must be downscaled to the local station scale in order to assess the impacts of climate change on water resources.

Historical Meteorology
Hydrology Model
Climate Signals
PredictedMeteorology
From Climate Signals to Runoff
PredictedRunoff
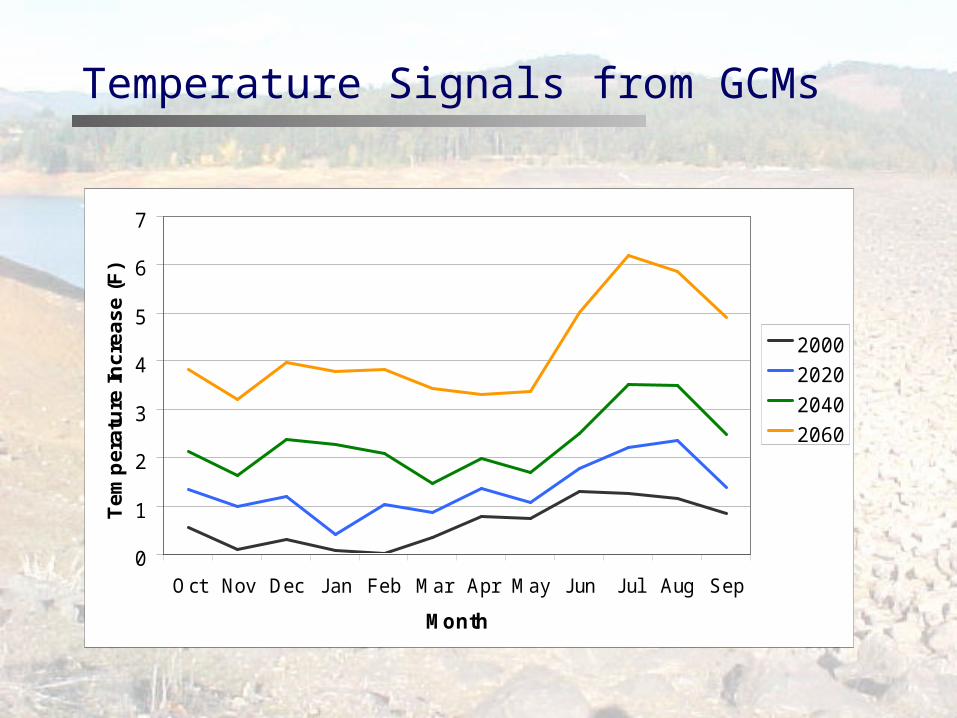
Temperature Signals from GCMs
0
1
2
3
4
5
6
7
Oct Nov Dec Jan Feb Mar Apr May Jun Jul Aug Sep
Month
Te
mp
era
ture
In
cre
as
e (
F)
2000
2020
2040
2060

-30%
-20%
-10%
0%
10%
20%
Oct Nov Dec Jan Feb Mar Apr May Jun Jul Aug Sep
Month
Cha
nge
in P
reci
pita
tion
2000
2020
2040
2060
Precipitation Signals from GCMs

Impacts on Hydrology
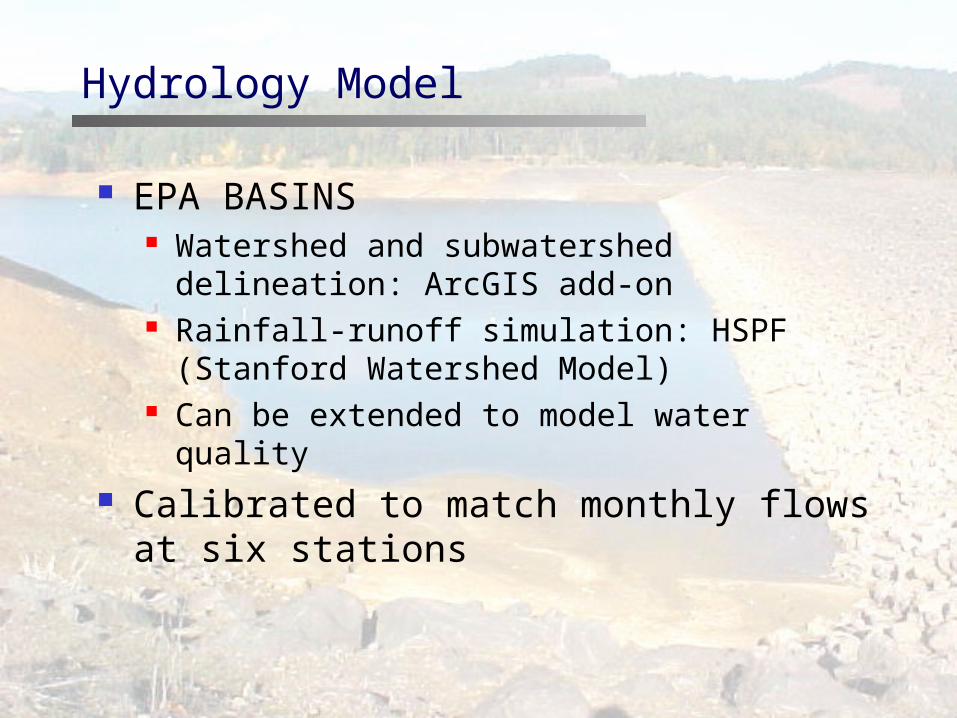
EPA BASINS Watershed and subwatershed delineation:
ArcGIS add-on Rainfall-runoff simulation: HSPF (Stanford
Watershed Model) Can be extended to model water quality
Calibrated to match monthly flows at six stations
Hydrology Model

BASINS Model Nodes

0
50
100
150
200
250
300
Jan Feb Mar Apr May Jun Jul Aug Sep Oct Nov Dec
Av
era
ge
Flo
w (
cfs
)
2000 (modeled)
2020
2040
2060
Impacts on Hydrology: Hagg Lake Inflows

Flows at Mouth of Dairy Creek (July-October)
127 125
114
105
90
100
110
120
130
2000(modeled)
2020 2040 2060
Climate
Ave
rag
e F
low
(cf
s)
Impacts on Hydrology: Summer Flows

Impacts on Water Resources System
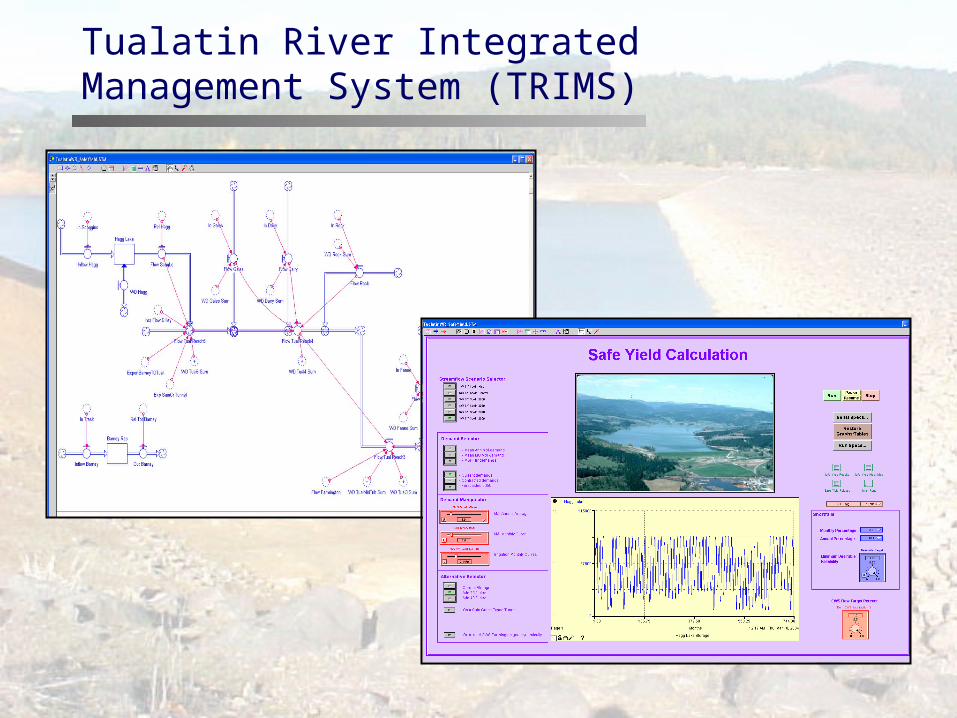
Tualatin River Integrated Management System (TRIMS)

TRIMS Description
Dynamic model of the basin Purpose: Calculate system yield Incorporates
Major system features and operations BASINS inflows M&I and Ag water supply demands
Present, Contracted, 2050 CWS environmental targets (Present, 2050) Instream flow targets Scoggins Dam expansion alternatives
Increase dam elevation by 20 ft, 40 ft

Hagg Lake Storage – Current System

Hagg Lake Storage – 40 ft Expansion

Hagg Lake Yield – Current System
30,000
35,000
40,000
45,000
50,000
2000 2020 2040 2060
Saf
e Y
ield
(ac
re-f
eet)
98% Reliable Yield 97% Reliable Yield
95% Reliable Yield 90% Reliable Yield
40000 acre-ft/100 days = 130mgd40000 acre-ft/150 days = 87 mgd
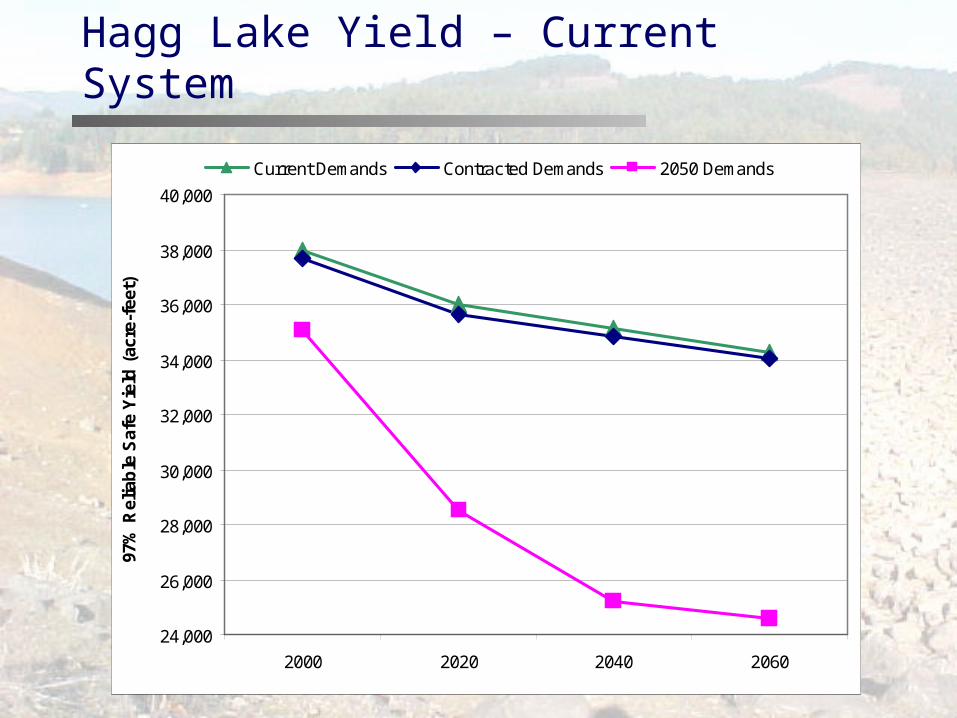
Hagg Lake Yield – Current System
24,000
26,000
28,000
30,000
32,000
34,000
36,000
38,000
40,000
2000 2020 2040 2060
97%
Rel
iab
le S
afe
Yie
ld (
acre
-fee
t)
Current Demands Contracted Demands 2050 Demands
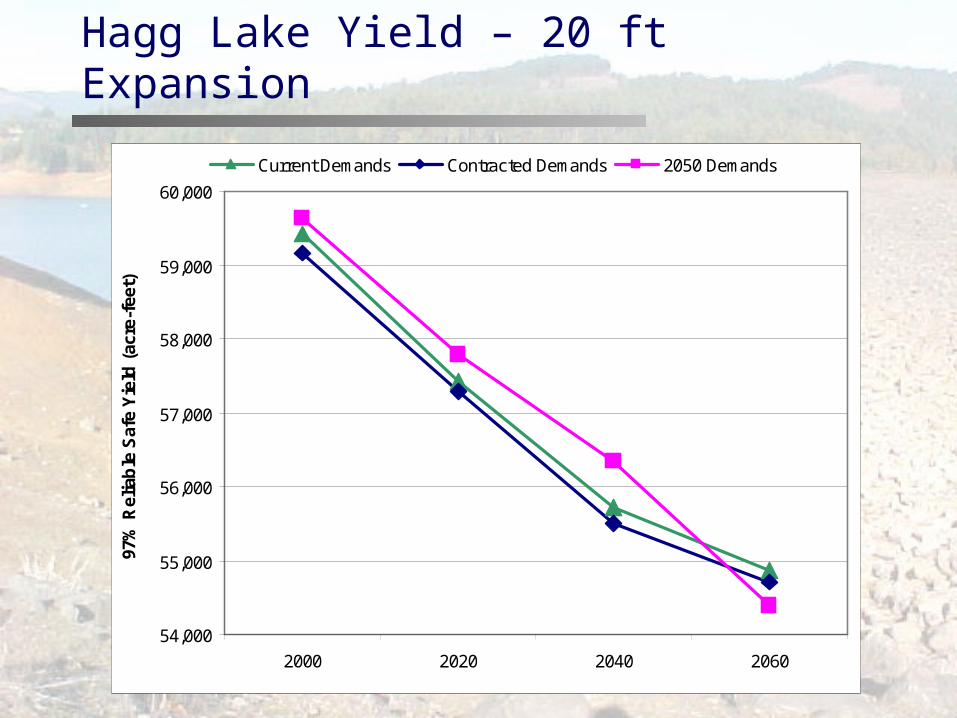
Hagg Lake Yield – 20 ft Expansion
54,000
55,000
56,000
57,000
58,000
59,000
60,000
2000 2020 2040 2060
97%
Rel
iab
le S
afe
Yie
ld (
acre
-fee
t)
Current Demands Contracted Demands 2050 Demands

Hagg Lake Yield – 40 ft Expansion
70,000
71,000
72,000
73,000
74,000
75,000
2000 2020 2040 2060
97%
Rel
iab
le S
afe
Yie
ld (
acre
-fee
t)
Current Demands Contracted Demands 2050 Demands
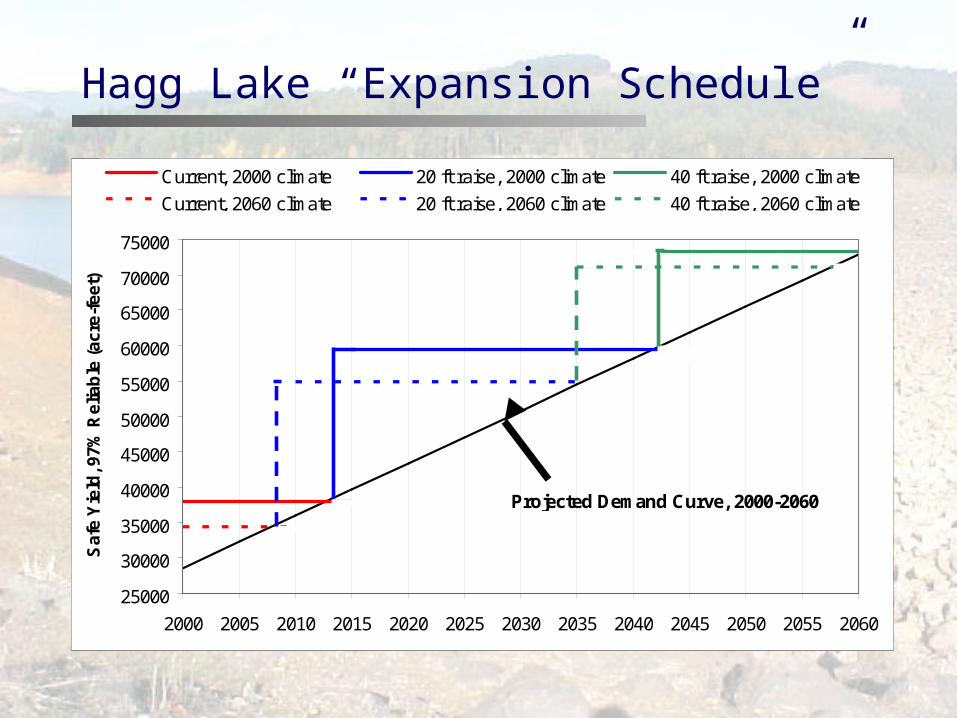
Hagg Lake “Expansion Schedule”
25000
30000
35000
40000
45000
50000
55000
60000
65000
70000
75000
2000 2005 2010 2015 2020 2025 2030 2035 2040 2045 2050 2055 2060
Sa
fe Y
ield
, 97
% R
elia
ble
(a
cre
-fe
et)
Current, 2000 climate 20 ft raise, 2000 climate 40 ft raise, 2000 climate
Current, 2060 climate 20 ft raise, 2060 climate 40 ft raise, 2060 climate
Projected Demand Curve, 2000-2060

Conclusion

Conclusion
Impacts on Temperature and Precipitation
Increase in temperature of 2-4 °F Wetter winters, drier summers
Impacts on Streamflow 10-20% lower flows in summer, wetter
winters Impacts on Yield
Decreases 1.5% per decade for current system and current demands

Conclusion
System Expansion without climate change
97% reliable yield increased from 38,000 acre-ft per year to 60,000 acre-ft (20-ft expansion) and 73,000 acre-ft (40-ft expansion)
System Expansion with climate change by 2040
Yield shifts downward by about 4,000 acre-ft
Climate change impacts suggest expansion needed 5-8 years earlier