impacts of polar vortex, npo, and sst ... - iapjournals.ac.cn
TRANSCRIPT

ADVANCES IN ATMOSPHERIC SCIENCES, VOL. 30, NO. 1, 2013, 193–209
Impacts of Polar Vortex, NPO, and SST Configurations
on Unusually Cool Summers in Northeast China.
Part I: Analysis and Diagnosis
LIAN Yi1,2 (廉 毅), SHEN Baizhu1,2 (沈柏竹), LI Shangfeng∗1,2 (李尚锋),ZHAO Bin5 (赵 滨), GAO Zongting1,2 (高枞亭), LIU Gang1,3 (刘 刚),
LIU Ping1,3,4 (刘 平), and CAO Ling4 (曹 玲)
1Laboratory of Research for Middle–High Latitude Circulation Systems and East
Asian Monsoon, Changchun 130062
2Institute of Meteorological Sciences of Jilin Province, Changchun 130062
3Jilin Meteorological Science and Technology Service Center, Changchun 130062
4Center of Weather Film in Jilin Province, Changchun 130062
5National Meteorological Center, Beijing 100081
(Received 7 January 2012; revised 7 March 2012)
ABSTRACT
This study unveils the evolution of two major early signals in the North Pacific atmosphere–oceansystem that heralded abnormal high-pressure blockings and cold-vortex activities across Northeast China,based on an analysis of the configurations of major modes including the polar vortex, the North PacificOscillation (NPO), and SST in the preceding winter and spring and atmospheric low-frequency disturbancesin Northeast China. We analyzed these aspects to understand the atmosphere–ocean physical couplingprocesses characterized by the two early signals, and here we explain the possible mechanisms throughwhich dipole circulation anomalies affect the summer low-temperature processes in Northeast China. Wefurther analyzed the interdecadal variation background and associated physical processes of the two earlysignals.
Key words: polar vortex, NPO, North Pacific SST, atmosphere–ocean coupling, summer low temperaturesin Northeast China, dipole pattern
Citation: Lian, Y., B. Z. Shen, S. F. Li, B. Zhao, Z. T. Gao, G. Liu, P. Liu, and L. Cao, 2013: Impacts ofpolar vortex, NPO, and SST configurations on unusually cool summers in Northeast China. Part I: Analysisand diagnosis. Adv. Atmos. Sci., 30(1), 193–209, doi: 10.1007/s00376-012-1258-x.
1. Introduction
The interaction between the ocean and the atmo-sphere is an important subject of global climate dy-namics. The North Pacific Ocean and the Eurasiancontinent have the most extensive ocean–land connec-tions in the world. In this context, the atmosphere–ocean coupling processes and their associated telecon-nections, as well as their impacts on climate variations,have attracted much attention. Bjerknes (1966, 1969)
first proposed the concept of El Nino-Southern Oscil-lation (ENSO) that shows a major link with globalclimate anomalies in the form of atmosphere–oceanteleconnections. Rogers (1981) pinpointed a NorthPacific Oscillation (NPO), similar to the North At-lantic Oscillation (NAO). Wallace and Gutzler (1981)summarized the western Pacific (WP) teleconnectionpattern, an upper-level teleconnection version of theNPO. Some studies have revealed a teleconnectionwave train that travels in a large circular path between
∗Corresponding author: LI Shangfeng, [email protected]
© China National Committee for International Association of Meteorology and Atmospheric Sciences (IAMAS), Institute of AtmosphericPhysics (IAP) and Science Press and Springer-Verlag Berlin Heidelberg 2013

194 FACTORS IMPACT ON UNUSUALLY COOL SUMMERS IN NORTHEAST CHINA VOL. 30
the North Pacific and the North American continent(PNA; Namias, 1951; Klein, 1952; Wallace and Gut-zler, 1981). Knowledge of atmosphere–ocean telecon-nections in the North Pacific region has improved, es-pecially since Madden and Julian (1971, 1972) discov-ered the 40-day low-frequency oscillation (LFO). Someregional circulation anomalies might be the result of astring of dynamic processes, including the forcing bothin and outside of the region and the nonlinear inter-actions between waves and currents. The presence ofthe Pacific–Japan Oscillation (PJO) is closely associ-ated with convective activities over the western equa-torial Pacific or ENSO events. Huang and Li (1988)held that the PJ wave train that collided with NorthAmerica via East Asia is directly associated with theconvection heating in the Philippines area. He alsoproposed an East Asia/Pacific (EAP) teleconnectionpattern, in an attempt to demonstrate the intervari-ation within the western Pacific subtropical high, themeiyu trough, and the Northeast Asia high (Huangand Li, 1987; Huang and Sun, 1992; Yang and Sun,2005, Yang et al., 2005, Liang et al., 2011).
Attentions has been given to the possible linkagebetween the North Pacific atmosphere–ocean systemand the unusually cool summers in Northeast Chinasince the 1980s. Li (1989) reported a negative anomalycenter above Northeast China in an El Nino summer,which contributes to the lower-than-normal tempera-ture in the region. Zhang (1990) also indicated thatEl Nino results in the lower-than-normal temperaturein the Northeast region. Other studies, however, haveshown that in the 1950s–1970s, Changchun has an un-usually cool summer if El Nino warming commencesfrom the first half of the year (Lian and An, 1998).However, in the period 1980–1995, Changchun re-ported a higher or slightly higher than normal temper-ature pattern in summer, which had to be explained bythe differed interseasonal oscillations staged by El Ninoand outgoing longwave radiation (OLR; Lian and An,1998). Zheng and Ni (1999) pointed out that the un-usually cool summer in Northeast China had a decadalconnection with ENSO events. Sun and Wang (2006)also confirmed this finding. In addition, scientists havebegun to investigate the possible impacts of a polarvortex and NPO on climate in China, assembling arange of facts to make the teleconnections evident be-tween the polar vortex and unusually cool summersin the Northeast, and between the NPO phases in thepreceding winter and the summer atmospheric circu-lations, including Hadley circulation and precipitationdistribution in China (Zhang et al., 1985; Zhao andLiao, 1992; Peng and Zhang, 1998; Liu et al., 2002,2003; Lian, 2007; Zhou et al., 2008).
In 2009, both Jilin and Heilongjiang, two provinces
in Northeast China, reported an unusually cool sum-mer (cooler than any in the prior 15 years), with mostof the two provinces reporting an averaged temper-ature anomaly exceeding −0.5◦C (National ClimateCenter, 2010). The cool temperatures jeopardized lo-cal food production, especially the rice yield, whichdrew additional public attention again (Shen et al.,2011).
This study investigated the configuration of thepolar vortex and NPO with North Pacific westerlydrifts and ENSO phase, from the perspective of theinteractions between the spring polar vortex and high-latitude atmosphere–ocean system, based on the twotypical Northeast China summer low temperature in-cidences that occurred in 1964 and 1993. In this study,diagnosis analysis was applied to analyze the fact thatthe opposite early signals given by the two examples inthe spring surprisingly yielded a remarkably similar so-phisticated story, where high blocking and diversifiedabnormal cold vortex activities prompted the occur-rence of an unusually cool summers in the NortheastChina. Herein, the so-called “spring forecast thresh-old” is explained, and the physical mechanisms of high-low incidences that allow the mid- and high-latitudeatmosphere–ocean coupling processes to stage a sus-tained cool summer decadal variation period in theNortheast China are revealed. The numerical model-ing results will be presented in Part II of this study.
2. Data and calculation method
In this study, the 1948–2009 global reanalysis datawas acquired from the National Centers for Environ-mental Prediction/National Center for AtmosphericResearch (NCEP/NCAR), the 1958–2002 reanalysiswas provided by the European Center for Medium-Range Weather Forecast (ECMWF), and the 1881–2005 SST data from the Meteorology Office of theHadley Centre for Climate Change. According to thetime scale defined by Shen et al. (2011) for classifyingthe extreme summer low-temperature events in North-east China, a grade A cool summer event (i.e., serious)was defined as T 6−8 6 −1.0σ (T 6−8 stands for thesummer mean temperature of Changchun observatorystation, σ represents standard deviation) observed at aweather station in the region; likewise, a grade B coolsummer event was defined as −1.0σ < T 6−8 6 −0.4σ.Both Changchun and Harbin were chosen as typicalrepresentatives of the temperature variation patternsin Northeast China (Lian and An, 1998). The summerof 1964, a cool summer event A, was chosen as a typi-cal high-incidence example for diagnosis, and the sum-mer of 1993, a cool summer event B, was chosen as atypical low-incidence example, based on the periodical

NO. 1 LIAN ET AL. 195
variations of cold and warm events (high and low inci-dence of low temperature events) over the past 30–40years recorded by two weather stations at which sur-face temperature observations were made for at leastthe prior 100 years (Lian and An, 1998; Shen et al.,2011).
The 500-hPa height field harmonic analysis (Chou,1985) was applied to analyze the low-frequency varia-tions of super-longwave perturbation that contributedto the blocking-high and cold-vortex activities inNortheast China (Lian et al., 2010). The band-passfilter used by Li (1990) was applied to calculate the 30–60-day low-frequency oscillations in the 500-hPa vor-ticity field. The Rossby wave energy dispersion processwas analyzed using the approach developed by Buehand Nakamura (2007). Meanwhile, singular value de-composition (SVD) was employed for related analyses(Demmel and Kahan, 1990).
The polar vortex activity area index was calculatedbased on the formula and parameters given by Liu(1986). The target Pacific region covers an area from150◦E to 120◦W. The Pacific-sector polar vortex areaon the 500-hPa isobaric surface starts north of the con-tour bearing the signature of a polar vortex boundaryto the pole:
S =∫ π
2
ϕ
∫ λ2
λ1
R2 cos ϕdϕdλ = R2(1− sinϕ)(λ2 − λ1) ,
(1)which can be calculated per 10◦ longitude in a differ-ential format. Here, R stands for the Earth’ s radiusat 6378 km, the units of S are 105 km, ϕ representslatitude, λ represents longitude. Based on different re-gions, the indices of polar vortex area S were dividedinto five categories as follows:when λ1 = 0◦, λ2 = 360◦, and S is the index of North-ern Hemisphere polar vortex area;λ1=60◦, λ2=150◦, and S is the index of Asian polarvortex area;λ1=240◦, λ2=330◦, and S is the index of North Amer-ica polar vortex area;λ1=330◦, λ2=420◦, (i.e., region covering from 30◦Wto 60◦E, in an anticlockwise direction.), and S is theindex of Atlantic and European polar vortex area;λ1=150◦, λ2=240◦, and S is the index of the Pacificpolar vortex (PPV) area.
The definition area and indexes of the NortheastCold Vortex (NCV) and the NPO can be found in thework of Zhao and Liao (1992) and Liu et al. (2003);and the definition area of the central and westernAsian blocking highs can be found in the work of Liuet al. (2012). The westerly drift zone was confined toan area from 150◦E–150◦W to 30◦–46◦N.
The NCV was defined as follows: over the region(35◦–60◦N, 115◦E–145◦W), there is at least one closed
contour on 500-hPa geopotential height, accompanieda cold center or cold trough, and it maintains this statefor at least three days within the defined domain. Theblocking high was defined as follows: There is a centerof high pressure on 500-hPa geopotential height, andthe position of the center moves <2.5 times the merid-ian distance each day; moreover, the high-pressurecenter is maintained for at least three days.
The index of NPOL (L was the abbreviation for thefamily name of “LIAN Yi”) was defined as follows:
NPOL = PS1 − PS2 , (2)
PS1, PS2 means the area average of standardized seasurface pressure over the domain of (25◦–40◦N, 140◦E–150◦W) and (50◦–65◦N, 140◦E–150◦W).
The westerly drift index W was defined as follows:W = Asst where Asst is the area average of standard-ized SST over the domain (30◦–46◦N, 150◦E–150◦W).
The NAO index (NAOI) was defined as the dif-ference in the normalized monthly sea level pressure(SLP) regionally zonal-averaged over the North At-lantic sector from 80◦W to 30◦E between 35◦N and65◦N (Li and Wang, 2003).
The statistical significance of a composite differ-ence was assessed using the Student’s t-test. The 95%confidence level was considered significant, unless oth-erwise stated.
3. Connections between the PPV and NPOseasonal evolution
3.1 Weak or strong anomalies for the springPPV area
Four typical weak and four typical strong yearswere selected separately from the spring PPV areaindex series. Strong years (1984, 1993, 1996, and2005) reported an averaged anomaly of > 15×105 km2,whereas the weak years (1948, 1964, 1967, and 2002)reported an averaged anomaly of 6 −20×105 km2.
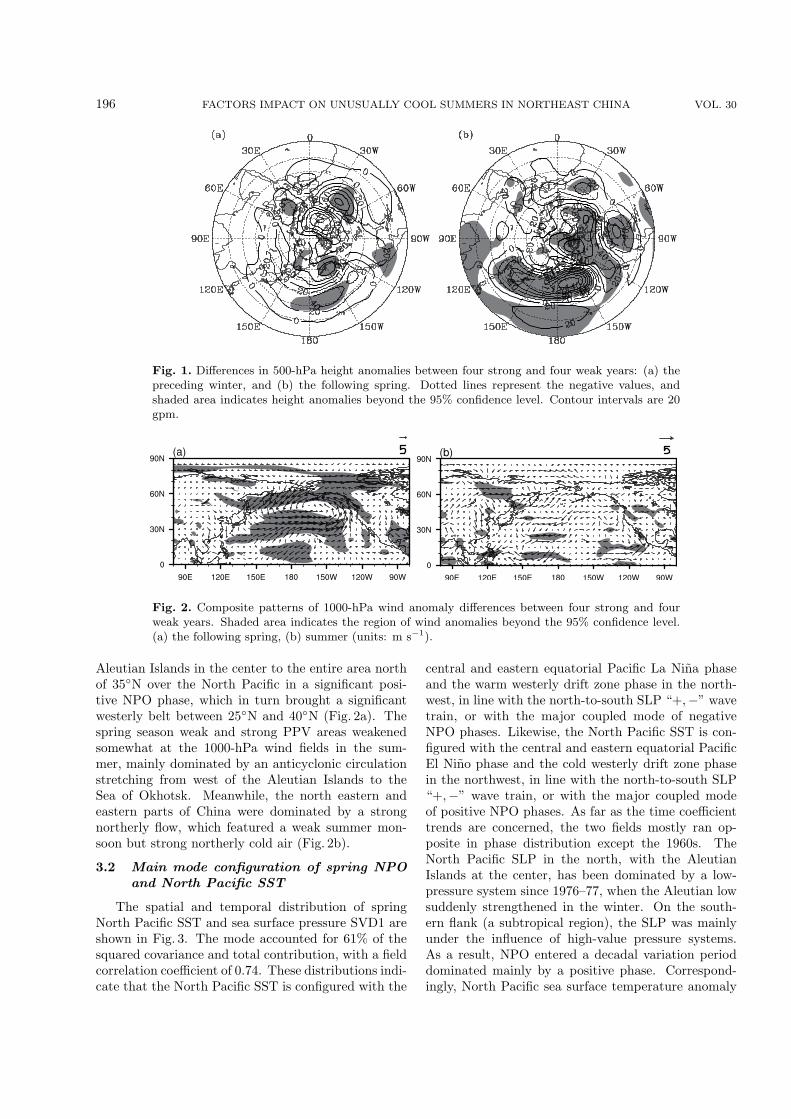
Figure 1a shows that the 500-hPa height-anomalydifferences between four strong minus four weak yearsin the preceding winter formed in a pattern thatfeatures positive anomalies above the Aleutian Is-lands and negative anomalies on the southern flankof the North Pacific sector, a typical NPO-like nega-tive phase. However, the 500-hPa height-anomaly dif-ferences (four years) depicted an entirely opposite pic-ture against the preceding winter (Fig. 1b); they endedup in a north–south “−,+” distribution, suggesting astrong North PPV area, favoring an NPO-like positivephase.
The weak and strong PPV areas in the spring un-derwent a composite 1000-hPa wind anomalies domi-nated by the cyclonic circulation stretching from the
196 FACTORS IMPACT ON UNUSUALLY COOL SUMMERS IN NORTHEAST CHINA VOL. 30
Fig. 1. Differences in 500-hPa height anomalies between four strong and four weak years: (a) thepreceding winter, and (b) the following spring. Dotted lines represent the negative values, andshaded area indicates height anomalies beyond the 95% confidence level. Contour intervals are 20gpm.
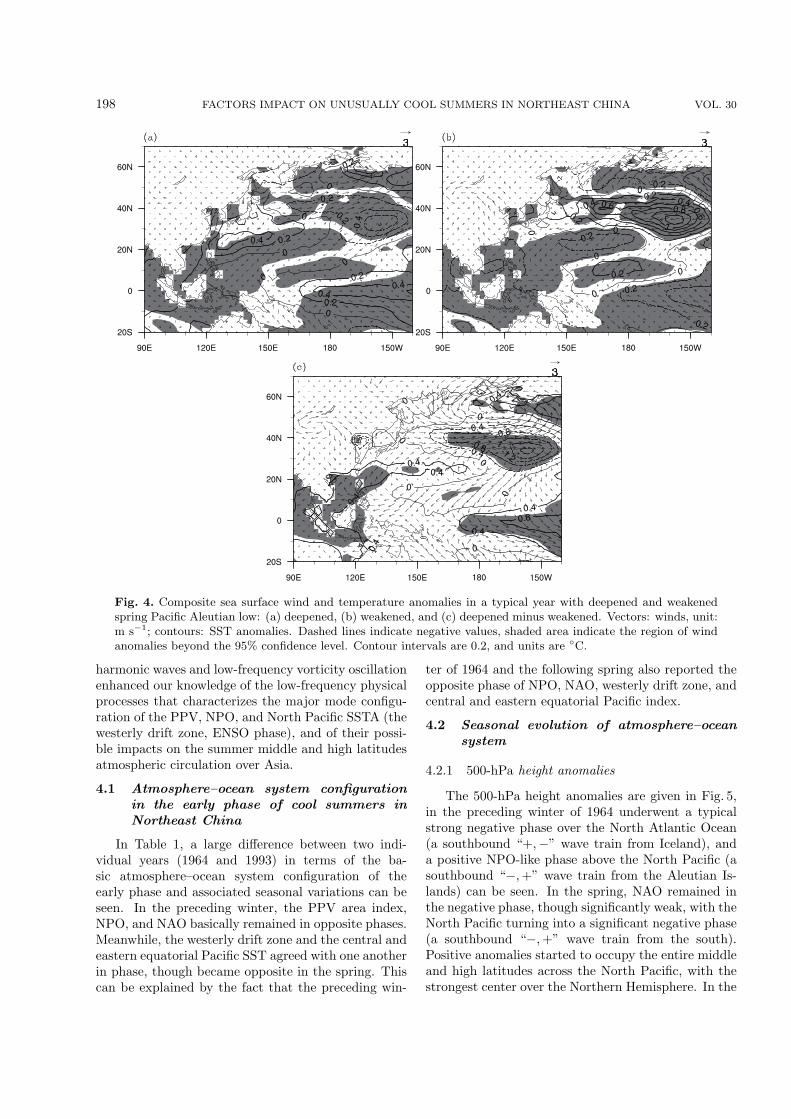
Fig. 2. Composite patterns of 1000-hPa wind anomaly differences between four strong and fourweak years. Shaded area indicates the region of wind anomalies beyond the 95% confidence level.(a) the following spring, (b) summer (units: m s−1).
Aleutian Islands in the center to the entire area northof 35◦N over the North Pacific in a significant posi-tive NPO phase, which in turn brought a significantwesterly belt between 25◦N and 40◦N (Fig. 2a). Thespring season weak and strong PPV areas weakenedsomewhat at the 1000-hPa wind fields in the sum-mer, mainly dominated by an anticyclonic circulationstretching from west of the Aleutian Islands to theSea of Okhotsk. Meanwhile, the north eastern andeastern parts of China were dominated by a strongnortherly flow, which featured a weak summer mon-soon but strong northerly cold air (Fig. 2b).
3.2 Main mode configuration of spring NPOand North Pacific SST
The spatial and temporal distribution of springNorth Pacific SST and sea surface pressure SVD1 areshown in Fig. 3. The mode accounted for 61% of thesquared covariance and total contribution, with a fieldcorrelation coefficient of 0.74. These distributions indi-cate that the North Pacific SST is configured with the
central and eastern equatorial Pacific La Nina phaseand the warm westerly drift zone phase in the north-west, in line with the north-to-south SLP “+,−” wavetrain, or with the major coupled mode of negativeNPO phases. Likewise, the North Pacific SST is con-figured with the central and eastern equatorial PacificEl Nino phase and the cold westerly drift zone phasein the northwest, in line with the north-to-south SLP“+,−” wave train, or with the major coupled modeof positive NPO phases. As far as the time coefficienttrends are concerned, the two fields mostly ran op-posite in phase distribution except the 1960s. TheNorth Pacific SLP in the north, with the AleutianIslands at the center, has been dominated by a low-pressure system since 1976–77, when the Aleutian lowsuddenly strengthened in the winter. On the south-ern flank (a subtropical region), the SLP was mainlyunder the influence of high-value pressure systems.As a result, NPO entered a decadal variation perioddominated mainly by a positive phase. Correspond-ingly, North Pacific sea surface temperature anomaly

NO. 1 LIAN ET AL. 197
Fig. 3. Distribution of spring North Pacific SST (left) and sea-level pressure (right) in the sameseason and associated time coefficients: (a) and (b) show time coefficients, and (c) and (d) showdistributions.
(SSTA) have been dominated by the cold northwestdrift zone phase in the north since 1976, with the cen-tral and eastern equatorial Pacific under an El Ninophase, which agreed with the Pacific Decadal Oscilla-tion (PDO) warm-phase analysis made by Mantua etal. (1997).
For five typical years with deepened spring PacificAleutian lows (1980, 1998, 1991, 1981, and 1987) andweakened spring Pacific Aleutian lows (1989, 1964,1976, 1972, and 1967), based on SVD1 time coeffi-cients, the real strength of Aleutian low and NPOindex were chosen. Then composite SST and windanomalies were analyzed. Our results are presented inthe next section.
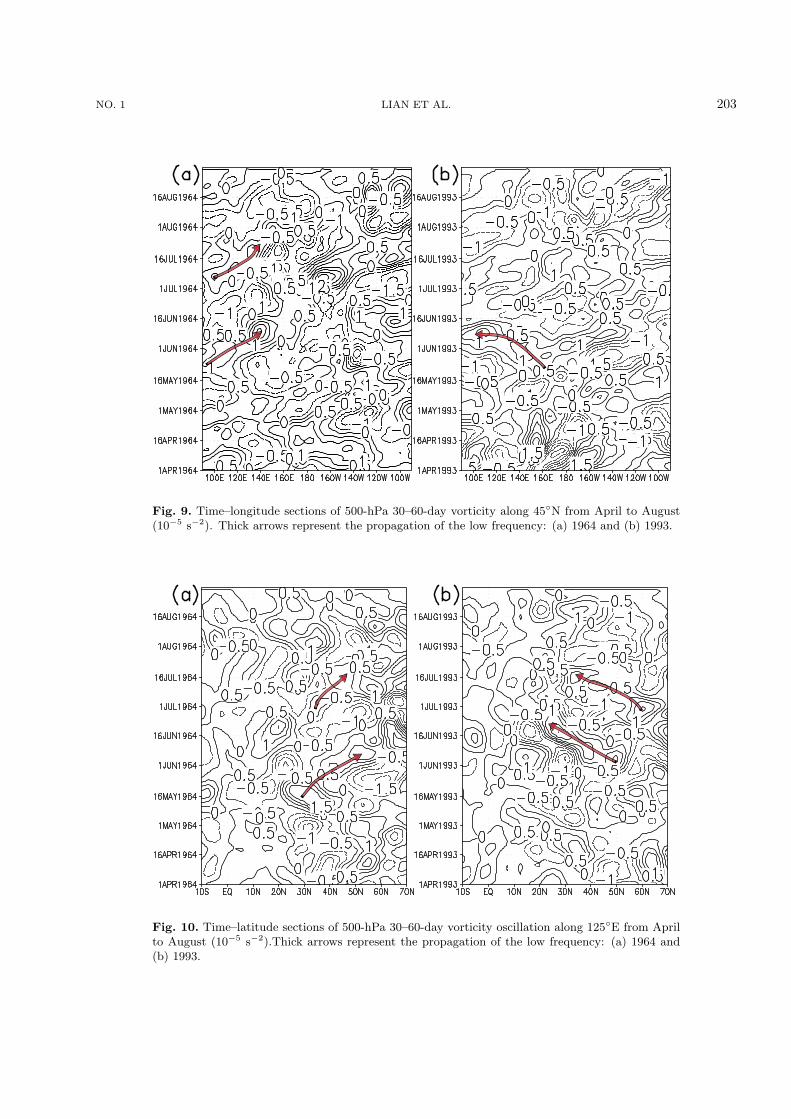
Figure 4a depicts the composite sea-surface windand temperature anomalies for five individual yearswith deepened North Pacific Aleutian lows. The deep-ened northern Pacific Aleutian low bred out an equa-torial northwesterly flow, or even a westerly flow overeast of 155◦E, which weakened the Walker circulation.The deepened Aleutian low in the spring also led tothe convergence of prevailing westerly jets in the east-ern Pacific westerly drift zone (35◦–45◦N) in the southand the northwesterly north 45◦N to the west, forcingthe westerly drift zone SSTA to remain in a cold phase.Five individual years with weakened northern PacificAleutian lows (Fig. 4b) had a composite sea surfacewind and temperature anomaly running just oppositein distribution, with easterly jet prevailed over thewesterly drift zone, and hence a warm SSTA phase,and the southeasterly over the equatorial zone east of155◦E, was favorable for a strengthened easterly underthe Walker circulation. In Fig. 4c, a cold SSTA phasein the westerly drift zone and a warm SSTA phasein the central-eastern equatorial Pacific ocean can be
clearly seen. Our analysis confirms the rationality ofthe aforementioned coupled atmosphere–ocean SVD1mode, as well as the dynamic role played by sea-levelpressure in defining SSTA fields.
In this section, a composite analysis and the SVDmethod were employed to reveal the major mode con-figuration of the PPV, NPO, and northern Pacific SST(the westerly drift zone, ENSO phase), in an attemptto sort out the strong and weak spring Pacific sectorpolar vortex area that contributes to positive and neg-ative NPO phase anomalies at the mid-troposphereand in SLP. Meanwhile, positive or negative NPOphase anomalies often agreed with the first coupledmode that enjoys a stable westerly drift zone SSTcold and warm phase and a similarly stable El Ninoor La Nina phase (i.e., SVD1 accounted for 60% ofthe squared covariance and total contribution). Thisconclusion was further confirmed by the composite seasurface wind and temperature anomalies in a typicalyear with deepened and weakened spring Pacific Aleu-tian low.
4. Seasonal evolution of two early signals andassociated atmospheric low-frequency vari-ations
We analyzed the basic mode configuration ofatmosphere–ocean systems in the early stage and theassociated seasonal evolution for cool summer yearsbased on two cities (Changchun and Harbin) that re-ported significant unusually cool summers in two typ-ical years featuring either a high (1964) or low (1993)incidence of cool summers on a decadal background.The diagnosis of the seasonal evolution of two differ-ent early signals and their associated mid-troposphere
198 FACTORS IMPACT ON UNUSUALLY COOL SUMMERS IN NORTHEAST CHINA VOL. 30
Fig. 4. Composite sea surface wind and temperature anomalies in a typical year with deepened and weakenedspring Pacific Aleutian low: (a) deepened, (b) weakened, and (c) deepened minus weakened. Vectors: winds, unit:m s−1; contours: SST anomalies. Dashed lines indicate negative values, shaded area indicate the region of windanomalies beyond the 95% confidence level. Contour intervals are 0.2, and units are ◦C.
harmonic waves and low-frequency vorticity oscillationenhanced our knowledge of the low-frequency physicalprocesses that characterizes the major mode configu-ration of the PPV, NPO, and North Pacific SSTA (thewesterly drift zone, ENSO phase), and of their possi-ble impacts on the summer middle and high latitudesatmospheric circulation over Asia.
4.1 Atmosphere–ocean system configurationin the early phase of cool summers inNortheast China
In Table 1, a large difference between two indi-vidual years (1964 and 1993) in terms of the ba-sic atmosphere–ocean system configuration of theearly phase and associated seasonal variations can beseen. In the preceding winter, the PPV area index,NPO, and NAO basically remained in opposite phases.Meanwhile, the westerly drift zone and the central andeastern equatorial Pacific SST agreed with one anotherin phase, though became opposite in the spring. Thiscan be explained by the fact that the preceding win-
ter of 1964 and the following spring also reported theopposite phase of NPO, NAO, westerly drift zone, andcentral and eastern equatorial Pacific index.
4.2 Seasonal evolution of atmosphere–oceansystem
4.2.1 500-hPa height anomalies
The 500-hPa height anomalies are given in Fig. 5,in the preceding winter of 1964 underwent a typicalstrong negative phase over the North Atlantic Ocean(a southbound “+,−” wave train from Iceland), anda positive NPO-like phase above the North Pacific (asouthbound “−,+” wave train from the Aleutian Is-lands) can be seen. In the spring, NAO remained inthe negative phase, though significantly weak, with theNorth Pacific turning into a significant negative phase(a southbound “−,+” wave train from the south).Positive anomalies started to occupy the entire middleand high latitudes across the North Pacific, with thestrongest center over the Northern Hemisphere. In the

NO. 1 LIAN ET AL. 199
Table 1. Seasonal evolution of indexes in 1964 and 1993.
Last winter Spring Summer
PPV area index 1964 −1.8 −20.6 17.2(anomaly) 1993 4.3 24.7 9.2NPO index 1964 0.67 −0.3 0.44
1993 0.1 0.1 −1.19NAO index 1964 −0.76 0.9 −0.62
1993 1.41 −0.1 0.52ENSO 1964 0.81 −0.4 −0.67
1993 0.28 0.84 0.47Westerly drift index 1964 −0.36 0.64 0.40
1993 −0.29 −1.18 −1.9
summer, NAO continued at its weak negative status.However, it was very difficult to determine the NPOphase status, positive or negative, at middle and highlatitudes, as the southbound “−,+” wave train hasmoved to Northeast Asia from the south. A positive500-hPa height anomaly stretched from the LaptevSea to northern Kamchatka Peninsula via the EastSiberian Sea from the south. Negative anomaliescovered the mid-latitudes in Asia and their south-ern neighbors, placing the southern part of the Seaof Okhotsk, Northeast China, and southern Yakutskunder the influence of the same negative anomalies.Meanwhile, a weak positive anomaly (Figs. 5a–c) pre-vailed over the Ural Mountains in the north. In thepreceding winter, and in the spring and summer of1993, both NAO and NPO registered a phase evolutionopposite that of 1964. In the preceding winter, NAOwas in a positive phase enjoying a southeast bound“+,−” wave train over Iceland from the northwest,while NPO remained in an atypical negative phase.In the spring, NAO was atypically positive in phase,exhibiting a southwest-bound “−,+” wave train fromthe northeast, with NPO in a strong positive phase.The negative anomalies above the Aleutian Islandsswept across the entire middle and high latitudes in theNorth Pacific, with its central value at its lowest overthe Northern Hemisphere. In the summer, both NAOand NPO were positioned in a significantly weakenednegative phase, with strong positive anomalies runningfrom the Asian Ural Mountains in the north to NovayaZemlya, suggesting that the blocking was particularlystrong in western Asia, with a relatively weak positiveanomaly blocking over a stretch from Lake Baikal tothe Sea of Okhotsk. As a result, the Eurasian mid-latitudes were prevailed upon by negative anomalies,and a vast region from Northeast China to 30◦N andthe northwestern Pacific were dominated by −20 gpmnegative anomalies (Figs. 5d–f).
Apparently, Northeast Asia mid-latitudes weredominated by significant negative anomalies, despite
the fact that 1964 and 1993 had somewhat differentatmosphere–ocean mode configurations and seasonalevolutions in the early stages, and that the summerof 1964 was prevailed upon by Northeast Asian high-latitude blocking and the summer of 1993 a westernAsian mid- and high-latitude blocking.
4.2.2 SST anomaliesFigure 6 depicts the seasonally averaged SST
anomalies over the North Pacific. In 1964 the SSTAover the North Pacific westerly drift zone changed fromthe eastbound “−,+” wave train featuring a vaguewarm or cold phase in the preceding winter into anabruptly enhanced spring warm phase that sustainedand further enhanced into the summer. In the pre-ceding winter, the central and eastern equatorial Pa-cific SSTA remained in a pattern that featured a weakwarm phase for the central Pacific and a weak coldphase for the eastern Pacific. The pattern was trans-formed into a consistent strong La Nina phase in thespring that continued into the summer. In the pre-ceding winter of 1993, the North Pacific westerly driftzone SSTA was warm in the northwest and cold inthe southeast. The SSTA underwent a cold phase inthe spring and a noticeable cold phase in the summer.Meanwhile, the central and eastern equatorial PacificSSTA changed from a weak warm phase in the pre-ceding winter to a strong El Nino phase in the spring,proceeding into a noticeably weakened warm phase inthe summer.
4.3 Harmonic waves and LFOs
4.3.1 500-hPa ultra-longwave and longwave activitiesFigure 7 shows the 500-hPa ultra-longwave per-
turbation along 45◦N from April to July. Duringthe period April–May 1964, the Northwest Pacificmostly underwent a mobile longwave trough and ridge,rather than a stable ultra-longwave trough above itscentral and western parts. The situation changedstarting at the end of May, when a relatively sta-

200 FACTORS IMPACT ON UNUSUALLY COOL SUMMERS IN NORTHEAST CHINA VOL. 30
Fig. 5. Seasonally averaged 500-hPa height anomalies: (a) the preceding winter, (b) the spring, and (c)the summer of 1964; and (d) the preceding winter, (e) the spring, and (f) the summer of 1993. Shadedareas are for 6 −20. Contour intervals are 20, and units are gpm.

NO. 1 LIAN ET AL. 201
Fig. 6. Seasonally averaged SST anomalies in the Northern Hemisphere: SSTA in (a) the precedingwinter, (b) the spring, and (c) the summer of 1964, and SSTA in (d) the preceding winter, (e) thespring, and (f) the summer of 1993. (Dashed lines are for negative values, and shaded areas are forSSTA 6 −0.6. Contour intervals are 0.2, and units are ◦C.)
ble super-longwave disturbance trough appeared, re-treating westward and wandering over an area westof 120◦E in June–July (Fig. 7a, thick arrows). Dur-ing the period April–July 1993, except the first halfof June, the slow eastbound movement of the up-stream ultra-longwave disturbance confined the west-ern boundary of the trough influence east of 130◦E,though the trough made a rapid west-bound advancein the second half of June, dominating the areas near120◦E. As a result, the central and western parts of thenorthwestern Pacific (Fig. 7b, 120◦E–150◦W, thick ar-rows) was solidly occupied by a stable ultra-longwavedisturbance trough.
Figure 8 shows the 500-hPa ultra-longwave pertur-bation along 65◦N from April to July. In late May1964, an ultra-longwave disturbance ridge that origi-nated from the central and eastern Pacific started toscale back to an area near 120◦E. The same move-ment occurred twice in June–July (Fig. 8a, thick ar-
rows). In mid-June 1993, a noticeable ultra-longwaveridge that originated from the central and eastern Pa-cific retreated to an area near 120◦E (Fig. 8b, thickarrows).
4.3.2 500-hPa vorticity and associated 30–60-d LFO
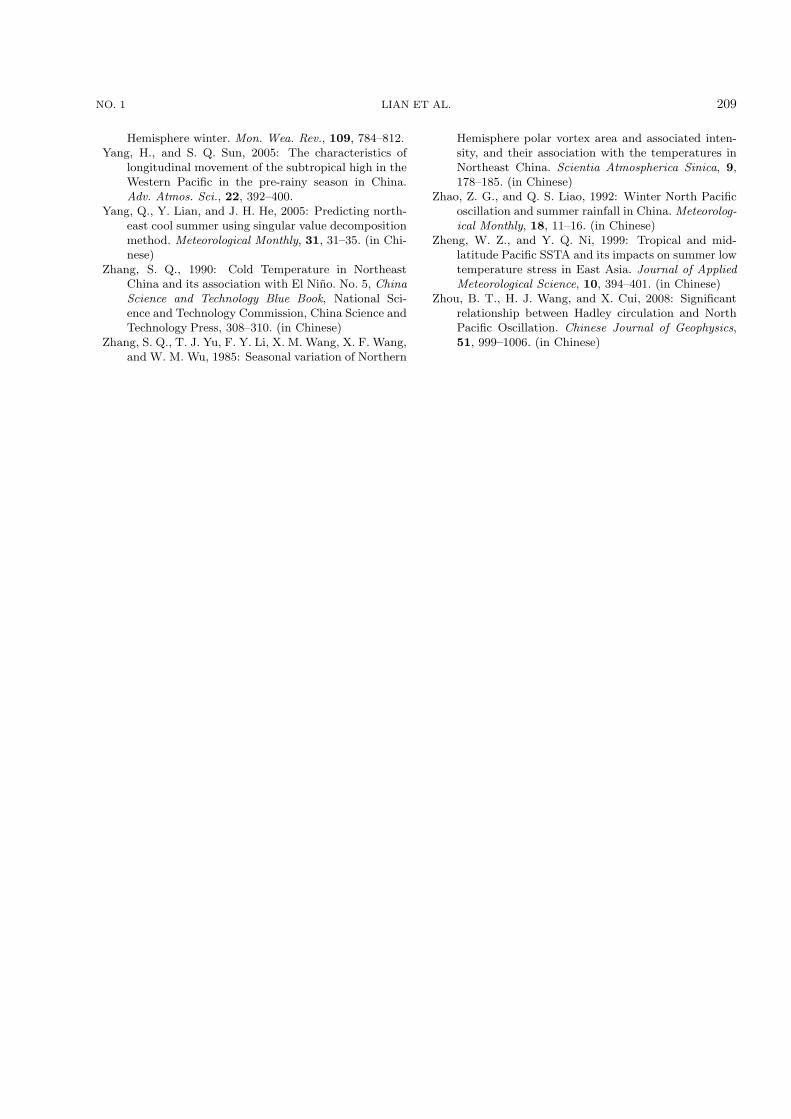
Figure 9 illustrates the time–longitude sections of30–60-day vorticity at 500 hPa along 45◦N from Aprilto August. In the first half of June, the northeastcold vortex activity area (45◦N, 125◦E) saw the east-bound low-frequency vorticity originated from 100◦Ein 1964 (Fig. 9a, thick arrows) and the westboundlow-frequency vorticity stemmed from 160◦E in 1993(Fig. 9b, thick arrows). In the same manner, Fig. 10,where the time–latitude sections of 30–60-day vortic-ity at 500 hPa along 125◦E from April to August weregiven, shows that in most of June, a northbound posi-tive low-frequency vorticity that originated from 15◦–25◦N appeared in 1964 (Fig. 10a, thick arrows), and a

202 FACTORS IMPACT ON UNUSUALLY COOL SUMMERS IN NORTHEAST CHINA VOL. 30
Fig. 7. 500-hPa ultra-longwave perturbation along 45◦N from April to July. Thick arrows representthe propagation of the low frequency: (a) 1964 and (b) 1993 (gpm).
Fig. 8. 500-hPa super-longwave perturbation along 65◦N from April to July. Thick arrows representthe propagation of the low frequency: (a) 1964, and (b) 1993 (gpm).
NO. 1 LIAN ET AL. 203
Fig. 9. Time–longitude sections of 500-hPa 30–60-day vorticity along 45◦N from April to August(10−5 s−2). Thick arrows represent the propagation of the low frequency: (a) 1964 and (b) 1993.
Fig. 10. Time–latitude sections of 500-hPa 30–60-day vorticity oscillation along 125◦E from Aprilto August (10−5 s−2).Thick arrows represent the propagation of the low frequency: (a) 1964 and(b) 1993.

204 FACTORS IMPACT ON UNUSUALLY COOL SUMMERS IN NORTHEAST CHINA VOL. 30
southbound negative low-frequency vorticity that orig-inated north of 50◦N turned up in 1993 (Fig. 10b, thickarrows). This above analysis indicates that 1964 and1993 registered a vorticity propagation in reverses di-rection, regardless of longitudinal or zonal orientation.
5. Rossby waves and abnormal summer dipole
The preceding two sections discuss the relationshipbetween a strong or a weak PPV in the spring and apositive or a negative NPO phase, as well as associ-ated North Pacific SSTA (cold or warm westerly driftzone and ENSO phase). The configuration resultedin a strong PPV in the spring of 1993 and a weakPPV in the spring of 1964. As a typical case, both ofthem contributed to the unusually cool summer eventsin Northeast China. The configuration also causeda 30–60-d LFO to the 500-hPa height anomaly field,ultra-longwave, longwave and vorticity, and definedthe seasonal and monthly evolution pattern of SSTanomalies. To further understand the northeast coldvortex, a system having a direct bearing on the sum-mer low-temperature events in Northeast China, andthe sustained abnormal activities of the Asia blockinghigh (dipole), a major system that has an impact onsummer low-temperature events, this section discussesthe Rossby wave energy dispersion process reported inApril–June of 1964 and 1993, to establish a connec-tion between the dipole and early summer circulationanomalies and to sort out their possible wave sources(Bueh and Nakamura, 2007).
Figure 11 shows the 500-hPa circulation anomaliesand the corresponding wave action in April–June of1964 and 1993. To compare the circulation anoma-lies at different latitudes, the figure also shows geopo-tential height anomalies in the form of stream func-tions (i.e., geopotential height anomalies multipliedby sin45◦/sinϕ, where ϕ represents latitude). Com-parisons among Figs. 11a–f indicate that a “−,+,−”height anomaly wave train appeared over an areastretching from the 500-hPa polar area to the NorthPacific, and from East Asia to North America, in theApril of 1964, and a “+,−,+” height anomaly wavetrain appeared over this region in 1993. The wavesources were basically positioned over the North Pa-cific region in 1993 (Fig. 11d). In 1964, the wavesources were positioned mainly over East Asia, withthe strongest wave source near the western coast ofNorth America (in Fig. 11a, the light gray area rep-resents the largest combined area). No large varia-tions of height anomaly wave train occurred in theMay months of both 1964 and 1993 in the polar sec-tor and in the North Pacific. However, in 1964, thepolar sector registered a negative anomaly, with AO
in a typical positive phase. Meanwhile, the Aleutianlow weakened noticeably again, allowing the positiveanomalies to sweep across the North Pacific with acenter in the south of the Aleutian Islands. The posi-tive anomalies enhanced rapidly, with the central valuereaching 160 gpm, and they became the strongest wavesource and sink at middle and high latitudes over theNorthern Hemisphere (Fig. 11b). The wave action wasbasically northerly and southerly in distribution, ei-ther pointing to the equator above the northwesternPacific or moving toward the pole over the northeast-ern Pacific. In May 1993, the positive polar anomaliesleft AO in a typical negative phase. At that moment,both wave source and sink displayed a large variationin distribution, mainly over the western coast of NorthAmerica, or near Great Britain east of the North At-lantic (Fig. 11e). In June 1964, the strongest positiveanomaly zone in the Northern Hemisphere was foundin an area stretching from the Aleutian Islands to thenorth of the Kamchatka Peninsula, accompanied bywave sources. The positive anomaly zone was appar-ently the result of the northwestward retreat of thepositive anomalies across the North Pacific with a cen-ter in the south of the Aleutian Islands in May 1964(the Rossby wave action flux in early, mid, and lateJune 1964 makes a further evidence, though not shownin the figure). In the south of the anomalies sat a vastnegative anomaly zone, a typical dipole anomaly pat-tern in Northeast Asia (Fig. 11c). In June 1993, themost significant positive anomalies prevailed over anarea in the north of the Ural Mountains, constitutedthe west blocking in Asia, which could mostly be theresult of the eastbound shift of the positive anoma-lies that wandered above the Scandinavian Peninsulain May 1993 (Fig. 11f). The Rossby wave action fluxin early, mid, and late June 1993 makes a further ev-idence to support the scenario (not shown in the fig-ure). It can be seen from Tables 2 and 3 that theJune and summer of 1964 was prevailed upon by theeast blocking and abnormally increased northeast coldvortex days in Asia, which defined a typical NortheastAsia dipole configuration (Fig. 11c). However, in theJune and summer of 1993, the Ural blocking high (westblocking) prevailed, and abnormally increased north-east cold vortex days, which constituted another Asiadipole configuration (Fig. 11f).
6. Decadal variation background of 1964–1993spring polar vortex area index
Figure 12 depicts the opposite variation trends ofthe PPV area index (green line) and the polar vor-tex index in other Northern Hemisphere regions in thespring seasons of 1948–2009. The Mann-Kendall (M-

NO. 1 LIAN ET AL. 205
Fig. 11. 500-hPa geopotential height anomalies (gpm, contours) from April to June and associatedwave action flux (arrows).Contours are set at ±20, ±80, and ±160 gpm, respectively. Dashed linesrepresent negative values. Light shading indicates wave action flux divergence that is > 2×10⁻⁵ ms−2 area. Dark shading indicates wave action flux convergence that is < −2×10⁻⁵ m s−2 area: (a)April, (b) May, and (c) June of 1964, and (d) April, (e) May, and (f) June of 1993.

206 FACTORS IMPACT ON UNUSUALLY COOL SUMMERS IN NORTHEAST CHINA VOL. 30
Table 2. Number of blocking high days in the June of 1964 and 1993. (units: d)
Easterly In-the middle Westerly Others
1964 June 16 0 0 14Early 8 0 0 0Mid 8 0 0 10Late 0 0 0 4
1993 June 12 12 12 13Early 3 12 6 7Mid 0 0 6 0Late 9 0 0 6
Table 3. Summer blocking high and abnormally increased northeast cold vortex days in 1964 and 1993. (units: d)
Blocking highNCV activities (anomaly)
East Central West
1964 +6.4 −12.5 −4.7 52 (+13)1993 −3.6 −11.5 +5.4 46 (+7)
K) method was used to test the point mutation, whichindicated that the former underwent an abrupt changein the late 1960s (Fig. 12b) that was noticeably differ-ent from the one reported by other regions. The PPVsaw a noticeable decline in the spring of 1964, whilethe same indicator saw a noticeable boost in the springof 1993. In Fig. 12a, one can see that five polar vortexindex curves ended up in a continued downward trendheading to 2009.
7. Discussion and conclusion
(1) In this study, the composite anomalies and SVDmethod were employed to reveal the major mode con-
figuration of the PPV, NPO, and North Pacific SSTA(westerly drift zone, ENSO phase), in an attempt tosort out the strong and weak spring PPV area thatmay contribute to positive and negative NPO phaseanomalies at the mid-troposphere and in the sea-levelpressure fields. Meanwhile, positive or negative NPOphase anomalies often agreed with the first coupledmode that enjoys a stable cold or warm westerly driftzone SST phase and an equally stable El Nino orLa Nina phase (e.g., SVD1 accounted for 60% of thesquared covariance and total contribution). This con-clusion was further confirmed by the combined seasurface wind and temperature anomalies in a typicalyear, with deepened or weakened spring Pacific Aleu-
Fig. 12. (a) Combined spring polar vortex area index anomalies, and (b) M-K tests.

NO. 1 LIAN ET AL. 207
tian low.(2) The year 1964, with a high cool summer in-
cidence, and the year 1993, with a low cool summerincidence, were different only in basic atmosphericmode configuration, and their major North PacificSST phases were similar. Compared with the preced-ing winter, the spring of 1964 included a reversed phaserealignment of the PPV index, NPO/NAO, westerlydrift zone, and the central and eastern equatorial Pa-cific SSTA. However, 1993 was consistent in both thepreceding winter and the following spring. As a result,the opposite phases of major atmosphere–ocean sys-tem modes in the spring of two individual years wouldnaturally produce a different evolution from the springto the summer. For example, in the spring of 1964 avery weak PPV occurred, with NPO in a typical neg-ative phase, the westerly drift zone in a strong warmphase, and the central and eastern equatorial PacificSSTA in La Nina phase. In contrast, in the spring of1993, the polar vortex was strong, and NPO occurredin a typical positive phase, with the westerly drift zonein a zero phase and the central and eastern equatorialPacific SSTA in an El Nino phase. Entering the sum-mer, the westerly drift zone was positioned in a no-ticeably cold phase, and the central and eastern equa-torial Pacific SSTA was in a weakened El Nino phase.However, unusually cool summers occurred in both in-dividual years, regardless of the difference between thetwo. The reversed realignment of basic atmosphere–ocean system modes from the preceding winter to thefollowing spring, creating the “spring forecast thresh-old.”
(3) In this study, diagnoses were conducted to un-derstand the evolution patterns of mid-troposphereharmonic waves, low-frequency vorticity oscillations,and Rossby wave energy, to further reveal the factthat both 1964 and 1993 shared a low-frequency phys-ical process that contributed to the mid- and high-latitude summer dipole circulation anomalies, eventhough the two individual years exhibited entirely dif-ferent modes of configuration for spring signal, PPV,NPO, and North Pacific SSTA (westerly drift zone,ENSO phase). However, in the spring of 1964, a weakpolar vortex and a typical negative NPO combinedwith the warm westerly drift zone and the La Nina-oriented central and eastern equatorial Pacific SSTAto create a dominant Okhotsk blocking high (east-ern blocking) in the coupled atmosphere–ocean pro-cess from the spring to the summer. The northeastcold vortex acquired its positive vorticity mainly fromthe western path, and from the low-latitude transportas well. However, in the spring of 1993, the strong po-lar vortex area and positive NPO phase collaboratedwith the zero phase of westerly drift zone SSTA and
the El Nino-oriented central and eastern equatorialPacific SSTA to stage a Ural blocking high (westernblocking), with the northeast cold vortex obtaining itspositive vorticity mainly from the westbound retreat-ing ultra-longwave disturbance trough (eastern path)in the central North Pacific, and from high-latitudetransport as well.
(4) The PPV index exhibited an opposite variationtrend against the polar vortex index in other NorthernHemisphere regions in the spring seasons of 1948–2009.The M-K method was employed to test the point mu-tation, which indicated that the former registered anabrupt change in the late 1960s that was noticeablydifferent from the one reported by other regions. ThePPV area noticeably declined in the spring of 1964,while the same indicator noticeably enhanced in thespring of 1993. The pattern revealed from a differentperspective that both 1964 and 1993 underwent anunusually cool summer in Northeast China, regardlessof the large difference between the two in early basicatmosphere–ocean mode configuration and in seasonalevolution. On one hand, the two individual years, ei-ther as a high incidence or as low incidence years, haddifferent configurations of early signals and summerdipole, which could probably be explained by the dif-ference in interdecadal variation. On the other hand,both 1964 and 1993 shared a low-frequency physicalprocess that contributed to the mid- and high-latitudesummer dipole circulation anomalies.
In this study, only the spring polar vortex areaanomalies in four typical strong and four typical weakyears, and the basic patterns of abnormal phase cou-plings between NPO and the North Pacific westerlydrift zone and the central and eastern equatorial Pa-cific SSTA were analyzed. The years 1964 and 1993,where a significant cool summers occurred in North-east China, were chosen to represent typical years of aweak or a strong PPV area corresponding to a high ora low cool summer incidence. The two individual yearswere simply opposite in phase anomalies, in terms ofpolar vortex area, NPO, the westerly drift zone, andthe central and eastern equatorial Pacific SSTA. Thesignificant difference, as such, probably represents themajor footprints of interdecadal variations of summerlow-temperature events in the northeast. Some otherpoints, including early signals and atmosphere–oceancoupling processes in a typical low- or high-incidenceyear and their applicability to other individual years,require further study.
Acknowledgements. This work was jointly sup-
ported by the National Natural Science Foundation of
China (Grant Nos. 41175083 and 41275096), and
the Special Fund for Meteorological Scientific Research

208 FACTORS IMPACT ON UNUSUALLY COOL SUMMERS IN NORTHEAST CHINA VOL. 30
in the Public Interest (Grant Nos. GYHY201006020,
GYHY201106016, and GYHY201106015).
REFERENCES
Bjerknes, J., 1966: A possible response of the atmosphericHadley circulation to equatorial anomalies of oceantemperature. Tellus, 18, 820–829.
Bjerknes, J., 1969: Atmospheric teleconnection from theequatorial Pacific. Mon. Wea. Rev., 97, 163–172.
Bueh, C. L., and H. Nakamura, 2007: Scandinavian pat-tern and its climatic impacts. Quart. J. Roy. Meteor.Soc., 133, 2117–2131.
Chou, Y. Y., 1985: Medium Term Weather Forecast. Sci-ence Press, Beijing, 920pp. (in Chinese)
Demmel, J., and W. Kahan, 1990: Computing small sin-gular values of bidiagonal matrices with guaranteedhigh relative accuracy. SIAM Journal on Scientificand Statistical Computing, 11, 873–912.
Huang, R. H., and W. J. Li, 1987: Influence of heat sourceanomaly over the western tropical Pacific on the sub-tropical high in East Asia. Paper presented at Inter-national Conference on the General Circulation ofEast Asia, Chinese Academy of Science, Chengdu,China, 10–15 April.
Huang, R. H., and W. J. Li, 1988: Heat source anomaliesover the western tropical Pacific in the summer andits impacts on the East Asia subtropical high and as-sociated physical mechanism. Scientia AtmosphericaSinica, 12(9), 107–106. (in Chinese)
Huang, R. H., and F. Y. Sun, 1992: Impacts of the trop-ical western Pacific on the East Asian summer mon-soon. J. Meteor. Soc. Japan, 70(1), 243–256.
Klein, W. H., 1952: Some empirical characteristics of longwaves on monthly mean charts. Mon. Wea. Rev., 80,203–219.
Li, C. Y., 1989: El Nino events and temperature anoma-lies in eastern China. Journal of Tropical Meteorol-ogy, 3, 210–219. (in Chinese)
Li, C. Y., 1990: Intraseasonal oscillation in the atmo-sphere. Scientia Atmospherica Sinica, 14, 32–45. (inChinese)
Li, J., and J. Wang, 2003: A new North Atlantic Os-cillation index and its variability. Adv. Atmos. Sci.,20(5), 661–676.
Lian, Y., 2007: Correlation between North Pacific os-cillation and East Asian summer monsoon. ScientiaGeographica Sinica, 27(Suppl.), 19–27. (in Chinese)
Lian, Y., and G. An, 1998: The relationship among EastAsia summer monsoon El Nino and low temperaturein the Songliao plains Northeast China. Acta Meteo-rologica Sinica, 56, 724–734. (in Chinese)
Lian, Y., C. L. Bueh, Z. W. Xie, and F. S. Li, 2010: Theanomalous cold vortex activity in Northeast Chinaduring the early summer and the low-frequency vari-ability of the Northern Hemispheric atmosphere cir-culation. Scientia Atmospherica Sinica, 34, 429–439.(in Chinese)
Liang, F., S. Y. Tao, J. Wei, and C. L. Bueh, 2011:Variation in summer rainfall in North China dur-ing the period 1956–2007 and links with atmo-spheric circulation. Adv. Atmos. Sci., 28, 363–374,doi:10.1007/s00376–010–9220–2.
Liu, G., B. Z. Shen, Y. Lian, S. F. Li, L. Cao, and P.Liu, 2012: The sorts of 500 hPa blocking high in Asiaand it’s relations to cold vortex and aestival low tem-perature in northeast of China. Scientia GeographicaSinica, 32, 1269–1274. (in Chinese)
Liu, Z. X., 1986: Calculation of the intensity of the north-ern hemisphere polar vortex area index and its asso-ciation with temperature variations in China. Mete-orological Monthly, 2(Suppl.), 84–89. (in Chinese)
Liu, Z. X., Y. Lian, Z. T. Gao, L. Sun, and B. Z. Shen,2002: Analyses of the Northern Hemisphere circu-lation characters during northeast cold vortex per-sistence. Scientia Atmospherica Sinica, 26, 361–372.(in Chinese)
Liu, Z. X., Y. Lian, B. Z. Shen, Z. T. Gao, and X. L. Tang,2003: Seasonal variation features of 500 hPa heightin North Pacific oscillation region and its effect onprecipitation in Northeast China. Journal of AppliedMeteorological Science, 14, 553–561. (in Chinese)
Madden, R. D., and P. Julian, 1971: Detection of a 40–50 day oscillation in the zonal wind in the tropicalpacific. J. Atmos. Sci., 28, 702–708.
Madden, R. D., and P. Julian, 1972: Description of globalscale circulation cells in the tropics with 40–50 dayperiod. J. Atmos. Sci., 29, 1109–1123.
Namias, J., 1951: The great Pacific anticyclone of thewinter 1948–50: A case study in the evolution of cli-matic anomalies. J. Meteor., 8, 251–261.
Mantua, N. J., S. R. Hare, Y. Zhang, J. M. Wallace, andR .C. Francis, 1997: A Pacific interdecadal climateoscillation with impacts on salmon production. Bull.Amer. Meteor. Soc., 78, 1069–1079.
National Climate Center, 2010: 2009 Annual Report onClimate System Monitoring and Diagnosis. ChinaMeteorological Press, Beijing, 176pp. (in Chinese)
Peng, S. Q., and J. J. Zhang, 1998: The statistical diag-nosis and numerical experiment of atmospheric tele-conection patterns in Northern Hemisphere. Journalof Applied Meteorological Science, 9, 65–71. (in Chi-nese)
Rogers, G. T., 1981: The north-Pacific oscillation. J. Cli-mate, 1, 68–83.
Shen, B. Z., S. Liu, Y. Lian, G., L. Feng, S. F. Li, and Z.Q. Gong, 2011: An investigation into 2009 summerlow temperature in Northeast China and its associ-ation with prophase changes of the air-sea system.Acta Meteorologica Sinica, 69, 320–333. (in Chinese)
Sun, J. Q., and H. J. Wang, 2006: Regional differenceof summer air temperature anomalies in NortheastChina and its relationship to atmospheric general cir-culation and sea surface temperature. Chinese Jour-nal of Geophysics, 49, 662–671. (in Chinese)
Wallace, J. M., and D. S. Gutzler, 1981: Teleconnectionsin the geopotential height field during the Northern
NO. 1 LIAN ET AL. 209
Hemisphere winter. Mon. Wea. Rev., 109, 784–812.Yang, H., and S. Q. Sun, 2005: The characteristics of
longitudinal movement of the subtropical high in theWestern Pacific in the pre-rainy season in China.Adv. Atmos. Sci., 22, 392–400.
Yang, Q., Y. Lian, and J. H. He, 2005: Predicting north-east cool summer using singular value decompositionmethod. Meteorological Monthly, 31, 31–35. (in Chi-nese)
Zhang, S. Q., 1990: Cold Temperature in NortheastChina and its association with El Nino. No. 5, ChinaScience and Technology Blue Book, National Sci-ence and Technology Commission, China Science andTechnology Press, 308–310. (in Chinese)
Zhang, S. Q., T. J. Yu, F. Y. Li, X. M. Wang, X. F. Wang,and W. M. Wu, 1985: Seasonal variation of Northern
Hemisphere polar vortex area and associated inten-sity, and their association with the temperatures inNortheast China. Scientia Atmospherica Sinica, 9,178–185. (in Chinese)
Zhao, Z. G., and Q. S. Liao, 1992: Winter North Pacificoscillation and summer rainfall in China. Meteorolog-ical Monthly, 18, 11–16. (in Chinese)
Zheng, W. Z., and Y. Q. Ni, 1999: Tropical and mid-latitude Pacific SSTA and its impacts on summer lowtemperature stress in East Asia. Journal of AppliedMeteorological Science, 10, 394–401. (in Chinese)
Zhou, B. T., H. J. Wang, and X. Cui, 2008: Significantrelationship between Hadley circulation and NorthPacific Oscillation. Chinese Journal of Geophysics,51, 999–1006. (in Chinese)