impacts on labor market outcomes and educational attainment - mdrc
TRANSCRIPT

Career Academies
Impacts on Labor Market Outcomes and Educational Attainment
James J. Kemple with
Judith Scott-Clayton
March 2004

Funders of the Career Academies Evaluation
The Wallace Foundation Ford Foundation U.S. Department of Education U.S. Department of Labor The Commonwealth Fund Charles Stewart Mott Foundation William T. Grant Foundation The Pew Charitable Trusts The Rockefeller Foundation The George Gund Foundation
The Grable Foundation Richard King Mellon Foundation American Express Foundation Alcoa Foundation Russell Sage Foundation Center for Research on the Education
of Students Placed At Risk (CRESPAR) Westinghouse Foundation The Citigroup Foundation Bristol-Myers Squibb Foundation, Inc.
Dissemination of MDRC publications is also supported by the following foundations that help finance MDRC’s public policy outreach and expanding efforts to communicate the results and implications of our work to policymakers, practitioners, and others: The Atlantic Philanthropies; the Alcoa, Ambrose Monell, Bristol-Myers Squibb, Fannie Mae, Ford, Grable, and Starr Foundations; and the Open Society Institute.
The findings and conclusions in this report do not necessarily represent the official positions or policies of the funders.
For information about MDRC and copies of our publications, see our Web site: www.mdrc.org.
Copyright © 2004 by MDRC. All rights reserved.

-iii-
Overview
Established more than 30 years ago, Career Academies have become a widely used high school re-form initiative that aims to keep students engaged in school and prepare them for successful transi-tions to post-secondary education and employment. Typically serving between 150 and 200 high school students from grade 9 or 10 through grade 12, Career Academies are organized as small learning communities, combine academic and technical curricula around a career theme, and estab-lish partnerships with local employers to provide work-based learning opportunities. There are esti-mated to be more than 2,500 Career Academies across the country.
Since 1993, MDRC has been conducting a uniquely rigorous evaluation of the Career Academy approach that uses a random assignment research design in a diverse group of nine high schools across the United States. Located in medium- and large-sized school districts, the schools confront many of the educational challenges found in low-income urban settings. The participating Career Academies were able to implement and sustain the core features of the approach, and they served a cross-section of the student populations in their host schools. This report describes how Career Academies influenced students’ capacity to improve their labor market prospects and sustain their engagement in post-secondary education programs in the four years following their expected graduation. The results are based on the experiences of more than 1,400 young people, approxi-mately 85 percent of whom are Hispanic or African-American.
Key Findings • The Career Academies substantially improved the labor market prospects of young men, a
group that has experienced a severe decline in real earnings in recent years. Through a combina-tion of increased wages, hours worked, and employment stability, the young men in the Acad-emy group earned over $10,000 (18 percent) more than those in the non-Academy control group over the four-year follow-up period.
• The Career Academies had no significant impacts (positive or negative) on the labor market outcomes for young women. This may be due, in part, to the fact that young women in both the Academy and the non-Academy group had greater propensity than the young men to be attend-ing school or taking care of children.
• Overall, the Career Academies served as viable pathways to a range of post-secondary educa-tion opportunities, but they do not appear to have been more effective than options available to the non-Academy group. More than 90 percent of the students in the Academy and non-Academy groups graduated from high school or received a General Educational Development (GED) certificate. By the end of the follow-up period, more than half the sample had completed a post-secondary credential or were working toward one.
• The positive labor market impacts were concentrated among Academy group members who were at high or medium risk of dropping out of high school when they entered the programs. Although the Career Academies reduced enrollments in post-secondary education among those who entered the programs at highest risk of dropping out, this does not appear to have dimin-ished the substantial earnings advantage produced by the Academies for this subgroup. The lack of labor market impacts for the low-risk subgroup may be due to this group’s greater focus, relative to the others, on post-secondary education.
The findings demonstrate the feasibility of improving labor market preparation and successful school-to-work transitions without compromising academic goals and preparation for college. They provide compelling evidence that investments in career-related experiences during high school can produce substantial and sustained improvements in the labor market prospects of youth during their post-secondary years. In fact, Career Academies are one of the few youth-focused interventions that have been found to improve the labor market prospects of young men.


-v-
Contents Overview iii List of Exhibits vii Preface ix Acknowledgments xi Executive Summary ES-1 Full Report Impacts on High School Experiences and Outcomes 2 Impacts on Labor Market Outcomes 10 Impacts on Educational Attainment 22 Impacts on Social Adjustment 34 Implications of the Findings 37 References and Bibliography 41 Earlier MDRC Publications on Career Academies 45 Amplifying on issues and findings in the report, supplemental materials from the Evaluation are available only on the Web at http://www.mdrc.org/publications/366/techresources.pdf Technical Resources
Unit 1: Sample Description and Survey Response Rate Unit 2: Comparison of Academy Students and Non-Academy Students with
National Data Unit 3: Impacts for the Full Study Sample Unit 4: Impacts for Gender Subgroups Unit 5: Impacts for Risk Subgroups

-vi-
List of Exhibits
Exhibit ES.1 Impacts on Average Monthly Earnings and Components of Earnings, by Gender ES-4 ES.2 Impacts on Educational Attainment, by Gender ES-6 1 Impacts on Average Monthly Earnings and Components of Earnings for the Full
Study Sample 12 2 Month-by-Month Impacts on Average Monthly Earnings for the Full Study
Sample 13 3 Impacts on Average Monthly Earnings and Components of Earnings,
by Gender 15 4 Month-by-Month Impacts on Average Monthly Earnings, by Gender 18 5 Impacts on Average Monthly Earnings and Components of Earnings,
by Risk Subgroup 21 6 Adjusted High School Completion Rates Four Years After High School
for the Evaluation Sample and the NELS Sample 24 7 Impacts on Highest Post-Secondary Credential Completed or in Progress
for the Full Study Sample 26 8 Impacts on Educational Attainment, by Gender 29 9 Impacts on Educational Attainment, by Risk Subgroup 32 10 Impacts on Social Adjustment Indicators for the Full Study Sample 36

-vii-
Preface
This report is being released amid growing concern about the diminishing value of a standard high school diploma and the inability of high schools, particularly those in large cities serving low-income communities, to equip their graduates with the credentials and job-readiness skills they need to make successful transitions to college and the workforce. The na-tion is also confronting a widening gap between the earnings of young workers — particularly young men — who have only a high school diploma and those who have some post-secondary education. In response to these trends, education policymakers and practitioners are pursuing a range of far-reaching strategies for improving American high schools, particularly those serving students placed at risk of leaving school without the skills necessary to pursue further education and make successful transitions to the world of work.
Career Academies stand at the crossroads of many high school reform strategies, which include principles embedded in the Career Academy approach. Like Career Academies, some reform initiatives aim to create small learning communities and decentralized governance. Other reform efforts focus on changes in curricula and learning goals that students are required to attain. Still others seek to reconstitute the relationship between high schools and their communities, in-cluding local employers and social institutions. In addition, with public support and under the guidance of national and local intermediary organizations, Career Academies continue to prolifer-ate at a rapid pace: Today, they number approximately 2,500 throughout the United States.
Intersecting these concerns about how best to prepare young people for college and the workforce is a growing demand for more reliable evidence about what works to improve schools and about the long-term effectiveness of interventions like Career Academies, in par-ticular. The Career Academies Evaluation is pathbreaking in both its rigor and its scope. It has been built on the foundation of a random assignment design, now widely considered to be the gold standard in measuring the effectiveness of social program interventions. The U.S. Depart-ment of Education has recently embraced such designs and evaluation strategies in its attempt to raise the standards of evidence for determining what works to improve schools. The four-year post-high school follow-up period covered in this report presents a unique opportunity to exam-ine how Career Academies influence students’ capacity to sustain their engagement in post-secondary education programs and improve their labor market prospects.
The findings in this report provide new and compelling evidence that investments in ca-reer-related experiences during high school can produce substantial and sustained improve-ments in the labor market prospects of youth during their post-secondary years. Moreover, the evidence establishes Career Academies as one of the few youth-focused interventions that have been found to improve the labor market prospects of young men. At a time when career-related

-viii-
high school programs are being criticized for creating barriers to college, these findings show that Career Academies can prepare young people for healthy transitions to employment without compromising academic goals and preparation for college.
Evidence from this report can inform education policymakers, administrators, and teachers as they consider strategies for improving urban high schools and ponder the future of career and technical education. These findings should also be highly relevant to forthcoming deliberations in the U.S. Congress on the reauthorization of the Carl D. Perkins Applied Tech-nology and Vocational Education Act and to discussions in the U.S. Department of Education on federal initiatives that target the nation’s troubled high schools.
With support from the U.S. Departments of Education and Labor, MDRC plans to con-tinue collecting information on the young people’s education and labor market experiences through eight years following their scheduled high school graduation. The goal of this ongoing work is to determine whether the Career Academies enable students to make better choices about post-secondary education and employment and whether their choices lead to higher educational attainment and entry into higher-wage, more career-oriented jobs. We are confident that, in keep-ing with MDRC’s mission, the Career Academies Evaluation will continue to offer policymakers and educators useful lessons about what works for high school students and will demonstrate the value of subjecting promising school reform approaches to rigorous tests of effectiveness.
Robert J. Ivry Senior Vice President

-ix-
Acknowledgments
This report reflects more than 10 years of research on Career Academies and is the product of a remarkable collaboration between staff at MDRC and the sites, funders, and advi-sors who have supported the evaluation. This undertaking would not have been possible without the vision and support of the funding organizations listed at the front of the report. Special grati-tude is also due the staff at the participating Career Academies, high schools, school districts, and employer partners, as well as the young people who generously gave of their time to re-spond to the surveys that MDRC and its partners have administered over the years. The survey for this report was administered by Anne Van Aman and her associates, who worked relent-lessly to find and interview the young people in the study sample.
The report benefited greatly from the input of key advisors to the evaluation. Thomas Bailey of Columbia University’s Teachers College, Harry Holzer of Georgetown University, Richard Murnane of the Harvard Graduate School of Education, David Stern of the University of California at Berkeley, and Andrew Sum of Northeastern University reviewed an early draft of the findings. They provided invaluable advice regarding further analyses and offered insights into the results and their implications. Edward Pauly, from The Wallace Foundation, and Alison Bernstein, Janice Petrovich, and Cyrus Driver, from the Ford Foundation, have provided helpful guidance and counsel throughout the study.
Formal preparation of this report was preceded by briefings and discussions with the project’s funders and several policy and practitioner groups. These exchanges yielded numerous suggestions for additional analyses, provided sources of contextual material, and pointed to im-plications that the findings may have for policy and practice. We are particularly grateful to the following people and organizations who helped organize and guide the briefing activities: Grover Whitehurst, Marsha Silverberg, Gregory Henschel, and their colleagues at the U.S. De-partment of Education’s Institute of Education Sciences; Susan Sclafani, Hans Meeder, and their colleagues at the U.S. Department of Education’s Office of Vocational and Adult Educa-tion; Emily DeRocco, Mason Bishop, Maria Kniesler-Flynn, Roxie Nicholson, and their col-leagues at the U.S. Department of Labor’s Employment and Training Administration; Beth Buehlmann at the U.S. Chamber of Commerce’s Center for Workforce Preparation; Betsy Brand and her colleagues at the American Youth Policy Forum; Linda Harris and Jodie Levin-Epstein at the Center for Law and Social Policy; Jon Baron at the Council for Excellence in Government; and Charles Dayton and staff from the partnering organizations that participate in the periodic Career Academies conversations.
Leaders from several organizations concerned with Career Academies also provided perceptive comments on the findings: Charles Dayton, David Stern, and Susan Tidyman of the

-x-
Career Academy Support Network, John Ferrandino and Gregg Betheil of the National Acad-emy Foundation, and Sandy Mittlesteadt of the National Career Academy Coalition.
Throughout the Career Academies Evaluation, Robert Ivry, MDRC’s Senior Vice President for Development and External Affairs, played a pivotal role in building partnerships with the sites, funders, and advisors that form the foundation for the study. This report benefited greatly from his insights and advice on how to sharpen the presentation of the findings and their policy implications. Other MDRC staff members played key roles in acquiring and analyzing data for this report. Marla Sherman coordinated the survey administration and data collection process with Anne Van Aman, and Joel Gordon and Galina Farberova prepared the initial sur-vey data files for analysis.
Jason Snipes provided valuable guidance on a range of analytic issues and offered many useful insights into the patterns and interpretation of the findings. Nickisha Stephenson assisted in a wide range of research tasks, helped prepare the tables and figures, and coordinated the production of this report. Gordon Berlin, Howard Bloom, Fred Doolittle, Judith Gueron, Robert Ivry, Kent McGuire, Marilyn Price, and Jason Snipes reviewed drafts and provided helpful technical and substantive guidance on the presentation of the findings. We thank Louis Richman for help guiding the report’s organization and Robert Weber for his skillful editing. Finally, we are grateful to Stephanie Cowell, who prepared the final manuscript for publication.
The Authors

ES-1
Executive Summary
Today, high schools face more pressure than ever to produce graduates who can enter and succeed in post-secondary education. At the same time, high schools have been pressed to rethink the way they prepare young people for transitions to the world of work, whether or not this path leads through post-secondary education. Specifically, new school-to-work transition strategies have emphasized partnerships with local employers, use of a broad array of career development strategies beyond training in specific skills, integration of academic and career-related coursework, and work-based teaching and learning.
Meanwhile, transitions from school to work have become increasingly complex and, for many young people, problematic. More and more young people are combining post-secondary education and work, or are moving between school and work to accommodate shifting individ-ual preferences, economic conditions, and available opportunities. Today’s labor market pro-vides fewer entry-level, career-oriented jobs for young workers, typically those between ages 18 and 26. Employment prospects have become particularly bleak for youth with less than two years of post-secondary education, as their earnings have declined precipitously in recent years relative to the earnings of those who have college degrees. Hardest hit have been young men of color and from low-income communities. These trends in the youth labor market and the econ-omy as a whole have placed increasing pressure on high schools to provide higher-quality op-portunities that prepare their students for work as well as for higher education.
Career Academies offer high schools — particularly those in urban communities that struggle to keep students in school and to prepare them for post-secondary education and em-ployment opportunities — a systematic approach to addressing a range of challenges. Typically serving between 150 and 200 students from grades 9 or 10 through grade 12, Career Academies have three distinguishing features: (1) they are organized as small learning communities to cre-ate a more supportive, personalized learning environment; (2) they combine academic and ca-reer and technical curricula around a career theme to enrich teaching and learning; and (3) they establish partnerships with local employers to provide career awareness and work-based learn-ing opportunities for students. There are estimated to be more than 2,500 Career Academies across the country, operating either as a single program or as multiple programs within a larger high school.
Although there is a rich body of research into Career Academies and other school re-forms that aim to accomplish multiple and complex goals, there is little rigorous evidence from which to judge the initiatives’ long-term effectiveness. Do investments in career-related inter-ventions in high school really pay off in the labor market? Does preparation for healthy transi-tions from school to work come at the expense of college readiness? To what extent can career-

ES-2
related high school initiatives pave the way for youth — particularly young men with limited post-secondary education — to enter jobs that offer high earnings and viable career paths?
Since 1993, MDRC has been conducting a uniquely rigorous evaluation of the Career Academy approach in a diverse group of nine high schools across the country. The high schools are located in medium- and large-sized school districts and reflect many of the stressful conditions found in urban settings. The participating Career Academies were able to implement and sustain the core features of the approach, and they served a cross-section of the student populations in their host high schools. The evaluation is being funded by the U.S. Departments of Education and Labor and by 17 private foundations and organizations.
The Career Academies Evaluation is one of the few studies of a school reform initiative that uses the design of a randomized, controlled field trial. Because more students applied for the Academy programs than could be served, applicants were randomly selected to enroll (the Academy group). The remaining students constitute the study’s non-Academy control group. Subsequent differences in outcomes between the two groups provide valid estimates of the Academies’ impacts. This type of research design is widely considered to be the most reliable way to measure the effectiveness of interventions such as Career Academies. The evaluation is also unusual among studies of school reforms for following both groups of students from the beginning of high school through four years after scheduled graduation.
MDRC’s earlier reports from the evaluation indicate that Career Academies appear to have been most effective at influencing those aspects of school functioning and student and teacher experiences that are closest to the core features of the approach. Students in the Acad-emy group reported higher levels of interpersonal support from their teachers and peers than did students in the non-Academy group. For students who entered the programs at high risk of dropping out, the Academies increased the likelihood of their staying in school through the end of 12th grade, improved attendance, and increased the number of credits earned toward gradua-tion. The Career Academy–employer partnerships, in particular, provided students with a much broader array of career-awareness and development experiences both in and outside school, in-cluding work-based learning internships. At the same time, the Academies evaluation appears to have had less influence on curriculum content and teachers’ instructional practice. Previously reported findings even suggest that some Academy students may have substituted more career-related courses for their academic core courses and thereby mitigated the employment-related benefits of the programs.
This report examines the impact that Career Academies have had on the educational at-tainment and post-secondary labor market experiences of young people through the four years following their scheduled graduation from high school. It is based on survey data collected from 1,458 young people in the Career Academies Evaluation study sample (about 85 percent of whom are either Hispanic or African-American).

ES-3
Impacts on Labor Market Outcomes • The Career Academies produced positive and sustained impacts on a
range of labor market outcomes among the young men in the study sample.
The Career Academies increased earnings for young men by an average of $212 per month over 48 months (see Exhibit ES.1). This amounts to an 18 percent increase over the non-Academy group’s average earnings of $1,161 per month, and it totaled more than $10,000 in additional earnings for the Academy group over the 48-month follow-up period. The Career Academies’ impact on earnings for young men is substantially larger than the roughly $100 dif-ference in monthly earnings that has been found in other research that compared the earnings of young workers who have one or two years of post-secondary education with the earnings of their counterparts who have only a high school diploma or a General Educational Development (GED) certificate. These findings are noteworthy in light of the declining labor market pros-pects for young men in recent years, particularly among young men with limited post-secondary education.
The Career Academy impacts on total earnings resulted from the combined impacts that the programs had on the number of months employed, hours worked per week, and hourly wages. In other words, Career Academies were likely to have helped the young men obtain bet-ter-paying jobs and jobs that afforded them the opportunity to work more hours (more often in full-time rather than part-time jobs).
• Overall, the Career Academies had no impacts (positive or negative) on labor market outcomes for young women.
Average monthly earnings, number of months employed, hours worked per week, and hourly wages were very similar overall for young women in the Academy and non-Academy groups (see Exhibit ES.1). One reason for the lack of post-high school labor market impacts among young women may be that the young women in the sample were more focused, relative to the young men, on attending post-secondary education programs or taking care of their chil-dren. Further analysis did reveal, however, that young women with children may have experi-enced some boost in their labor market prospects from the Career Academies. Among young women who had children, those in the Academy group were employed for more months during the follow-up period, and they earned about $107 more per month than those in the non-Academy group. (It should be noted that these differences are not statistically significant and may not reflect the impact of Career Academies.)

ES-4
Career Academies Evaluation
Exhibit ES.1
Impacts on Average Monthly Earnings and Components of Earnings, by Gender
Average Monthly Earnings
$956$995
$1,373
$1,161
$0
$200
$400
$600
$800
$1,000
$1,200
$1,400
Young Men Young Women
Mon
thly
Ear
ning
s
Months Employed
38.835.136.0 34.8
0
12
24
36
48
Young Men Young Women
Mon
ths
Academy Group
Non-AcademyGroup
Average Hours Worked per Week
27.1 26.734.2
30.0
0
10
20
30
40
Young Men Young Women
Hou
rs
Impact = 0.4
Impact = 2.8** Impact = 0.3Impact = $212**
Impact = $39
Impact = 4.2***
Average Hourly Wages
$8.81 $9.75$8.55$9.01
$0$2$4$6$8
$10$12
Young Men Young Women
Wag
es
Impact = $0.74** Impact = $0.26
SOURCE: MDRC calculations from the Career Academies Evaluation Four-Year Post-High School Follow-Up Survey.
NOTES: Measures reflect averages over the 48-month period following scheduled high school graduation for each sample member. A two-tailed t-test was applied to differences between the Academy and non-Academy groups (impacts). Statistical significance levels are indicated as *** = 1 percent; ** = 5 percent; and * = 10 percent.
Monthly earnings were calculated by multiplying each sample member’s reported hourly wage times the hours worked per week times the number of weeks worked per month. For months in which sample members did not report being employed, zero values were used for monthly earnings and the components of earnings.
Hourly wages and weekly hours worked reported by sample members at the conclusion of each job were applied to the full duration of the job. Thus, if wages or hours increased or decreased during the job, these measures may over- or underestimate true monthly earnings. Additional analyses indicate that the pattern of impacts was not sensitive to various assumptions about changes in wages or hours.
ES-4

ES-5
• The Career Academies produced substantial increases in employment
and earnings for students who entered the programs at high or medium risk of dropping out of high school.
Among students who entered high school at the highest risk of dropping out, the Acad-emies increased earnings by an average of $168 per month, or 16 percent, compared with the non-Academy group’s average monthly earnings of $1,036. The impact for the medium-risk subgroup was an average increase of $141 per month, or 14 percent more than the non-Academy group’s average monthly earnings. The Career Academies also produced positive impacts in terms of the number of months employed, hours worked per week, and hourly wages, although some of the impacts for the smaller high-risk subgroup are not statistically significant.
The lack of impacts on labor market outcomes for the low-risk subgroup may be due, in part, to the fact that this group made a substantial investment in post-secondary education dur-ing the follow-up period. For example, those in the low-risk subgroups (from both the Academy and the non-Academy group) spent just over 30 months enrolled in post-secondary education programs, and over 40 percent were still working on a post-secondary education credential at the end of the follow-up period.
Impacts on Educational Attainment • Overall, the Career Academies had no impacts (positive or negative) on
educational attainment, although high school completion rates and post-secondary enrollment and attainment rates were higher than national averages.
Over 90 percent of the young people in the Academy and non-Academy groups gradu-ated from high school or received a GED, and nearly 80 percent enrolled in some type of post-secondary education program. By the end of the four-year post-high school follow-up period, over half of those in both the Academy and the non-Academy group had either completed a post-secondary credential (a bachelor’s degree, an associate’s degree, or a training license or certificate) or were still working toward a credential. These educational attainment levels are higher than national averages for similar students from similar school districts.
Exhibit ES.2 shows that the overall high school completion rates were very similar for young men and young women. The young women were somewhat more likely to graduate from high school on time, but the Career Academies did not have an impact on on-time graduation rates for either group. It should be noted that the 4.7 percentage point reduction in late graduation rates for young men was balanced by a slight increases in on-time graduation and GED receipt rates.

ES-6
(continued)
Career Academies Evaluation
Exhibit ES.2
Impacts on Educational Attainment,by Gender
High School Completion Status
70.7 68.4 74.6 75.3
8.2 8.5 10.19.2 6.2
12.9
10.913.3
0102030405060708090
100
Perc
enta
ge C
ompl
eted
Graduated on time Graduated late Earned a GED
92.3 91.6
Impact = 0.7
92.192.2
Impact = 0.1
AcademyGroup
Non-AcademyGroup
Young Men
AcademyGroup
Non-AcademyGroup
Young Women
Highest Post-Secondary Credential Completed or in ProgressFour Years After High School
23.4 20.6 21.4
17.8 16.4
14.5 16.8 17.8 17.7
20.0
18.219.7
0102030405060708090
100
Perc
enta
ge C
ompl
eted
or
in P
rogr
ess
Certificate/License Associate's Degree Bachelor's Degree
58.554.2
Impact = - 4.2
55.556.2
Impact = 0.7
AcademyGroup
Non-AcademyGroup
Young Men
AcademyGroup
Non-AcademyGroup
Young Women

ES-7
Exhibit ES.2 also indicates that the young men experienced a slight decline in the rates at which they completed, or were still working toward, post-secondary credentials. In addition to being relatively small and not statistically significant, the difference also reflects somewhat higher attrition rates among those in the non-Academy group, which may further erase the slight reduc-tion in completion rates over time. By the end of the follow-up period, over half the young men in the sample had earned a post-secondary credential or were still working on one. Overall, the sub-stantial, positive impact on labor market outcomes for young men does not appear to have come at the expense of systematically reducing their prospects for post-secondary education.
• The Career Academies modestly reduced enrollments in post-secondary education among those who entered the programs at highest risk of dropping out of high school. This does not appear to have diminished the Academies’ impact on employment and earnings for this subgroup.
At the end of the follow-up period, 40 percent of the high-risk Academy group and 49 percent of the high-risk non-Academy group had either completed a post-secondary credential or were still working on one. Although this 9 percentage point reduction in educational attain-ment is not statistically significant, it is sufficiently large to raise a caution about potential tradeoffs between education and work. Most of this difference, however, occurred in the rates of completing a short-term training license or certificate. By the end of the four-year follow-up period, the reduction evident in these limited education credentials does not appear to have di-minished the increased earnings power that accrued to the Academy group. In fact, the Career Academies’ impact on earnings for this subgroup in the last year of follow-up was substantially larger than in any of the preceding three years.
Exhibit ES.2 (continued)
SOURCE: MDRC calculations from the Career Academies Evaluation Four-Year Post-High School Follow-Up Survey. NOTES: Statuses reflect the 48-month period following scheduled high school graduation for each sample member. Rounding may cause slight discrepancies in calculating sums and differences. A two-tailed t-test was applied to differences between the Academy and non-Academy groups (impacts). Statistical significance levels are indicated as: *** = 1 percent; ** = 5 percent; * = 10 percent. Students must have earned a high school diploma or GED to be considered enrolled in a post-secondary education program. A credential was considered "in progress" if the student reported being enrolled in a program within three months of the end of the follow-up period and expected to complete the credential.

ES-8
Implications of the Findings • The findings provide convincing evidence that increased investments in
career-related experiences during high school can improve post-secondary labor market prospects.
A growing body of descriptive analyses suggests that increases in career-technical course-taking and engagement in higher-quality, work-based learning programs during high school are associated with better labor market outcomes after high school. This evaluation finds that Career Academies produced impacts on monthly earnings for young men that exceed the differences in earnings that have been found between young workers with one or two years of post-secondary education and those who only have a high school diploma. Although one should not conclude from this that Career Academies can substitute for post-secondary education be-low the associate’s-degree level, the findings seem to suggest that Academies do produce bene-fits in the labor market that are commensurate with those associated with continuing investment in post-secondary programs.
• The findings demonstrate the feasibility of accomplishing goals of school-to-career and career-technical education without compromising academic goals.
Like many approaches to education reform, the Career Academy model has many and varied goals. Career Academies aspire to prevent students from dropping out of high school and to prepare them for college and other post-secondary education opportunities. At the same time, Career Academies provide students with an explicit introduction to the world of work and try to furnish them with skills and connections to help them navigate the transition from high school to successful employment. Many critics of school-to-work transition initiatives and career-technical programs contend that programs like Career Academies track students into classes and work experiences that orient them toward immediate entry into the labor market. Such criticism sometimes suggests that this orientation comes at the expense of preparation for and opportuni-ties to attend college. In this study, however, the high rates of enrollment in post-secondary edu-cation programs and the sustained impacts on employment and earnings suggest that such tradeoffs need not occur.
• The findings suggest that Career Academies should make special efforts to serve students who are at risk of dropping out of high school.
One theme that has evolved from the Career Academies Evaluation is that students who enter the programs at high or medium risk of dropping out of high school tend to benefit most from exposure to the programs. Earlier findings indicate that high-risk students experienced mod-est reductions in dropout rates and increases in attendance and course-taking (although these did

ES-9
not translate into impacts on graduation or post-secondary enrollment rates). The present findings indicate that the Academies’ strong labor market impacts were concentrated among the high- and medium-risk subgroups. Even for the high-risk subgroup, impacts on labor market outcomes grew over time, despite the modest reductions in post-secondary education enrollments.
These findings suggest that Career Academies should make greater efforts to attract and retain high- or medium-risk students. At the same time, however, targeting such students exclu-sively might lower expectations for the program among teachers, students, and parents. More important, the implementation research for this evaluation indicates that the Academies draw much of their power to improve interpersonal supports and increase engagement from the diver-sity of their student bodies.
Several school districts and school reform initiatives around the country are now at-tempting to convert entire high schools into clusters of Career Academies. Instead of giving stu-dents the option of enrolling in traditional general or vocational programs, these wall-to-wall Academies offer students a choice among different Academies that combine academic and ca-reer-related curricula. This approach may have the greatest potential for maximizing high-risk students’ access to the programs (because all students would be required to enroll in an Acad-emy) while ensuring that the Academies include a broad mix of students. These high schools and reform initiatives, however, face the related challenges of preventing high-risk students from being tracked into poorly implemented Academies and of ensuring a high level of imple-mentation on a larger scale.
• The Career Academies Evaluation demonstrates the feasibility, benefits, and challenges of conducting a longitudinal random assignment evalua-tion of a prominent high school reform approach.
The Career Academies Evaluation is one of the few longitudinal random assignment evaluations of a school-based education intervention. Without the random assignment research design and the extended follow-up period, it is likely that an alternative approach to the study would have yielded misleading findings and conclusions. For example, statistical comparisons with national data might suggest that the Career Academies represent a substantially better edu-cational opportunity than many alternatives available to similar students from similar schools and school districts across the country. The availability of a valid control group — determined by the random assignment design of the evaluation — shows that the Career Academies in this study tended to attract students (by a combination of self-selection and program selection) who were likely to do well in high school and post-secondary education even if they had not been exposed to the Career Academies.

ES-10
Next Steps for the Evaluation The full story of Career Academies’ effectiveness may still be unfolding. The young
men and women in the study sample were about 22 years old at the time they were contacted for the most recent follow-up survey. Most were still somewhat unsettled in their transition to self-sufficient adulthood. Nearly one-third of these young people were still enrolled in education programs, and most had not yet started families. Very few had settled on a long-term career. These factors leave unanswered a number of important questions about the longer-term effects of the Career Academies: Will the substantial impacts on employment and earnings outcomes for young men continue as they become more dependent on higher-wage, career-oriented jobs to support their families? Will these benefits eventually accrue to young women? Will the young men and women who were engaged in Career Academies remain in (or return to) post-secondary education programs at higher rates than their counterparts from the control group?
To address these and other issues, the evaluation is collecting data on students’ educa-tion and labor market experiences over an additional four-year period. This will mark an eight-year post-high school follow-up period and nearly 12 years since these young people first en-tered the study sample. The goal of this ongoing work is to determine whether the Career Acad-emies enable students to make better choices about post-secondary education and employment and whether their choices lead to higher educational attainment and entry into higher-wage, more career-oriented jobs.

-1-
Full Report
This report examines the impact that Career Academies — a prominent high school re-form and school-to-work transition initiative — have on educational attainment and post-secondary labor market experiences of young people. The follow-up period and research design for this study are rare in studies of high school programs, including programs that aim to im-prove youth transitions from school to further education and work. The findings cover a four-year post-high school follow-up period, which provides a unique opportunity to examine how Career Academies influence students’ capacity to sustain their engagement in post-secondary education programs and improve their labor market prospects. Because the findings that are presented in this report are derived from a random assignment field experiment, they provide uniquely reliable indicators of the effectiveness of the Career Academy approach.
As this report goes to press, education policymakers and practitioners are pursuing a range of far-reaching reform strategies to improve American high schools, particularly those that serve students who are at risk of leaving high school without the skills needed to pursue further education and make successful transitions to the world of work. Some of these initiatives aim to reform high schools through comprehensive changes in organization and governance. Other reform efforts focus on changes in curricula and the learning goals that students are re-quired to attain. Still others seek to reconstitute the relationship between high schools and their communities, including local employers and social institutions. Yet very little is known about the potential effects that these initiatives might have on students both during and after their high schools years.
Many of the reform strategies being considered include principles embedded in the Ca-reer Academy approach. Others incorporate Career Academies or Academy-like programs di-rectly into their reform model or system. In addition, Career Academies continue to proliferate at a rapid pace, with public support and under the guidance of national and local intermediary organizations. These trends have increased the demand for more reliable evidence about the long-term effectiveness of Career Academies.
MDRC began this uniquely rigorous evaluation of the Career Academy approach in 1993. The study includes a diverse set of nine high schools across the country and the Career Academies located in them. The evaluation’s primary goal is to provide policymakers and edu-cators with reliable evidence about how Career Academies affect students’ performance and engagement during high school and their subsequent transitions to post-secondary education and the labor market. The study also aims to provide information about how these programs operate and to examine the factors that may enhance or undermine their effectiveness. The evaluation is funded by the U.S. Departments of Education and Labor and by 17 private founda-tions and organizations.
-2-
This report — the sixth formal report from the study — describes the Career Academy approach and highlights the key features of the evaluation that underlie its rigor and the rele-vance of its findings. Box 1 outlines the core features of the Career Academy model,1 while Box 2 gives an overview of the evaluation’s design and the data sources used in this report.2 To pro-vide a context for interpreting the impacts that Career Academies had on post-secondary educa-tion and labor market outcomes, the following section summarizes prior reports’ findings about how Career Academies influenced students’ high school experiences. The bulk of this report focuses on the impacts that Career Academies had on a range of educational attainment and la-bor market outcomes for young people during the four years following their scheduled gradua-tion from high school. A short concluding section discusses some of the implications that the study’s findings may have for education policy and practice.3
Impacts on High School Experiences and Outcomes The first three reports from the Career Academies Evaluation describe the implementa-
tion of the core elements of the Career Academy approach and assess the extent to which these elements provided students, teachers, and employers with the types of supports and learning opportunities outlined in Box 1.4 The fourth report examines the impacts that the participating Academies had on students’ performance and engagement through the end of their 12th-grade year in high school.5
The findings from these earlier reports provide an essential context for understanding the pattern of Career Academy effects on educational attainment and post-secondary labor mar-ket outcomes that are discussed in the present report. In particular, they shed light on the facets of students’ high school experiences and outcomes that Career Academies affected or did not affect. Differences (and the lack of differences) in the experiences of students in the Academy group and the non-Academy group are fundamental antecedents to the effects that Career Acad-emies might have had as these young people moved beyond high school into post-secondary education programs and the world of work.
1For a detailed discussion of the history and conceptual framework underlying the Career Academy ap-
proach, see Stern, Dayton, and Raby (2003); Kemple (1997); Kemple, Poglinco, and Snipes (1999); and Kem-ple and Snipes (2000).
2For a detailed discussion of the research design, the sites, the students in the study sample, and other data sources used in the evaluation, see Kemple and Rock (1996); Kemple (1997); Kemple and Snipes (2000); and Kemple (2001).
3See the Technical Resources for this report (Kemple and Scott-Clayton, 2004) for information about the samples and the analytical methods used to derive the findings, as well supplementary exhibits presenting de-tailed findings for the full study sample and various subgroups.
4See Kemple and Rock, 1996; Kemple, 1997; and Kemple, Poglinco, and Snipes, 1999. 5See Kemple and Snipes, 2000.

-3-
Box 1 The Career Academy Approach
Context Background: The first Career Academy was launched in Philadelphia in 1969. It is estimated that there are now over 2,500 Academies across the country. Aims: Career Academies stand at the intersection of several high school reform efforts aimed at (1) building school-to-work systems, (2) reconsti-tuting career and technical education, (3) dividing large high schools into small learning communities, and (4) promoting comprehensive school change. Targeted population: Most Career Academies are located within urban and large-city high schools serving low-income students in grades 9 through 12. Academies typically serve a cross-section of 150 to 200 students from these schools. A growing number of Academies are being estab-lished in suburban and rural communities.
Features Supports and Learning Opportunities
School-within-a-school organization • A small learning community is formed within the larger high school by
clustering 3 to 5 teachers and 50 to 75 students per grade in grades 9 through 12 or grades 10 through 12.
• Teachers are drawn from various academic and career-related disci-plines and remain with students from year to year.
• One teacher assumes lead responsibility for administrative tasks and serves as liaison with school and district administrators and employer partners.
• Students take 2 to 4 courses per year in the Academy and their remain-ing courses in the regular high school.
• Block scheduling of the Academy-oriented classes in the morning is followed by regularly scheduled classes in the afternoon.
• Efforts are made to encourage parental involvement.
Interpersonal support • Academies aim to function as “communities of support” for
students and teachers. • Academies attempt to ensure that students get personalized at-
tention from teachers; teachers have higher expectations; and students collaborate with peers.
• Academies aim to ensure that teachers are supported by oppor-tunities for professional collaboration and by adequate re-sources, and that they have the capacity to influence instruc-tional and administrative decisions.
(continued)

-4-
Box 1 (continued)
Features Supports and Learning Opportunities Academic and technical curricula based on a career theme • Students take 3 or more academic courses and at least 1 career- or occu-
pation-related course per year • Occupational classes are structured around a range of areas in a career
field rather than training in specific job skills. • A career theme is chosen on the basis of local employment needs and
demand for expertise. Among the career themes are health professions, business and finance, electronics, travel and tourism, and information technology.
Focused curricula and enriched learning opportunities • Academies attempt to break down the dichotomy between aca-
demic and technical curricula by bringing academic rigor to ca-reer-related courses and applied learning opportunities to aca-demic courses.
• Academy curricula are intended to ensure that students meet core academic requirements for graduation and college prepara-tion.
• Non-Academy courses attempt to provide a coherent sequence of technical and occupation-related classes.
• Curricula attempt to provide applied learning opportunities, including problem-solving skills, the use of computers, and work on long-term projects.
Employer partnerships • Formal relationships with a group of employers in the community aim to
support Academy programs and to sponsor work- and career-related ac-tivities for students.
• Employer partners contribute funds and other material resources and participate as speakers, supervisors of student interns, and student men-tors.
• Many Academies create formal advisory boards to help guide the devel-opment of curricular and extracurricular activities.
• Academy staff and employer representatives work together to develop career-awareness and development activities, including field trips, job shadowing, and outside speakers from the business community.
Career awareness and work-based learning opportunities • Career awareness and development activities aim to improve
students’ understanding of the world of work and occupations within the program’s broad career theme.
• Through work-based learning programs developed in collabora-tion with employer partners, students are placed in jobs (or se-ries of short-term jobs) that expose them to occupations.

-5-
Several findings reported previously indicate that the Career Academies in the evalua-tion changed students’ experiences during high school in ways that are strongly consistent with the short-term goals of the Academy approach. For example, compared with their non-Academy counterparts:
• Students in the Academy group reported higher levels of interpersonal sup-port from teachers and peers.
• Academy students were more likely to combine academic and career or technical courses.
• Academy students were substantially more likely to be exposed to a range of career awareness and development activities, both in and outside school, and to work in jobs that were connected to school.
• For students who entered the programs at high risk of dropping out, the Academies increased the likelihood of staying in school through the end of the 12th-grade year, improved attendance, and increased the number of cred-its earned toward graduation.
• For students at medium or low risk of dropping out, the Academies increased career and technical course-taking and participation in career development activities without reducing academic course-taking.
Previously reported findings also indicate several limitations on the Academies’ im-plementation and effectiveness:
• One-third of the students who initially enrolled in the Academies left the programs before the end of their 12th-grade year.
• The curricula and instructional strategies used in the Academies (in both aca-demic and career or technical courses) were generally similar to those offered in the rest of the high school.
• The Academies had no impact on standardized test scores.
• Some Academies that did not substantially increase interpersonal supports from teachers and peers reduced attendance rates and academic course-taking for some students.
Not surprisingly, the Academies appear to have been most effective at influencing those aspects of school functioning and student and teacher experiences that are closest to the core features of the approach. For example, the Academies’ school-within-a-school organization ap-
-6-
pears to have created communities of support for teachers and students. In this context, students were more highly engaged in school, which was reflected in high attendance rates, low dropout rates, and — in the words of several students — a sense of being in a “family-like” atmosphere. Teachers, too, saw the Academies as a “learning community” in which they collaborated with colleagues and were able to give students more personalized attention. The findings suggest that the school-within-a-school structure and the interpersonal supports that evolved from it may have been important preconditions for the implementation and effectiveness of other features of the Career Academy approach. In and of themselves, however, these interpersonal supports do not appear to have had a direct impact on student performance.
The Career Academies in this evaluation had the strongest and most pervasive effects on the engagement of high-risk students. For these students, the Academies increased atten-dance and credits earned in both academic and career or technical courses, and they kept a higher proportion of those enrolled in school through the end of 12th grade. For the medium- and low-risk students, the Academies were able to increase exposure to career-related courses and career development experiences without reducing the likelihood of completing at least a basic academic core curriculum.
Employer partnerships — another key feature of the Career Academy approach — of-fered employers structured, concrete opportunities to engage in the educational mission of high schools. These partnerships provided students with a broad array of career awareness and de-velopment experiences both in and outside school, including work-based learning internships. Academy students were much more likely than their non-Academy counterparts to be exposed to such experiences as job shadowing, career fairs, guest speakers from local businesses, and instruction in how to look for and apply for a job, prepare a résumé, and interview. Academy students were also provided with increased exposure to individual employers as well as to in-formation about the types of career opportunities in a given field.
The Academies in this evaluation appear to have had less influence on curricular content and teachers’ instructional practice than on the measures mentioned above. Academy students were more likely to take career-related courses than their non-Academy peers, but the academic and career-related courses that they took were generally typical of those offered in the regular school environment — probably because Academy teachers were bound by the same require-ments as their non-Academy counterparts regarding the scope and sequence of the curriculum.
Similarly, although the Academies were more likely to expose students to applied and work-related learning activities, they typically did not truly integrate academic and career-related curricula and instructional practice in ways consistent with practices that have been iden-

-7-
Box 2 The Career Academies Evaluation
Design The Career Academies Evaluation uses a random assignment research design — the best way to ensure that there were initially no systematic differences between the two groups that make up the study sample. Each of the students in the sample applied for a place in one of the participating Career Academies and was deemed to be appropriate for the programs. Because more applicants were appropriate than the programs could serve, a lottery was used to choose which students would be invited to enroll. The students who enrolled make up the study’s Academy group. The remaining students (about 45 percent of the applicant pool) continued or enrolled in the high schools’ regular education programs and constitute the study’s non-Academy control group. The outcomes for the non-Academy group are the best indicators of how students in the Academy group would have fared if they had not had access to the programs. Therefore, the impacts — that is, the differences in outcomes between the Academy and the non-Academy groups — represent the changes that the Career Academies produced over and above what students were likely to achieve in non-Academy environments.* Sites Each of the nine high schools in this evaluation is located in or near a large urban school district with substantially higher percentages of African-American and Hispanic students than exist in school districts nationally, as well as higher drop-out rates, higher unemployment rates, and higher percentages of low-income families. The schools were selected strategically on the basis of several criteria:†
• The schools had implemented and sustained the core features of the Career Academy approach for at least two years.
• There was a clear contrast — along the core dimensions of the Academy model — between the Career Academy and other programs within the high school.
• The Career Academy served a diverse population of students but made explicit efforts to include students who were perceived to be at risk of dropping out.
• The high school and its Career Academy were willing and able to accommodate random assignment and other key features of the evaluation design.
(continued)

-8-
Box 2 (continued) As a group, the participating sites reflect many of the conditions under which Ca-reer Academies have been implemented across the country, and individually the sites capture much of the variation in the Academy approach as it has been adapted to local needs and circumstances. Students The student populations in the participating Career Academies tend to reflect the ethnic, gender, and socioeconomic characteristics of their host high schools, which are diverse. Students came to the programs with varying backgrounds, school-related experiences, and educational aspirations. Some students were al-ready highly engaged in school when they applied for the Academies. Key goals of Academies are to prepare such students for college and to provide them with career-related learning experiences and credentials that will make them more competitive in the labor market. Other Academy applicants were already on a path toward dropping out or ending their education after high school. Academies aimed to “reengage” such students, providing them with more applied learning experi-ences and encouraging them to develop higher aspirations for education and em-ployment.‡
Data Sources The primary data for this report were obtained from a survey administered to sample members approximately 48 months after their scheduled graduation from high school (eight years after they entered the study). The Career Academies Evaluation Four-Year Post-High School Follow-Up Survey asked sample mem-bers:
• Whether and when they graduated from high school or received a General Edu-cational Development (GED) certificate and whether and when they enrolled in post-secondary education programs and institutions. Students who were enrolled in post-secondary education programs were asked about the programs’ character-istics and about their levels of engagement.
• Information about their work experiences during the four years after scheduled graduation from high school, including which month and year they started each job that they held during this period, which month and year they left each job, the number of hours they worked per week, the number of weeks they worked per month, and the hourly wage they earned.
(continued)

-9-
tified in other research.6 Such integration requires offering more extensive professional devel-opment opportunities to teachers — over and above the in-service workshops normally avail-able through school and district resources — than most of the Academies could provide. Other professional development opportunities, such as shared planning time for teachers, were fo-cused on student-related concerns and on coordinating the career development and employer-related activities.
6For a review of research on approaches for integrating academic and vocational education, see Grubb
(1995a, 1995b).
Box 2 (continued) • Information about the industries in which they worked for each job they held dur-
ing the four years after scheduled graduation from high school, the titles or types of job they had, and the type of work they performed. For the most recent jobs re-spondents held, the survey also asked about the types of skills they used, how their employment might have been connected to career-related activities during high school, and how their work experience might be preparing them for the future.
• Information about other experiences in their lives and their plans for the future.
The findings in this report are based on data collected from 1,458 youth who completed the survey. This represents 83 percent of the 1,764 young people in the full study sam-ple: 83 percent of the Academy group and 82 percent of the non-Academy group. Re-sponse analysis indicates that there were no systematic differences in background char-acteristics between Academy and non-Academy group members who responded to the survey. The relatively high response rates in both the Academy and the non-Academy group — and the comparability of the Academy and non-Academy group members who responded — afford a high degree of confidence that the survey data yield valid estimates of the Career Academies’ impacts.§
________________________ *For a detailed description of how the random assignment procedures were imple-
mented for the evaluation, see Kemple and Rock (1996). †For a discussion of the criteria and process used to select sites for this study, see Kem-
ple and Rock (1996). ‡For a more complete listing of background characteristics of the full study sample, see
Unit 1 in the Technical Resources for this report (Kemple and Scott-Clayton, 2004). §For a more detailed discussion of the Career Academies Evaluation Four-Year Post-
High School Follow-Up Survey response rates and analysis issues related to data availabil-ity, see Unit 1 in the Technical Resources for this report (Kemple and Scott-Clayton, 2004).

-10-
Given the similarity between Academy and non-Academy academic curricula and in-structional practice, it is not surprising that the Academies did not affect students’ standardized test scores. Still, Academy students performed at least as well as their non-Academy counter-parts on standardized tests, and they received the added benefits of participating in a combined academic and career-related curriculum and in a series of career development activities.
Finally, only 55 percent of students who were selected to enroll in the Career Acad-emies remained in those programs through their scheduled graduation. About 15 percent of the applicants who were randomly assigned to the Academy group never enrolled at all, and an-other 30 percent enrolled but subsequently left the programs before their scheduled graduation. Only a small percentage of those who left the Academies dropped out of high school altogether. It is unclear how much of the attrition from the Academies could have been influenced or avoided by the programs themselves. The majority of students who enrolled in a Career Acad-emy and then chose to leave did so because they did not like the program or because they pre-ferred other classes or programs. It is not clear that their choices reflected shortcomings of the Academy model or its implementation: Many students who left the Academies did so because they wished to take advantage of other classes, programs, or opportunities that better suited their interests and needs. Student mobility — usually due to family circumstances beyond the control of the programs — was another leading reason that students left the Career Academies.
The high attrition rates may suggest, however, that there is not great demand for Acad-emies, at least under circumstances where students can choose to leave and staff can ask them to leave. In any case, these are the circumstances under which Career Academies typically operate. As a result, Academies may be able to influence students’ behavior and performance for only a year or two before students move on to other opportunities. In an effort to provide the most rig-orous and policy-relevant information about Academies’ potential to affect students’ behavior, this evaluation takes the reality of attrition squarely into account by including in the analysis all students who were randomly assigned to Academies, whether they remained enrolled or not.
Impacts on Labor Market Outcomes This section of the report begins with a summary of the impacts that the Career Acad-
emies had on labor market outcomes for the full study sample. The key labor market outcomes include average monthly earnings and the core sources of monthly earnings: months employed during the follow-up period, hours worked per week, and hourly wages. The section then dis-cusses in more detail the labor market impacts for the subgroups of young men and young women. It concludes with a brief review of the labor market impacts for subgroups defined by the background characteristics associated with the risk of dropping out of high school.
• The Career Academies produced positive and sustained impacts on a range of labor market outcomes.

-11-
Exhibit 1 displays the impacts that Career Academies had on average monthly earnings and on each of the key components of earnings (months employed, hours worked per week, and hourly wages).7 These reflect averages over the entire 48-month period following scheduled high school graduation. The left side of the exhibit shows that the Academy group earned an average of $107 per month more than the non-Academy group. This represents a 10 percent increase in monthly earnings over the non-Academy group’s average of $1,039 per month. Over the 48-month follow-up period, this increase in monthly earnings totaled over $5,000.
The right side of Exhibit 1 indicates that the impact on monthly earnings was driven by a combination of increases in the number of months employed, hours worked per week, and hourly wages. Further analyses (not shown in the exhibit) reveal that more than 40 percent of the earnings impact was due to the increase in hourly wages and that another 24 percent was due to the increase in hours worked per week.8 The remainder of the impact on monthly earn-ings was associated with the fact that the Academy group was employed for an average of just over one extra month during the follow-up period, compared with the non-Academy group.
Exhibit 2 shows that the Career Academies’ impacts on average monthly earnings per-sisted throughout the 48-month post-high school follow-up period. It shows, first, that the monthly earnings for both the Academy and the non-Academy group increased substantially over the fol-low-up period. Average monthly earnings for both groups about doubled from the start of the fol-low-up period to the end. The solid line in the exhibit, however, shows that — during each month of the follow-up period — the young people in the study’s Academy group earned more, on aver-age, than those in the non-Academy group (represented by the dashed line).
The survey that was administered to the study sample for this report also asked sample members to provide some detailed information about the jobs they held near or at the end of the follow-up period.9 Overall, it appears that the jobs held by Academy and non-Academy group members were similar. On average, sample members from both groups had been working at
7Unit 3 of the Technical Resources for this report (Kemple and Scott-Clayton, 2004) includes supplemen-
tary tables that provide more detailed labor market impact findings for the full study sample. 8The impacts on the components of earnings (months worked, hours worked per week, and hourly wages)
were decomposed to determine their contributions to the overall earnings impact. These calculations assume that the components of earnings are independent. It may be that the Career Academy increases in work effort (hours worked) also helped increase hourly wages.
9Unit 3 of the Technical Resources for this report (Kemple and Scott-Clayton, 2004) provides a list of these job characteristics for both groups (Exhibit 3.5). The information on job characteristics discussed in this section of the report and presented in the Technical Resources is based only on the sample members who were employed during the follow-up period and focuses only on the characteristics of the last job they held. As a result, differences in job characteristics between Academy and non-Academy groups do not represent valid indicators of Career Academy impacts (or lack of impacts).

-
Career Academies Evaluation
Exhibit 1
Impacts on Average Monthly Earnings and Components of Earningsfor the Full Study Sample
Average Monthly Earnings
$1,039$1,146
$0
$200
$400
$600
$800
$1,000
$1,200
$1,400
Mon
thly
Ear
ning
s
AcademyGroup
Non-AcademyGroup
Months Employed
36.6 35.3
0
12
24
36
48
Mon
ths
Average Hours Worked per Week
30.0 28.1
0
10
20
30
40
Hou
rs
Impact = 1.9**
AcademyGroup
Non-AcademyGroup
Average Hourly Wages
$9.19 $8.72
$0
$2
$4
$6
$8
$10
$12
Wag
es
AcademyGroup
Non-AcademyGroup
Impact = 1.3*
Impact = $0.47**
Impact = $107**
SOURCE: MDRC calculations from the Career Academies Evaluation Four-Year Post-High School Follow-Up Survey.
NOTES: Measures reflect averages over the 48-month period following scheduled high school graduation for each sample member. A two-tailed t-test was applied to differences between the Academy and non-Academy groups (impacts). Statistical significance levels are indicated as *** = 1 percent; ** = 5 percent; and * = 10 percent.
Monthly earnings were calculated by multiplying each sample member’s reported hourly wage times the hours worked per week times the number of weeks worked per month. For months in which sample members did not report being employed, zero values were used for monthly earnings and the components of earnings.
Hourly wages and weekly hours worked reported by sample members at the conclusion of each job were applied to the full duration of the job. Thus, if wages or hours increased or decreased during the job, these measures may over- or underestimate true monthly earnings. Additional analyses indicate that the pattern of impacts was not sensitive to various assumptions about changes in wages or hours.
AcademyGroup
Non-AcademyGroup
-12-

-13-
Month-by-Month Impacts on Average Monthly Earningsfor the Full Study Sample
Exhibit 2
Career Academies Evaluation
($200)
$0
$200
$400
$600
$800
$1,000
$1,200
$1,400
$1,600
$1,800
$2,000
3 6 9 12 15 18 21 24 27 30 33 36 39 42 45 48
Months After Scheduled High School Graduation
Mon
thly
Ear
ning
s
Impacts Academy Group Non-Academy Group
Impacts
SOURCE: MDRC calculations from the Career Academies Evaluation Four-Year Post-High School Follow-Up Survey.
NOTES: Measures reflect the 48-month period following scheduled high school graduation for each sample member. A two-tailed t-test was applied to differences between the Academy and non-Academy groups. Differences in monthly earnings are significant at the .1 level or lower in 37 out of the 48 months.
Monthly earnings were calculated by multiplying each sample member’s reported hourly wage times the hours worked per week times the number of weeks worked per month. For months in which sample members did not report being employed, zero values were used for monthly earnings and the components of earnings.
Hourly wages and weekly hours worked reported by sample members at the conclusion of each job they held were applied to the full duration of the job. Thus, if wages or hours increased or decreased during the job, these measures may over- or underestimate true monthly earnings. Additional analyses indicate that the pattern of impacts was not sensitive to various assumptions about changes in wages or hours.

-14-
their current or most recent job for about 18 months, and between 83 percent and 85 percent of both groups were working full time. Both groups experienced an increase in monthly earnings of nearly 24 percent over the time they held their jobs, although monthly earnings for the Acad-emy group consistently outpaced the earnings of the non-Academy group. About 60 percent of workers in both groups held jobs that provided a health insurance plan, and just over 40 percent of both groups (43 percent of the Academy group and 41 percent of the non-Academy group) reported working in a job that provided a full package of benefits, including a health insurance plan, sick and vacation days, and a retirement plan.
The distribution of jobs across occupational areas was similar for sample members in both groups. For example, approximately 30 percent of the Academy group reported working in office and administrative support occupations, and about 25 percent worked in management or professional occupations. Nearly 20 percent of the Academy group worked in construction-related trades; about 16 percent worked in sales-related occupations; and 11 percent worked in food and personal service occupations. Approximately 70 percent of sample members in both groups reported that their job involved computer use, and less than 30 percent indicated that their job often involved physically demanding tasks.
In addition to monthly earnings and hourly wages, two other characteristics differenti-ated the jobs held by the Academy group from those held by the non-Academy group. First, sample members in the Academy group were more likely to be working in a job that was di-rectly related to a program or experience in which they were involved during high school: 27 percent of the Academy group reported this to be the case, compared with 22 percent of the non-Academy group. This also shows, however, that the majority of those in the Academy group were not working in jobs related to the career theme of the Academy program for which they were selected. Second, about 44 percent of the Academy group reported that they were very likely to be promoted in the next year, compared with 37 percent of the non-Academy group. This suggests that the Academy group may continue to experience higher earnings and wages in the future.
• The impacts on labor market outcomes were concentrated among young men in the study sample.
Exhibit 3 displays the Career Academies’ impacts on average monthly earnings (and the key components of earnings) for young men and young women in the study sample, respec-tively.10 The left set of bars in each portion of the exhibit shows that, for young men, the Acad-emies produced statistically significant increases in monthly earnings, months employed, hours
10Unit 4 of the Technical Resources for this report (Kemple and Scott-Clayton, 2004) includes supplemen-
tary tables that provide detailed impact findings for young men and young women in the study sample.

Career Academies Evaluation
Exhibit 3
Impacts on Average Monthly Earnings and Components of Earnings, by Gender
Average Monthly Earnings
$956$995
$1,373
$1,161
$0
$200
$400
$600
$800
$1,000
$1,200
$1,400
Young Men Young Women
Mon
thly
Ear
ning
s Months Employed
38.835.136.0 34.8
0
12
24
36
48
Young Men Young Women
Mon
ths
Academy Group
Non-AcademyGroup
Average Hours Worked per Week
27.1 26.734.2
30.0
0
10
20
30
40
Young Men Young Women
Hou
rs
Impact = 0.4
Impact = 2.8** Impact = 0.3Impact = $212**
Impact = $39
Impact = 4.2***
Average Hourly Wages
$8.81 $9.75$8.55$9.01
$0$2$4$6$8
$10$12
Young Men Young Women
Wag
es
Impact = $0.74** Impact = $0.26
SOURCE: MDRC calculations from the Career Academies Evaluation Four-Year Post-High School Follow-Up Survey.
NOTES: Measures reflect averages over the 48-month period following scheduled high school graduation for each sample member. A two-tailed t-test was applied to differences between the Academy and non-Academy groups (impacts). Statistical significance levels are indicated as *** = 1 percent; ** = 5 percent; and * = 10 percent.
Monthly earnings were calculated by multiplying each sample member’s reported hourly wage times the hours worked per week times the number of weeks worked per month. For months in which sample members did not report being employed, zero values were used for monthly earnings and the components of earnings.
Hourly wages and weekly hours worked reported by sample members at the conclusion of each job were applied to the full duration of the job. Thus, if wages or hours increased or decreased during the job, these measures may over- or underestimate true monthly earnings. Additional analyses indicate that the pattern of impacts was not sensitive to various assumptions about changes in wages or hours.
-15-

-16-
worked per week, and hourly wages. Specifically, the Career Academies produced an increase of $212 in average monthly earnings for young men. This amounts to a substantial 18 percent increase over and above the average earnings of $1,161 per month for young men in the non-Academy group. This increase totaled more than $10,000 in additional earnings for males in the Academy group over the 48-month follow-up period.
The magnitude of the impacts on monthly earnings for young men exceeds differences in earnings that have been found in other research between young workers with one or two years of post-secondary education and those who only have a high school diploma.11 This re-search indicates that young workers with only a high school diploma or GED earned an average of between $100 and $150 per month less than those with one or two years of post-secondary education.
Exhibit 3 also shows that, for young men, the Academy programs produced sizable in-creases during the 48-month follow-up period in the number of months employed, hours worked per week (including full-time employment), and hourly wages. Overall, the young men in the Academy group were employed during nearly 39 months (81 percent of the follow-up period), compared with 36 months (75 percent of the follow-up period) for young men in the non-Academy group. Though not shown in the exhibit, young men in the Academy group were employed full time during 33 of the 39 months they were working, compared with only 28 of 36 months for the non-Academy group. Young men in the Academy group worked an average of about 34 hours per week, compared with 30 hours per week for young men in the non-Academy group.
The Career Academies’ impact on average monthly earnings is a function of the com-bined impact that the programs had on the number of months employed, hours worked per week, and hourly wages. Further analyses were conducted to examine the proportion of the im-pact on average monthly earnings that was likely to be due to each of these components inde-pendently. These analyses indicate that approximately 35 percent of the impact on average monthly earnings was associated with the increases in hours worked per week and that nearly 28 percent was associated with the Career Academies’ impact on hourly wages. In other words, the increase in earnings is likely to have been a function of the Career Academies’ helping young men obtain better-paying jobs and jobs that afforded them the opportunity to work more hours (more often full-time jobs rather than part-time jobs). The remaining impact on average earnings was due to an increase in the number of months employed.
11See Pond, Sum, Mykhaylo, and Meredith, 2002.

-17-
Finally, the top graph in Exhibit 4 shows that the Career Academies’ impact on monthly earnings for young men persisted throughout the 48-month follow-up period. It shows that while monthly earnings more than doubled for both groups, young men in the Academy group consistently earned more throughout the period than young men in the non-Academy group.
• Overall, the Career Academies did not have an impact (positive or nega-tive) on labor market outcomes for young women.
The right set of bars in each chart in Exhibit 3 and the bottom graph in Exhibit 4 depict substantially different patterns of labor market outcomes and impacts for young women in the study sample. First, Exhibit 3 shows that monthly earnings and each of the components of monthly earnings were lower for young women in the sample than for young men. This was true in both the Academy and the non-Academy group. For example, over the 48-month follow-up period, young men in the non-Academy group earned an average of $205 more per month than young women in the non-Academy group. This accumulated to nearly $10,000 more in earnings for young men in the non-Academy group. The gender difference in the Academy group was even larger: During the 48-month follow-up period, young men in the Academy group earned approximately $18,000 more than young women in the Academy group.
The difference in average monthly earnings between young men and young women was due, in large part, to differences in employment patterns. As illustrated on the right side of Exhibit 3, the young women in both groups worked during fewer months, and they worked fewer hours per week than did the young men. There are also gender differences in hourly wages. Finally, as shown in Exhibit 4, average monthly earnings for young men increased much more steeply than they did for young women over the follow-up period.
Exhibits 3 and 4 show, on average, that the Academies produced little or no impact (positive or negative) on labor market outcomes for young women. Average monthly earnings, months employed, hours worked per week, and hourly wages were virtually the same for young women in both the Academy and the non-Academy group.
It is not clear why the Career Academies had no overall impacts on labor market out-comes for young women. The evaluation did not find evidence that the Career Academy experi-ence was systematically different for young women than for young men. Nor does it appear that the Career Academies had systematically different impacts on the high school experiences of young women and young men. One hypothesis, however, is that the lack of post-high school labor market impacts for young women may reflect their greater focus, relative to young men, on attending post-secondary education programs or taking care of their children.
Just over 40 percent of the young women in both groups had children, and over 25 per-cent reported being a single custodial parent. By contrast, only about 27 percent of the young

-18-
Month-by-Month Impacts on Average Monthly Earnings,by Gender
Career Academies Evaluation
Exhibit 4
Young Men
($200)$0
$200$400$600$800
$1,000$1,200$1,400$1,600$1,800$2,000
3 6 9 12 15 18 21 24 27 30 33 36 39 42 45 48
Months After Scheduled High School Graduation
Mon
thly
Ear
ning
s
Impacts
Young Women
($200)$0
$200$400$600$800
$1,000$1,200$1,400$1,600$1,800$2,000
3 6 9 12 15 18 21 24 27 30 33 36 39 42 45 48
Months After Scheduled High School Graduation
Mon
thly
Ear
ning
s
Impacts Academy Group Non-Academy Group
Impacts
SOURCE: MDRC calculations from the Career Academies Evaluation Four-Year Post-High School Follow-Up Survey.
NOTES: Measures reflect the 48-month period following scheduled high school graduation for each sample member. A two-tailed t-test was applied to differences between the Academy and non-Academy groups. Differences in monthly earnings are significant at the .1 level or lower in 37 out of the 48 months.
Monthly earnings were calculated by multiplying each sample member’s reported hourly wage times the hours worked per week times the number of weeks worked per month. For months in which sample members did not report being employed zero values were used for monthly earnings and the components of earnings.
Hourly wages and weekly hours worked reported by sample members at the conclusion of each job they held were applied to the full duration of the job. Thus, if wages or hours increased or decreased during the job, these measures may over- or underestimate true monthly earnings. Additional analyses indicate that the pattern of impacts was not sensitive to various assumptions about changes in wages or hours.

-19-
men reported having children, and only 5 percent said that they were single custodial parents. Young women who did not have children spent about 30 months (over 60 percent of the follow-up period) enrolled in post-secondary education programs, compared with only 20 months of post-secondary enrollment for the young men (42 percent of the follow-up period).12 The sub-stantial time that young women invested in these non-labor market activities, relative to the young men, may have limited the extent to which the young women were able to capitalize on the career development experiences that they had had in the Career Academies.
Further analyses do reveal some noteworthy differences in the employment and earn-ings patterns of the young women who had children. These analyses suggest that young women who had children may have experienced some boost in their labor market prospects from the Career Academies. Among young women who had children, those in the Academy group were employed for more months during the follow-up period and earned about $107 more per month than those in the non-Academy group. (Note that these differences do not necessarily reflect the impact of Career Academies, because they do not include direct experimental comparisons of Academy and non-Academy group members as determined by random assignment.)13 Although these differences are not statistically significant, they are similar in magnitude to the impacts for the full sample when averaged across all young men and all young women.
• Impacts on labor market outcomes were concentrated among sample members who entered the Career Academies at high or medium risk of dropping out of high school.
Because prior reports from this evaluation are concerned primarily with the impacts that Career Academies had on educational outcomes, they focus on subgroups defined by back-ground characteristics that are associated with dropping out of high school.14 The student popu-lations in Career Academies tend to reflect the ethnic, gender, and socioeconomic characteris-tics of their host high schools, which are increasingly diverse. Moreover, with their expanded
12It should be noted that the Career Academies did not have impacts on childbearing or months in post-secondary education for either young men or young women. This is discussed later in the report.
13The analyses discussed here involve comparisons between groups of young women that were based on childbearing statuses that changed during the follow-up period. Although the Career Academies did not have a statistically significant impact on childbearing, there were modest differences between the Academy and non-Academy groups both in the rates of childbearing and in the characteristics of those who had children and those who did not. Thus, these differences in childbearing rates and characteristics — not just the exposure to the Career Academy programs — could account for some of the differences in labor market outcomes that were observed between the Academy and non-Academy groups of young women who had children. Unit 4 of the Technical Resources for this report (Kemple and Scott-Clayton, 2004) provides more detail about the labor market experiences of young women with and without children.
14Unit 5 of the Technical Resources for this report (Kemple and Scott-Clayton, 2004) provides detailed impact findings for the risk subgroups in the study sample.

-20-
goals, Academies attract students who have a wider range of needs and interests than in the past. Little is known about the relative effectiveness of Academies for key subgroups. For instance, some students who apply for Academies at the end of the 8th or 9th grade are already highly engaged in school. Key goals of Academies are to prepare such students for college and to pro-vide them with career-related learning experiences and credentials that will make them more competitive in the labor market. At the other extreme, some Academy applicants were already on a path toward dropping out or having their education end with high school. Academies need to help “reengage” such students, providing them with more applied learning experiences and encouraging them to develop higher aspirations for both education and employment. More needs to be learned about the suitability of the Academy approach for meeting the needs of stu-dents in different risk subgroups.
Following are brief definitions of the three risk subgroups that are the focus of findings in prior reports and are examined here as well. Each of the characteristics used to define these subgroups was measured at the time that students applied for a Career Academy, that is, before they were randomly selected to be in the Academy or the non-Academy group.15
1. High-risk subgroup: Students in the study sample (approximately 25 per-cent of both the Academy and the non-Academy group) who had the combi-nation of characteristics, measured prior to random assignment, that are asso-ciated with the highest likelihood of dropping out
2. Medium-risk subgroup: Students in the study sample (approximately 50 percent of both the Academy and the non-Academy group) who had charac-teristics, measured prior to random assignment, indicating that they were not particularly likely to drop out but were not highly engaged in school
3. Low-risk subgroup: Students in the study sample (approximately 25 per-cent of both the Academy and the non-Academy group) who had the combi-nation of characteristics, measured prior to random assignment, that are asso-ciated with the lowest likelihood of dropping out
The left side of Exhibit 5 shows the impacts that Career Academies had on average monthly earnings for each of the risk subgroups. It indicates that the Career Academies pro-
15The definition of these subgroups is based on analyses using background characteristics to predict drop-ping out among students in the non-Academy group. These analyses yielded an index that expresses dropout risk as the weighted average of selected background characteristics, including 8th-grade attendance rates and grades, falling behind on progress toward graduation, being retained in a prior grade, parents’ education, and having a sibling who dropped out of high school. For a detailed discussion of the method used to define the risk subgroups, see Kemple and Snipes (2000).

Career Academies Evaluation
Exhibit 5
Impacts on Average Monthly Earnings and Components of Earnings, by Risk Subgroup
Average Monthly Earnings
$1,014$1,030 $987
$1,171$1,204
$1,036
$0
$200
$400
$600
$800
$1,000
$1,200
$1,400
High Risk Medium Risk Low Risk
Mon
thly
Ear
ning
s Months Employed
35.9 36.237.435.6 35.533.4
0
12
24
36
48
High Risk Medium Risk Low Risk
Mon
ths
Academy Group
Non-AcademyGroup
Average Hours Worked per Week
26.631.08
27.730.1 28.5927.9
0
10
20
30
40
High Risk Medium Risk Low Risk
Hou
rs
Impact = 2.5
Average Hourly Wages
$9.22 $8.95$9.28 $8.63$8.69$8.74
$0$2$4$6$8
$10$12
High Risk Medium Risk Low Risk
Wag
es
Impact = 2.2 Impact = 1.9*
Impact = $0.54
Impact = $168*
Impact = 2.2
Impact = $0.53**
Impact = $141**Impact = 27
Impact = - 0.3
Impact = 1.1
Impact = $0.32
SOURCE: MDRC calculations from the Career Academies Evaluation Four-Year Post-High School Follow-Up Survey.
NOTES: Measures reflect averages over the 48-month period following scheduled high school graduation for each sample member. A two-tailed t-test was applied to differences between the Academy and non-Academy groups (impacts). Statistical significance levels are indicated as *** = 1 percent; ** = 5 percent; and * = 10 percent.
Monthly earnings were calculated by multiplying each sample member’s reported hourly wage times the hours worked per week times the number of weeks worked per month. For months in which sample members did not report being employed, zero values were used for monthly earnings and the components of earnings.
Hourly wages and weekly hours worked reported by sample members at the conclusion of each job were applied to the full duration of the job. Thus, if wages or hours increased or decreased during the job, these measures may over- or underestimate true monthly earnings. Additional analyses indicate that the pattern of impacts was not sensitive to various assumptions about changes in wages or hours.
-21-

-22-
duced substantial impacts on monthly earnings for the high-risk and medium-risk subgroups but had little impact, overall, for the low-risk subgroup. For the high-risk subgroup, the Academies increased earnings by an average of $168 per month, or 16 percent, compared with the non-Academy group’s average monthly earnings of $1,036. Though not shown in Exhibit 5, the im-pact on monthly earnings was largest in the fourth year of the follow-up period. In that year, the Career Academies produced an increase in earnings of $244 per month. Over the 48-month fol-low-up period, the high-risk Academy group accumulated just over $8,000 in additional earn-ings, compared with the non-Academy group.
Exhibit 5 also shows that the earnings impact for the medium-risk subgroup averaged $141 per month (14 percent more than the non-Academy group’s average monthly earnings). For this subgroup, the Career Academies also produced positive and statistically significant im-pacts on months employed and hourly wages.
When averaged over the entire follow-up period, the impacts on labor market outcomes for the low-risk subgroup are marginal and are not statistically significant. Though not shown in Exhibit 5, modest but positive impacts began to emerge in the fourth year of the follow-up pe-riod. In that year, members of the Academy group earned an average of just over $100 per month more than their non-Academy group counterparts (not statistically significant). The lack of impacts on labor market outcomes for the low-risk subgroup may be due, in part, to the fact that this group made a substantial investment in post-secondary education during the follow-up period. For example, the Academy and non-Academy groups spent just over 30 months en-rolled in post-secondary education programs, and over 40 percent were still working on a post-secondary education credential at the end of the follow-up period.
Impacts on Educational Attainment Like the preceding section, this one begins by summarizing the Career Academy im-
pacts on educational outcomes for the full study sample. The key outcomes include high school completion status and post-secondary education enrollments and completions. High school completion statuses include on-time graduation, late graduation, and GED receipt. Post-secondary programs include bachelor’s degree programs, associate’s degree programs, and training certificate or licensing programs. To help place the educational attainment levels of the young people in the study sample in context, this section of the report offers a comparison with a representative sample of similar students from urban school districts across the country. The section then proceeds to a discussion of educational impacts for the subgroups of young men and young women. It concludes with a brief review of the impacts on educational attainment for subgroups defined by the background characteristics associated with the risk of dropping out of high school.

-23-
• Overall, the Career Academies had no impact (positive or negative) on high school completion rates, although the rates are higher than national averages.
The left side of Exhibit 6 shows the high school completion status of students in the Academy and non-Academy groups. It shows first that more than 90 percent of the students in both groups graduated from high school or received a GED. More than 80 percent of both groups received a high school diploma, and nearly 73 percent graduated on time.16
To help place these outcome levels in a broader context, the right side of Exhibit 6 shows the high school completion status of a nationally representative group of students who had similar background characteristics and came from school districts that are similar to those represented in the study sample.17 The figure illustrates several important points about the per-formance of students in the study sample and about the conclusions one should and should not draw from these outcome levels.
Exhibit 6 shows that students in both the Academy and the non-Academy group were substantially more likely to graduate from high school on time than similar students from simi-lar districts across the country. Most notably, approximately 73 percent of the Academy group graduated from high school on time, compared with only 64 percent of similar students from similar school districts nationally. Though not shown in the exhibit, this difference is even more dramatic when comparing students in the evaluation sample with students in the national sam-ple who reported being enrolled in the general curriculum track of their high school — the op-tion typically taken by students in the study’s non-Academy group.
16Unit 3 of the Technical Resources for this report (Kemple and Scott-Clayton, 2004) provides detailed
findings on the Career Academies’ impacts on educational outcomes for the full study sample. 17The percentages on the right side of Exhibit 6 are based on a sample of students from the National Edu-
cation Longitudinal Study (NELS) of 1988 through 2000 (Curtin et al., 2002). NELS administered surveys in 1988, 1990, 1992, 1994, and 2000 to a nationally representative group of students who were 8th-graders in the spring of 1988 and were scheduled to graduate from high school in 1992. Because virtually all the students in the non-Academy group completed the 9th grade, the analyses presented here include only students from the NELS sample who were 10th-graders in 1990 (that is, who did not drop out before the 10th grade). Also, to maintain comparability with the schools in the Career Academies Evaluation, only NELS students from nonse-lective public comprehensive high schools in urban school districts were included in the comparisons presented here. The percentages are regression-adjusted and mean-centered to reflect outcomes for students who had the same distribution of background characteristics as students in the Career Academies Evaluation sample. For a more detailed description of the analyses that form the basis of these findings, see Unit 2 of the Technical Re-sources for this report (Kemple and Scott-Clayton, 2004).

-24-
Career Academies Evaluation
Exhibit 6
Adjusted High School Completion Rates Four Years After High Schoolfor the Evaluation Sample and the NELS Sample
Graduated on time Graduated late Earned a GED
Perc
enta
ge o
f Sam
ple
Mem
bers
AcademyGroup
NELS Sample of Urban Public SchoolsEvaluation Sample
All Urban, Public, Nonselective High
Schools
Non-AcademyGroup
82.4
92.4 91.6
SOURCES: MDRC calculations from the Career Academies Evaluation Post-High School Follow-Up Survey Database and the National Education Longitudinal Study (NELS), 1988-2000, public-use data files.
NOTES: All measures reflect completion status 48 months following scheduled high school graduation. Students were considered on-time graduates if they received their diploma by the end of June in the year they were scheduled to graduate. Estimates for all urban, public, nonselective high schools include some students who either did not report a specific high school curriculum or reported a type of curriculum other than the three shown. The NELS estimates incorporate weights that account for nonresponse and project to the population of students who were enrolled in 10th grade in 1990. In addition, the NELS estimates are adjusted to reflect a sample of students with the same distribution of background characteristics as the non-Academy evaluation sample. No tests of statistical significance were performed.
72.9 72.264.5
8.4 10.8
10.1
11.1 8.6
7.8
0
10
20
30
40
50
60
70
80
90
100
Academy Non-Academy Urb-Pub:Est1

-25-
If the evaluation were only able to compare the performance of students in the Acad-
emy group with the performance of similar students from similar high schools across the coun-try, one might be led to the conclusion that Career Academies produce meaningful increases in high school graduation rates. In fact, however, the differences in high school completion rates are due to differences in other characteristics that are associated with the students’ initial moti-vation to apply for a Career Academy program.
In short, Exhibit 6 illustrates that the Career Academies did not have an impact (positive or negative) on high school completion rates. At the same time, the completion rates (particu-larly on-time graduation rates) for students in both the Academy and the non-Academy group would be considered high relative to national averages for similar students in similar schools. Thus, the Career Academies served as a viable strategy to prevent students from dropping out and to promote high school completion, though they were not better at this than the alternatives available in the high schools and communities where they are located.
• Overall, the Career Academies had no impact (positive or negative) on post-secondary education enrollment and attainment rates.
Exhibit 7 shows the percentage of Academy and non-Academy group members who had either completed a post-secondary education credential or were still working toward a cre-dential at the end of the 48-month follow-up period. It shows that, by the end of the follow-up period, about 56 percent of both groups had either completed a credential or were still working toward one. Though not shown in the exhibit, nearly 80 percent of both groups enrolled in some type of post-secondary education program during the 48-month follow-up period. This repre-sents approximately 87 percent of those who graduated from high school or received a GED. Sample members from both groups spent an average of just over 21 months of the 48-month follow-up period enrolled in a post-secondary education program.
The post-secondary education enrollment rates for the study sample are quite high compared with national averages, which indicate that approximately 76 percent of those who complete high school or receive a GED enroll in some type of post-secondary education.18
As with high school completion status, the Career Academies had little or no impact on post-secondary educational attainment. Exhibit 7 shows the percentages of students who had completed or were still working on a post-secondary credential at the end of the follow-up
18See, for example, Ingels et al., 2002. A direct comparison of post-secondary education enrollment and
completion rates with the Career Academies Evaluation sample using data from the NELS survey of 1988 was not possible because of differences in follow-up periods (eight years for NELS and only four years for the Career Academies sample) and differences in the definitions of the educational attainment measures that were used.

-26-
Acad. Non Acad. Academy Grou-Academy G Impacts55.5 56.7
Certificate/L 20.50 22.20 -1.7Associate's D 18.70 17.10 1.7Bachelor's D 16.30 17.50 -1.1
Impacts on Highest Post-Secondary Credential Completed or in Progress
Career Academies Evaluation
Exhibit 7
for the Full Study Sample
20.5 22.2
18.7
16.3 17.5
17.1
0
10
20
30
40
50
60
70
80
90
100
Perc
enta
ge C
ompl
eted
or
in P
rogr
ess
Certificate/License Associate's Degree Bachelor's Degree
55.5 56.8
Impact = - 1.3
AcademyGroup
Non-AcademyGroup
SOURCE: MDRC calculations from the Career Academies Evaluation Four-Year Post-High School Follow-Up Survey.
NOTES: Unless otherwise indicated, statuses reflect a 48-month period ending in June of 2000, 2001, or 2002, the fourth year following scheduled high school graduation for each sample member. Estimates are regression-adjusted using maximum likelihood estimation, controlling for background characteristics. Standard errors are adjusted to account for the clustering of students within schools and random assignment years. Rounding may cause slight discrepancies in calculating sums and differences. A two-tailed t-test was applied to differences between the Academy and non-Academy groups. Statistical significance levels are indicated as: *** = 1 percent; ** = 5 percent; * = 10 percent. Students must have earned a high school diploma or GED to be considered enrolled in a post-secondary education program. A credential was considered "in progress" if the student reported attempting it in a program that he or she was currently attending (within three months of the end of the follow-up period) and expected to complete.

-27-
period.19 It shows that 16 percent of the Academy group and just over 17 percent of the non-Academy group had received a bachelor’s degree or were still working toward one. Though not shown in the exhibit, the vast majority of these sample members (about 14 percent of both the Academy and the non-Academy group) were still working toward a bachelor’s degree at the end of the follow-up period.20 Exhibit 7 also shows that approximately 19 percent of the Acad-emy group and 17 percent of the non-Academy group had either completed or were still work-ing toward an associate’s degree. In this case, 13 percent of the Academy group and 12 percent of the non-Academy group were still working toward an associate’s degree (not shown in the exhibit). In all, only about 8 percent of the young people in both the Academy and the non-Academy group had completed a two-year or four-year degree, and 27 percent were still work-ing on these credentials at the end of the follow-up period.
Not surprising, the largest proportion of degrees completed or in progress occurred in certificates and licenses, which typically are earned through a one-year training program. About 21 percent of the Academy group and 22 percent of the non-Academy group had either com-pleted or were still working toward a certificate or license. The vast majority of sample mem-bers in this status (18 percent of the Academy group and 20 percent of the non-Academy group) already completed their credential by the end of the follow-up period.
The survey that was administered to the study sample for this report also asked for de-tailed information about the education programs in which sample members were enrolled near or at the end of the follow-up period.21 Supplementary analyses of these data provide some fur-ther insights into enrollment patterns and the characteristics of the programs. It should be noted that, as with other educational outcomes, there was little or no difference between Academy and
19Sample members were considered to be making progress on a credential if they were enrolled in a post-
secondary program within three months of the end of the follow-up period and if they reported that they were still working toward their degree and expected to complete it.
20Note that percentages in Exhibit 7 pertain to the highest level of post-secondary education completed or in progress at the end of the follow-up period. A small percentage of sample members who are listed as com-pleting or still working toward a bachelor’s degree may also have completed an associate’s degree. Similarly, some students who are listed as completing or still working toward an associate’s degree also completed a training certificate or licensing program.
21Unit 4 of the Technical Resources for this report (Kemple and Scott-Clayton, 2004) provides a list of these characteristics for both groups. The information on education program characteristics discussed in this section of the report and presented in the Technical Resources is based only on the sample members who en-rolled in post-secondary education programs during the follow-up period and focuses only on the characteris-tics of the last program they attended. As a result, differences between Academy and non-Academy groups do not represent valid indicators of Career Academy impacts (or lack of impacts).

-28-
non-Academy group members in the characteristics of the education programs they last at-tended during the follow-up period.22
Analysis of the supplementary survey data indicates that sample members in both groups were enrolled in their most recent education program for an average of 20 months. The average sample member had either completed or left that program about 12 months before the end of the follow-up period. Further analysis also indicates that about 30 percent of the students who were enrolled in post-secondary education programs left those programs before they com-pleted their degrees. Nearly half of those who left indicated that they did so for financial reasons or to spend more time at work.
Sample members attended class an average of nearly 20 hours per week, and more than two-thirds of the sample were enrolled in their most recent post-secondary education program full time. More than one-third of the sample took a basic or remedial math or reading course as part of the education program in which they were enrolled. The two largest sources of financial support were scholarships/grants and employment. Approximately 42 percent of those who were enrolled in post-secondary education programs received grants or scholarships to help pay tuition and expenses. Over 40 percent of the sample worked while attending school, to help pay tuition and expenses. The balance of expenses was covered by combinations of loans, work-study programs, personal savings, and family contributions.
• The Career Academies did not have systematic impacts on educational attainment for either young men or young women. Thus, the substantial impacts on labor market outcomes for young men did not come at the expense of reducing the prospects for post-secondary education.
Exhibit 8 shows the Career Academy impacts on high school completion status and on post-secondary education credentials earned or still in progress at the end of the follow-up pe-riod for the young men and young women in the study sample.23 The top half of the exhibit in-dicates that there were only small differences in the high school completion rates of both the young men and the young women in the Academy and the non-Academy groups.24 For both genders, the Academy group was slightly less likely (not statistically significant) to graduate
22Unit 3 of the Technical Resources for this report (Kemple and Scott-Clayton, 2004) includes information
about the most recent post-secondary education program attended by the Academy and non-Academy groups (see Exhibit 3.7).
23Unit 4 of the Technical Resources for this report (Kemple and Scott-Clayton, 2004) includes supplemen-tary tables that provide detailed findings on the Career Academies’ impacts on educational outcomes for young men and young women.
24None of the differences that are displayed in Exhibit 8 are statistically significant.

-29-
(continued)
Career Academies Evaluation
Exhibit 8
Impacts on Educational Attainment,by Gender
High School Completion Status
70.7 68.4 74.6 75.3
8.2 8.5 10.19.2 6.2
12.9
10.913.3
0102030405060708090
100
Perc
enta
ge C
ompl
eted
Graduated on time Graduated late Earned a GED
92.3 91.6
Impact = 0.7
92.292.2
Impact = 0.0
AcademyGroup
Non-AcademyGroup
Young Men
AcademyGroup
Non-AcademyGroup
Young Women
Highest Post-Secondary Credential Completed or in Progress
23.4 20.6 21.4
17.8 16.4
14.5 16.8 17.8 17.7
20.0
18.219.7
0102030405060708090
100
Perc
enta
ge C
ompl
eted
or
in P
rogr
ess
Certificate/License Associate's Degree Bachelor's Degree
58.454.2
Impact = - 4.2
55.556.2
Impact = 0.7
AcademyGroup
Non-AcademyGroup
Young Men
AcademyGroup
Non-AcademyGroup
Young Women
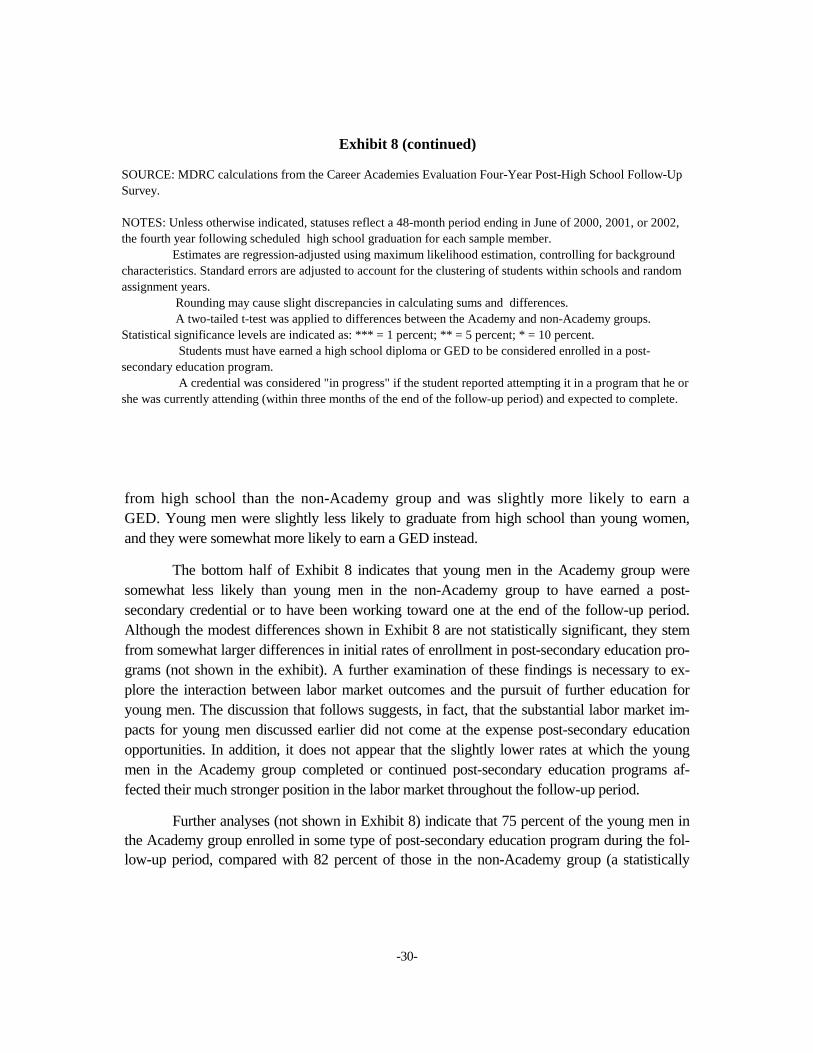
-30-
from high school than the non-Academy group and was slightly more likely to earn a GED. Young men were slightly less likely to graduate from high school than young women, and they were somewhat more likely to earn a GED instead.
The bottom half of Exhibit 8 indicates that young men in the Academy group were somewhat less likely than young men in the non-Academy group to have earned a post-secondary credential or to have been working toward one at the end of the follow-up period. Although the modest differences shown in Exhibit 8 are not statistically significant, they stem from somewhat larger differences in initial rates of enrollment in post-secondary education pro-grams (not shown in the exhibit). A further examination of these findings is necessary to ex-plore the interaction between labor market outcomes and the pursuit of further education for young men. The discussion that follows suggests, in fact, that the substantial labor market im-pacts for young men discussed earlier did not come at the expense post-secondary education opportunities. In addition, it does not appear that the slightly lower rates at which the young men in the Academy group completed or continued post-secondary education programs af-fected their much stronger position in the labor market throughout the follow-up period.
Further analyses (not shown in Exhibit 8) indicate that 75 percent of the young men in the Academy group enrolled in some type of post-secondary education program during the fol-low-up period, compared with 82 percent of those in the non-Academy group (a statistically
Young Men Young WomAcad. Non-Acad Acad.
Certificate/L 20.0 23.4 20.6Associate's D 19.7 18.2 17.8Bachelor's D 14.5 16.8 17.8
Exhibit 8 (continued)
SOURCE: MDRC calculations from the Career Academies Evaluation Four-Year Post-High School Follow-Up Survey. NOTES: Unless otherwise indicated, statuses reflect a 48-month period ending in June of 2000, 2001, or 2002, the fourth year following scheduled high school graduation for each sample member. Estimates are regression-adjusted using maximum likelihood estimation, controlling for background characteristics. Standard errors are adjusted to account for the clustering of students within schools and random assignment years. Rounding may cause slight discrepancies in calculating sums and differences. A two-tailed t-test was applied to differences between the Academy and non-Academy groups. Statistical significance levels are indicated as: *** = 1 percent; ** = 5 percent; * = 10 percent. Students must have earned a high school diploma or GED to be considered enrolled in a post-secondary education program. A credential was considered "in progress" if the student reported attempting it in a program that he or she was currently attending (within three months of the end of the follow-up period) and expected to complete.

-31-
significant difference).25 Furthermore, the lower initial post-secondary enrollment rates among the Academy group were offset somewhat by higher attrition rates among those in the non-Academy group. In other words, although the young men in the non-Academy group were somewhat more likely to enroll in a post-secondary education program, they were also more likely than young men in the Academy group to leave their post-secondary programs before completion. Also, differences in post-secondary enrollments and completions for young men were concentrated in short-term skills training or trade school programs. About half the differ-ence in initial enrollment rates and about half the difference in completion rates was among those who enrolled in one-year training programs. In all, young men in the Academy group at-tended post-secondary education programs for an average of 20 months during the follow-up period, compared with 21 months for young men in the non-Academy group. This one-month difference is not statistically significant. Finally, at the end of the follow-up period — when the labor market benefits from the short-term training programs might begin to emerge — young men in the Academy group had substantially higher earnings and employment rates than those in the non-Academy group.
Finally, Exhibit 8 indicates that the Career Academies had little or no impact (positive or negative) on educational attainment for young women. Young women in the non-Academy group graduated from high school and went on to a range of post-secondary programs at the same high rates as young women in the Academy group.
• The analysis suggests that the Career Academies may have produced a modest reduction in post-secondary education enrollment rates for the high-risk subgroup. The Academies had no systematic impact (positive or negative) on educational attainment for the medium- and low-risk subgroups.
Exhibit 9 displays the high school and post-secondary completion statuses of the three risk subgroups discussed earlier.26 First, the top half of the exhibit shows that, as expected, the Academy and non-Academy groups in each risk subgroup attained dramatically different rates of high school completion, particularly in their rates of on-time graduation. For example, while only 53 percent of the high-risk Academy group graduated from high school on time, 74 percent of the medium-risk subgroup and 89 percent of the low-risk subgroup did so. Recall that these risk subgroups are defined on the basis of background characteristics that are associated with the risk of dropping out of high school. Despite these differences in outcome levels, however,
25See Unit 4 of the Technical Resources for this report (Kemple and Scott-Clayton, 2004). 26Unit 5 of the Technical Resources for this report (Kemple and Scott-Clayton, 2004) includes supplemen-
tary tables that provide detailed findings on the Career Academies’ impacts on educational outcomes for the risk subgroups.

-32-
(continued)
Career Academies Evaluation
Exhibit 9
Impacts on Educational Attainment, by Risk Subgroup
High School Completion Status
52.9 49.0
74.089.2 91.1
11.6 15.4
17.7 18.5
74.2
6.45.7
7.7 11.2
5.0 1.8
10.8 6.9
0
10
2030
40
50
60
7080
90
100
Perc
enta
ge C
ompl
eted
Graduated on time Graduated late Earned a GED
82.982.2
Impact = - 0.7 99.399.9
Impact = 0.6
92.192.7
Impact = 0.6
AcademyGroup
Non-AcademyGroup
High Risk
AcademyGroup
Non-AcademyGroup
Medium Risk
AcademyGroup
Non-AcademyGroup
Low Risk
Highest Post-Secondary Credential Completed or in Progress
22.4 24.7 21.9 25.014.9 15.2
13.917.7 19.8 17.2
22.0 16.3
6.5 14.2 13.031.6 37.83.4
0
10
20
30
40
50
60
70
80
90
100
Perc
enta
ge C
ompl
eted
or
in P
rogr
ess
Certificate/License Associate's Degree Bachelor's Degree
48.939.7
Impact = - 9.269.368.5
Impact = - 0.8
55.255.9
Impact = 0.7
AcademyGroup
Non-AcademyGroup
High Risk
AcademyGroup
Non-AcademyGroup
Medium Risk
AcademyGroup
Non-AcademyGroup
Low Risk

-33-
the top half of Exhibit 9 indicates that the Career Academies had almost no impact on high school completion status for any of the three risk subgroups.27
The bottom half of Exhibit 9 suggests a more mixed set of findings regarding progress toward post-secondary education credentials. The first set of bars in the exhibit indicates that, among those in the high-risk subgroup, the Career Academies reduced the percentage of Acad-emy group members who had completed a post-secondary credential or were still working to-ward a credential at the end of the follow-up period. Although this impact is not statistically significant, it follows from the finding (not shown in the exhibit) that the high-risk Academy group was less likely than the non-Academy group to enroll in a post-secondary education pro-gram to begin with; 60 percent of the high-risk Academy group enrolled in some type of post-secondary education during the follow-up period, compared with nearly 72 percent of the high-risk non-Academy group. The reduction in initial enrollments was confined to two-year colleges and associate’s degree programs. Among high-risk sample members who did enroll in associ-ate’s degree programs, however, those in the Academy group were more likely to complete or persist in those programs than were those in the non-Academy group who also enrolled. Over-all, however, high-risk Academy group members were enrolled in post-secondary education programs for an average of about 11 months during the follow-up period, compared with nearly 15 months for those in the non-Academy group (a statistically significant difference).
27None of the differences that are displayed in Exhibit 9 are statistically significant.
Exhibit 9 (continued)
SOURCE: MDRC calculations from the Career Academies Evaluation Four-Year Post-High School Follow-Up Survey.
NOTES: Unless otherwise indicated, statuses reflect a 48-month period ending in June of 2000, 2001, or 2002, the fourth year following scheduled high school graduation for each sample member. Estimates are regression-adjusted using maximum likelihood estimation, controlling for background characteristics. Standard errors are adjusted to account for the clustering of students within schools and random assignment years. Rounding may cause slight discrepancies in calculating sums and differences. A two-tailed t-test was applied to differences between the Academy and non-Academy groups. Statistical significance levels are indicated as: *** = 1 percent; ** = 5 percent; * = 10 percent. Students must have earned a high school diploma or GED to be considered enrolled in a post-secondary education program. A credential was considered "in progress" if the student reported attempting it in a program that he or she was currently attending (within three months of the end of the follow-up period) and expected to complete.

-34-
As noted earlier, however, the lower rates of post-secondary education enrollment among the high-risk Academy group members did not compromise their much stronger position in the labor market. Even in the last year of the follow-up period, high-risk Academy group members continued to earn more than their non-Academy group counterparts.
The second set of bars in the bottom part of Exhibit 9 indicates that over half of those in the medium-risk subgroup had either completed a post-secondary credential or were still work-ing toward a credential at the end of the follow-up period. Although none of the differences be-tween the Academy and non-Academy groups are statistically significant, the exhibit suggests that the slight reduction in completion or progress toward training certificates and licenses was offset by a slight increase in completion or progress toward an associate’s degree. This pattern is consistent with trends in initial post-secondary enrollments, which are statistically significant. This suggests that the Career Academies may have had a slight impact on moving medium-risk students into an associate’s degree program rather than into short-term skills training programs.
Finally, the third set of bars in Exhibit 9 indicates that more than two-thirds of those in the low-risk subgroup had either completed a post-secondary credential or were still working toward a credential at the end of the follow-up period. As with the other risk subgroups, none of the differ-ences between the Academy and non-Academy groups are statistically significant. In the case of the low-risk subgroup, however, a slight decrease in completion or progress toward training cer-tificates and licenses was offset by a slight increase in completion or progress toward bachelor’s degrees. This suggests that the Career Academies may have had a slight impact on moving low-risk students into an associate’s degree program rather than a bachelor’s degree program.
The foregoing analyses do not indicate any clear or systematic patterns of Career Acad-emy impacts on post-secondary education enrollments or attainment. Few of the differences between the Academy and non-Academy groups are statistically significant. Even the few initial enrollment rates that were lower among Academy group members were mitigated by somewhat higher attrition rates among the non-Academy group. Further analysis and, ideally, additional follow-up data may provide a clearer picture of how Career Academies influence longer-term educational attainment and the balance between labor market participation and additional in-vestments in education.
Impacts on Social Adjustment This final set of findings addressed in this report focuses on several indicators of social
adjustment. For the purposes of this report, social adjustment measures include marital status, parenting, living arrangements, public assistance receipt, access to health insurance, voter regis-tration, and involvement with the criminal justice system. Career Academies may be able to improve these types of outcomes because of their focus on forging strong interpersonal supports

-35-
for students during high school and their investment in facilitating healthy transitions to produc-tive opportunities after high school. At the same time, the years immediately following high school are typically unsettled as young people focus on balancing school and work, establish new adult relationships outside their families, and begin to look ahead to longer-term personal and career goals. As a result, it might be too early to discern any patterns of social adjustment among the study sample or any indications that the Career Academies could have had impacts on these outcomes. Even so, this section of the report briefly discusses findings on measures of social adjustment in order to provide further insights into the circumstances and behavior of the young people in the study.
• With the exception of an increase in health insurance coverage, the Ca-reer Academies did not produce any clear patterns of impacts (positive or negative) on social adjustment measures, either for the full sample or for the various subgroups.
Exhibit 10 lists several indicators of social adjustment reported by sample members on the follow-up survey.28 The exhibit indicates that the Career Academies reduced slightly the percentage of Academy group members who were without health insurance coverage during the last year of the follow-up period. Further analysis indicates that this impact was associated with the increase in employment among those in the Academy group.
The first row of the table shows that nearly 37 percent of the Academy group had chil-dren. Though not shown in the table, this includes 44 percent of the young women and 27 per-cent of the young men.29 As noted earlier, childbearing among the young women appears to have had a powerful influence on the degree to which they engaged in post-secondary education (either exclusively or in combination with work) or focused on working as their primary activity beyond parenting.
The exhibit also shows that about 20 percent of the Academy group reported that they were married (this includes 23 percent of the young women and 16 percent of the young men). In addition, 48 percent of the Academy group reported that they were living with their parents. Young men in the Academy group were somewhat less likely to be living with their parents (51 percent) than were young men in the non-Academy group (58 percent).
28Supplementary tables that provide detailed findings on the Career Academies’ impacts on social adjust-
ment indicators for the gender subgroups and the risk subgroups can be found in Units 4 and 5, respectively, of the Technical Resources for this report (Kemple and Scott-Clayton, 2004).
29Given the overall similarity in outcome levels for these measures among both the Academy and the non-Academy group, most of the discussion in this section focuses on the Academy group.

-36-
Career Academies Evaluation
Exhibit 10
Academy Non-AcademyOutcome (%) Group Group Impact
Is a parent 36.8 35.2 1.7 0.0
Is a custodial single parent 19.0 17.3 1.8 0.0
Marital status Married 19.8 19.3 0.5 0.0Single 77.0 78.3 -1.3 0.0Divorced, separated, or widowed 3.2 2.3 0.8 0.0
Lives with parent(s) or guardian(s) 48.2 52.3 -4.1 0.0
Has ever gone without health insurance in past year 27.1 31.3 -4.2 *
Has received TANF or cash assistance in past year 7.2 5.9 1.3 0.0
Has received food stamps in the past year 9.8 8.0 1.8 0.0
Is registered to vote 66.3 64.7 1.6 0.0
Was involved in recent illegal or drug-related activitya 6.7 6.2 0.6 0.0
Sample size (N=1,458) 799 659
Impacts on Social Adjustment Indicatorsfor the Full Study Sample
SOURCE: MDRC calculations from the Career Academies Evaluation Four-Year Post-High School Follow-Up Survey Database.
NOTES: Unless otherwise indicated, statuses were reported for the end of a 48-month period ending in June 2000, 2002, or 2002, the fourth year following scheduled high school graduation. Estimates are regression-adjusted using maximum likelihood estimation, controlling for background characteristics. Standard errors are adjusted to account for the clustering of students within schools and random assignment years. Rounding may cause slight discrepancies in calculating differences. A two-tailed t-test was applied to differences between the Academy and non-Academy groups. Statistical significance levels are indicated as: *** = 1 percent; ** = 5 percent; * = 10 percent. aThis measure includes illegal drug use in the past two weeks, breaking the law (other than traffic violations) in the past two weeks, current gang membership, and any arrests or convictions in the past year.

-37-
Exhibit 10 further indicates that both groups were very unlikely to have received public
assistance or to be involved with the criminal justice system. These findings are consistent with the very high rates of engagement in either education or employment throughout the follow-up period. In fact, though not shown in the exhibit, those in the Academy group were either attend-ing school or working during 42 of the 48 months in the follow-up period. The high rates of en-gagement in productive activities and the low rates of risk-taking behaviors suggest that the sample members, on average, were making quite successful transitions to adulthood.
Implications of the Findings The findings discussed above suggest several potentially important implications for
education policy and practice.
• The findings provide convincing evidence that increased investments in career-related experiences during high school can improve students’ post-secondary labor market prospects.
A growing body of descriptive analysis suggests that increases in vocational course-taking and engagement in higher-quality work-based learning programs during high school are associated with better labor market outcomes after high school.30 Much of this research focuses only on the correlation between high school course-taking patterns or work experiences and later labor market experiences. Given limitations to control for self-selection and program selec-tion of students into these high school experiences, it is difficult to make valid causal inferences about the relationships.
The findings discussed in this report provide some of the most convincing evidence yet that a high school-based intervention can produce substantial and sustained improvements in post-secondary labor market prospects. In fact, the magnitude of the impacts on monthly earn-ings for young men exceed differences in earnings that have been found in other research com-paring young workers who have one or two years of post-secondary education with those who have only a high school diploma.31 While one should not conclude from this that Career Acad-emies can substitute for post-secondary education below the associate’s-degree level, the find-ings seem to suggest that Academies do produce benefits in the labor market that are commen-surate with those associated with continuing investment in post-secondary programs.
30See Stern et al., 1992; Curtin et al., 2002; Urquiola et al., 1997; Stern et al., 1994; Stern, McMillion,
Hopkins, and Stone, 1990. 31See Pond, Sum, Mykhaylo, and Meredith, 2002.

-38-
While this report provides strong evidence that the Career Academies produced real improvements in labor market prospects (particularly for young men), forthcoming analyses will examine how the programs produced these effects and which features were likely to have contributed most to the impacts.32 Preliminary findings shed some light on these issues. The analyses focus on the various cohorts of students who entered the study in each of the sites dur-ing the three years of sample intake. Because random assignment was done independently for each of these cohorts, each represents a small random assignment experiment. The additional analyses involved a preliminary comparison of impacts across these cohorts. This comparison provides suggestive evidence that substantial increases in students’ exposure to career aware-ness and development activities were associated with more substantial labor market impacts. Such career awareness and development activities included job shadowing, work-based learning activities, career fairs, guest speakers, and career-related guidance. In other words, cohorts of students in the study sample who experienced substantial increases in exposure to these types of activities were also more likely to have experienced strong, positive labor market impacts. It is important to note, however, that this association occurred only when the programs also enabled students to complete a basic academic core curriculum. Some cohorts experienced substantial increases in vocational and career-related course-taking that were accompanied by a reduction in academic course-taking. These cohorts were more likely to exhibit small or negligible im-pacts on labor market outcomes.
• The Career Academies in this study demonstrate the feasibility of ac-complishing the goals of school-to-career and career-technical education without compromising academic goals.
Like many approaches to education reform, the Career Academy model has many and varied goals. Career Academies aspire to prevent students from dropping out of high school and to prepare them for college and other post-secondary education opportunities. At the same time, Career Academies provide students with an explicit introduction to the world of work and try to furnish them with skills and connections to help them navigate the transition from high school to successful employment. Many critics of school-to-work transition initiatives and career-technical programs contend that programs like Career Academies track students into classes and work experiences that orient them toward immediate entry into the labor market. Such criticism
32To explore these and other issues, MDRC will conduct further analyses using the data that have been
collected for the Career Academies Evaluation. These analyses, involving both experimental and quasi-experimental methods, will include a synthesis of findings across the full eight years of follow-up for the study and a deeper examination of the sources of the impacts that the programs produced (or explorations of why the programs did not produce impacts — for example, on educational attainment).

-39-
sometimes suggests that this orientation comes at the expense of preparation for and opportuni-ties to attend college.
In this study, however, the high rates of enrollment in post-secondary education pro-grams and the sustained impacts on employment and earnings suggest that such tradeoffs need not occur. Even in the case of the high-risk subgroup, where there was a moderate (not statisti-cally significant) reduction in post-secondary education enrollments, this does not appear to have diminished the substantial impacts on labor market outcomes through the end of the fol-low-up period.
At the same time, the findings indicate that although the Academies provided a viable pathway to post-secondary education, they did not create better opportunities than those offered in the regular high school environment. This is consistent with previous findings from the evaluation, which indicate that Career Academies offered essentially the same set of academic courses and course requirements as those offered in the rest of the high school. In addition, Ca-reer Academy students were typically assigned to the regular high school guidance counselors and college placement services if they were interested in going on to post-secondary education. Through their partnerships with local employers, the Career Academies did tend to offer stu-dents opportunities to learn about the education and skill requirements of various occupations in their career field. It is hypothesized that these experiences could improve students’ aspirations and access to higher education.
• The findings suggest that Career Academies should make special efforts to serve students who are at risk of dropping out of high school.
One theme that has evolved from the Career Academies Evaluation is that students who enter the programs at high or medium risk of dropping out of high school tend to benefit most from exposure to the programs. Earlier findings indicate that high-risk students experienced mod-est reductions in dropout rates and increases in attendance and course-taking (although these did not translate into impacts on graduation or post-secondary enrollment rates). The present findings indicate that the Academies’ strong labor market impacts were concentrated among the high- and medium-risk subgroups. Even for the high-risk subgroup, impacts on labor market outcomes grew over time, despite the modest reductions in post-secondary education enrollments.
These findings suggest that Career Academies should sustain their commitment to serv-ing a diverse group of students but that they should also make greater efforts to attract and retain high- or medium-risk students. At the same time, however, targeting such students exclusively might lower expectations for the program among teachers, students, and parents. More impor-tant, the implementation research for this evaluation indicates that the Academies draw much of their power to improve interpersonal supports and increase student engagement from the diver-sity of their student bodies.

-40-
Several school districts and school reform initiatives around the country are now at-tempting to convert entire high schools into clusters of Career Academies. Instead of giving stu-dents the option of enrolling in traditional general or vocational programs, these wall-to-wall Academies offer students a choice among different Academies that combine academic and ca-reer-related curricula. This approach may have the greatest potential for maximizing high-risk students’ access to the programs (because all students would be required to enroll in an Acad-emy) while ensuring that the Academies include a broad mix of students. These high schools and reform initiatives, however, face the related challenges of preventing high-risk students from being tracked into poorly implemented Academies and of ensuring a high level of imple-mentation on a larger scale.
• The Career Academies Evaluation demonstrates the feasibility, benefits, and challenges of conducting a longitudinal random assignment evalua-tion of a prominent high school reform approach.
The Career Academies Evaluation is one of the few longitudinal random assignment evaluations of a school-based education intervention. Without the random assignment research design and the extended follow-up period, it is likely that an alternative approach to the study would have yielded misleading findings and conclusions. For example, the statistical compari-sons with national data might suggest that the Career Academies represent a substantially better educational opportunity than many alternatives available to similar students from similar schools and school districts across the country. The availability of a valid control group — de-termined by the random assignment design of the evaluation — shows that the Career Acad-emies in this study tended to attract students (by a combination of self-selection and program selection) who were likely to do well in high school and post-secondary education even if they had not been exposed to the Career Academies.

-41-
References and Bibliography
Atkinson, Richard C., and Gregg B. Jackson. 1992. Research and Education Reform: Roles for the Office of Educational Research and Improvement. Washington, DC: National Academy Press.
Betsey, Charles L., Robinson Hollister, and Mary R. Papageorgiou (eds.). 1985. Youth Employment and Training Programs: The Yedpa Years. Washington, DC: Committee on Youth Employment Programs, National Research Council.
Bloom, Howard S. 1984. “Accounting for No-Shows in Experimental Evaluation Designs.” Evaluation Review 8 (2): 225-246.
Cameron, Stephen V., and James J. Heckman. 1991. “The Nonequivalence of High School Equivalents.” Cambridge, MA: National Bureau of Economic Research.
Career Academy Support Network. 2001. Web site: http://casn.berkeley.edu/.
Curtin, Thomas R., Steven J. Ingels, Shiying Wu, Ruth Heuer, and Jeffrey Owings. 2002. National Education Longitudinal Study of 1988: Base-Year to Fourth Follow-Up Data File User’s Manual. Washington, DC: U.S. Department of Education, Office of Educational Research and Improvement.
Grubb, W. Norton (ed.). 1995a. Education Through Occupations in American High Schools: The Challenges of Implementing Curriculum Integration, Vol. 1. New York: Teachers College Press.
Grubb, W. Norton (ed.). 1995b. Education Through Occupations in American High Schools: The Challenges of Implementing Curriculum Integration, Vol. 2. New York: Teachers College Press.
Ingels, Steven J., Thomas R. Curtin, Phillip Kaufman, Martha Naomi Alt, Xianglei Chen, and Jeffrey A. Owings. 2002. Coming of Age in the 1990s: The Eighth-Grade Class of 1988 12 Years Later. Washington, DC: U.S. Department of Education, Office of Educational Research and Improvement.
Job Training Partnership Act. 1989. U.S. Public Law 97-300 (October. 13, 1982); 96 Stat. 1322; classified principally to Chapter 19, secs. 1501 et seq., of Title 29, Labor.
Kemple, James J. 1997. Career Academies: Communities of Support for Students and Teachers — Emerging Findings from a 10-Site Evaluation. New York: MDRC.
Kemple, James. 2001. Career Academies: Impacts on Students’ Initial Transitions to Post-Secondary Education and Employment. New York: MDRC.
Kemple, James J. 2001. Career Academies: Impacts on Students’ Initial Transitions to Post-Secondary Education and Employment. Technical Resources.
Web page: http://www.mdrc.org/Reports2001/CareerAcademies/CA_TechResources.htm.

-42-
Kemple, James J., and Judith Scott-Clayton. 2004. Career Academies: Impacts on Labor Market Outcomes and Educational Attainment. Technical Resources.
Web page: http://www.mdrc.org/Reports2004/CareerAcademies/CA_TechResources.htm.
Kemple, James J., Susan M. Poglinco, and Jason C. Snipes. 1999. Career Academies: Building Career Awareness and Work-Based Learning Activities Through Employer Partnerships. New York: MDRC.
Kemple, James, and JoAnn Leah Rock. 1996. Career Academies: Early Implementation Lessons from a 10-Site Evaluation. New York: MDRC.
Kemple, James, and Jason C. Snipes. 2000. Career Academies: Impacts on Students’ Engagement and Performance in High School. New York: MDRC.
Klerman, Jacob Alex, and Lynn A. Karoly. 1995. The Transition to Stable Employment: The Experience of Youth in Their Early Labor Market Career. Berkeley: University of California, National Center for Research in Vocational Education.
Maxwell, Nan, and Victor Rubin. 1997. The Relative Impact of a Career Academy on Post-Secondary Work and Education Skills in Urban, Public High Schools. Hayward, CA: Human Investment Research and Education Center.
Maxwell, Nan, and Victor Rubin. 1999. Improving the Transition from School to Work: Assessing the Impact of Old and New Strategies. Hayward, CA: Human Investment Research and Education Center.
Maxwell, Nan, and Victor Rubin. 2000. High School Career Academies: A Pathway to Educational Reform in Urban School Districts? Kalamazoo, MI: W. E. Upjohn Institute for Employment Research.
Murnane, Richard J., and Frank Levy. 1996. Teaching the New Basic Skills: Principles for Educating Children to Thrive in a Changing Economy. New York: Free Press.
National Center for Education Statistics. 1996. National Education Longitudinal Study: 1988-94 Methodology Report. Washington, DC: U.S. Government Printing Office.
National Center for Education Statistics. 1999. National Education Longitudinal Study: 1988-94 Data Files and Electronic Codebook System, Base Year Through Third Follow-Up. Washington, DC: U.S. Government Printing Office.
Orr, Larry, Howard Bloom, Stephen Bell, Fred Doolittle, Winston Lin, and George Cave. 1996. Does Training for the Disadvantaged Work? Washington, DC: Urban Institute Press.
Osterman, Paul, and Maria Iannozzi. 1993. “Youth Apprenticeships and School-to-Work Transitions: Current Knowledge and Legislative Strategy.” Working Paper No. 14. Philadelphia: National Center on the Educational Quality of the Workforce.
Pond, Nathan, Andrew Sum, Turub’sky Mykhaylo, and Frank Meredith. 2002. “Trends in the Level and Distribution of the Weekly and Annual Earnings of Young Adult Men and Women in the U.S., 1973-2001.” Washington DC: National League of Cities Institute on Youth, Education, and Young Families.

-43-
Snipes, Jason C. 1998. “Skill Mismatch, Turnover, and the Development of Young Workers’ Careers.” Ph.D. dissertation. Cambridge, MA: Harvard University, John F. Kennedy School of Government.
Stern, David, Charles Dayton, and Marilyn Raby. 2000. Career Academies: Building Blocks for Reconstructing American High Schools. Berkeley: University of California, Graduate School of Education.
Stern, David, Charles Dayton, and Marilyn Raby. 2003. “Career Academies and High School Reform Before, During, and After the School-to-Work Movement.” Pages 239-262 in W. J. Stull and N. M. Sanders (eds.), The School-to-Work Movement: Origins and Destinations. Westport, CT: Praeger.
Stern, David, Neal Finkelstein, James R. Stone III, John Latting, and Carolyn Dornsife. 1994. Research on School-to-Work Transition Programs in the United States. Berkeley: University of California, National Center for Research in Vocational Education.
Stern, David, Martin McMillion, Charles Hopkins, and James R. Stone III. 1990. “Work Experience for Students in High School and College.” Youth and Society 21, 3.
Stern, David, James R. Stone III, John Latting, Neal Finkelstein, and Gina Martinez. 1992. School to Work Transition and the Relevance of Vocational Education to Subsequent Employment: Review of Research. Berkeley: University of California, National Center for Research in Vocational Education. Prepared for the National Assessment of Vocational Education.
Urquiola, Miguel, David Stern, Ilana Horn, Carolyn Dornsife, Bernadette Chi, Lea Williams, Donna Merritt, Katherine Hughes, and Thomas Bailey. 1997. School to Work, College, and Career: A Review of Policy, Practice, and Results 1993-1997. Berkeley: University of California, National Center for Research in Vocational Education.


-45-
Earlier MDRC Publications on Career Academies
__________________________________________________________
The Career Academy approach to high school reform calls for restructuring large schools into smaller learning communities, improving instruction, and preparing students for transitions to further education or work. Career Academies have been implemented in an estimated 2,500 high schools across the United States. Begun in 1993, MDRC’s evaluation of Career Academies — the first to use a random assignment research design — aims to produce reliable evidence about the approach’s effects on students’ performance and their move from high school into the workforce and post-secondary education.
Career Academies Impacts on Students’ Initial Transitions to Post-Secondary Education and Employment 2001. James Kemple
Career Academies Impacts on Students’ Engagement and Performance in High School 2000. James Kemple, Jason Snipes
Career Academies Building Career Awareness and Work-Based Learning Activities Through Employer Partnerships 1999. James Kemple, Susan Poglinco, Jason Snipes
Career Academies Communities of Support for Students and Teachers— Emerging Findings from a 10-Site Evaluation 1997. James Kemple
Career Academies Early Implementation Lessons from a 10-Site Evaluation 1996. James Kemple, JoAnn Leah Rock
________________________
NOTE: A complete list of MDRC publications is available from MDRC and on its Web site: www.mdrc.org.


About MDRC
MDRC is a nonprofit, nonpartisan social policy research organization. We are dedicated to learning what works to improve the well-being of low-income people. Through our research and the active communication of our findings, we seek to enhance the effectiveness of social policies and programs. MDRC was founded in 1974 and is located in New York City and Oakland, California.
MDRC’s current projects focus on welfare and economic security, education, and employment and community initiatives. Complementing our evaluations of a wide range of welfare reforms are new studies of supports for the working poor and emerging analyses of how programs affect children’s development and their families’ well-being. In the field of education, we are testing reforms aimed at improving the performance of public schools, especially in urban areas. Finally, our community projects are using innovative approaches to increase employment in low-income neighborhoods.
Our projects are a mix of demonstrations ― field tests of promising program models ― and evaluations of government and community initiatives, and we employ a wide range of methods to determine a program’s effects, including large-scale studies, surveys, case studies, and ethnographies of individuals and families. We share the findings and lessons from our work ― including best practices for program operators ― with a broad audience within the policy and practitioner community, as well as the general public and the media.
Over the past quarter century, MDRC has worked in almost every state, all of the nation’s largest cities, and Canada. We conduct our projects in partnership with state and local governments, the federal government, public school systems, community organizations, and numerous private philanthropies.

Career Academies
Impacts on Labor Market Outcomes and Educational Attainment
March 2004
Technical Resources
Unit 1: Sample Description and Survey Response Rate
Unit 2: Comparison of Academy Students and Non-Academy Students with National Data
Unit 3: Impacts for the Full Study Sample
Unit 4: Impacts for Gender Subgroups
Unit 5: Impacts for Risk Subgroups


-iii-
Contents
Unit 1 Sample Description and Survey Response Rate 1Exhibit 1.1 Response Rates for the Four-Year Post-High School Follow-Up
Survey for the Full Sample and Selected Subgroups 11Exhibit 1.2 Differences Between Respondents’ and Nonrespondents’
Background Characteristics 13Exhibit 1.3 Differences Between Academy and Non-Academy Sample
Members’ Background Characteristics 17Exhibit 1.4 Regression Coefficients for the Probability of Being in the Program
Group for the Full Study Sample and Risk Subgroups (Four-Year Post-High School Follow-Up Survey Sample, N = 1,458) 21
Exhibit 1.5 Regression Coefficients for the Probability of Being in the Program Group for the Full Study Sample and Gender Subgroups (Four-Year Post-High School Follow-Up Survey Sample, N = 1,458) 24
Unit 2 Comparison of Academy Students and Non-Academy Students with National Data 27
Exhibit 2.1 Unadjusted High School Completion Rates Four Years After High School for the Evaluation Sample and the NELS Sample 32
Exhibit 2.2 Unadjusted Degree Completion Rates Four Years After High School for the Evaluation Sample and the NELS Sample 33
Exhibit 2.3 Adjusted High School Completion Rates Four Years After High School for the Evaluation Sample and the NELS Sample 34
Exhibit 2.4 Adjusted Degree Completion Rates Four Years After High School for the Evaluation Sample and the NELS Sample 35
Unit 3 Impacts for the Full Study Sample 37Exhibit 3.1 Year-by-Year Impacts on Employment and Earnings for the Full
Study Sample 38Exhibit 3.2 Month-by-Month Impacts on Total Monthly Earnings for the Full
Study Sample 40Exhibit 3.3 Impacts on the Distribution of Earnings, Hours Worked, and Wages
for the Full Study Sample 41Exhibit 3.4 Components of the Impact on Average Monthly Earnings for the
Full Study Sample 42Exhibit 3.5 Differences in Characteristics of the Most Recent Job Held for
Those Who Were Employed in the Last Quarter for the Full Study Sample 43
Exhibit 3.6 Impacts on Educational Attainment for the Full Study Sample 45Exhibit 3.7 Characteristics of the Most Recent Educational Program Attended
for Those Who Ever Enrolled in Any Program 47

-iv-
Exhibit 3.8 Year-by-Year Impacts on Months Spent Attending School or
Working for the Full Study Sample 49Exhibit 3.9 Impacts on Family Formation, Public Assistance, and Behaviors
for the Full Study Sample 50Unit 4 Impacts for Gender Subgroups 51Exhibit 4.1-YM Year-by-Year Impacts on Employment and Earnings for Young
Men 52Exhibit 4.2-YM Month-by-Month Impacts on Total Monthly Earnings for Young
Men 54Exhibit 4.3-YM Impacts on the Distribution of Earnings, Hours Worked, and
Wages for the Young Men 55Exhibit 4.4-YM Components of the Impact on Average Monthly Earnings for
Young Men 56Exhibit 4.5-YM Differences in Characteristics of the Most Recent Job Held for
Those Who Were Employed in the Last Quarter for Young Men 57Exhibit 4.6-YM Impacts on Educational Attainment for Young Men 59Exhibit 4.7-YM Characteristics for the Most Recent Educational Program Attended
for Those Who Ever Enrolled in any Program for Young Men 61Exhibit 4.8-YM Year-by-Year Impacts on Months Spent Attending School or
Working for Young Men 62Exhibit 4.9-YM Impacts on Family Formation, Public Assistance, and Behaviors
for Young Men 63Exhibit 4.1-YW Year-by-Year Impacts on Employment and Earnings for Young
Women 64Exhibit 4.2-YW Month-by-Month Impacts on Total Monthly Earnings for Young
Women 66Exhibit 4.3-YW Impacts on the Distribution of Earnings, Hours Worked, and
Wages for Young Women 67Exhibit 4.4-YW Components of the Impact on Average Monthly Earnings for
Young Women 68Exhibit 4.5-YW Differences on Characteristics of the Most Recent Job Held for
Those Who Were Employed in the Last Quarter for Young Women 69
Exhibit 4.6-YW Impacts on Educational Attainment for Young Women 71Exhibit 4.7-YW Characteristics of the Most Recent Educational Program Attended
for Those Who Ever Enrolled in any Program for Young Women 73Exhibit 4.8-YW Year-by-Year Impacts on Months Spent Attending School or
Working for Young Women 75Exhibit 4.9-YW Impacts on Family Formation, Public Assistance, and Behaviors
for Young Women 76Exhibit 4.1-YWN Year-by-Year Impacts on Employment and Earnings for Young
Women Without Children 77

-v-
Exhibit 4.2-YWN Impacts on Educational Attainment for Young Women Without Children 79
Exhibit 4.1-YWC Year-by-Year Impacts on Employment and Earnings for Young Women With Children 81
Exhibit 4.2-YWC Impacts on Educational Attainment for Young Women With Children 83
Unit 5 Impacts for Risk Subgroups 85Exhibit 5.1-HR Year-by-Year Impacts on Employment and Earnings for the High-
Risk Subgroup 86Exhibit 5.2-HR Month-by-Month Impacts on Average Earnings for the High-Risk
Subgroup 88Exhibit 5.3-HR Impacts on Educational Attainment for the High-Risk Subgroup 89Exhibit 5.4-HR Year-by-Year Impacts on Months Spent Attending School or
Working for the High-Risk Subgroup 91Exhibit 5.5-HR Impacts on Family Formation, Public Assistance, and Behaviors
for the High-Risk Subgroup 92Exhibit 5.1-LR Year-by-Year Impacts on Employment and Earnings for the Low-
Risk Subgroup 93Exhibit 5.2-LR Month-by-Month Impacts on Average Earnings for the Low-Risk
Subgroup 95Exhibit 5.3-LR Impacts on Educational Attainment for the Low-Risk Subgroup 96Exhibit 5.4-LR Year-by-Year Impacts on Months Spent Attending School or
Working for the Low-Risk Subgroup 98Exhibit 5.5-LR Impacts on Family Formation, Public Assistance, and Behaviors
for the Low-Risk Subgroup 99Exhibit 5.1-MR Year-by-Year Impacts on Employment and Earnings for the
Medium-Risk Subgroup 100Exhibit 5.2-MR Month-by-Month Impacts on Average Earnings for the Medium-
Risk Subgroup 102Exhibit 5.3-MR Impacts on Educational Attainment for the Medium-Risk
Subgroup 103Exhibit 5.4-MR Year-by-Year Impacts on Months Spent Attending School or
Working for the Medium-Risk Subgroup 105Exhibit 5.5-MR Impacts on Family Formation, Public Assistance, and Behaviors
for the Medium-Risk Subgroup 106


Unit 1
Sample Description and Survey Response Rate
-2-
Post-High School Survey Data and Analysis Issues The Career Academies Four-Year Post-High School Follow-Up Survey, which was
administered to students in the study sample approximately 48 months after their scheduled graduation from high school, constitutes the primary data source for this report. The survey sample of 1,458 students represents 83 percent of the full study sample — 83 percent of the Academy group and 82 percent of the non-Academy group. The overall response rate and the similarity between the response rates for the Academy and non-Academy groups are very high by the standards of survey research.
Whenever survey response rates are less than 100 percent, however, it is important to investigate two factors that may confound interpretation of the findings. The first part of this unit focuses on whether the respondent sample systematically differs from the nonrespondent sample. It concludes that there were a number of differences between respondents and nonre-spondents. Most notably, young men and high-risk students were somewhat underrepresented in the respondent sample, while young women and low-risk students were slightly overrepre-sented. As a result, caution should be exercised in generalizing the impact findings from the respondent sample to the full report sample.
A second and more serious concern is whether respondents in the Academy group dif-fer systematically from respondents in the non-Academy group. The second part of this unit concludes that there were no systematic differences in background characteristics between the Academy and non-Academy group members who responded to the survey, affording a high degree of confidence that differences in outcomes between the two groups reflect impacts of the Career Academies rather than preexisting differences in background characteristics between Academy and non-Academy sample members who responded to the survey.
Post-High School Survey Response Rates
The evaluation team attempted to obtain information about high school graduation and initial post-high school education and employment experiences for the full sample of 1,764 stu-dents in all nine sites participating in the Career Academies Evaluation.1 For the present pur-
1Details about site selection can be found in the following previous report from the evaluation: James J.
Kemple and JoAnn Leah Rock, Career Academies: Early Implementation Lessons from a 10-Site Evalua-tion (New York: MDRC, 1996). Also, as discussed in that report, the initial research sample consisted of 1,953 students in 10 sites. A total of 189 of these students were dropped from the initial research sample, and efforts to collect data for them were discontinued. Students who were dropped from the sample include the following: 126 students in the initial sample who attended an Academy that was disbanded after two years in the study and was unable to provide sufficient follow-up data for its students and 59 students in the initial sam-ple who applied for an Academy program during their 10th-grade year and should not have been included in
(continued)

-3-
pose, this group of students — all of whom applied for a place in an Academy — is referred to as the study sample. Of the students in the study sample, 959 (54 percent) were randomly se-lected to enroll in an Academy (the Academy group). The remaining 805 students (46 percent of the study sample) were not invited to participate in the Academies but could choose other op-tions available in their high school or school district (the non-Academy group).
Each student entered the study at the end of the 1992-1993, 1993-1994, or 1994-1995 school year, at which point he or she was at the end of the 8th- or 9th-grade year. Whether stu-dents were in the 8th grade or 9th grade at the point of application depended on the Academy pro-gram to which they applied; two of the Academies began in the 9th grade, and the remaining seven began in the 10th grade. Students applied for admission to the programs at the end of the school year before expected enrollment. This report follows sample members through the 48 months after their scheduled graduation date — that is, through June 2000, 2001, or 2002, depend-ing on the year during which, and the grade level at which, sample members entered the study.
A key question for interpreting the findings presented in this report is whether students for whom survey data are available are representative of the full study sample. Exhibit 1.1 lists the percentages of students in the full study sample, and in key subgroups of interest, who re-sponded to the Four-Year Post-High School Follow-Up Survey. The first column in the table shows the overall response rates for the full sample and various subgroups, and the second and third columns show the rates for the Academy and non-Academy groups, respectively.
Overall, the survey achieved an 83 percent response rate, and response rates were at or above 80 percent for almost every subgroup. A response rate of 80 percent is considered high by survey research standards. This table also indicates, however, that there were some substan-tial differences in the response rate across different subgroup categories. For example, those at low risk of dropping out responded at a rate 10 percentage points higher than those at high risk (88 percent, compared with 78 percent), and young women responded at a rate 8 percentage points higher than young men (86 percent, compared with 78 percent).
At the same time, Exhibit 1.1 indicates that, in general, there were only modest differ-ences between Academy and non-Academy response rates within subgroup categories. The first line of the table shows that the very small difference in response rates between the Academy and non-Academy groups is not statistically significant. This means that, overall, there were no systematic differences in the response rates of Academy and non-Academy groups. The table also shows that there were no systematic differences in response rates between Academy and the study. This information was obtained from pre-random assignment school records and was confirmed with school staff. Finally, over the course of the data collection period, MDRC learned through contact with the schools and families that four other students were deceased.

-4-
non-Academy students who were young men or in any of the graduation cohorts, ethnicity sub-groups, or subgroups defined by baseline educational expectation. In two of the sites, however, the response rate was significantly higher for Academy students than for non-Academy stu-dents. Also, high-risk Academy students were somewhat more likely to respond than high-risk non-Academy students. Finally, the response rate for female students in the Academy group was also slightly higher than that for female students in the non-Academy group.
In a previous report from this evaluation, the research team reported a significant dis-crepancy in response rates to the One-Year Post-High School Follow-Up Survey between drop-outs and nondropouts. For administration of the Four-Year Post-High School Follow-Up Sur-vey, the evaluation devoted extra resources to achieve a high response rate regardless of dropout status. This extra effort appears to have paid off. The response rate among dropouts from the non-Academy group (70 percent) was lower than the rate among Academy group dropouts (76 percent), but this difference is not statistically significant (not shown in table). The overall re-sponse rate of 74 percent for dropouts, while perhaps not ideal, is relatively high for a popula-tion that is typically difficult to reach.
Exhibit 1.2 further illustrates the differences between those who responded to the sur-vey and those who did not (regardless of Academy or non-Academy status). It shows that there are a number of significant differences in baseline demographic, family, and educational charac-teristics. While the differences between respondents and nonrespondents are noteworthy, the high response rate helps ensure that the respondents are still reasonably representative of the full sample. In fact, one might expect that the higher the response rate, the greater the difference would be between those who responded and those who did not.
In short, the analysis of response rates indicates that the samples of students for whom four-year follow-up data are available are not perfectly representative of the full study sample of 1,764 students. Thus, caution should be exercised when attempting to generalize the findings beyond the students who are included in the analyses. Nevertheless, the overall response rates show that data are available for the vast majority of students in the study sample, making the findings fairly representative.
Comparison of Respondents in the Academy and Non-Academy Groups
The main strength of a random assignment research design is that it ensures that there are no systematic differences between the research groups in measured or unmeasured back-ground characteristics when sample members enter the study. As a result, any differences that emerge after that point can be attributed with confidence to the fact that one group had access to an Academy and the other group did not. Previous reports from the Career Academies Evalua-

-5-
tion demonstrated that there were indeed no systematic differences in background characteris-tics between Academy and non-Academy students in the study sample.
Nonetheless, when response rates on a follow-up survey are less the 100 percent, im-pact estimates may be biased if there are systematic differences in the background characteris-tics or the pre-random assignment experiences of Academy and non-Academy students who responded. A key question underlying the analyses presented in this report is thus: Do the Four-Year Post-High School Follow-Up Survey response patterns preserve the lack of systematic differences between the research groups ensured by the random assignment design? In other words, does this survey sample exhibit the same lack of systematic differences between Acad-emy and non-Academy students, both overall and for each of the risk and gender subgroups? Exhibit 1.3 presents the average characteristics of Academy and non-Academy students in the survey sample. This table shows that there were no statistically significant differences between the groups on any of the characteristics.
A more rigorous way to test for such differences is to use multiple regression analysis. Exhibit 1.4 presents linear regression estimates and statistical tests of whether there were any systematic differences between Academy and non-Academy students in the survey sample and in each of the three risk subgroups. The first column in Exhibit 1.4 shows that none of the dif-ferences in characteristics is statistically significant and that there was no systematic difference overall between the groups. The final row in the first column, the p-value of the F-statistic for the full study sample, is very close to 1, providing strong evidence that there was no overall pat-tern of differences between Academy and non-Academy students in the survey sample. A p-value of .10 or lower is typically considered a “high” likelihood that there are systematic differ-ences between groups.
The three remaining columns in Exhibit 1.4 present the same analysis for each of the three risk subgroups. These columns indicate that there are slight differences on a few individ-ual characteristics but no overall pattern of differences between Academy and non-Academy students for any of the subgroups. The p-values of the F-statistic for the subgroups range from .367 to .929.
Exhibit 1.5 repeats this analysis for the gender subgroups. Again, while there are slight differences on a few individual characteristics, there is no overall pattern of differences between Academy and non-Academy young men or young women. The p-value of the F-statistic is .944 for the subgroup of young men and .600 for the subgroup of young women.
In summary, the random assignment design resulted in two groups of students who did not differ systematically with respect to background characteristics or prior school experi-ences. The pattern of survey response rates for the full sample and for each of the risk and gender subgroups preserves this feature of the research design, affording confidence that any

-6-
differences in the outcome measures found are the result of the Academy group’s enrollment in the Career Academies.
Using Variance Components Model for Impact Estimation and Calculation of Standard Errors
The impact analyses conducted for previous reports from the Career Academies Evaluation were based on a straightforward comparison of the students randomly assigned to the Academy and non-Academy groups, irrespective of the site or cohort in which individual sample members were located. While this analytic method produces unbiased estimates of Ca-reer Academy impacts, it may oversimplify the structure of the variance. As a result, it may generate incorrect standard errors. This section of the Technical Resources provides an over-view of an analysis model that was used to estimate the impacts presented in the report and to calculate robust standard errors to determine statistical significance.
Most impact analyses use a standard ordinary least squares method to estimate program impacts and calculate the standard error of the impact. These analyses are typically based on the following model:
ijijij eTreatY ++= 10 ββ (1)
This is the model used to estimate impacts for previous reports from the Career Acad-emies Evaluation. Further discussion within MDRC and advice from colleagues in the field suggested that this model does not account for the actual structure of the random assignment process and, by extension, the structure of the error term ( ije ). Specifically, there were nine Ca-reer Academy sites. Rather than conducting one large random assignment process, random as-signment was conducted separately for each cohort of students admitted in particular school years. This resulted in 20 separate site-by-year cohorts. Therefore, the structure of the data for the Career Academies Evaluation is one in which individuals are clustered within cohorts.2
This clustering of sample members within random assignment cohorts may have impor-tant implications for the analysis. Impact estimates that fail to account for this phenomenon may result in inaccurate estimates of statistical precision and, therefore, in incorrect inferences re-garding the effects of Career Academies on student outcomes. The structure of the Career Acad-
2One could also think of the sample as structured in three levels: individuals, within cohorts, within
schools. However, the analysis is not attempting to generalize to a broader population of schools. Rather, it is concerned primarily with the effects in these nine Career Academies sites. Thus, this level of analysis would be estimated with fixed effects. Therefore, the analysis can be mathematically reduced to a two-level model.
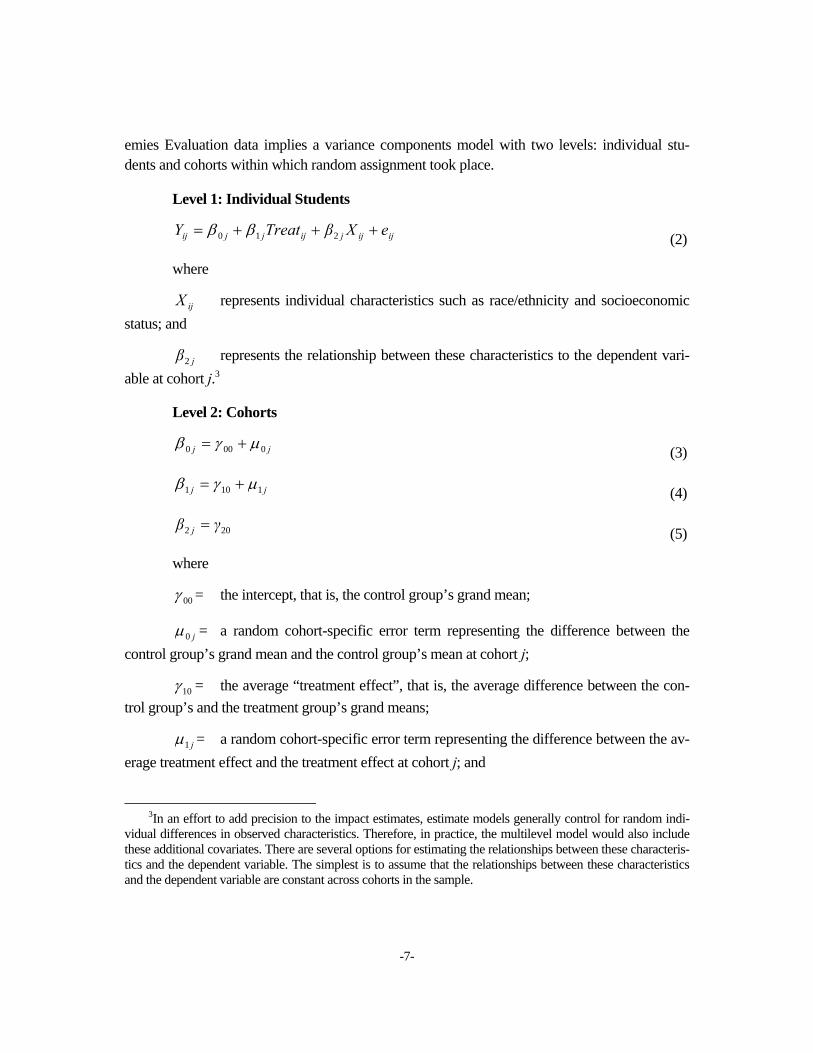
-7-
emies Evaluation data implies a variance components model with two levels: individual stu-dents and cohorts within which random assignment took place.
Level 1: Individual Students
ijijjijjjij eXβTreatY +++= 210 ββ (2)
where
ijX represents individual characteristics such as race/ethnicity and socioeconomic status; and
jβ2 represents the relationship between these characteristics to the dependent vari-able at cohort j.3
Level 2: Cohorts
jj 0000 µγβ += (3)
jj 1101 µγβ += (4)
202 γβ j = (5)
where
00γ = the intercept, that is, the control group’s grand mean;
j0µ = a random cohort-specific error term representing the difference between the control group’s grand mean and the control group’s mean at cohort j;
10γ = the average “treatment effect”, that is, the average difference between the con-trol group’s and the treatment group’s grand means;
j1µ = a random cohort-specific error term representing the difference between the av-erage treatment effect and the treatment effect at cohort j; and
3In an effort to add precision to the impact estimates, estimate models generally control for random indi-
vidual differences in observed characteristics. Therefore, in practice, the multilevel model would also include these additional covariates. There are several options for estimating the relationships between these characteris-tics and the dependent variable. The simplest is to assume that the relationships between these characteristics and the dependent variable are constant across cohorts in the sample.

-8-
20γ = the average relationship between background characteristics and dependent variable across the entire sample.
Composite Model: This system of equations yields the following composite model.
ijjijjijijij eTreatXTreatY +++++= 20 011000 µµγγγ (6)
Equation 6 yields an estimate of the average treatment effect ( 10γ ), accounting for the fact that individual students are clustered within random assignment cohorts. This treatment effect, 10γ , as typically calculated by most statistical packages, represents the average of the cohort-specific treatment effects, with each cohort-specific effect being weighted approximately inversely to its estimated variance.
Equation 6 assumes the existence of random cohort effects in average achievement as well as in the treatment effect. In other words, the model assumes that there is a cohort-specific component to the variance in the outcomes and that there is a cohort-specific component to the variance of the treatment effect. Supplementary analyses were conducted to assess the viability of these assumptions. These analyses yielded two conclusions. First, standard ordinary least squares calculations of standard errors are likely to significantly underestimate the magnitude of the standard errors and, thus, to overestimate the statistical significance of the impacts. This suggests the need for a multilevel variance components model that accounts for the clustering of sample members within random assignment cohorts. In other words, the j0µ term (the random cohort-specific error term representing the difference between the control group’s grand mean and the control group’s mean at cohort j) in Equation 6 should be included to ensure accurate calculation of the standard errors.
Second, the supplementary analyses indicated that the treatment effect does not vary significantly across cohorts. Therefore, it is appropriate to estimate a model within which the treatment effect is fixed rather than random at level 2. In other words, the j1µ term (the random cohort-specific error term representing the difference between the average treatment effect and the treatment effect at cohort j) in Equation 6 can be assumed to be zero and the estimation model need not allow for variation in impacts across cohorts. Thus, the following model was used to estimate the impact of Career Academies on student outcomes and to calculate robust standard errors:
ijjijijij eXTreatY ++++= 20 01000 * µγγγ (7)

-9-
Impacts and Program Participation A final analysis issue concerns the relationship between students’ actual exposure to the
Career Academies and the impacts that the programs had on students’ success in high school and beyond. As discussed in the text of this report and more extensively in previous reports, student attrition is a naturally occurring feature of Career Academies and, in fact, of high schools in general. About 15 percent of the students in the Academy group never enrolled in a Career Academy program, and an additional 30 percent enrolled for one or more semesters but eventually left the Academy in which they enrolled before the end of high school. In addition, a small percentage of students in the non-Academy group were inadvertently allowed to enroll in an Academy. It is important to note that the background characteristics of students who re-mained enrolled in the Academies differed from those who enrolled for a time and then left, making it difficult to make an unbiased estimate of the impacts that the Academies had for stu-dents who remained in their programs.
For example, high-risk students in the Academy group were less likely than medium- and low-risk students to enroll in a Career Academy and were more likely to have left the pro-grams if they did enroll. If high-risk students (including those who dropped out of high school altogether) were excluded from the Academy group but included in the non-Academy group, then comparisons between the groups would systematically overestimate the impacts of the Academy programs. In other words, if the high-risk (and less engaged) Academy students were excluded from the analysis, then it would appear that the Academies increased student engagement more than they actually had. However, there were also students who left the Academies and who were highly engaged in school but who wished to move on to a school environment that was better suited to their evolving needs and interests. If these students were excluded from the Academy group but included in the non-Academy group, then it would appear that the Academies reduced student engagement.
In order to produce unbiased estimates of the Academies’ impacts, therefore, the pri-mary analysis conducted for the evaluation includes all students in the Academy and non-Academy groups, regardless of their Academy enrollment status at any point after random as-signment. In this way, the findings reflect the impact of Career Academies under real-world conditions, which include a high rate of student attrition. Studying Career Academies under these conditions is arguably the most policy-relevant approach.
Of course, it is highly unlikely that the Career Academies had much effect on students in the Academy group who never enrolled in the programs. Nor can it be assumed that the Academies had no effect on students in the study’s non-Academy group who were allowed to enroll in the programs inadvertently. From this perspective, the impact estimates may be per-ceived as being diluted by the inclusion of some students in the Academy group who never en-rolled in the programs and by the small proportion of non-Academy group members who were

-10-
inadvertently allowed to enroll. It is therefore useful to examine impact estimates that account for these “crossovers” in research status, particularly estimates that indicate the impact per en-rollee on each outcome. The impact per enrollee can be interpreted as the impact from actually enrolling in an Academy as opposed to simply being recruited and selected for admission.4
Adjusting for crossovers does not substantially change the overall pattern of impacts discussed in this report. For students who completed the Four-Year Post-High School Follow-Up Survey, 87 percent of the Academy group enrolled in an Academy for at least one semester during high school, and 6 percent of the non-Academy group did so. The impact per enrollee adjustment is obtained by dividing the observed impact estimates by the difference between these rates, .81, which is equivalent to multiplying each impact estimate by 1.25. (If the percent-age of students who enrolled in an Academy had been 100 percent in the Academy group and 0 percent in the non-Academy group, then the difference between the rates would be 1.0, and no adjustment would be necessary.) As discussed in the report, most of the impact estimates are not sufficiently large to have this adjustment make them much larger or more policy-relevant.
Units 3, 4, and 5 of the Technical Resources for this report include the impact per enrol-lee, which is defined as the observed impact divided by the difference between the percentages of Academy and non-Academy students who ever enrolled in an Academy. These are listed in the rightmost column of the relevant tables.
4This adjustment, which was proposed by Bloom and by Orr and associates (cited below), relies on two
important assumptions: (1) that selection for the Academy group had no effect on students who did not enroll in an Academy and (2) that the average outcome levels for non-Academy students who were inadvertently allowed to enroll would have been the same if they had been assigned to the Academy group initially. Thus, the adjustment can be seen as discounting both the zero impact for the Academy group members who did not enroll in the program and the nonzero impact for the non-Academy group members who got the same treat-ment as the Academy enrollees. See Howard S. Bloom “Accounting for No-Shows in Experimental Evaluation Designs,” Evaluation Review 8 (2): 225-246 (1984); and Larry Orr, Howard Bloom, Stephen Bell, Fred Doolit-tle, Winston Lin, and George Cave, Does Training for the Disadvantaged Work? (Washington, DC: Urban Institute Press, 1996).

-11-
Career Academies Evaluation
Exhibit 1.1Response Rates for the Four-Year Post-High School Follow-Up Survey
for the Full Sample and Selected Subgroups
Academy Non-AcademySample Total Group Group
Subgroup Size (%) (%) (%)
Full sample 1764 82.7 83.3 81.9
SiteAnacostia 114 79.0 82.5 74.5L.C./Eastern 259 81.9 86.4 76.5 **Socorro 199 85.9 89.7 81.5 *Miami Beach 265 77.0 76.2 77.9Westinghouse 66 78.8 80.6 76.7Independence 119 84.0 81.5 87.0Silver Creek 169 84.0 81.7 86.8Valley 279 83.2 83.6 82.7Watsonville 294 86.7 85.0 88.8
Graduation cohort1996 441 84.1 84.3 83.91997 632 83.1 82.6 83.61998 691 81.3 83.3 79.0
Risk subgroupHigh risk 461 78.1 82.1 73.3 **Medium risk 877 82.3 80.5 84.5Low risk 426 88.3 90.4 85.7
GenderMale 773 78.1 77.3 79.1Female 991 86.2 88.1 83.9 *
EthnicityHispanic 972 83.1 84.0 82.1Black 523 79.9 82.2 77.1White 111 83.8 79.0 88.9Asian/Native American 124 86.3 84.5 88.7
Educational expectationsDoes not expect to graduate from college 614 82.6 81.8 83.5Graduate from college 671 82.4 83.8 80.6Attend higher level of school after college 448 82.8 84.8 80.7
(continued)

-12-
Exhibit 1.1 (continued)
SOURCE: MDRC calculations from the Career Academies Evaluation Four-Year Post-High School Follow-Up Survey Database.
NOTES: A chi-square test was used to evaluate differences between Academy and non-Academy response rates. Statistical significance levels are indicated as: *** = 1 percent; ** = 5 percent; * = 10 percent. The definition of risk subgroups involved identifying background characteristics that best predicted dropping out among students in the non-Academy group. High-risk students have an array of these characteristics associated with the highest likelihood of dropping out; low-risk students have an array of these characteristics associated with the lowest likelihood of dropping out; medium-risk students represent the remaining students with neither a particularly high nor particularly low likelihood of dropping out.

-13-
Career Academies Evaluation
Exhibit 1.2Differences Between Respondents' and Nonrespondents'
Background Characteristics
Non-Full Sample Respondents Respondents
Characteristic (%) (%) (%)
Demographic and family characteristics
GenderMale 43.8 41.4 55.2 ***Female 56.2 58.6 44.8
Age of student at time of application13 or younger 8.6 8.7 8.2 **14 35.6 36.7 30.515 46.1 45.8 47.216 or older 9.7 8.8 14.1
Race/ethnicityHispanic 56.2 56.7 53.9 0.0Black 30.2 29.3 34.5 0.0White 6.4 6.5 5.9 0.0Asian or Native American 7.2 7.5 5.6 0.0
Student speaks limited Englisha 7.6 7.6 7.3 0.0
Student lives withMother and father 61.7 63.3 54.3 **Mother only 28.6 27.9 31.8Father only 4.6 4.2 6.6Other family/nonrelative 5.1 4.6 7.3
Student lives in single-parent household 38.3 36.7 45.7 ***
Father's education levelDid not finish high school 39.8 40.5 36.1 0.0High school graduate/GED recipient 32.4 31.9 34.6Completed some post-secondary 15.1 15.5 13.5 0.0College graduate 12.7 12.0 15.9 0.0
Mother's education levelDid not finish high school 36.1 37.6 28.8 *High school graduate/GED recipient 34.8 34.2 37.9Completed some post-secondary 18.2 17.8 20.2College graduate 10.8 10.4 13.2
Neither parent has high school diploma 28.6 29.5 24.2 *
Parental workBoth parents work 47.3 48.6 41.3 ***Father works 23.8 23.3 25.9Mother works 17.8 18.0 16.8Neither parent works 11.1 10.0 16.1
(continued)

-14-
Exhibit 1.2 (continued)Non-
Full Sample Respondents RespondentsCharacteristic (%) (%) (%)
Family receives welfare or food stamps 24.2 23.6 27.6 0.0
Family mobility in past two yearsHave not moved 59.4 61.6 49.2 ***Moved 1 or 2 times 33.6 32.2 39.9Moved 3 or more times 7.0 6.2 10.9
Student is home alone more than 3 hours per day 13.5 13.4 14.3 0.0
Educational characteristics
8th-grade math test scoreb
75th percentile or higher 8.5 8.8 7.1 0.050th to 74th percentile 19.4 19.4 19.6 0.025th to 49th percentile 32.1 31.6 35.3 0.024th percentile or lower 40.0 40.3 38.0 0.0
8th-grade reading test scorec
75th percentile or higher 8.3 8.7 5.9 0.050th to 74th percentile 20.9 20.7 21.6 0.025th to 49th percentile 33.5 32.9 36.8 0.024th percentile or lower 37.4 37.7 35.7 0.0
Student does not feel safe at school 23.2 22.8 25.2 0.0
Frequency of cutting classesNever 78.9 79.8 74.7 *At least 1 time a week 19.7 19.0 23.0Daily 1.4 1.2 2.3
Sent to office for misbehavior Never 81.3 81.9 78.4 0.0
1-2 times 15.7 15.2 17.9 0.03-10 times 3.0 2.8 3.7 0.0
Educational expectationsDoes not expect to graduate from college 35.4 35.4 35.4 0.0Graduate from college 38.7 38.6 39.1 0.0
Attend higher level of school after college 25.9 25.9 25.5 0.0
Hours per week spent on homework1 hour or less 28.8 28.7 29.6 0.02-3 hours 38.2 38.0 39.1 0.04-6 hours 17.4 17.5 16.8 0.07 hours or more 15.6 15.8 14.5 0.0
Hours per day spent watching TVLess than an hour 12.3 12.0 13.5 0.01-2 hours 27.1 26.7 29.1 0.02-3 hours 26.8 27.3 24.3 0.0Over 3 hours 33.8 34.0 33.1 0.0
(continued)

-15-
Exhibit 1.2 (continued)
Non-Full Sample Respondents Respondents
Characteristic (%) (%) (%)
Student has worked for pay 36.3 35.7 39.1 0.0
Characteristics associated with dropping out of school
Attendance rate, year prior to random assignment96-100% 54.1 54.9 50.7 **91-95% 24.1 24.5 21.986-90% 11.0 10.6 12.685% or lower 10.8 10.0 14.9
Credits earned in 9th graded
5 or more credits 80.9 81.8 76.5 ***3-4 credits 13.7 14.0 12.42 or fewer credits 5.5 4.2 11.1
Grade point average in year of random assignmente
3.1 or higher 36.1 37.2 31.1 0.02.1-3.0 38.1 38.0 39.0 0.02.0 or lower 25.7 24.8 30.0 0.0
Student is overage for grade levelf 21.1 19.7 28.2 ***
Student transferred schools 2 or more times 27.4 25.1 38.2 ***
Student has sibling who dropped out of high school 20.2 20.0 20.7 0.0
Risk of dropping out of high schoolg
High risk 26.1 24.7 33.0 ***Medium risk 49.7 49.5 50.7Low risk 24.1 25.8 16.3
Sample size 1,764 1,458 306(continued)

-16-
Exhibit 1.2 (continued)SOURCES: MDRC calculations from the Career Academies Evaluation Student Baseline Questionnaire Database and Student School Records Database.
NOTES: All characteristics were measured at the time students applied to the Career Academy program and prior to being randomly selected to the Academy and non-Academy groups. Invalid or missing values are not included in individual variable distributions. Rounding may cause slight discrepancies in calculating of sums and differences. A chi-square test was applied to differences in the distribution of characteristics across the Academy and non-Academy groups. Statistical significance levels are indicated as: *** = 1 percent; ** = 5 percent; * = 10 percent. Double brackets [ ] indicate that the chi-square may not be a valid test. aThese are students who responded that they spoke English "not well" or "not at all." bSeveral different standardized, nationally normed math tests were administered to students, depending on the district where their school was located and the year they entered the study. National percentile scores were used because they were the only standardized scores available across tests. cSeveral different standardized, nationally normed reading tests were administered to students, depending on the district where their school was located and the year they entered the study. National percentile scores were used because they were the only standardized scores available across tests. dThis was applicable only to students who applied to the Career Academy at the end of their 9th-grade year. eGrade point averages were converted to a standard 4.0 scale from 100-point or 5-point scales for some sites. fA student is defined as overage for grade at the time of random assignment if she or he turns 15 before the start of the 9th grade, or 16 before the start of the 10th grade. This indicates that the student was likely to have been held back in a previous grade. gThe definition of risk subgroups involved identifying background characteristics that best predicted dropping out among students in the non-Academy group. High-risk students have an array of these characteristics associated with the highest likelihood of dropping out; low-risk students have an array of these characteristics associated with the lowest likelihood of dropping out; medium-risk students represent the remaining students with neither a particularly high nor particularly low likelihood of dropping out.

-17-
Career Academies Evaluation
Exhibit 1.3Differences Between Academy and Non-Academy Sample Members'
Background Characteristics
Academy Non-AcademyFull Sample Group Group
Characteristic (%) (%) (%)
Demographic and family characteristics
GenderMale 41.4 41.4 41.4 0.0Female 58.6 58.6 58.6 0.0
Age of student at time of application13 or younger 8.7 8.0 9.4 0.014 36.7 36.1 37.4 0.015 45.8 47.0 44.4 0.016 or older 8.8 8.9 8.7 0.0
Race/ethnicityHispanic 56.7 56.1 57.4 0.0Black 29.3 30.6 27.8 0.0White 6.5 5.7 7.5 0.0Asian or Native American 7.5 7.6 7.3 0.0
Student speaks limited Englisha 7.6 6.6 8.9 0.0
Student lives withMother and father 63.3 62.1 64.7 0.0Mother only 27.9 28.1 27.6 0.0Father only 4.2 4.7 3.4 0.0Other family/nonrelative 4.6 5.0 4.2 0.0
Student lives in single-parent household 36.7 37.9 35.3 0.0
Father's education levelDid not finish high school 40.5 39.2 42.2 0.0High school graduate/GED recipient 31.9 32.0 31.8 0.0Completed some post-secondary 15.5 15.5 15.5 0.0College graduate 12.0 13.3 10.5 0.0
Mother's education levelDid not finish high school 37.6 36.4 39.1 0.0High school graduate/GED recipient 34.2 34.2 34.2 0.0Completed some post-secondary 17.8 18.6 16.8 0.0College graduate 10.4 10.8 9.8 0.0
Neither parent has high school diploma 29.5 29.2 29.9 0.0
Parental workBoth parents work 48.6 47.8 49.7 0.0Father works 23.3 23.3 23.4 0.0Mother works 18.0 19.5 16.3 0.0Neither parent works 10.0 9.5 10.7 0.0
(continued)

-18-
Exhibit 1.3 (continued)Academy Non-Academy
Full Sample Group GroupCharacteristic (%) (%) (%)
Family receives welfare or food stamps 23.6 23.9 23.2 0.0
Family mobility in past two yearsHave not moved 61.6 60.5 62.9 0.0Moved 1 or 2 times 32.2 33.3 30.9 0.0Moved 3 or more times 6.2 6.1 6.2 0.0
Student is home alone more than 3 hours per day 13.4 13.5 13.2 0.0
Educational characteristics
8th-grade math test scoreb
75th percentile or higher 8.8 8.7 8.8 0.050th to 74th percentile 19.4 19.7 18.9 0.025th to 49th percentile 31.6 30.2 33.3 0.024th percentile or lower 40.3 41.4 39.0 0.0
8th-grade reading test scorec
75th percentile or higher 8.7 9.0 8.4 0.050th to 74th percentile 20.7 22.2 18.9 0.025th to 49th percentile 32.9 31.3 34.8 0.024th percentile or lower 37.7 37.5 37.9 0.0
Student does not feel safe at school 22.8 22.4 23.3 0.0
Frequency of cutting classesNever 79.8 80.3 79.3 0.0At least 1 time a week 19.0 19.0 19.0 0.0Daily 1.2 0.8 1.7 0.0
Sent to office for misbehavior Never 81.9 80.8 83.3 0.0
1-2 times 15.2 16.2 14.0 0.03-10 times 2.8 3.0 2.7 0.0
Educational expectationsDoes not expect to graduate from college 35.4 34.3 36.8 0.0Graduate from college 38.6 40.9 35.9 0.0
Attend higher level of school after college 25.9 24.8 27.2 0.0
Hours per week spent on homework1 hour or less 28.7 27.3 30.3 0.02-3 hours 38.0 39.8 35.9 0.04-6 hours 17.5 18.4 16.4 0.07 hours or more 15.8 14.5 17.3 0.0
Hours per day spent watching TVLess than an hour 12.0 11.1 13.1 0.01-2 hours 26.7 26.3 27.1 0.02-3 hours 27.3 26.0 29.0 0.0Over 3 hours 34.0 36.6 30.8 0.0
(continued)

-19-
Exhibit 1.3 (continued)
Academy Non-AcademyFull Sample Group Group
Characteristic (%) (%) (%)
Student has worked for pay 35.7 35.5 35.9 0.0
Characteristics associated with dropping out of school
Attendance rate, year prior to random assignment96-100% 54.9 53.2 56.9 0.091-95% 24.5 23.8 25.4 0.086-90% 10.6 12.1 8.9 0.085% or lower 10.0 10.8 8.9 0.0
Credits earned in 9th graded
5 or more credits 81.8 81.1 82.7 0.03-4 credits 14.0 14.7 13.12 or fewer credits 4.2 4.2 4.2 0.0
Grade point average in year of random assignmente
3.1 or higher 37.2 36.2 38.4 0.02.1-3.0 38.0 38.9 36.82.0 or lower 24.8 24.9 24.8 0.0
Student is overage for grade levelf 19.7 20.2 19.0 0.0
Student transferred schools 2 or more times 25.1 25.3 24.8 0.0
Student has sibling who dropped out of high school 20.0 19.6 20.6 0.0
Risk of dropping out of high schoolg
High risk 24.7 25.8 23.4 0.0Medium risk 49.5 48.2 51.1 0.0Low risk 25.8 26.0 25.5 0.0
Sample size 1,458 799 659(continued)

-20-
Exhibit 1.3 (continued)SOURCES: MDRC calculations from the Career Academies Evaluation Student Baseline Questionnaire Database and Student School Records Database.
NOTES: All characteristics were measured at the time students applied to the Career Academy program and prior to being randomly selected to the Academy and non-Academy groups. Invalid or missing values are not included in individual variable distributions. Rounding may cause slight discrepancies in calculating of sums and differences. A chi-square test was applied to differences in the distribution of characteristics across the Academy and non-Academy groups. Statistical significance levels are indicated as: *** = 1 percent; ** = 5 percent; * = 10 percent. Double brackets [ ] indicate that the chi-square may not be a valid test. aThese are students who responded that they spoke English "not well" or "not at all." bSeveral different standardized, nationally normed math tests were administered to students, depending on the district where their school was located and the year they entered the study. National percentile scores were used because they were the only standardized scores available across tests. cSeveral different standardized, nationally normed reading tests were administered to students, depending on the district where their school was located and the year they entered the study. National percentile scores were used because they were the only standardized scores available across tests. dThis was applicable only to students who applied to the Career Academy at the end of their 9th-grade year. eGrade point averages were converted to a standard 4.0 scale from 100-point or 5-point scales for some sites. fA student is defined as overage for grade at the time of random assignment if she or he turns 15 before the start of the 9th grade, or 16 before the start of the 10th grade. This indicates that the student was likely to have been held back in a previous grade. gThe definition of risk subgroups involved identifying background characteristics that best predicted dropping out among students in the non-Academy group. High-risk students have an array of these characteristics associated with the highest likelihood of dropping out; low-risk students have an array of these characteristics associated with the lowest likelihood of dropping out; medium-risk students represent the remaining students with neither a particularly high nor particularly low likelihood of dropping out.

Career Academies Evaluation
Exhibit 1.4Regression Coefficients for the Probability of Being in the Program Group
for the Full Study Sample and Risk Subgroups(Four-Year Post-High School Follow-Up Survey Sample, N = 1,458)
Full Study Sample High-Risk Subgroup Medium-Risk Subgroup Low-Risk SubgroupParameter Parameter Parameter Parameter
Estimate Estimate Estimate EstimateVariable (Standard Error) (Standard Error) (Standard Error) (Standard Error)
Intercept 0.257 #### -1.259 #### 0.614 #### 2.190 ####(0.429) #### (0.814) #### (0.688) #### (1.468) ####
Site 1 0.009 #### -0.125 #### 0.092 #### -0.047 ####(0.080) #### (0.157) #### (0.118) #### (0.183) ####
Site 2 0.007 #### 0.239 #### -0.057 #### -0.097 ####(0.089) #### (0.172) #### (0.132) #### (0.200) ####
Site 3 0.091 #### 0.522 #### 0.033 #### -0.044 ####(0.102) #### (0.412) #### (0.145) #### (0.232) ####
Site 4 -0.033 #### 0.117 #### -0.017 #### -0.099 ####(0.103) #### (0.186) #### (0.160) #### (0.315) ####
Site 5 -0.027 #### -0.029 #### -0.031 #### -0.069 ####(0.068) #### (0.112) #### (0.110) #### (0.165) ####
Site 6 -0.024 #### -0.050 #### 0.111 #### -0.228 *(0.061) #### (0.101) #### (0.102) #### (0.136)
Site 7 -0.005 #### -0.134 #### 0.137 * -0.105 ####(0.053) #### (0.099) #### (0.079) (0.118) ####
Site 8 0.024 #### 0.021 #### 0.079 #### -0.080 ####(0.055) #### (0.103) #### (0.090) #### (0.134) ####
Graduation cohort 1996 0.039 #### 0.034 #### 0.043 #### 0.025 ####(0.045) #### (0.091) #### (0.074) #### (0.095) ####
Graduation cohort 1997 0.021 #### -0.023 #### 0.032 #### 0.030 ####(0.037) #### (0.088) #### (0.053) #### (0.076) ####
In 8th grade at application to Academy 0.010 #### -0.005 #### 0.025 #### 0.344 ####(0.102) #### (0.212) #### (0.154) #### (0.290) ####
Female -0.012 #### 0.098 * -0.059 #### -0.009 ####(0.028) #### (0.058) (0.040) #### (0.057) ####
Age at application to Academy 0.036 #### 0.086 * 0.024 #### -0.007 ####(0.025) #### (0.049) (0.036) #### (0.053) ####
(continued)
-21-

-22-
Exhibit 1.4 (continued)
Full Study Sample High-Risk Subgroup Medium-Risk Subgroup Low-Risk SubgroupParameter Parameter Parameter Parameter
Estimate Estimate Estimate EstimateVariable (Standard Error) (Standard Error) (Standard Error) (Standard Error)
Hispanic 0.066 #### 0.175 #### -0.026 #### 0.172 ####(0.058) #### (0.129) #### (0.079) #### (0.130) ####
Black 0.098 #### 0.177 #### 0.051 #### 0.162 ####(0.076) #### (0.148) #### (0.110) #### (0.175) ####
Asian/Native American 0.100 #### 0.137 #### 0.046 #### 0.312 **(0.076) #### (0.154) #### (0.116) #### (0.158)
75th percentile or higher in 8th-grade matha -0.003 #### 0.049 #### 0.035 #### -0.114 ####(0.064) #### (0.221) #### (0.093) #### (0.109) ####
25th percentile or lower in 8th-grade math 0.039 #### 0.140 * 0.010 #### -0.045 ####(0.037) #### (0.072) (0.052) #### (0.081) ####
Missing 8th-grade math test score 0.167 #### 0.269 #### 0.094 #### -0.071 ####(0.154) #### (0.232) #### (0.299) #### (0.307) ####
75th percentile or higher in 8th-grade readingb 0.042 #### 0.050 #### 0.002 #### 0.140 ####(0.058) #### (0.163) #### (0.080) #### (0.106) ####
25th percentile or lower in 8th-grade reading -0.022 #### -0.041 #### -0.013 #### 0.008 ####(0.037) #### (0.071) #### (0.054) #### (0.080) ####
Missing 8th-grade reading percentile -0.195 #### -0.246 #### -0.093 #### -0.021 ####(0.157) #### (0.234) #### (0.304) #### (0.321) ####
Has sibling who dropped out -0.023 #### 0.003 #### -0.059 #### -0.268 ####(0.034) #### (0.058) #### (0.051) #### (0.171) ####
Is overage for grade levelc -0.023 #### -0.034 #### -0.064 #### 0.150 ####(0.043) #### (0.076) #### (0.062) #### (0.147) ####
Transferred schools 2 or more times 0.004 #### 0.017 #### 0.016 #### -0.086 ####(0.032) #### (0.059) #### (0.046) #### (0.109) ####
Attendance rate, year prior to random assignment -0.004 #### 0.003 #### -0.005 #### -0.019 *(0.002) #### (0.004) #### (0.004) #### (0.012)
Credits earned in 9th graded 0.001 #### 0.017 #### -0.005 #### 0.047 ####(0.010) #### (0.019) #### (0.018) #### (0.038) ####
Grade point average, year of random assignmente 0.010 #### -0.022 #### 0.038 #### -0.001 ####(0.018) #### (0.046) #### (0.030) #### (0.047) ####
(continued)

Exhibit 1.4 (continued)
Full Study Sample High-Risk Subgroup Medium-Risk Subgroup Low-Risk SubgroupParameter Parameter Parameter Parameter
Estimate Estimate Estimate EstimateVariable (Standard Error) (Standard Error) (Standard Error) (Standard Error)
Sample size 1458 360 722 376Degrees of freedom 28 28 28 28Mean of dependent variable 0.548 0.572 0.533 0.553R-square 0.010 0.083 0.025 0.054F-statistic 0.510 1.070 0.640 0.710p-value of F-statistic 0.984 0.367 0.929 0.864
SOURCE: MDRC calculations from the Career Academies Evaluation Post-High School Follow-Up Survey Database.
NOTES: The statistical significance of parameter estimates is indicated as *** = 1 percent, ** = 5 percent, * = 10 percent. The definition of risk subgroups involved identifying background characteristics that best predicted dropping out among students in the non-Academy group. High-risk students have an array of these characteristics associated with the highest likelihood of dropping out; low-risk students have an array of these characteristics associated with the lowest likelihood of dropping out; medium-risk students represent the remaining students with neither a particularly high nor particularly low likelihood of dropping out. aSeveral different standardized, nationally normed math tests were administered to students, depending on the district where their school was located and the year they entered the study. National percentile scores were used because they were the only standardized scores available across tests. bSeveral different standardized, nationally normed reading tests were administered to students, depending on the district where their school was located and the year they entered the study. National percentile scores were used because they were the only standardized scores available across tests. cA student is defined as overage for grade at the time of random assignment if she or he turns 15 before the start of the 9th grade, or 16 before the start of the 10th grade. This indicates that the student was likely to have been held back in a previous grade. d Credits earned in 9th grade applies only to students who applied to the Career Academy at the end of their 9th-grade year. eGrade point averages were converted to a standard 4.0 scale from 100-point or 5-point scales for some sites. A student is defined as overage for grade at the time of random assignment if she or he turns 15 before the start of the 9th grade, or 16 before the start of the 10th grade. This indicates that the student was likely to have been held back in a previous grade.
-23-

Career Academies Evaluation
Exhibit 1.5Regression Coefficients for the Probability of Being in the Program Group
for the Full Study Sample and Gender Subgroups(Four-Year Post-High School Follow-Up Survey Sample, N = 1,458)
Full Study Sample Young Men Young WomenParameter Parameter Parameter
Estimate Estimate EstimateVariable (Standard Error) (Standard Error) (Standard Error)
Intercept 0.257 #### 1.048 #### -0.345 ####(0.429) #### (0.688) #### (0.563) ####
Site 1 0.009 #### 0.075 #### -0.045 ####(0.080) #### (0.134) #### (0.101) ####
Site 2 0.007 #### 0.024 #### -0.017 ####(0.089) #### (0.151) #### (0.111) ####
Site 3 0.091 #### 0.061 #### 0.119 ####(0.102) #### (0.178) #### (0.126) ####
Site 4 -0.033 #### 0.012 #### -0.047 ####(0.103) #### (0.157) #### (0.144) ####
Site 5 -0.027 #### -0.072 #### -0.009 ####(0.068) #### (0.105) #### (0.091) ####
Site 6 -0.024 #### -0.117 #### 0.044 ####(0.061) #### (0.091) #### (0.086) ####
Site 7 -0.005 #### -0.080 #### 0.044 ####(0.053) #### (0.086) #### (0.070) ####
Site 8 0.024 #### -0.043 #### 0.086 ####(0.055) #### (0.089) #### (0.072) ####
Graduation cohort 1996 0.039 #### 0.089 #### 0.004 ####(0.045) #### (0.070) #### (0.060) ####
Graduation cohort 1997 0.021 #### 0.111 * -0.032 ####(0.037) #### (0.061) (0.047) ####
In 8th grade at application to Academy 0.010 #### 0.040 #### -0.021 ####(0.102) #### (0.173) #### (0.128) ####
Female -0.012 #### n/a n/a(0.028) #### n/a n/a
Age at application to Academy 0.036 #### -0.028 #### 0.078 **(0.025) #### (0.040) #### (0.033)
(continued)
-24-

-25-
Exhibit 1.5 (continued)
Full Study Sample Young Men Young WomenParameter Parameter Parameter
Estimate Estimate EstimateVariable (Standard Error) (Standard Error) (Standard Error)
Hispanic 0.066 #### -0.039 #### 0.197 **(0.058) #### (0.080) #### (0.087)
Black 0.098 #### -0.062 #### 0.282 ***(0.076) #### (0.110) #### (0.108)
Asian/Native American 0.100 #### 0.024 #### 0.192 *(0.076) #### (0.105) #### (0.114)
75th percentile or higher in 8th-grade matha -0.003 #### 0.066 #### -0.068 ####(0.064) #### (0.090) #### (0.093) ####
25th percentile or lower in 8th-grade math 0.039 #### 0.138 ** -0.032 ####(0.037) #### (0.059) (0.047) ####
Missing 8th-grade math test score 0.167 #### 0.469 #### 0.101 ####(0.154) #### (0.363) #### (0.172) ####
75th percentile or higher in 8th-grade readingb 0.042 #### -0.038 #### 0.107 ####(0.058) #### (0.087) #### (0.079) ####
25th percentile or lower in 8th-grade reading -0.022 #### -0.042 #### -0.005 ####(0.037) #### (0.059) #### (0.049) ####
Missing 8th-grade reading percentile -0.195 #### -0.491 #### -0.140 ####(0.157) #### (0.368) #### (0.175) ####
Has sibling who dropped out -0.023 #### -0.013 #### -0.026 ####(0.034) #### (0.056) #### (0.043) ####
Is overage for grade levelc -0.023 #### 0.042 #### -0.055 ####(0.043) #### (0.064) #### (0.058) ####
Transferred schools 2 or more times 0.004 #### -0.003 #### 0.009 ####(0.032) #### (0.049) #### (0.042) ####
Attendance rate, year prior to random assignment -0.004 #### -0.002 #### -0.005 *(0.002) #### (0.004) #### (0.003)
Credits earned in 9th graded 0.001 #### 0.015 #### -0.008 ####(0.010) #### (0.016) #### (0.014) ####
Grade point average, year of random assignmente 0.010 #### 0.010 #### 0.020 ####(0.018) #### (0.029) #### (0.024) ####
(continued) Contin

Exhibit 1.5 (continued)
Full Study Sample Young Men Young WomenParameter Parameter Parameter
Estimate Estimate EstimateVariable (Standard Error) (Standard Error) (Standard Error)
Sample size 1458 604 854Degrees of freedom 28 27 27Mean of dependent variable 0.548 0.548 0.548R-square 0.010 0.028 0.029F-statistic 0.510 0.610 0.910p-value of F-statistic 0.984 0.944 0.600
SOURCE: MDRC calculations from the Career Academies Evaluation Post-High School Follow-Up Survey Database.
NOTES: The statistical significance of parameter estimates is indicated as *** = 1 percent, ** = 5 percent, * = 10 percent. The definition of risk subgroups involved identifying background characteristics that best predicted dropping out among students in the non-Academy group. High-risk students have an array of these characteristics associated with the highest likelihood of dropping out; low-risk students have an array of these characteristics associated with the lowest likelihood of dropping out; medium-risk students represent the remaining students with neither a particularly high nor particularly low likelihood of dropping out. a Several different standardized, nationally normed math tests were administered to students, depending on the district where their school was located and the year they entered the study. National percentile scores were used because they were the only standardized scores available across tests. bSeveral different standardized, nationally normed reading tests were administered to students, depending on the district where their school was located and the year they entered the study. National percentile scores were used because they were the only standardized scores available across tests. cA student is defined as overage for grade at the time of random assignment if she or he turns 15 before the start of the 9th grade, or 16 before the start of the 10th grade. This indicates that the student was likely to have been held back in a previous grade. dCredits earned in 9th grade applies only to students who applied to the Career Academy at the end of their 9th-grade year. e Grade point averages were converted to a standard 4.0 scale from 100-point or 5-point scales for some sites.
-26-

Unit 2
Comparison of Academy Students and Non-Academy Students
with National Data

-28-
In an effort to provide further context for evaluating the performance of students in the study sample, the report compares outcomes for the non-Academy group with similar students identified within a nationally representative sample. For this comparison, the Career Academies Evaluation drew on data collected from a nationally representative sample of students in the National Education Longitudinal Study (NELS) of 1988 through 2000. This section describes the NELS dataset and explains how outcomes for use in this comparison were estimated.
NELS, which is sponsored by the U.S. Department of Education, followed a nationally representative sample of nearly 25,000 students from the 8th grade through the eighth year fol-lowing their scheduled graduation from high school. The first round of NELS surveys was ad-ministered to students in the 8th grade in 1988, and follow-up surveys were administered in 1990, 1992, 1994, and 2000. The study collected detailed demographic information as well as data on high school experiences and outcomes, post-secondary education, and employment. These data are publicly available through the National Center for Education Statistics.1
The goal of this analysis was to identify a group of students in the NELS sample who were similar to the students in the Career Academies Evaluation in the following ways: the types of high schools they attended, the type of educational programs in which they were en-rolled, and their individual background characteristics and school experiences prior to the 10th grade. Thus, only a subset of the full NELS sample was used in the analysis, and outcomes were adjusted to account for differences in measured background characteristics between the NELS and Career Academy samples. Following is an overview of the strategy and specific criteria used to identify such a comparison sample.
First, in order to maintain comparability with the schools in the Career Academies Evaluation, only NELS sample members from public, nonselective, comprehensive high schools located in urban school districts were included in the comparisons. The NELS variables specifying which were urban public schools were straightforward to interpret; however, in order to identify which high schools were comprehensive, it was necessary to rely on several different variables describing the types of schools that students attended. The following were excluded from the analysis: schools that never or rarely admitted students based on where they resided, schools that always admitted students based on admission tests or auditions, schools that always admitted students based on some other admission criteria, and students who were enrolled in special education programs for the physically and/or learning disabled.
1For data products and a publications list, see the National Center for Education Statistics Web site:
nces.ed.gov/surveys/nels88/.

-29-
Second, the analyses focused on three subsamples of students in the NELS database: (1) students who reported being enrolled in an academic-honors or college-preparatory program in their high school, (2) students who reported being enrolled in the high school’s general curricu-lum program, and (3) students who reported being enrolled in a career, technical, or vocational program. In general, Career Academies tend to be a mix of these three types of high school pro-grams or curriculum tracks, although they are less comparable to the academic-honors or col-lege-preparatory programs than to the other two types of programs. Also, based on information from student transcripts, it appears that non-Academy students in the study sample tended to be enrolled in their high school’s general curriculum program, and many of them took at least one career, vocational, or technical course.
Third, because virtually all the students in the non-Academy group completed the 9th grade, the analyses presented here focus on students in the NELS sample who were 10th-graders in 1990 (rather than on all students who were 8th-graders in 1988).
Once a comparison group was identified, a set of equivalent outcome measures was created. In general, the outcomes used by NELS were very similar to those measured in the Ca-reer Academies Evaluation. One significant difference, however, was that the NELS study fol-lowed students through eight years after their scheduled graduation from high school, whereas the Career Academies Evaluation Four-Year Post-High School Follow-Up Survey was adminis-tered 48 months following scheduled graduation.
In order to make the outcome measures comparable, the analysis focuses only on out-comes attained by students in the NELS sample through June 1996 — 48 months after sched-uled graduation. For example, any student who earned a high school credential after that point was considered a nongraduate for the purpose of the comparisons made in this report. Likewise, NELS data on post-secondary degree attainment also were truncated to cover the period through June 1996.
Finally, the outcomes for the NELS sample were regression-adjusted and mean-centered based on the distribution of background characteristics and prior school experiences among the non-Academy students in the Career Academies Evaluation sample. This means that the numbers presented from the NELS dataset in this report do not represent simple averages of outcomes for an subsample of NELS students. Rather, these adjustments allowed for a closer approximation of what the NELS outcome levels would have looked like if the NELS sample had a distribution of characteristics more like those in the Career Academies Evaluation sample.
By design, the measures of background characteristics collected by the Career Acad-emies Evaluation at the start of the study are very similar to those used by NELS. This is be-cause many of the questions used in the Career Academies Evaluation Baseline Questionnaire

-30-
were drawn from the NELS surveys.2 Following is a list of the characteristics — all measured at baseline — that were used in the estimation of outcomes for the NELS sample:
• Gender
• Ethnicity
• Lives in a single-parent household
• Has an older sibling who dropped out of high school
• Is overage for his or her grade
• Has parents who did not finish high school
• Has limited English proficiency
• Is unsupervised for three or more hours per day
• 6th- to 8th-grade English grades
• 6th- to 8th-grade math grades
• Baseline year’s attendance rate (8th grade in NELS; 8th or 9th grade in the Career Academies Evaluation)
Adjusting the NELS outcomes to reflect the distribution of background characteristics in the Career Academy Evaluation sample entailed three steps: (1) using multiple regression to identify the relationship between each outcome and the above characteristics, for the full sample of urban public school students and for each of the three curriculum subgroups, (2) calculating the mean for the Career Academy Evaluation sample on each of the above characteristics, and (3) multiplying the Career Academy sample’s means by the parameter estimates from each re-gression and adding them to each intercept.
All these estimates incorporate analysis weights calculated by NELS researchers to ac-count for both intentional oversampling of certain groups (for example, Hispanic students) as well as survey nonresponse (the 2000 survey achieved a 77 percent unweighted response rate, or an 83 percent weighted response rate).3 These weights were calculated for the full sample and
2James J. Kemple and JoAnn Leah Rock, Career Academies: Early Implementation Lessons from a 10-
Site Evaluation (New York: MDRC, 1996). 3See National Center for Education Statistics, National Education Longitudinal Study of 1988: Base-Year
to Fourth Follow-Up Data File User’s Manual (Washington, DC: U.S. Department of Education, Office of Educational Research and Improvement, National Center for Education Statistics, 2002), p. 128. See in particu-lar Chapter III: “Sample Design, Weighting, and Design Effects.”

-31-
may be less accurate when applied to smaller subgroups. Given that the sample sizes for the curriculum subgroups within urban, public, nonselective schools were well under 1,000 students each, one should be somewhat more skeptical of the individual estimates for these groups.
Exhibits 2.1 and 2.2 present the unadjusted NELS estimates of high school completion and post-secondary attainment rates, respectively. Exhibits 2.3 and 2.4 present the NELS esti-mates after they were adjusted to account for the distribution of characteristics represented in the Career Academies Evaluation sample as discussed above.
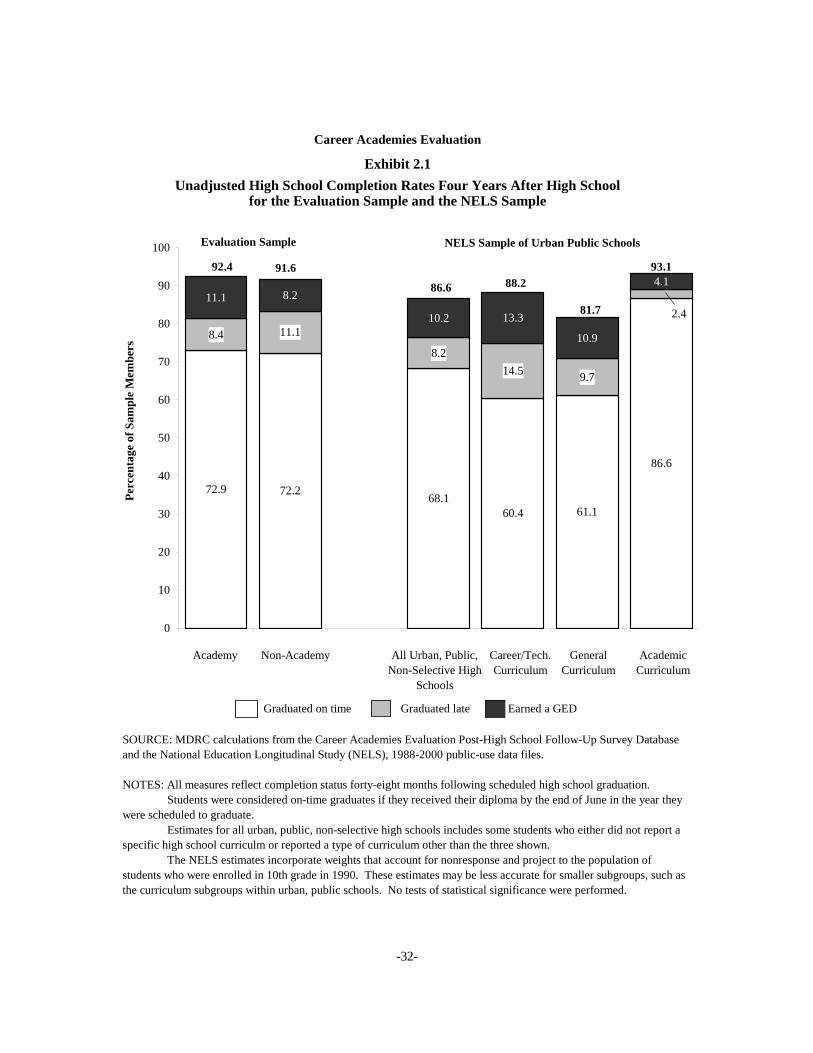
-32-
Career Academies Evaluation
Exhibit 2.1Unadjusted High School Completion Rates Four Years After High School
for the Evaluation Sample and the NELS Sample
92.4 91.6 93.1
86.6 88.2
81.7
72.9 72.268.1
60.4 61.1
86.6
8.4 11.1
8.214.5 9.7
11.1 8.2
10.2 13.3
10.9
4.1
2.4
0
10
20
30
40
50
60
70
80
90
100
Academy Non-Academy Urb-Pub:Actual
Voc:Actual Gen:Actual Aca:Actual
Graduated on time Graduated late Earned a GED
SOURCE: MDRC calculations from the Career Academies Evaluation Post-High School Follow-Up Survey Database and the National Education Longitudinal Study (NELS), 1988-2000 public-use data files.
NOTES: All measures reflect completion status forty-eight months following scheduled high school graduation. Students were considered on-time graduates if they received their diploma by the end of June in the year they were scheduled to graduate. Estimates for all urban, public, non-selective high schools includes some students who either did not report a specific high school curriculm or reported a type of curriculum other than the three shown. The NELS estimates incorporate weights that account for nonresponse and project to the population of students who were enrolled in 10th grade in 1990. These estimates may be less accurate for smaller subgroups, such as the curriculum subgroups within urban, public schools. No tests of statistical significance were performed.
Perc
enta
ge o
f Sam
ple
Mem
bers
Academy
NELS Sample of Urban Public SchoolsEvaluation Sample
All Urban, Public, Non-Selective High
Schools
Career/Tech.Curriculum
Non-Academy GeneralCurriculum
AcademicCurriculum

-33-
Career Academies Evaluation
Exhibit 2.2Unadjusted Degree Completion Rates Four Years After High School
for the Evaluation Sample and the NELS Sample
30.6
25.9 28.1 25.6 26.8
19.1
2.1 2.9 6.52.4 4.7
14.55.7 5.4
7.7
4.99.2
7.618.1 19.8 11.4
11.8
12.9
8.5
0
10
20
30
40
50
60
70
80
90
100
Academy Non-Academy Urb-Pub:Actual
Voc:Actual Gen:Actual Aca:Actual
Bachelor's Degree Associate's Degree Certificate/License
SOURCE: MDRC calculations from the Career Academies Evaluation Post-High School Follow-Up Survey Database and the National Education Longitudinal Study (NELS), 1988-2000 public-use data files.
NOTES: All measures reflect completion status forty-eight months following scheduled high school graduation. Only students who graduated from high school or earned a GED were given credit for completing post-secondary degrees. Estimates for all urban, public, non-selective high schools includes some students who either did not report a specific high school curriculm or reported a type of curriculum other than the three shown. The NELS estimates incorporate weights that account for nonresponse and project to the population of students who were enrolled in 10th grade in 1990. These estimates may be less accurate for smaller subgroups, such as the curriculum subgroups within urban, public schools. No tests of statistical significance were performed.
Perc
enta
ge o
f Sam
ple
Mem
bers
Academy
NELS Sample of Urban Public SchoolsEvaluation Sample
All Urban, Public, Non-Selective High
Schools
Career/Tech.Curriculum
Non-Academy GeneralCurriculum
AcademicCurriculum

-34-
Career Academies Evaluation
Exhibit 2.3Adjusted High School Completion Rates Four Years After High School
for the Evaluation Sample and the NELS Sample
88.2
72.9 72.264.5 63.3
48.6
80.4
8.4 11.1
10.119.5
12.6
11.1 8.2
7.8
10.3
11.8
3.9
1.6
0
10
20
30
40
50
60
70
80
90
100
Academy Non-Academy Urb-Pub:Est1 Voc:Est1 Gen:Est1 Aca:Est1
Graduated on time Graduated late Earned a GED
SOURCE: MDRC calculations from the Career Academies Evaluation Post-High School Follow-Up Survey Database and the National Education Longitudinal Study (NELS), 1988-2000 public-use data files.
NOTES: All measures reflect completion status forty-eight months following scheduled high school graduation. Students were considered on-time graduates if they received their diploma by the end of June in the year they were scheduled to graduate. Estimates for all urban, public, non-selective high schools includes some students who either did not report a specific high school curriculm or reported a type of curriculum other than the three shown. The NELS estimates incorporate weights that account for nonresponse and project to the population of students who were enrolled in 10th grade in 1990. These estimates may be less accurate for smaller subgroups, such as the curriculum subgroups within urban, public schools. In addition, the NELS estimates are adjusted to reflect a sample of students with the same distribution of background characteristics as the non-Academy evaluation sample. No tests of statistical significance were performed.
Perc
enta
ge o
f Sam
ple
Mem
bers
Academy
NELS Sample of Urban Public SchoolsEvaluation Sample
All Urban, Public, Non-Selective High
Schools
Career/Tech.Curriculum
Non-Academy GeneralCurriculum
AcademicCurriculum
82.485.9
93.1
73.0
92.4 91.6

-35-
Career Academies Evaluation
Exhibit 2.4Adjusted Degree Completion Rates Four Years After High School
for the Evaluation Sample and the NELS Sample
2.1 2.9 2.7 2.5 1.8 3.35.7 5.4 6.4 5.7 7.0 7.3
18.1 19.811.6
6.79.8
11.5
0
10
20
30
40
50
60
70
80
90
100
Academy Non-Academy Urb-Pub:Est1 Voc:Est1 Gen:Est1 Aca:Est1
Bachelor's Degree Associate's Degree Certificate/License
SOURCES: MDRC calculations from the Career Academies Evaluation Post-High School Follow-Up Survey Database and the National Education Longitudinal Study (NELS), 1988-2000 public-use data files.
NOTES: All measures reflect completion status 48 months following scheduled high school graduation. Only students who graduated from high school or earned a GED were given credit for completing post-secondary degrees. Estimates for all urban, public, non-selective high schools include some students who either did not report a specific high school curriculum or reported a type of curriculum other than the three shown. The NELS estimates incorporate weights that account for nonresponse and project to the population of students who were enrolled in 10th grade in 1990. These estimates may be less accurate for smaller subgroups, such as the curriculum subgroups within urban, public schools. In addition, the NELS estimates were adjusted to reflect a sample of students with the same distribution of background characteristics as the Non-Academy evaluation sample. No tests of statistical significance were performed.
Perc
enta
ge o
f Sam
ple
Mem
bers
Academy
NELS Sample of Urban Public SchoolsEvaluation Sample
All Urban, Public, Non-Selective High
Schools
Career/Tech.Curriculum
Non-Academy GeneralCurriculum
AcademicCurriculum
20.7
15.018.6
22.1
28.125.9


Unit 3
Impacts for the Full Study Sample

-38-
Career Academies Evaluation
Exhibit 3.1
Academy Non-Academy Percent Impact perOutcome Group Group Impact Change Enrollee
Years 1-4
Ever employed (%) 98.6 97.1 1.5 * 1.6 1.9Ever employed full-time1 (%) 95.2 92.5 2.7 ** 2.9 3.4Months employed 36.6 35.3 1.3 * 3.7 1.6Months employed full-time 29.5 27.5 2.0 ** 7.4 2.5Average monthly earnings ($) 1,145.59 1,038.66 106.94 ** 10.3 132.78Average weekly hours worked 30.0 28.1 1.9 ** 6.6 2.3Average hourly wage ($) 9.19 8.72 0.47 ** 5.4 0.58Total number of jobs held 3.1 3.1 0.0 0.0 0.8 0.0Average job duration, in months 16.1 15.8 0.3 0.0 1.9 0.4
Year 1
Ever employed (%) 85.2 82.5 2.7 0.0 3.3 3.4Ever employed full-time1 (%) 69.2 66.2 3.0 0.0 4.6 3.8Months employed 8.0 7.6 0.4 0.0 5.3 0.5Months employed full-time 5.9 5.6 0.3 0.0 6.1 0.4Average monthly earnings ($) 806.67 724.65 82.02 ** 11.3 101.84Average weekly hours worked 24.8 23.1 1.7 * 7.3 2.1Average hourly wage ($) 6.78 6.27 0.51 ** 8.2 0.63
Year 2
Ever employed (%) 90.7 90.0 0.8 0.0 0.9 1.0Ever employed full-time1 (%) 77.8 75.7 2.0 0.0 2.7 2.5Months employed 9.3 9.0 0.3 0.0 3.1 0.3Months employed full-time 7.3 6.9 0.4 0.0 6.4 0.5Average monthly earnings ($) 1,077.36 981.45 95.91 ** 9.8 119.08Average weekly hours worked 30.2 28.5 1.7 * 5.9 2.1Average hourly wage ($) 7.90 7.74 0.16 0.0 2.0 0.20
Year 3
Ever employed (%) 93.3 89.9 3.4 ** 3.8 4.2Ever employed full-time1 (%) 83.0 78.2 4.8 ** 6.2 6.0Months employed 9.5 9.3 0.3 0.0 2.9 0.3Months employed full-time 8.0 7.3 0.6 ** 8.5 0.8Average monthly earnings ($) 1,254.86 1,149.61 105.25 * 9.2 130.68Average weekly hours worked 32.1 30.2 1.9 * 6.4 2.4Average hourly wage ($) 8.93 8.36 0.57 ** 6.8 0.71
Sample size (N=1,458) 799 659(continued)
Year-by-Year Impacts on Employment and Earningsfor the Full Study Sample

-39-
Exhibit 3.1 (continued)
Academy Non-Academy Percent Impact perOutcome Group Group Impact Change Enrollee
Year 4
Ever employed (%) 91.8 90.8 1.1 0.0 1.2 1.3Ever employed full-time1 (%) 83.8 79.5 4.3 ** 5.4 5.3Months employed 9.8 9.4 0.4 0.0 3.7 0.4Months employed full-time 8.3 7.7 0.6 ** 8.1 0.8Average monthly earnings ($) 1,439.43 1,298.02 141.41 ** 10.9 175.58Average weekly hours worked 32.9 30.7 2.1 ** 6.9 2.6Average hourly wage ($) 9.85 9.39 0.45 * 4.8 0.56
Last Quarter
Ever employed (%) 85.0 82.2 2.9 0.0 3.5 3.5Ever employed full-time1 (%) 73.9 69.3 4.6 * 6.7 5.7Months employed 2.4 2.4 0.1 0.0 2.1 0.1Months employed full-time 2.1 2.0 0.1 0.0 6.1 0.1Average monthly earnings ($) 1,488.49 1,381.92 106.57 * 7.7 132.32Average weekly hours worked 32.7 31.2 1.5 0.0 4.8 1.9Average hourly wage ($) 9.60 9.03 0.57 * 6.3 0.71
Sample size (N=1,458) 799 659
SOURCE: MDRC calculations from the Career Academies Evaluation Four-Year Post-High School Follow-Up Survey Database.
NOTES: Measures reflect a 48-month period ending in June of 2000, 2001, or 2002: the fourth year following scheduled high school graduation for each sample member. Estimates are regression-adjusted using maximum likelihood estimation, controlling for background characteristics. Standard errors are adjusted to account for the clustering of students within schools and random assignment years. Rounding may cause slight discrepancies in calculating differences. A two-tailed t-test was applied to differences between the Academy and non-Academy groups. Statistical significance levels are indicated as: *** = 1 percent; ** = 5 percent; * = 10 percent. Percent change is the impact divided by the non-Academy group average. Impact per enrollee is defined as the impact divided by the difference in the percentage of Academy and non-Academy group members ever enrolled in a Career Academy. It is italicized because its calculation does not involve a direct comparison of Academy and non-Academy students. See Exhibit 3.6 for the percentage of the Academy and the non-Academy group ever enrolled in a Career Academy. Respondents directly reported hours worked per week, weeks worked per month, and hourly wages. Earnings were calculated for each month by multiplying the wage by the hours worked times the number of weeks worked in that month. The maximum number of weeks in each month was capped at 4. Respondents reported their ending or most recent wages and hours worked for each job. This rate was assumed to apply to the entire duration of the job. Thus, if wages or hours were lower at the beginning of each job, these measures may overestimate true average wages and earnings. For respondents who were never employed during a given month, earnings, hours, and wages are included in these averages as zeros. 1Students were considered employed full-time if they reported working 30 or more hours per week.

-40-
Career Academies Evaluation
Exhibit 3.2Month-by-Month Impacts on Total Monthly Earnings
for the Full Study Sample
-200
0
200
400
600
800
1,000
1,200
1,400
1,600
1,800
2,000
1 3 5 7 9 11 13 15 17 19 21 23 25 27 29 31 33 35 37 39 41 43 45 47
Months After Scheduled High School Graduation
Mon
thly
Ear
ning
s ($)
Impacts Academy Group Non-Academy Group
SOURCE: MDRC calculations from the Career Academies Evaluation Four-Year Post-High School Follow-Up Survey Database.
NOTES: Measures reflect a 48-month period ending in June of 2000, 2001, or 2002: the fourth year following scheduled high school graduation for each sample member. Estimates are regression-adjusted using maximum likelihood estimation, controlling for background characteristics. Standard errors are adjusted to account for the clustering of students within schools and random assignment years. A two-tailed t-test was applied to differences between the Academy and non-Academy groups. Differences in monthly earnings are significant at the .10 level or lower in 37 out of the 48 months studied. Respondents directly reported hours worked per week, weeks worked per month, and hourly wages. Earnings were calculated for each month by multiplying the wage by the hours worked times the number of weeks worked in that month. The maximum number of weeks in each month was capped at 4. Respondents reported their ending wage at each job, and this rate was assumed to apply to the entire duration of the job. Thus, if wages or hours were lower at the beginning of each job, these measures may overestimate true average earnings. For respondents who were never employed during a given month, earnings are included in these averages as zeros.
Impacts

-41-
Career Academies Evaluation
Exhibit 3.3
Academy Non-Academy Percent Impact perOutcome (%) Group Group Impact Change Enrollee
Average monthly earnings$0 - $824 35.1 38.3 -3.2 0.0 -8.3 -3.9$825 - $1,237 25.7 28.8 -3.1 0.0 -10.8 -3.9$1,238 - $1,442 11.5 8.6 2.9 * 33.5 3.6$1,443 - $1,648 7.7 7.3 0.4 0.0 5.2 0.5$1,649 or more 18.8 14.2 4.6 ** 32.4 5.7
Average weekly hours worked0 - 10 7.9 8.4 -0.5 0.0 -5.4 -0.610 - 25 26.2 28.1 -1.9 0.0 -6.8 -2.426 - 35 27.2 29.9 -2.7 0.0 -9.0 -3.336 - 45 27.4 23.7 3.7 0.0 15.5 4.646 or more 10.1 7.1 3.0 * 42.7 3.8
Average hourly wage1
$0 - $5.15 (MW) 2.7 2.1 0.6 0.0 30.5 0.8$5.16 - $7.73 (1.5xMW) 32.0 32.8 -0.8 0.0 -2.3 -1.0$7.74 - $9.01 (1.75xMW) 22.5 24.9 -2.3 0.0 -9.4 -2.9$9.02 - $10.30 (2.0xMW) 15.1 16.0 -1.0 0.0 -6.0 -1.2$10.31 or more 26.4 21.5 5.0 ** 23.2 6.2
Sample size (N=1,458) 799 659
Impacts on the Distribution of Earnings, Hours Worked, and Wagesfor the Full Study Sample
SOURCE: MDRC calculations from the Career Academies Evaluation Four-Year Post-High School Follow-Up Survey Database.
NOTES: Measures reflect a 48-month period ending in June of 2000, 2001, or 2002: the fourth year following scheduled high school graduation for each sample member. Estimates are regression-adjusted using ordinary least squares, controlling for background characteristics. Rounding may cause slight discrepancies in calculating differences and sums. A two-tailed t-test was applied to differences between the Academy and non-Academy groups. Statistical significance levels are indicated as: *** = 1 percent; ** = 5 percent; * = 10 percent. Percent change is the impact divided by the non-Academy group average. Impact per enrollee is defined as the impact divided by the difference in the percentage of Academy and non-Academy group members ever enrolled in a Career Academy. It is italicized because its calculation does not involve a direct comparison of Academy and non-Academy students. For respondents who were never employed during a given month, earnings, hours, and wages are included in these distributions as zeros. Respondents directly reported hours worked per week, weeks worked per month, and hourly wages. Earnings were calculated for each month by multiplying the wage by the hours worked times the number of weeks worked in that month. The maximum number of weeks in each month was capped at 4. Respondents reported their ending or most recent wages and hours worked for each job. This rate was assumed to apply to the entire duration of the job. Thus, if wages or hours were lower at the beginning of each job, these measures may overestimate true average wages and earnings. 1The upper end of the categories of average hourly wage was set as a multiple of the minimum wage (MW), which from 1997-2003 was $5.15 per hour.
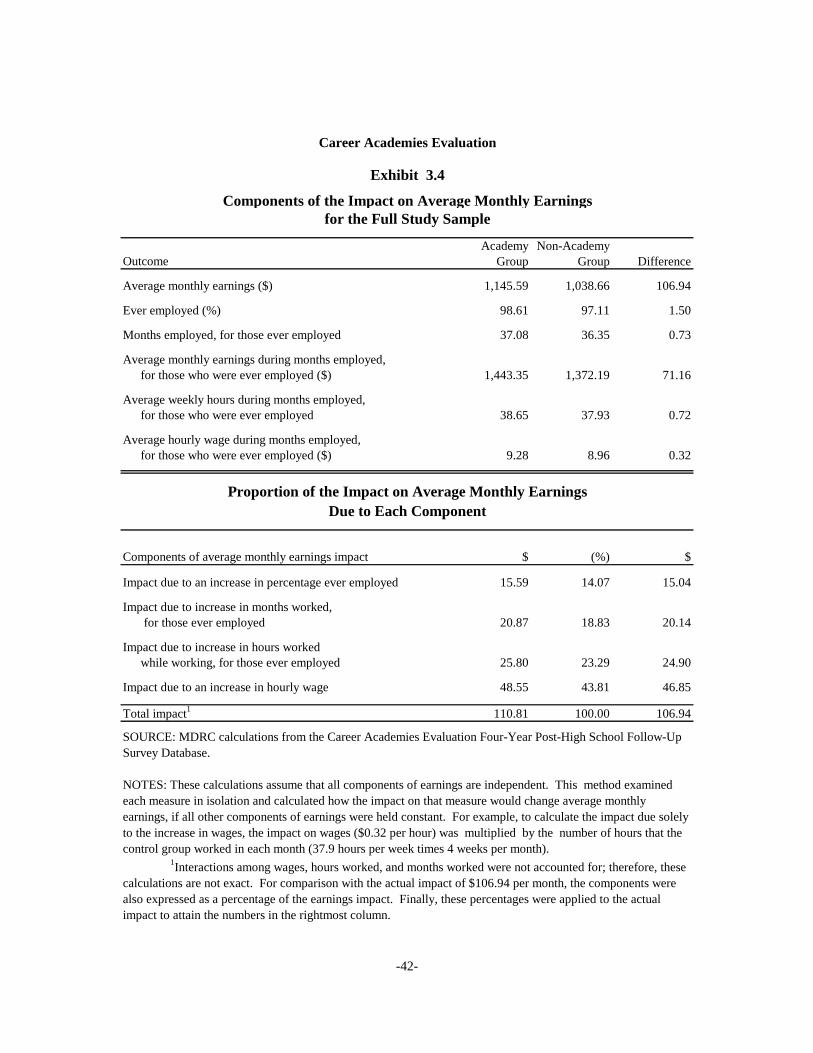
-42-
Career Academies Evaluation
Exhibit 3.4
Components of the Impact on Average Monthly Earningsfor the Full Study Sample
Academy Non-AcademyOutcome Group Group Difference
Average monthly earnings ($) 1,145.59 1,038.66 106.94
Ever employed (%) 98.61 97.11 1.50
Months employed, for those ever employed 37.08 36.35 0.73
Average monthly earnings during months employed,for those who were ever employed ($) 1,443.35 1,372.19 71.16
Average weekly hours during months employed,for those who were ever employed 38.65 37.93 0.72
Average hourly wage during months employed,for those who were ever employed ($) 9.28 8.96 0.32
Proportion of the Impact on Average Monthly EarningsDue to Each Component
Components of average monthly earnings impact $ (%) $
Impact due to an increase in percentage ever employed 15.59 14.07 15.04
Impact due to increase in months worked, for those ever employed 20.87 18.83 20.14
Impact due to increase in hours workedwhile working, for those ever employed 25.80 23.29 24.90
Impact due to an increase in hourly wage 48.55 43.81 46.85
Total impact1 110.81 100.00 106.94
SOURCE: MDRC calculations from the Career Academies Evaluation Four-Year Post-High School Follow-Up Survey Database.
NOTES: These calculations assume that all components of earnings are independent. This method examined each measure in isolation and calculated how the impact on that measure would change average monthly earnings, if all other components of earnings were held constant. For example, to calculate the impact due solely to the increase in wages, the impact on wages ($0.32 per hour) was multiplied by the number of hours that the control group worked in each month (37.9 hours per week times 4 weeks per month). 1Interactions among wages, hours worked, and months worked were not accounted for; therefore, these calculations are not exact. For comparison with the actual impact of $106.94 per month, the components were also expressed as a percentage of the earnings impact. Finally, these percentages were applied to the actual impact to attain the numbers in the rightmost column.

-43-
Career Academies Evaluation
Exhibit 3.5
for the Full Study Sample
Academy Non-AcademyOutcome Group Group Difference
Job duration in months 18.0 17.9 0.2 0.0
Month last worked (relative) 46.2 46.1 0.1 0.0
Managerial/supervisory position (%) 8.6 7.2 1.4 0.0
Occupational group (%) 1
Management/professional 24.7 23.3 1.4 0.0Food service and personal service 10.7 9.9 0.8 0.0Sales and related 15.7 14.0 1.7 0.0Office and administrative support 29.8 33.1 -3.3 0.0Construction, production, repair, military 18.8 19.5 -0.7 0.0
Average monthly earnings 2 ($) 1,529.99 1,455.91 74.08 *At start of job 1,385.54 1,315.21 70.34 0.00At end of job 1,706.85 1,633.07 73.78 0.00Difference 321.55 318.54 3.01 0.00
Average hours per week 37.0 36.1 0.9 0.00At start of job 35.9 35.3 0.6 0.0At end of job 38.5 37.4 1.1 *Difference 2.6 2.1 0.5 0.0
Average hourly wage ($) 10.32 9.96 0.36 0.00At start of job 9.68 9.26 0.43 0.00At end of job 11.04 10.82 0.23 0.00Difference 1.35 1.56 -0.21 0.00
Job offers full benefits 3 (%) 43.3 40.6 2.7 0.0Health plan 59.8 59.8 0.0 0.0Sick leave 57.8 54.4 3.4 0.0Paid vacation days 59.0 56.4 2.6 0.0Retirement plan 46.2 44.7 1.5 0.0
Uses/used a computer at this job (%) 71.6 68.8 2.8 0.0
Often/always performed physically demanding tasks 27.4 29.7 -2.3 0.0
Very satisfied at job (%) 48.6 46.2 2.4 0.0
Very likely to be promoted in the next year 4 (%) 43.7 36.8 6.9 **
Job is/was directly related to high school (%) 27.3 21.9 5.4 **
Sample size (N=1,423) 786 637(continued)
Differences in Characteristics of the Most Recent Job Heldfor Those Who Were Employed in the Last Quarter

-44-
Exhibit 3.5 (continued)SOURCE: MDRC calculations from the Career Academies Evaluation Four-Year Post-High School Follow-Up Survey Database.
NOTES: All measures apply to jobs held in the last three months of the 48-month follow-up period ending in June of 2000, 2001, or 2002: the fourth year following scheduled high school graduation for each sample member. Estimates are regression-adjusted using ordinary least squares, controlling for background characteristics. Rounding may cause slight discrepancies in calculating differences and sums. A two-tailed t-test was applied to differences between the Academy and non-Academy groups. Statistical significance levels are indicated as: *** = 1 percent; ** = 5 percent; * = 10 percent. Measures are italicized because they refer only to those students who were employed during the last three months of the follow-up period, and thus do not represent a direct experimental comparison of Academy and non-Academy students. 1Occupational groups are based on the U.S. Department of Labor's Standard Occupational Classification (SOC) system. 2Respondents directly reported hours worked per week, weeks worked per month, and hourly wages. Earnings were calculated for each month by multiplying the wage by the hours worked times the number of weeks worked in that month. The maximum number of weeks in each month was capped at 4. 3Full benefits include health plan, sick leave, paid vacation days, and retirement plan. 4Likelihood of being promoted was only asked of those who were employed at the time of the interview (n=1,224).

-45-
Career Academies Evaluation
Exhibit 3.6
Academy Non-Academy Percent Impact perOutcome Group Group Impact Change Enrollee
Ever enrolled in a Career Academyduring high school (%) 86.8 6.3 80.5 *** -- --
Was enrolled in a Career Academyat the end of scheduled grade 12 (%) 53.1 4.1 49.0 *** -- --
High school completion status (%)
Earned high school diploma or GED 92.3 91.5 0.8 0.0 0.9 1.0
Earned high school diploma 81.3 83.3 -2.0 0.0 -2.4 -2.5On-time graduate1 72.9 72.2 0.7 0.0 0.9 0.8Late graduate 8.4 11.1 -2.7 * -24.3 -3.3
Earned a GED 11.1 8.2 2.9 * 34.7 3.6
Post-secondary education enrollment2 (%)
Ever enrolled in post-secondary education 79.0 80.1 -1.1 0.0 -1.3 -1.3
Highest post-secondary education enrollmentFour-year college 25.8 25.1 0.7 0.0 2.9 0.9Two-year college 38.1 37.7 0.4 0.0 1.0 0.5Skills training, technical or trade school 15.3 17.3 -2.0 0.0 -11.6 -2.5
Months enrolled in post-secondary education 21.3 21.7 -0.3 0.0 -1.6 -0.4
Highest credential completed or in progress3 (%)
Any post-secondary credential 55.5 56.7 -1.2 0.0 -2.0 -1.4Completed 26.0 28.2 -2.2 0.0 -7.7 -2.7In progress 29.6 28.5 1.1 0.0 3.8 1.4
Bachelor's degree 16.3 17.5 -1.1 0.0 -6.5 -1.4Completed 2.1 2.9 -0.8 0.0 -26.9 -1.0In progress 14.2 14.6 -0.4 0.0 -2.4 -0.4
Associate's degree 18.7 17.1 1.7 0.0 9.7 2.1Completed 5.7 5.4 0.2 0.0 4.4 0.3In progress 13.0 11.6 1.4 0.0 12.1 1.8
Skills training certificate or license 20.5 22.2 -1.7 0.0 -7.5 -2.1Completed 18.1 19.8 -1.7 0.0 -8.5 -2.1In progress 2.5 2.4 0.1 0.0 2.3 0.1
Years of schooling completed4 12.6 12.7 0.0 0.0 -0.2 0.0
Sample size (N=1,458) 799 659(continued)
Impacts on Educational Attainment for the Full Study Sample

-46-
Exhibit 3.6 (continued)
SOURCE: MDRC calculations from the Career Academies Evaluation Four-Year Post-High School Follow-Up Survey Database. NOTES: Unless otherwise indicated, statuses reflect a 48-month period ending in June of 2000, 2001, or 2002: the fourth year following scheduled high school graduation for each sample member. Estimates are regression-adjusted using maximum likelihood estimation, controlling for background characteristics. Standard errors are adjusted to account for the clustering of students within schools and random assignment years. Rounding may cause slight discrepancies in calculating sums and differences. A two-tailed t-test was applied to differences between the Academy and non-Academy groups. Statistical significance levels are indicated as: *** = 1 percent; ** = 5 percent; * = 10 percent. Percent change is the impact divided by the non-Academy group average. Impact per enrollee is defined as the impact divided by the difference in the percentage of Academy and non-Academy group members ever enrolled in a Career Academy. It is italicized because its calculation does not involve a direct comparison of Academy and non-Academy students. 1Students were considered on-time graduates if they graduated in June or earlier of the year they were scheduled to graduate. 2Students must have earned a high school diploma or GED to be considered enrolled in a post-secondary education program. 3A credential was considered "in progress" if the student reported attempting it in a program that he/she was currently attending (within three months of the end of the follow-up period) and expected to complete. 4Years of school completed was calculated by assigning 12 years to a completed high school diploma or GED, 14 years to an associate's or 16 years to a completed bachelor's degree. For those who did not complete an associate's or a bachelor's degree, years of school completed was calculated as 12 plus the percentage of the degree completed through the end of the follow-up period. For those who did not complete a high school diploma or a GED, years of school completed was calculated as a percentage of the 12 years given for a completed high school diploma or a GED.

-47-
Career Academies Evaluation
Exhibit 3.7
Academy Non-AcademyOutcome Group Group Difference
Duration of attendance in months 20.3 21.4 -1.1 0.0Month of last attendance (relative to scheduled high school graduation) 37.2 37.8 -0.6 0.0Hours per week in class 19.2 18.4 0.8 0.0School considered student full-time (%) 69.7 66.3 3.4 0.0Took basic reading/math class (%) 36.3 32.9 3.5 0.0
Credential earned or attempted (%)Bachelor's degree 24.4 25.6 -1.2 0.0Associate's degree 36.2 35.5 0.8 0.0Certificate or license 24.4 25.6 -1.2 0.0High school diploma or GED 4.7 4.0 0.6 0.0No credential 10.5 9.2 1.3 0.0
Financial resources 1 (%)Bank or government loans 21.6 22.5 -0.9 0.0Scholarships and grants 42.7 42.7 0.0 0.0Work-study programs 2.6 2.8 -0.2 0.0Personal savings 11.2 10.2 1.1 0.0Family 13.5 14.7 -1.2 0.0Employment while attending school 42.3 39.0 3.3 0.0Financial aid from employer 7.3 7.0 0.3 0.0
Completed program (%) 27.5 30.6 -3.0 0.0Still enrolled (%) 41.9 39.6 2.2 0.0Left program without completing it (%) 30.6 29.8 0.8 0.0
Primary reason for leaving, for those who left 2 (%)School-related reason 12.7 11.9 0.8 0.0Personal reason 30.2 27.9 2.3 0.0Financial/employment reason 47.6 48.0 -0.4 0.0Other reason 9.4 12.2 -2.8 0.0
Sample size (N=1,208) 659 549(continued)
Characteristics of the Most Recent Educational Program Attendedfor Those Who Ever Enrolled in Any Program

-48-
Exhibit 3.7 (continued)SOURCE: MDRC calculations from the Career Academies Evaluation Four-Year Post-High School Follow-Up Survey Database.
NOTES: Measures reflect a 48-month period ending in June of 2000, 2001, or 2002: the fourth year following scheduled high school graduation for each sample member. Estimates are regression-adjusted using ordinary least squares, controlling for background characteristics. Rounding may cause slight discrepancies in calculating differences. A two-tailed t-test was applied to differences between the Academy and non-Academy groups. Statistical significance levels are indicated as: *** = 1 percent; ** = 5 percent; * = 10 percent. Measures are italicized because they refer only to those students who ever attended a post-secondary education program, and thus do not represent a direct experimental comparison of Academy and non-Academy students. 1Individuals were asked how the education programs they attended were financed. Because the categories they reported are not mutually exclusive, these percentages do not add up to 100 percent. 2Only students who left the program without completing it were asked about their reason for leaving (n=364).

-49-
Career Academies Evaluation
Exhibit 3.8Year-by-Year Impacts on Months Spent Attending School or Working
for the Full Study Sample
4.0 4.34.8
5.5
3.7
3.93.9
1.8
1.01.0
5.85.2
4.54.3
3.7
4.84.7
4.44.5
1.9
1.41.5
1.1 1.3
0
1
2
3
4
5
6
7
8
9
10
11
12
AcademyGroup
Non-Academy
Group
AcademyGroup
Non-Academy
Group
AcademyGroup
Non-Academy
Group
AcademyGroup
Non-Academy
Group
Attending school only
Working and attending school
Working only
SOURCE: MDRC calculations from the Career Academies Evaluation Four-Year Post-High School Follow-Up Survey Database.
NOTES: All measures reflect the average number of months spent in each status during each year of the 48-month follow-up period ending in June of 2000, 2001, or 2002: the fourth year following scheduled high school graduation for each sample member. Estimates are regression-adjusted using maximum likelihood estimation, controlling for background characteristics. Standard errors are adjusted to account for the clustering of students within schools and random assignment years. Rounding may cause slight discrepancies in calculating sums and differences. A two-tailed t-test was applied to differences between the Academy and non-Academy groups. The difference between total months in any activity in year 4 was significant at .1 or lower.
Num
ber
of M
onth
s
9.5
Year 1 Year 2 Year 3 Year 4
10.6 10.5 10.6 10.5 10.7
9.8
10.4

-50-
Career Academies Evaluation
Exhibit 3.9
Academy Non-Academy Percent Impact perOutcome (%) Group Group Impact Change Enrollee
Is a parent 36.8 35.2 1.7 0.0 4.8 2.1
Is a custodial single parent 19.0 17.3 1.8 0.0 10.2 2.2
Marital Status Married 19.8 19.3 0.5 0.0 2.5 0.6Single 77.0 78.3 -1.3 0.0 -1.6 -1.6Divorced, separated, or widowed 3.2 2.3 0.8 0.0 35.2 1.0
Lives with parent(s) or guardian(s) 48.2 52.3 -4.1 0.0 -7.8 -5.0
Ever gone without health insurance in past year 27.1 31.3 -4.2 * -13.3 -5.2
Received TANF or cash assistance in past year 7.2 5.9 1.3 0.0 22.0 1.6
Received food stamps in the past year 9.8 8.0 1.8 0.0 22.2 2.2
Registered to vote 66.3 64.7 1.6 0.0 2.5 2.0
Any recent illegal or drug-related activity1 6.7 6.2 0.6 0.0 9.1 0.7
Sample size (N=1,458) 799 659
Impacts on Family Formation, Public Assistance, and Behaviorsfor the Full Study Sample
SOURCE: MDRC calculations from the Career Academies Evaluation Four-Year Post-High School Follow-Up Survey Database.
NOTES: Unless otherwise indicated, statuses were reported for the end of a 48-month period ending in June of 2000, 2002, or 2002: the fourth year following scheduled high school graduation. Estimates are regression-adjusted using maximum likelihood estimation, controlling for background characteristics. Standard errors are adjusted to account for the clustering of students within schools and random assignment years. Rounding may cause slight discrepancies in calculating differences. A two-tailed t-test was applied to differences between the Academy and non-Academy groups. Statistical significance levels are indicated as: *** = 1 percent; ** = 5 percent; * = 10 percent. Percent change is the impact divided by the non-Academy group average. Impact per enrollee is defined as the impact divided by the difference in the percentage of Academy and non-Academy group members ever enrolled in a Career Academy. It is italicized because its calculation does not involve a direct comparison of Academy and non-Academy students. See Exhibit 3.6. 1This measure includes illegal drug use in the past 2 weeks, breaking the law (other than traffic violations) in the past 2 weeks, current gang membership, and any arrests or convictions in the past year.

Unit 4
Impacts for Gender Subgroups

-52-
Career Academies Evaluation
Exhibit 4.1-YM
Academy Non-Academy Percent Impact perOutcome Group Group Impact Change Enrollee
Years 1-4
Ever employed (%) 99.5 96.2 3.4 *** 3.5 4.0Ever employed full-time1 (%) 96.8 92.1 4.7 ** 5.2 5.7Months employed 38.8 36.0 2.8 ** 7.9 3.4Months employed full-time 32.8 28.4 4.4 *** 15.5 5.3Average monthly earnings ($) 1,373.00 1,161.07 211.93 ** 18.3 254.05Average weekly hours worked 34.2 30.0 4.2 *** 14.0 5.0Average hourly wage ($) 9.75 9.01 0.74 ** 8.2 0.89Total number of jobs held 3.2 3.2 0.0 0.0 1.1 0.0Average job duration, in months 16.9 16.1 0.9 0.0 5.3 1.0
Year 1
Ever employed (%) 88.6 84.0 4.6 0.0 5.5 5.5Ever employed full-time1 (%) 77.2 68.7 8.5 ** 12.4 10.2Months employed 8.6 7.8 0.8 ** 10.2 1.0Months employed full-time 6.9 5.8 1.1 ** 19.8 1.4Average monthly earnings ($) 995.77 789.86 205.91 *** 26.1 246.84Average weekly hours worked 28.7 24.5 4.2 ** 17.0 5.0Average hourly wage ($) 7.50 6.64 0.87 ** 13.1 1.04
Year 2
Ever employed (%) 93.9 89.5 4.4 * 4.9 5.3Ever employed full-time1 (%) 82.8 76.4 6.4 * 8.4 7.7Months employed 10.0 9.1 0.9 ** 9.9 1.1Months employed full-time 8.3 7.1 1.2 *** 16.4 1.4Average monthly earnings ($) 1,294.36 1,092.53 201.83 ** 18.5 241.94Average weekly hours worked 34.7 30.4 4.3 ** 14.1 5.1Average hourly wage ($) 8.62 8.23 0.39 0.0 4.8 0.47
Year 3
Ever employed (%) 96.8 90.3 6.6 *** 7.3 7.9Ever employed full-time1 (%) 87.5 75.7 11.8 *** 15.6 14.1Months employed 10.0 9.6 0.4 0.0 4.5 0.5Months employed full-time 8.6 7.7 0.9 ** 11.3 1.0Average monthly earnings ($) 1,488.36 1,322.22 166.13 0.0 12.6 199.15Average weekly hours worked 36.4 32.6 3.8 ** 11.5 4.5Average hourly wage ($) 9.65 8.85 0.80 ** 9.1 0.96
Sample size (N=604) 331 273(continued)
Year-by-Year Impacts on Employment and Earningsfor Young Men

-53-
Exhibit 4.1-YM (continued)
Academy Non-Academy Percent Impact perOutcome Group Group Impact Change Enrollee
Year 4
Ever employed (%) 93.9 90.3 3.6 0.0 3.9 4.3Ever employed full-time1 (%) 87.3 80.5 6.8 ** 8.4 8.1Months employed 10.1 9.5 0.7 ** 7.0 0.8Months employed full-time 9.0 7.8 1.2 *** 15.3 1.4Average monthly earnings ($) 1,718.55 1,450.48 268.08 ** 18.5 321.36Average weekly hours worked 37.1 32.5 4.6 ** 14.1 5.5Average hourly wage ($) 10.72 9.93 0.78 0.0 7.9 0.94
Last Quarter
Ever employed (%) 87.5 84.3 3.3 0.0 3.9 3.9Ever employed full-time1 (%) 78.7 71.3 7.4 ** 10.4 8.9Months employed 2.5 2.5 0.1 0.0 3.3 0.1Months employed full-time 2.3 2.0 0.2 ** 10.9 0.3Average monthly earnings ($) 1,782.16 1,567.09 215.07 * 13.7 257.82Average weekly hours worked 37.0 33.3 3.7 ** 11.2 4.5Average hourly wage ($) 10.53 9.84 0.68 0.0 7.0 0.82
Sample size (N=604) 331 273
SOURCE: MDRC calculations from the Career Academies Evaluation Four-Year Post-High School Follow-Up Survey Database.
NOTES: Measures reflect a 48-month period ending in June of 2000, 2001, or 2002: the fourth year following scheduled high school graduation for each sample member. Estimates are regression-adjusted using maximum likelihood estimation, controlling for background characteristics. Standard errors are adjusted to account for the clustering of students within schools and random assignment years. Rounding may cause slight discrepancies in calculating differences. A two-tailed t-test was applied to differences between the Academy and non-Academy groups. Statistical significance levels are indicated as: *** = 1 percent; ** = 5 percent; * = 10 percent. Percent change is the impact divided by the non-Academy group average. Impact per enrollee is defined as the impact divided by the difference in the percentage of Academy and non-Academy group members ever enrolled in a Career Academy. It is italicized because its calculation does not involve a direct comparison of Academy and non-Academy students. See Exhibit 3.6 for the percentage of the Academy and the non-Academy group ever enrolled in a Career Academy. Respondents directly reported hours worked per week, weeks worked per month, and hourly wages. Earnings were calculated for each month by multiplying the wage by the hours worked times the number of weeks worked in that month. The maximum number of weeks in each month was capped at 4. Respondents reported their ending or most recent wages and hours worked for each job. This rate was assumed to apply to the entire duration of the job. Thus, if wages or hours were lower at the beginning of each job, these measures may overestimate true average wages and earnings. For respondents who were never employed during a given month, earnings, hours, and wages are included in these averages as zeros. 1Students were considered employed full-time if they reported working 30 or more hours per week.

-54-
Career Academies Evaluation
Exhibit 4.2-YMMonth-by-Month Impacts on Total Monthly Earnings
for Young Men
-200
0
200
400
600
800
1,000
1,200
1,400
1,600
1,800
2,000
1 3 5 7 9 11 13 15 17 19 21 23 25 27 29 31 33 35 37 39 41 43 45 47
Months After Scheduled High School Graduation
Mon
thly
Ear
ning
s ($)
Impacts Academy Group Non-Academy Group
Impacts
SOURCE: MDRC calculations from the Career Academies Evaluation Four-Year Post-High School Follow-Up Survey Database.
NOTES: Measures reflect a 48-month period ending in June of 2000, 2001, or 2002: the fourth year following scheduled high school graduation for each sample member. Estimates are regression-adjusted using maximum likelihood estimation, controlling for background characteristics. Standard errors are adjusted to account for the clustering of students within schools and random assignment years. A two-tailed t-test was applied to differences between the Academy and non-Academy groups. Differences in monthly earnings are significant at the .10 level or lower in 37 out of the 48 months studied. Respondents directly reported hours worked per week, weeks worked per month, and hourly wages. Earnings were calculated for each month by multiplying the wage by the hours worked times the number of weeks worked in that month. The maximum number of weeks in each month was capped at 4. Respondents reported their ending wage at each job, and this rate was assumed to apply to the entire duration of the job. Thus, if wages or hours were lower at the beginning of each job, these measures may overestimate true average earnings. For respondents who were never employed during a given month, earnings are included in these averages as zeros.

-55-
Career Academies Evaluation
Exhibit 4.3-YM
Academy Non-Academy Percent Impact perOutcome (%) Group Group Impact Change Enrollee
Average monthly earnings$0 - $824 25.7 32.1 -6.4 * -19.9 -7.7$825 - $1,237 24.8 25.1 -0.3 0.0 -1.2 -0.4$1,238 - $1,442 13.4 8.6 4.8 * 55.8 5.8$1,443 - $1,648 9.0 7.8 1.2 0.0 15.1 1.4$1,649 or more 26.5 22.5 4.0 0.0 17.9 4.8
Average weekly hours worked0 - 10 6.4 8.1 -1.7 0.0 -20.6 -2.010 - 25 18.9 22.9 -4.1 0.0 -17.7 -4.926 - 35 24.9 27.4 -2.5 0.0 -9.2 -3.036 - 45 33.0 25.7 7.3 * 28.4 8.846 or more 16.1 12.1 4.0 0.0 33.2 4.8
Average hourly wage1
$0 - $5.15 (MW) 3.3 2.6 0.7 0.0 27.5 0.9$5.16 - $7.73 (1.5xMW) 24.2 28.4 -4.2 0.0 -14.8 -5.0$7.74 - $9.01 (1.75xMW) 22.5 18.5 4.0 0.0 21.7 4.8$9.02 - $10.30 (2.0xMW) 16.1 17.7 -1.6 0.0 -8.7 -1.9$10.31 or more 32.9 28.5 4.5 0.0 15.7 5.3
Sample size (N=604) 331 273
Impacts on the Distribution of Earnings, Hours Worked, and Wagesfor the Young Men
SOURCE: MDRC calculations from the Career Academies Evaluation Four-Year Post-High School Follow-Up Survey Database. NOTES: Measures reflect a 48-month period ending in June of 2000, 2001, or 2002: the fourth year following scheduled high school graduation for each sample member. Estimates are regression-adjusted using ordinary least squares, controlling for background characteristics. Rounding may cause slight discrepancies in calculating differences and sums. A two-tailed t-test was applied to differences between the Academy and non-Academy groups. Statistical significance levels are indicated as: *** = 1 percent; ** = 5 percent; * = 10 percent. Percent change is the impact divided by the non-Academy group average. Impact per enrollee is defined as the impact divided by the difference in the percentage of Academy and non-Academy group members ever enrolled in a Career Academy. It is italicized because its calculation does not involve a direct comparison of Academy and non-Academy students. For respondents who were never employed during a given month, earnings, hours, and wages are included in these distributions as zeros. Respondents directly reported hours worked per week, weeks worked per month, and hourly wages. Earnings were calculated for each month by multiplying the wage by the hours worked times the number of weeks worked in that month. The maximum number of weeks in each month was capped at 4. Respondents reported their ending or most recent wages and hours worked for each job. This rate was assumed to apply to the entire duration of the job. Thus, if wages or hours were lower at the beginning of each job, these measures may overestimate true average wages and earnings. 1The upper end of the categories of average hourly wage was set as a multiple of the minimum wage (MW), which from 1997-2003 was $5.15 per hour.

-56-
Career Academies Evaluation
Exhibit 4.4-YM
Components of the Impact on Average Monthly Earningsfor Young Men
Academy Non-AcademyOutcome Group Group Difference
Average monthly earnings ($) 1,373.00 1,161.07 211.93
Ever employed (%) 99.52 96.17 3.35
Months employed, for those ever employed 38.94 37.41 1.53
Average monthly earnings during months employed,for those who were ever employed ($) 1,641.67 1,485.54 156.13
Average weekly hours during months employed,for those who were ever employed 41.55 39.37 2.19
Average hourly wage during months employed,for those who were ever employed ($) 9.78 9.37 0.41
Proportion of the Impact on Average Monthly EarningsDue to Each Component
Components of average monthly earnings impact $ (%) $
Impact due to an increase in percentage ever employed 38.79 16.66 17.82
Impact due to increase in months worked, for those ever employed 47.35 20.34 21.75
Impact due to increase in hours workedwhile working, for those ever employed 82.08 35.26 37.71
Impact due to an increase in hourly wage 64.57 27.74 29.66
Total impact1 232.79 100.00 106.94
SOURCE: MDRC calculations from the Career Academies Evaluation Four-Year Post-High School Follow-Up Survey Database.
NOTES: These calculations assume that all components of earnings are independent. This method examined each measure in isolation and calculated how the impact on that measure would change average monthly earnings, if all other components of earnings were held constant. For example, to calculate the impact due solely to the increase in wages, the impact on wages ($0.41 per hour) was multiplied by the number of hours that the control group worked in each month (39.4 hours per week times 4 weeks per month). 1Interactions among wages, hours worked, and months worked were not accounted for; therefore, these calculations are not exact. For comparison with the actual impact of $211.93 per month, the components were expressed as a percentage of the earnings impact. Finally, these percentages were applied to the actual impact to attain the numbers in the rightmost column.
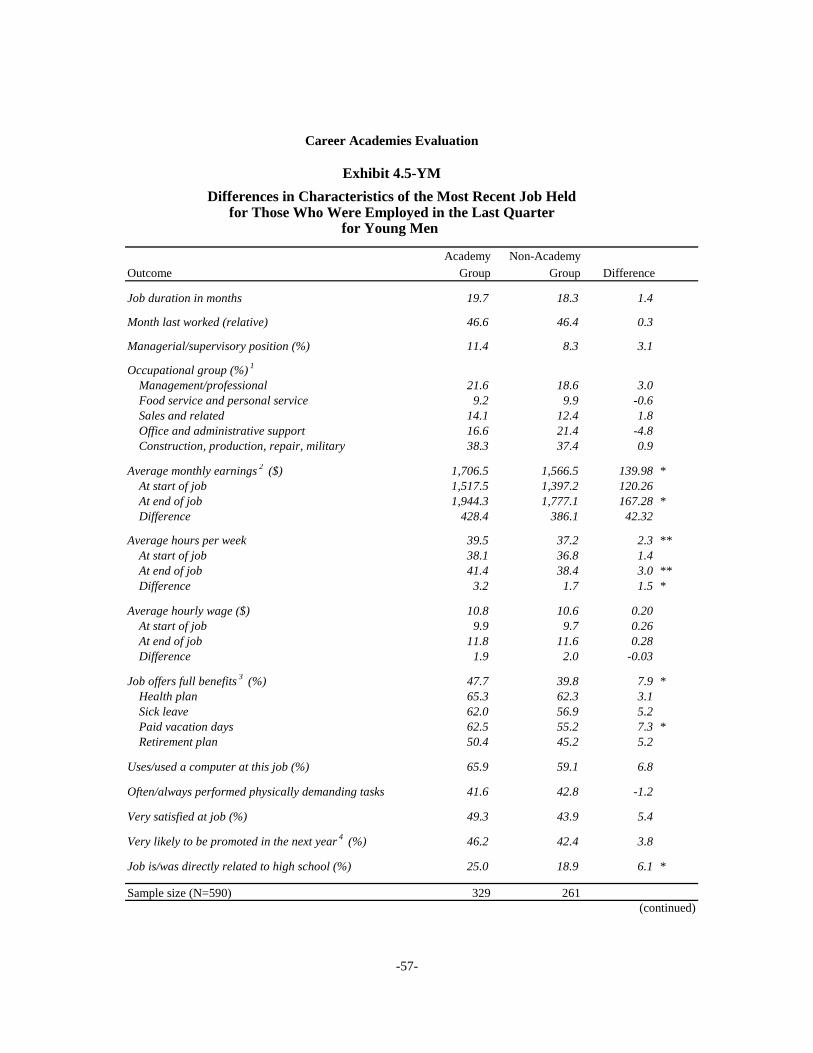
-57-
Career Academies Evaluation
Exhibit 4.5-YM
for Young Men
Academy Non-AcademyOutcome Group Group Difference
Job duration in months 19.7 18.3 1.4 0.0
Month last worked (relative) 46.6 46.4 0.3 0.0
Managerial/supervisory position (%) 11.4 8.3 3.1 0.0
Occupational group (%) 1
Management/professional 21.6 18.6 3.0 0.0Food service and personal service 9.2 9.9 -0.6 0.0Sales and related 14.1 12.4 1.8 0.0Office and administrative support 16.6 21.4 -4.8 0.0Construction, production, repair, military 38.3 37.4 0.9 0.0
Average monthly earnings 2 ($) 1,706.5 1,566.5 139.98 *At start of job 1,517.5 1,397.2 120.26 0.00At end of job 1,944.3 1,777.1 167.28 *Difference 428.4 386.1 42.32 0.00
Average hours per week 39.5 37.2 2.3 **At start of job 38.1 36.8 1.4 0.0At end of job 41.4 38.4 3.0 **Difference 3.2 1.7 1.5 *
Average hourly wage ($) 10.8 10.6 0.20 0.00At start of job 9.9 9.7 0.26 0.00At end of job 11.8 11.6 0.28 0.00Difference 1.9 2.0 -0.03 0.00
Job offers full benefits 3 (%) 47.7 39.8 7.9 *Health plan 65.3 62.3 3.1 0.0Sick leave 62.0 56.9 5.2 0.0Paid vacation days 62.5 55.2 7.3 *Retirement plan 50.4 45.2 5.2 0.0
Uses/used a computer at this job (%) 65.9 59.1 6.8 0.0
Often/always performed physically demanding tasks 41.6 42.8 -1.2 0.0
Very satisfied at job (%) 49.3 43.9 5.4 0.0
Very likely to be promoted in the next year 4 (%) 46.2 42.4 3.8 0.0
Job is/was directly related to high school (%) 25.0 18.9 6.1 *
Sample size (N=590) 329 261(continued)
Differences in Characteristics of the Most Recent Job Heldfor Those Who Were Employed in the Last Quarter

-58-
Exhibit 4.5-YM (continued)SOURCE: MDRC calculations from the Career Academies Evaluation Four-Year Post-High School Follow-Up Survey Database.
NOTES: All measures apply to jobs held in the last three months of the 48-month follow-up period ending in June of 2000, 2001, or 2002: the fourth year following scheduled high school graduation for each sample member. Estimates are regression-adjusted using ordinary least squares, controlling for background characteristics. Rounding may cause slight discrepancies in calculating differences and sums. A two-tailed t-test was applied to differences between the Academy and non-Academy groups. Statistical significance levels are indicated as: *** = 1 percent; ** = 5 percent; * = 10 percent. Measures are italicized because they refer only to those students who were employed during the last three months of thye follow-up period, and thus do not represent a direct experimental comparison of Academy and non-Academy students. 1Occupational groups are based on the U.S. Department of Labor's Standard Occupational Classification (SOC) system. 2Respondents directly reported hours worked per week, weeks worked per month, and hourly wages. Earnings were calculated for each month by multiplying the wage by the hours worked times the number of weeks worked in that month. The maximum number of weeks in each month was capped at 4. 3Full benefits include health plan, sick leave, paid vacation days, and retirement plan. 4Likelihood of being promoted was only asked of those who were employed at the time of the interview (n=532).

-59-
Career Academies Evaluation
Exhibit 4.6-YM
Academy Non-Academy Percent Impact perOutcome Group Group Impact Change Enrollee
Ever enrolled in a Career Academyduring high school (%) 87.2 3.8 83.4 *** -- --
Was enrolled in a Career Academyat the end of scheduled grade 12 (%) 49.4 2.1 47.2 *** -- --
High school completion status (%)
Earned high school diploma or GED 92.0 91.9 0.1 0.0 0.1 0.1
Earned high school diploma 78.8 80.9 -2.1 0.0 -2.6 -2.5On-time graduate1 70.7 68.4 2.3 0.0 3.4 2.8Late graduate 8.2 12.9 -4.7 * -36.2 -5.6
Earned a GED 13.3 10.9 2.4 0.0 22.1 2.9
Post-secondary education enrollment2 (%)
Ever enrolled in post-secondary education 74.9 81.7 -6.8 ** -8.4 -8.2
Highest post-secondary education enrollmentFour-year college 23.8 24.8 -0.9 0.0 -3.8 -1.1Two-year college 37.2 38.3 -1.1 0.0 -3.0 -1.4Skills training, technical or trade school 13.9 18.8 -4.9 0.0 -26.0 -5.8
Months enrolled in post-secondary education 20.2 21.4 -1.3 0.0 -5.8 -1.5
Highest credential completed or in progress3 (%)
Any post-secondary credential 54.2 58.5 -4.2 0.0 -7.3 -5.1Completed 26.0 31.2 -5.2 0.0 -16.6 -6.2In progress 28.3 27.3 1.0 0.0 3.5 1.2
Bachelor's degree 14.5 16.8 -2.3 0.0 -13.8 -2.8Completed 1.5 2.6 -1.1 0.0 -42.9 -1.3In progress 13.1 14.3 -1.2 0.0 -8.7 -1.5
Associate's degree 19.7 18.2 1.5 0.0 8.0 1.8Completed 6.0 7.4 -1.4 0.0 -18.8 -1.7In progress 13.8 10.8 3.0 0.0 27.5 3.6
Skills training certificate or license 20.0 23.4 -3.4 0.0 -14.5 -4.1Completed 18.5 21.2 -2.7 0.0 -12.6 -3.2In progress 1.5 2.2 -0.7 0.0 -33.6 -0.9
Years of schooling completed4 12.6 12.7 -0.1 0.0 -0.6 -0.1
Sample size (N=604) 331 273(continued)
Impacts on Educational Attainment for Young Men

-60-
Exhibit 4.6-YM (continued)
SOURCE: MDRC calculations from the Career Academies Evaluation Four-Year Post-High School Follow-Up Survey Database. NOTES: Unless otherwise indicated, statuses reflect a 48-month period ending in June of 2000, 2001, or 2002: the fourth year following scheduled high school graduation for each sample member. Estimates are regression-adjusted using maximum likelihood estimation, controlling for background characteristics. Standard errors are adjusted to account for the clustering of students within schools and random assignment years. Rounding may cause slight discrepancies in calculating sums and differences. A two-tailed t-test was applied to differences between the Academy and non-Academy groups. Statistical significance levels are indicated as: *** = 1 percent; ** = 5 percent; * = 10 percent. Percent change is the impact divided by the non-Academy group average. Impact per enrollee is defined as the impact divided by the difference in the percentage of Academy and non-Academy group members ever enrolled in a Career Academy. It is italicized because its calculation does not involve a direct comparison of Academy and non-Academy students. 1Students were considered on-time graduates if they graduated in June or earlier of the year they were scheduled to graduate. 2Students must have earned a high school diploma or GED to be considered enrolled in a post-secondary education program. 3A credential was considered "in progress" if the student reported attempting it in a program that he/she was currently attending (within three months of the end of the follow-up period) and expected to complete. 4Years of school completed was calculated by assigning 12 years to a completed high school diploma or GED, 14 years to an associate's or 16 years to a completed bachelor's degree. For those who did not complete an associate's or bachelor's degree, years of school completed was calculated as 12 plus the percentage of the degree completed through the end of the follow-up period. For those who did not complete a high school diploma or a GED years of school completed was calculated as a percentage of the 12 years given for a completed high school diploma or a GED.

-61-
Academy Non-AcademyOutcome Group Group Difference
Duration of attendance in months 20.6 21.3 -0.7 0.0Month of last attendance (relative to scheduled high school graduation) 37.1 37.1 -0.1 0.0Hours per week in class 19.3 18.7 0.6 0.0School considered student full-time (%) 67.2 63.6 3.7 0.0Took basic reading/math class (%) 38.1 32.0 6.0 0.0
Credential earned or attempted (%)Bachelor's degree 23.6 23.9 -0.3 0.0Associate's degree 35.6 36.2 -0.6 0.0Certificate or license 24.6 25.1 -0.5 0.0High school diploma or GED 5.7 4.3 1.4 0.0No credential 10.5 10.6 -0.1 0.0
Financial resources 1 (%)Bank or government loans 20.8 20.8 -0.1 0.0Scholarships and grants 31.2 37.4 -6.2 0.0Work-study programs 4.1 1.8 2.3 0.0Personal savings 12.4 7.9 4.6 *Family 15.0 15.5 -0.6 0.0Employment while attending school 45.8 41.2 4.6 0.0Financial aid from employer 11.5 8.8 2.6 0.0
Completed program (%) 29.4 33.2 -3.8 0.0Still enrolled (%) 41.5 38.0 3.4 0.0Left program without completing it (%) 29.2 28.7 0.5 0.0
Primary reason for leaving, for those who left 2 (%)School-related reason 11.9 19.7 -7.8 0.0Personal reason 18.7 15.5 3.3 0.0Financial/employment reason 62.0 50.7 11.3 0.0Other reason 7.4 14.1 -6.8 0.0
Sample size (N=494) 263 231
for Young Men
Career Academies Evaluation
Exhibit 4.7-YMCharacteristics of the Most Recent Educational Program Attended
for Those Who Ever Enrolled in Any Program
SOURCE: MDRC calculations from the Career Academies Evaluation Four-Year Post-High School Follow-Up Survey Database.
NOTES: Measures reflect a 48-month period ending in June of 2000, 2001, or 2002: the fourth year following scheduled high school graduation for each sample member. Estimates are regression-adjusted using ordinary least squares, controlling for background characteristics. Rounding may cause slight discrepancies in calculating differences. A two-tailed t-test was applied to differences between the Academy and non-Academy groups. Statistical significance levels are indicated as: *** = 1 percent; ** = 5 percent; * = 10 percent. Measures are italicized because they refer only to those students who ever attended a post-secondary education program, and thus do not represent a direct experimental comparison of Academy and non-Academy students. 1Individuals were asked how the education programs they attended were financed. Because the categories they reported are not mutually exclusive, these percentages do not add up to 100 percent. 2Only students who left the program without completing it were asked about their reason for leaving (n=140 ).

-62-
Career Academies Evaluation
Exhibit 4.8-YMYear-by-Year Impacts on Months Spent Attending School or Working
for Young Men
4.1 4.55.2
5.7
3.7
3.8
3.8
1.6
0.91.0
4.9 5.3 5.76.3
4.44.3
4.6
4.7
3.7
1.10.8
1.7
1.1
2.0
0
1
2
3
4
5
6
7
8
9
10
11
12
Attending school only
Working and attending school
Working only
SOURCE: MDRC calculations from the Career Academies Evaluation Four-Year Post-High School Follow-Up Survey Database.
NOTES: All measures reflect the average number of months spent in each status during each year of the 48-month follow-up period ending in June of 2000, 2001, or 2002: the fourth year following scheduled high school graduation for each sample member. Estimates are regression-adjusted using maximum likelihood estimation, controlling for background characteristics. Standard errors are adjusted to account for the clustering of students within schools and random assignment years. Rounding may cause slight discrepancies in calculating sums and differences. A two-tailed t-test was applied to differences between the Academy and non-Academy groups. The difference between total months in any activity in year 4 was significant at .1 or lower.
Num
ber
of M
onth
s
9.8
Year 1 Year 2 Year 3 Year 4
11.110.8 10.8 10.7
11.0
10.210.5
Academy Group
Non-Academy Group
Academy Group
Academy Group
Non-Academy Group
Non-Academy Group
Non-Academy Group
Academy Group

-63-
Career Academies Evaluation
Exhibit 4.9-YM
Academy Non-Academy Percent Impact perOutcome (%) Group Group Impact Change Enrollee
Is a parent 26.6 27.5 -1.0 0.0 -3.5 -1.2
Is a custodial single parent 5.4 6.8 -1.4 0.0 -20.4 -1.7
Marital Status Married 15.5 13.7 1.8 0.0 13.2 2.2Single 81.6 84.5 -2.9 0.0 -3.4 -3.4Divorced, separated, or widowed 3.0 2.0 1.1 0.0 55.1 1.3
Lives with parent(s) or guardian(s) 50.6 57.8 -7.2 * -12.4 -8.6
Ever gone without health insurance in past year 32.5 36.9 -4.5 0.0 -12.1 -5.3
Received TANF or cash assistance in past year 3.3 2.3 0.9 0.0 40.2 1.1
Received food stamps in the past year 3.6 3.3 0.3 0.0 10.0 0.4
Registered to vote 61.0 63.6 -2.6 0.0 -4.1 -3.1
Any recent illegal or drug-related activity1 10.7 11.3 -0.6 0.0 -4.9 -0.7
Sample size (N=604) 331 273
Impacts on Family Formation, Public Assistance, and Behaviorsfor Young Men
SOURCE: MDRC calculations from the Career Academies Evaluation Four-Year Post-High School Follow-Up Survey Database.
NOTES: Unless otherwise indicated, statuses were reported for the end of a 48-month period ending in June of 2000, 2001, or 2002: the fourth year following scheduled high school graduation. Estimates are regression-adjusted using maximum likelihood estimation, controlling for background characteristics. Standard errors are adjusted to account for the clustering of students within schools and random assignment years. Rounding may cause slight discrepancies in calculating differences. A two-tailed t-test was applied to differences between the Academy and non-Academy groups. Statistical significance levels are indicated as: *** = 1 percent; ** = 5 percent; * = 10 percent. Percent change is the impact divided by the non-Academy group average. Impact per enrollee is defined as the impact divided by the difference in the percentage of Academy and non-Academy group members ever enrolled in a Career Academy. It is italicized because its calculation does not involve a direct comparison of Academy and non-Academy students. See Exhibit 3.6. 1This measure includes illegal drug use in the past 2 weeks, breaking the law (other than traffic violations) in the past 2 weeks, current gang membership, and any arrests or convictions in the past year.

-64-
Career Academies Evaluation
Exhibit 4.1-YW
Academy Non-Academy Percent Impact perOutcome Group Group Impact Change Enrollee
Years 1-4
Ever employed (%) 98.0 97.7 0.2 0.0 0.2 0.3Ever employed full-time1 (%) 94.0 92.7 1.3 0.0 1.4 1.6Months employed 35.1 34.8 0.3 0.0 1.0 0.4Months employed full-time 27.3 26.6 0.6 0.0 2.3 0.8Average monthly earnings ($) 995.28 955.96 39.32 0.0 4.1 50.49Average weekly hours worked 27.1 26.7 0.5 0.0 1.7 0.6Average hourly wage ($) 8.81 8.55 0.26 0.0 3.0 0.33Total number of jobs held 3.0 3.0 0.0 0.0 -0.1 0.0Average job duration, in months 15.6 15.6 0.0 0.0 0.0 0.0
Year 1
Ever employed (%) 82.6 81.4 1.2 0.0 1.4 1.5Ever employed full-time1 (%) 63.6 64.3 -0.7 0.0 -1.1 -0.9Months employed 7.6 7.5 0.1 0.0 1.4 0.1Months employed full-time 5.2 5.4 -0.2 0.0 -3.4 -0.2Average monthly earning ($) 683.18 680.85 2.33 0.0 0.3 2.99Average weekly hours worked 22.2 22.0 0.2 0.0 0.9 0.2Average hourly wage ($) 6.34 6.09 0.25 0.0 4.1 0.32
Year 2
Ever employed (%) 88.7 90.5 -1.8 0.0 -2.0 -2.3Ever employed full-time1 (%) 74.3 74.9 -0.6 0.0 -0.7 -0.7Months employed 8.7 8.9 -0.1 0.0 -1.4 -0.2Months employed full-time 6.6 6.6 0.0 0.0 0.2 0.0Average monthly earnings ($) 937.09 904.54 32.55 0.0 3.6 41.80Average weekly hours worked 27.1 26.9 0.2 0.0 0.6 0.2Average hourly wage ($) 7.44 7.46 -0.02 0.0 -0.3 -0.03
Year 3
Ever employed (%) 91.0 89.7 1.3 0.0 1.5 1.7Ever employed full-time1 (%) 80.1 79.4 0.6 0.0 0.8 0.8Months employed 9.2 9.0 0.2 0.0 2.7 0.3Months employed full-time 7.6 7.0 0.6 0.0 7.9 0.7Average monthly earnings ($) 1,094.42 1,029.74 64.67 0.0 6.3 83.05Average weekly hours worked 29.2 28.2 1.0 0.0 3.6 1.3Average hourly wage ($) 8.47 8.09 0.38 0.0 4.7 0.49
Sample size (N=854) 468 386(continued)
Year-by-Year Impacts on Employment and Earningsfor Young Women

-65-
Exhibit 4.1-YW (continued)
Academy Non-Academy Percent Impact perOutcome Group Group Impact Change Enrollee
Year 4
Ever employed (%) 90.6 91.1 -0.4 0.0 -0.5 -0.6Ever employed full-time1 (%) 81.5 78.9 2.6 0.0 3.3 3.3Months employed 9.5 9.4 0.1 0.0 1.2 0.1Months employed full-time 7.8 7.6 0.2 0.0 2.6 0.3Average monthly earnings ($) 1,248.87 1,197.31 51.55 0.0 4.3 66.20Average weekly hours worked 29.9 29.5 0.4 0.0 1.5 0.6Average hourly wage ($) 9.29 9.03 0.26 0.0 2.9 0.33
Last Quarter
Ever employed (%) 83.4 80.6 2.9 0.0 3.6 3.7Ever employed full-time1 (%) 70.6 67.4 3.2 0.0 4.7 4.1Months employed 2.4 2.3 0.0 0.0 1.4 0.0Months employed full-time 2.0 1.9 0.1 0.0 2.9 0.1Average monthly earnings ($) 1,284.83 1,248.52 36.32 0.0 2.9 46.64Average weekly hours worked 29.8 29.6 0.2 0.0 0.8 0.3Average hourly wage ($) 9.00 8.46 0.54 0.0 6.4 0.69
Sample size (N=854) 468 386
SOURCE: MDRC calculations from the Career Academies Evaluation Four-Year Post-High School Follow-Up Survey Database.
NOTES: Measures reflect a 48-month period ending in June of 2000, 2001, or 2002: the fourth year following scheduled high school graduation for each sample member. Estimates are regression-adjusted using maximum likelihood estimation, controlling for background characteristics. Standard errors are adjusted to account for the clustering of students within schools and random assignment years. Rounding may cause slight discrepancies in calculating differences. A two-tailed t-test was applied to differences between the Academy and non-Academy groups. Statistical significance levels are indicated as: *** = 1 percent; ** = 5 percent; * = 10 percent. Percent change is the impact divided by the non-Academy group average. Impact per enrollee is defined as the impact divided by the difference in the percentage of Academy and non-Academy group members ever enrolled in a Career Academy. It is italicized because its calculation does not involve a direct comparison of Academy and non-Academy students. See Exhibit 3.6 for the percentage of the Academy and the non-Academy group ever enrolled in a Career Academy. Respondents directly reported hours worked per week, weeks worked per month, and hourly wages. Earnings were calculated for each month by multiplying the wage by the hours worked times the number of weeks worked in that month. The maximum number of weeks in each month was capped at 4. Respondents reported their ending or most recent wages and hours worked for each job. This rate was assumed to apply to the entire duration of the job. Thus, if wages or hours were lower at the beginning of each job, these measures may overestimate true average wages and earnings. For respondents who were never employed during a given month, earnings, hours, and wages are included in these averages as zeros. 1Students were considered employed full-time if they reported working 30 or more hours per week.

-66-
Career Academies Evaluation
Exhibit 4.2-YWMonth-by-Month Impacts on Total Monthly Earnings
for Young Women
-200
0
200
400
600
800
1,000
1,200
1,400
1,600
1,800
2,000
1 3 5 7 9 11 13 15 17 19 21 23 25 27 29 31 33 35 37 39 41 43 45 47
Months After Scheduled High School Graduation
Mon
thly
Ear
ning
s ($)
Impacts Academy Group Non-Academy Group
SOURCE: MDRC calculations from the Career Academies Evaluation Four-Year Post-High School Follow-Up Survey Database.
NOTES: Measures reflect a 48-month period ending in June of 2000, 2001, or 2002: the fourth year following scheduled high school graduation for each sample member. Estimates are regression-adjusted using maximum likelihood estimation, controlling for background characteristics. Standard errors are adjusted to account for the clustering of students within schools and random assignment years. A two-tailed t-test was applied to differences between the Academy and non-Academy groups. Differences in monthly earnings are significant at the .10 level or lower in 37 out of the 48 months studied. Respondents directly reported hours worked per week, weeks worked per month, and hourly wages. Earnings were calculated for each month by multiplying the wage by the hours worked times the number of weeks worked in that month. The maximum number of weeks in each month was capped at 4. Respondents reported their ending wage at each job, and this rate was assumed to apply to the entire duration of the job. Thus, if wages or hours were lower at the beginning of each job, these measures may overestimate true average earnings. For respondents who were never employed during a given month, earnings are included in these averages as zeros.
Impacts

-67-
Career Academies Evaluation
Exhibit 4.3-YW
Academy Non-Academy Percent Impact perOutcome (%) Group Group Impact Change Enrollee
Average monthly earnings$0 - $824 41.7 43.1 -1.4 0.0 -3.2 -1.8$825 - $1,237 26.7 31.1 -4.4 0.0 -14.3 -5.7$1,238 - $1,442 10.0 8.6 1.5 0.0 17.1 1.9$1,443 - $1,648 7.0 6.9 0.2 0.0 2.4 0.2$1,649 or more 13.6 8.8 4.8 ** 54.8 6.2
Average weekly hours worked0 - 10 8.9 8.7 0.2 0.0 2.2 0.210 - 25 31.1 32.3 -1.1 0.0 -3.4 -1.426 - 35 28.9 31.5 -2.6 0.0 -8.3 -3.436 - 45 23.2 22.0 1.2 0.0 5.5 1.546 or more 6.0 3.4 2.6 * 77.8 3.4
Average hourly wage1
$0 - $5.15 (MW) 2.6 1.7 0.8 0.0 47.4 1.1$5.16 - $7.73 (1.5xMW) 37.2 36.0 1.2 0.0 3.3 1.5$7.74 - $9.01 (1.75xMW) 22.7 29.0 -6.3 ** -21.6 -8.0$9.02 - $10.30 (2.0xMW) 14.5 14.8 -0.2 0.0 -1.4 -0.3$10.31 or more 21.8 17.0 4.8 * 28.1 6.1
Sample size (N=854) 468 386
Impacts on the Distribution of Earnings, Hours Worked, and Wagesfor Young Women
SOURCE: MDRC calculations from the Career Academies Evaluation Four-Year Post-High School Follow-Up Survey Database. NOTES: Measures reflect a 48-month period ending in June of 2000, 2001, or 2002: the fourth year following scheduled high school graduation for each sample member. Estimates are regression-adjusted using ordinary least squares, controlling for background characteristics. Rounding may cause slight discrepancies in calculating differences and sums. A two-tailed t-test was applied to differences between the Academy and non-Academy groups. Statistical significance levels are indicated as: *** = 1 percent; ** = 5 percent; * = 10 percent. Percent change is the impact divided by the non-Academy group average. Impact per enrollee is defined as the impact divided by the difference in the percentage of Academy and non-Academy group members ever enrolled in a Career Academy. It is italicized because its calculation does not involve a direct comparison of Academy and non-Academy students. For respondents who were never employed during a given month, earnings, hours, and wages are included in these distributions as zeros. Respondents directly reported hours worked per week, weeks worked per month, and hourly wages. Earnings were calculated for each month by multiplying the wage by the hours worked times the number of weeks worked in that month. The maximum number of weeks in each month was capped at 4. Respondents reported their ending or most recent wages and hours worked for each job. This rate was assumed to apply to the entire duration of the job. Thus, if wages or hours were lower at the beginning of each job, these measures may overestimate true average wages and earnings. 1The upper end of the categories of average hourly wage was set as a multiple of the minimum wage (MW), which from 1997-2003 was $5.15 per hour.

-68-
Career Academies Evaluation
Exhibit 4.4-YW
Components of the Impact on Average Monthly Earningsfor Young Women
Academy Non-AcademyOutcome Group Group Difference
Average monthly earnings ($) 995.28 955.96 39.32
Ever employed (%) 97.97 97.73 0.24
Months employed, for those ever employed 35.81 35.59 0.23
Average monthly earnings during months employed,for those who were ever employed ($) 1,309.21 1,294.71 14.49
Average weekly hours during months employed,for those who were ever employed 36.64 36.77 -0.13
Average hourly wage during months employed,for those who were ever employed ($) 8.95 8.71 0.23
Proportion of the Impact on Average Monthly EarningsDue to Each Component
Components of average monthly earnings impact $ (%) $
Impact due to an increase in percentage ever employed 2.30 6.09 6.52
Impact due to increase in months worked, for those ever employed 6.20 16.41 17.55
Impact due to increase in hours workedwhile working, for those ever employed -4.53 -11.98 -12.81
Impact due to an increase in hourly wage 33.83 89.48 95.69
Total impact1 37.81 100.00 106.94
SOURCE: MDRC calculations from the Career Academies Evaluation Four-Year Post-High School Follow-Up Survey Database.
NOTES: These calculations assume that all components of earnings are independent. This method examined each measure in isolation and calculated how the impact on that measure would change average monthly earnings, if all other components of earnings were held constant. For example, to calculate the impact due solely to the increase in wages, the impact on wages ($0.24 per hour) was multiplied by the number of hours that the control group worked in each month (36.8 hours per week times 4 weeks per month). 1Interactions among wages, hours worked, and months worked, were not accounted for; therefore, these calculations are not exact. For comparison with the actual impact of $39.32 per month, the components were also expressed as a percentage of the earnings impact. Finally, the percentages were applied to the actual impact to attain the numbers in the rightmost column.

-69-
Academy Non-AcademyOutcome Group Group Difference
Job duration in months 16.9 17.4 -0.5 0.0
Month last worked (relative) 45.9 45.8 0.0 0.0
Managerial/supervisory position (%) 6.8 6.4 0.4 0.0
Occupational group (%) 1
Management/professional 27.0 26.7 0.2 0.0Food service and personal service 11.8 10.1 1.7 0.0Sales and related 16.8 15.0 1.8 0.0Office and administrative support 38.8 42.0 -3.2 0.0Construction, production, repair, military 5.1 6.3 -1.2 0.0
Average monthly earnings 2 ($) 1,415.3 1,380.5 34.85 0.00At start of job 1,300.0 1,268.5 31.46 0.00At end of job 1,551.1 1,521.6 29.50 0.00Difference 252.8 252.7 0.13 0.00
Average hours per week 35.3 35.1 0.2 0.00At start of job 34.4 34.1 0.3 0.0At end of job 36.6 36.5 0.1 0.0Difference 2.2 2.4 -0.2 0.0
Average hourly wage ($) 10.1 9.6 0.48 0.00At start of job 9.6 9.1 0.48 0.00At end of job 10.6 10.3 0.28 0.00Difference 1.0 1.2 -0.21 0.00
Job offers full benefits 3 (%) 40.2 40.4 -0.2 0.0Health plan 55.7 57.6 -1.9 0.0Sick leave 54.7 52.1 2.6 0.0Paid vacation days 56.7 56.6 0.1 0.0Retirement plan 43.3 43.3 0.0 0.0
Uses/used a computer at this job (%) 75.5 75.8 -0.3 0.0
Often/always performed physically demanding tasks 17.7 20.1 -2.4 0.0
Very satisfied at job (%) 47.9 47.9 -0.1 0.0
Very likely to be promoted in the next year 4 (%) 41.9 32.6 9.3 **
Job is/was directly related to high school (%) 29.0 23.8 5.2 0.0
Sample size (N=833) 457 376(continued)
for Young Women
Career Academies Evaluation
Exhibit 4.5-YWDifferences in Characteristics of the Most Recent Job Held
for Those Who Were Employed in the Last Quarter

-70-
Exhibit 4.5-YW (continued)
SOURCE: MDRC calculations from the Career Academies Evaluation Four-Year Post-High School Follow-Up Survey Database.
NOTES: All measures apply to jobs held in the last three months of the 48-month follow-up period ending in June of 2000, 2001, or 2002: the fourth year following scheduled high school graduation for each sample member. Estimates are regression-adjusted using ordinary least squares, controlling for background characteristics. Rounding may cause slight discrepancies in calculating differences and sums. A two-tailed t-test was applied to differences between the Academy and non-Academy groups. Statistical significance levels are indicated as: *** = 1 percent; ** = 5 percent; * = 10 percent. Measures are italicized because they refer only to those students who were employed during the last three months of the follow-up period, and thus do not represent a direct experimental comparison of Academy and non-Academy students. 1Occupational groups are based on the U.S. Department of Labor's Standard Occupational Classification (SOC) system. 2Respondents directly reported hours worked per week, weeks worked per month, and hourly wages. Earnings were calculated for each month by multiplying the wage by the hours worked times the number of weeks worked in that month. The maximum number of weeks in each month was capped at 4. 3Full benefits include health plan, sick leave, paid vacation days, and retirement plan. 4Likelihood of being promoted was only asked of those who were employed at the time of the interview (n=692).

-71-
Career Academies Evaluation
Exhibit 4.6-YW
Academy Non-Academy Percent Impact perOutcome Group Group Impact Change Enrollee
Ever enrolled in a Career Academyduring high school (%) 86.1 8.3 77.9 *** -- --
Was enrolled in a Career Academyat the end of scheduled grade 12 (%) 54.9 5.5 49.4 *** -- --
High school completion status (%)
Earned high school diploma or GED 92.3 91.6 0.8 0.0 0.9 1.0
Earned high school diploma 83.3 85.5 -2.3 0.0 -2.6 -2.9On-time graduate1 74.6 75.3 -0.7 0.0 -0.9 -0.9Late graduate 8.5 10.1 -1.6 0.0 -15.9 -2.1
Earned a GED 9.2 6.2 3.1 0.0 50.1 4.0
Post-secondary education enrollment2 (%)
Ever enrolled in post-secondary education 81.8 79.2 2.6 0.0 3.3 3.4
Highest post-secondary education enrollmentFour-year college 27.1 25.0 2.1 0.0 8.3 2.7Two-year college 38.4 38.1 0.3 0.0 0.8 0.4Skills training, technical or trade school 16.2 15.9 0.3 0.0 1.7 0.3
Months enrolled in post-secondary education 22.1 21.9 0.1 0.0 0.6 0.2
Highest credential completed or in progress3 (%)
Any post-secondary credential 56.1 55.4 0.7 0.0 1.3 0.9Completed 26.0 26.0 0.1 0.0 0.2 0.1In progress 30.3 29.6 0.7 0.0 2.2 0.8
Bachelor's degree 17.8 17.7 0.1 0.0 0.4 0.1Completed 2.8 2.9 -0.2 0.0 -6.3 -0.2In progress 15.0 14.7 0.3 0.0 2.3 0.4
Associate's degree 17.8 16.4 1.5 0.0 8.9 1.9Completed 5.5 4.0 1.5 0.0 38.8 2.0In progress 12.2 12.2 0.0 0.0 -0.1 0.0
Skills training certificate or license 20.6 21.4 -0.8 0.0 -3.8 -1.1Completed 17.7 18.9 -1.2 0.0 -6.4 -1.5In progress 3.1 2.7 0.4 0.0 14.1 0.5
Years of schooling completed4 12.7 12.7 0.0 0.0 0.1 0.0
Sample size (N=854) 468 386(continued)
Impacts on Educational Attainmentfor Young Women
-72-
Exhibit 4.6-YW (continued)
SOURCE: MDRC calculations from the Career Academies Evaluation Four-Year Post-High School Follow-Up Survey Database.
NOTES: Unless otherwise indicated, statuses reflect a 48-month period ending in June of 2000, 2001, or 2002: the fourth year following scheduled high school graduation for each sample member. Estimates are regression-adjusted using maximum likelihood estimation, controlling for background characteristics. Standard errors are adjusted to account for the clustering of students within schools and random assignment years. Rounding may cause slight discrepancies in calculating sums and differences. A two-tailed t-test was applied to differences between the Academy and non-Academy groups. Statistical significance levels are indicated as: *** = 1 percent; ** = 5 percent; * = 10 percent. Percent change is the impact divided by the non-Academy group average. Impact per enrollee is defined as the impact divided by the difference in the percentage of Academy and non-Academy group members ever enrolled in a Career Academy. It is italicized because its calculation does not involve a direct comparison of Academy and non-Academy students. 1Students were considered on-time graduates if they graduated in June or earlier of the year they were scheduled to graduate. 2Students must have earned a high school diploma or GED to be considered enrolled in a post-secondary education program. 3A credential was considered "in progress" if the student reported attempting it in a program that he/she was currently attending (within three months of the end of the follow-up period) and expected to complete. 4Years of school completed was calculated by assigning 12 years to a completed high school diploma or GED, 14 years to an sssociate's or 16 years to a completed bachelor's degree. For those who did not complete an associate's or a bachelor's degree, years of school completed was calculated as 12 plus the percentage of the degree completed through the end of the follow-up period. For those who did not complete a high school diploma or a GED, years of school completed was calculated as a percentage of the 12 years given for a completed high school diploma or a GED.

-73-
Career Academies Evaluation
Exhibit 4.7-YW
Academy Non-AcademyOutcome Group Group Difference
Duration of attendance in months 19.8 21.7 -1.8 0.0Month of last attendance (relative to scheduled high school graduation) 37.3 38.3 -0.9 0.0Hours per week in class 19.0 18.2 0.9 0.0School considered student full-time (%) 71.5 68.1 3.4 0.0Took basic reading/math class (%) 35.6 33.3 2.2 0.0
Credential earned or attempted (%)Bachelor's degree 24.8 26.8 -2.1 0.0Associate's degree 37.1 35.7 1.4 0.0Certificate or license 24.1 25.6 -1.6 0.0High school diploma or GED 3.8 3.9 -0.1 0.0No credential 10.6 8.2 2.4 0.0
Financial resources 1 (%)Bank or government loans 22.0 23.5 -1.5 0.0Scholarships and grants 50.5 47.4 3.1 0.0Work-study programs 1.9 3.3 -1.4 0.0Personal savings 10.7 12.2 -1.5 0.0Family 12.7 13.9 -1.1 0.0Employment while attending school 39.8 37.7 2.1 0.0Financial aid from employer 4.7 5.8 -1.2 0.0
Completed program (%) 26.7 28.1 -1.4 0.0Still enrolled (%) 41.9 41.1 0.8 0.0Left program without completing it (%) 31.5 31.0 0.5 0.0
Primary reason for leaving, for those who left 2 (%)School-related reason 13.8 5.8 8.0 *Personal reason 37.5 35.3 2.1 0.0Financial/employment reason 38.5 47.3 -8.8 0.0Other reason 10.0 11.6 -1.7 0.0
Sample size (N=1,208) 659 549(continued)
Characteristics of the Most Recent Educational Program Attendedfor Those Who Ever Enrolled in Any Program for Young Women

-74-
Exhibit 4.7-YW (continued)SOURCE: MDRC calculations from the Career Academies Evaluation Four-Year Post-High School Follow-Up Survey Database.
NOTES: Measures reflect a 48-month period ending in June of 2000, 2001, or 2002: the fourth year following scheduled high school graduation for each sample member. Estimates are regression-adjusted using ordinary least squares, controlling for background characteristics. Rounding may cause slight discrepancies in calculating differences. A two-tailed t-test was applied to differences between the Academy and non-Academy groups. Statistical significance levels are indicated as: *** = 1 percent; ** = 5 percent; * = 10 percent. Measures are italicized because they refer only to those students who ever attended a post-secondary education program, and thus do not represent a direct experimental comparison of Academy and non-Academy students. 1Individuals were asked how the education programs they attended were financed. Because the categories they reported are not mutually exclusive, these percentages do not add up to 100 percent. 2Only students who left the program without completing it were asked about their reason for leaving (n=224).

-75-
Career Academies Evaluation
Exhibit 4.8-YWYear-by-Year Impacts on Months Spent Attending School or Working
for Young Women
3.9 4.2 4.55.5
3.7
4.0 4.0
2.0
1.1 0.9
5.54.9
4.04.0
3.7
4.8 4.74.4
4.5
1.9
1.6 1.41.3 1.4
0
1
2
3
4
5
6
7
8
9
10
11
12
Attending school only
Working and attending school
Working only
SOURCE: MDRC calculations from the Career Academies Evaluation Four-Year Post-High School Follow-Up Survey Database.
NOTES: All measures reflect the average number of months spent in each status during each year of the 48-month follow-up period ending in June of 2000, 2001, or 2002: the fourth year following scheduled high school graduation for each sample member. Estimates are regression-adjusted using maximum likelihood estimation, controlling for background characteristics. Standard errors are adjusted to account for the clustering of students within schools and random assignment years. Rounding may cause slight discrepancies in calculating sums and differences. A two-tailed t-test was applied to differences between the Academy and non-Academy groups. The difference between total months in any activity in year 4 was significant at .1 or lower.
Num
ber
of M
onth
s
9.5
Year 1 Year 2 Year 3 Year 4
12.8 10.3 10.6 10.410.6
9.7
10.4
Academy Group
Non-Academy Group
Academy Group
Academy Group
Non-Academy Group
Non-Academy Group
Non-Academy Group
Academy Group

-76-
Career Academies Evaluation
Exhibit 4.9-YW
Academy Non-Academy Percent Impact perOutcome (%) Group Group Impact Change Enrollee
Is a parent 44.3 40.3 4.1 0.0 10.1 5.2
Is a custodial single parent 28.4 24.9 3.5 0.0 13.9 4.4
Marital Status Married 23.0 22.9 0.1 0.0 0.3 0.1Single 73.6 74.4 -0.7 0.0 -1.0 -0.9Divorced, separated, or widowed 3.2 2.6 0.6 0.0 23.5 0.8
Lives with parent(s) or guardian(s) 46.4 48.3 -2.0 0.0 -4.0 -2.5
Ever gone without health insurance in past year 23.2 27.1 -3.9 0.0 -14.5 -5.0
Received TANF or cash assistance in past year 10.0 8.4 1.6 0.0 19.1 2.1
Received food stamps in the past year 14.1 11.4 2.8 0.0 24.1 3.5
Registered to vote 70.2 65.8 4.4 0.0 6.6 5.6
Any recent illegal or drug-related activity1 3.6 2.5 1.1 0.0 44.0 1.4
Sample size (N=854) 468 386
Impacts on Family Formation, Public Assistance, and Behaviorsfor Young Women
SOURCE: MDRC calculations from the Career Academies Evaluation Four-Year Post-High School Follow-Up Survey Database.
NOTES: Unless otherwise indicated, statuses were reported for the end of a 48-month period ending in June of 2000, 2001, or 2002: the fourth year following scheduled high school graduation. Estimates are regression-adjusted using maximum likelihood estimation, controlling for background characteristics. Standard errors are adjusted to account for the clustering of students within schools and random assignment years. Rounding may cause slight discrepancies in calculating differences. A two-tailed t-test was applied to differences between the Academy and non-Academy groups. Statistical significance levels are indicated as: *** = 1 percent; ** = 5 percent; * = 10 percent. Percent change is the impact divided by the non-Academy group average. Impact per enrollee is defined as the impact divided by the difference in the percentage of Academy and non-Academy group members ever enrolled in a Career Academy. It is italicized because its calculation does not involve a direct comparison of Academy and non-Academy students. See Exhibit 3.6. 1This measure includes illegal drug use in the past 2 weeks, breaking the law (other than traffic violations) in the past 2 weeks, current gang membership, and any arrests or convictions in the past year.

-77-
Career Academies Evaluation
Exhibit 4.1-YWN
Academy Non-Academy Percent Impact perOutcome Group Group Impact Change Enrollee
Years 1-4
Ever employed (%) 98.3 99.3 -1.1 0.0 -1.1 -1.4Ever employed full-time1 (%) 92.4 93.0 -0.6 0.0 -0.6 -0.7Months employed 36.6 37.4 -0.8 0.0 -2.1 -1.0Months employed full-time 26.5 26.5 0.1 0.0 0.2 0.1
Average monthly earnings ($) 1,021.69 1,025.03 -3.35 0.0 -0.3 -4.28Average weekly hours worked 27.2 27.9 -0.7 0.0 -2.4 -0.9Average hourly wage ($) 9.13 8.94 0.20 0.0 2.2 0.26Total number of jobs held 3.0 3.1 -0.2 0.0 -4.9 -0.2Average job duration, in months 16.8 17.0 -0.2 0.0 -0.9 -0.2
Year 1
Ever employed (%) 83.2 86.3 -3.1 0.0 -3.6 -4.0Ever employed full-time1 (%) 57.6 63.9 -6.3 0.0 -9.9 -8.1Months employed 7.7 8.1 -0.4 0.0 -5.0 -0.5Months employed full-time 4.6 5.4 -0.8 0.0 -14.0 -1.0Average monthly earnings ($) 674.13 713.87 -39.74 0.0 -5.6 -50.77Average weekly hours worked 21.0 22.7 -1.6 0.0 -7.2 -2.1Average hourly wage ($) 6.59 6.48 0.11 0.0 1.8 0.14
Year 2
Ever employed (%) 89.6 94.0 -4.4 * -4.7 -5.7Ever employed full-time1 (%) 68.7 74.6 -5.9 0.0 -7.9 -7.6Months employed 8.9 9.6 -0.7 * -7.2 -0.9Months employed full-time 6.1 6.6 -0.4 0.0 -6.7 -0.6Average monthly earnings ($) 924.34 968.16 -43.82 0.0 -4.5 -55.99Average weekly hours worked 26.5 28.2 -1.7 0.0 -6.0 -2.2Average hourly wage ($) 7.63 7.90 -0.28 0.0 -3.5 -0.36
Year 3
Ever employed (%) 94.1 93.2 0.8 0.0 0.9 1.1Ever employed full-time1 (%) 81.2 78.7 2.5 0.0 3.2 3.2Months employed 9.8 9.7 0.2 0.0 1.6 0.2Months employed full-time 7.6 7.0 0.6 0.0 9.2 0.8Average monthly earnings ($) 1,127.82 1,119.14 8.69 0.0 0.8 11.10Average weekly hours worked 29.9 29.9 0.0 0.0 0.1 0.0Average hourly wage ($) 8.79 8.55 0.24 0.0 2.8 0.31
Sample size (N=490) 256 234(continued)
Year-by-Year Impacts on Employment and Earningsfor Young Women Without Children

-78-
Exhibit 4.1-YWN (continued)
Academy Non-Academy Percent Impact perOutcome Group Group Impact Change Enrollee
Year 4
Ever employed (%) 92.4 94.2 -1.8 0.0 -1.9 -2.3Ever employed full-time1 (%) 81.7 77.5 4.3 0.0 5.5 5.4Months employed 10.2 10.0 0.2 0.0 1.6 0.2Months employed full-time 8.1 7.5 0.6 0.0 7.6 0.7Average monthly earnings ($) 1,342.98 1,289.66 53.32 0.0 4.1 68.12Average weekly hours worked 31.5 30.9 0.6 0.0 1.8 0.7Average hourly wage ($) 9.88 9.77 0.11 0.0 1.2 0.14
Last Quarter
Ever employed (%) 87.7 86.8 0.9 0.0 1.1 1.2Ever employed full-time1 (%) 72.6 68.4 4.2 0.0 6.1 5.3Months employed 2.5 2.5 0.0 0.0 0.3 0.0Months employed full-time 2.0 1.9 0.1 0.0 5.7 0.1Average monthly earnings ($) 1,386.57 1,370.04 16.53 0.0 1.2 21.12Average weekly hours worked 31.4 31.2 0.2 0.0 0.6 0.3Average hourly wage ($) 9.77 9.42 0.34 0.0 3.6 0.43
Sample size (N=490) 256 234
SOURCE: MDRC calculations from the Career Academies Evaluation Four-Year Post-High School Follow-Up Survey Database.
NOTES: Measures reflect a 48-month period ending in June of 2000, 2001, or 2002: the fourth year following scheduled high school graduation for each sample member. Estimates are regression-adjusted using maximum likelihood estimation, controlling for background characteristics. Standard errors are adjusted to account for the clustering of students within schools and random assignment years. Rounding may cause slight discrepancies in calculating differences. A two-tailed t-test was applied to differences between the Academy and non-Academy groups. Statistical significance levels are indicated as: *** = 1 percent; ** = 5 percent; * = 10 percent. Percent change is the impact divided by the non-Academy group average. Impact per enrollee is defined as the impact divided by the difference in the percentage of Academy and non-Academy group members ever enrolled in a Career Academy. The numbers in this table are italicized because they are nonexperimental. Respondents directly reported hours worked per week, weeks worked per month, and hourly wages. Earnings were calculated for each month by multiplying the wage by the hours worked times the number of weeks worked in that month. The maximum number of weeks in each month was capped at 4. Respondents reported their ending or most recent wages and hours worked for each job. This rate was assumed to apply to the entire duration of the job. Thus, if wages or hours were lower at the beginning of each job, these measures may overestimate true average wages and earnings. For respondents who were never employed during a given month, earnings, hours, and wages are included in these averages as zeros. 1Students were considered employed full-time if they reported working 30 or more hours per week.

-79-
Career Academies Evaluation
Exhibit 4.2-YWN
Academy Non-Academy Percent Impact perOutcome Group Group Impact Change Enrollee
Ever enrolled in a Career Academyduring high school (%) 88.2 9.9 78.3 *** -- --
Was enrolled in a Career Academyat the end of scheduled grade 12 (%) 66.7 7.2 59.5 *** -- --
High school completion status (%)
Earned high school diploma or GED 98.6 97.3 1.2 0.0 1.3 1.6
Earned high school diploma 91.9 94.5 -2.6 0.0 -2.8 -3.3On-time graduate1 84.8 85.6 -0.9 0.0 -1.0 -1.1Late graduate 7.2 8.8 -1.6 0.0 -18.4 -2.1
Earned a GED 6.6 2.6 4.0 ** 152.5 5.1
Post-secondary education enrollment2 (%)
Ever enrolled in post-secondary education 93.0 89.2 3.7 0.0 4.2 4.8
Highest post-secondary education enrollmentFour-year college 37.6 34.1 3.5 0.0 10.3 4.5Two-year college 45.3 44.4 0.9 0.0 2.0 1.1Skills training, technical or trade school 9.8 10.3 -0.5 0.0 -5.2 -0.7
Months enrolled in post-secondary education 29.7 28.4 1.3 0.0 4.5 1.6
Highest credential completed or in progress3 (%)
Any post-secondary credential 68.0 63.2 4.8 0.0 7.5 6.1Completed 26.6 25.2 1.4 0.0 5.7 1.8In progress 41.4 38.1 3.3 0.0 8.7 4.2
Bachelor's degree 26.8 25.3 1.5 0.0 6.0 1.9Completed 3.7 4.2 -0.5 0.0 -11.7 -0.6In progress 23.2 21.1 2.2 0.0 10.3 2.8
Associate's degree 22.6 20.9 1.7 0.0 8.1 2.2Completed 7.8 5.1 2.7 0.0 52.2 3.4In progress 14.7 15.6 -0.9 0.0 -5.6 -1.1
Skills training certificate or license 18.2 16.9 1.3 0.0 7.6 1.6Completed 14.8 15.4 -0.6 0.0 -3.7 -0.7In progress 3.3 1.4 1.9 0.0 136.0 2.4
Years of schooling completed4 13.1 13.1 0.1 0.0 0.5 0.1
Sample size (N=490) 256 234(continued)
Impacts on Educational Attainmentfor Young Women Without Children

-80-
Exhibit 4.2-YWN (continued)
SOURCE: MDRC calculations from the Career Academies Evaluation Four-Year Post-High School Follow-Up Survey Database. NOTES: Unless otherwise indicated, statuses reflect a 48-month period ending in June of 2000, 2001, or 2002: the fourth year following scheduled high school graduation for each sample member. Estimates are regression-adjusted using maximum likelihood estimation, controlling for background characteristics. Standard errors are adjusted to account for the clustering of students within schools and random assignment years. Rounding may cause slight discrepancies in calculating sums and differences. A two-tailed t-test was applied to differences between the Academy and non-Academy groups. Statistical significance levels are indicated as: *** = 1 percent; ** = 5 percent; * = 10 percent. Percent change is the impact divided by the non-Academy group average. Impact per enrollee is defined as the impact divided by the difference in the percentage of Academy and non-Academy group members ever enrolled in a Career Academy. This numbers in this table are italized because they are nonexperimental. 1Students were considered on-time graduates if they graduated in June or earlier of the year they were scheduled to graduate. 2Students must have earned a high school diploma or GED to be considered enrolled in a post-secondary education program. 3A credential was considered "in progress" if the student reported attempting it in a program that he/she was currently attending (within three months of the end of the follow-up period) and expected to complete. 4Years of school completed was calculated by assigning 12 years to a completed high school diploma or GED, 14 years to an associate's or 16 years to a completed bachelor's degree. For those who did not complete an associate's or bachelor's degree, years of school completed was calculated as 12 plus the percentage of the degree completed through the end of the follow-up period. For those who did not complete a high school diploma or a GED years of school completed was calculated as a percentage of the 12 years given for a completed high school diploma or a GED.

-81-
Career Academies Evaluation
Exhibit 4.1-YWC
Academy Non-Academy Percent Impact perOutcome Group Group Impact Change Enrollee
Years 1-4
Ever employed (%) 97.2 95.5 1.7 0.0 1.8 2.2Ever employed full-time1 (%) 95.9 92.6 3.3 0.0 3.5 4.3Months employed 33.2 30.9 2.2 0.0 7.3 2.9Months employed full-time 28.1 26.7 1.3 0.0 5.0 1.7Average monthly earnings ($) 945.04 838.13 106.91 0.0 12.8 138.74Average weekly hours worked 27.0 24.7 2.3 0.0 9.5 3.0Average hourly wage ($) 8.35 8.07 0.28 0.0 3.5 0.36Total number of jobs held 3.1 2.9 0.3 0.0 8.8 0.3Average job duration, in months 13.9 13.7 0.2 0.0 1.5 0.3
Year 1
Ever employed (%) 81.2 74.8 6.4 0.0 8.5 8.3Ever employed full-time1 (%) 70.4 65.5 4.9 0.0 7.5 6.4Months employed 7.5 6.7 0.7 0.0 10.5 0.9Months employed full-time 5.9 5.6 0.3 0.0 5.1 0.4Average monthly earnings ($) 682.35 644.08 38.27 0.0 5.9 49.66Average weekly hours worked 23.3 21.1 2.2 0.0 10.5 2.9Average hourly wage ($) 5.85 5.50 0.35 0.0 6.4 0.45
Year 2
Ever employed (%) 87.4 86.2 1.2 0.0 1.4 1.5Ever employed full-time1 (%) 80.9 75.5 5.5 0.0 7.2 7.1Months employed 8.4 7.8 0.6 0.0 8.3 0.8Months employed full-time 7.0 6.6 0.5 0.0 6.9 0.6Average monthly earnings ($) 930.59 801.85 128.74 0.0 16.1 167.06Average weekly hours worked 27.8 25.1 2.7 0.0 10.6 3.5Average hourly wage ($) 7.11 6.96 0.15 0.0 2.2 0.19
Year 3
Ever employed (%) 86.7 84.4 2.2 0.0 2.7 2.9Ever employed full-time1 (%) 79.3 79.4 -0.1 0.0 -0.2 -0.2Months employed 8.5 8.0 0.5 0.0 6.7 0.7Months employed full-time 7.6 6.9 0.6 0.0 9.1 0.8Average monthly earnings ($) 1,052.56 880.83 171.72 ** 19.5 222.84Average weekly hours worked 28.7 25.6 3.1 0.0 12.1 4.0Average hourly wage ($) 7.92 7.43 0.49 0.0 6.5 0.64
Sample size (N=363) 211 152(continued)
Year-by-Year Impacts on Employment and Earningsfor Young Women With Children

-82-
Exhibit 4.1-YWC (continued)
Academy Non-Academy Percent Impact perOutcome Group Group Impact Change Enrollee
Year 4
Ever employed (%) 88.2 85.8 2.3 0.0 2.7 3.0Ever employed full-time1 (%) 81.0 79.7 1.3 0.0 1.7 1.7Months employed 8.7 8.4 0.4 0.0 4.1 0.5Months employed full-time 7.5 7.6 -0.1 0.0 -1.2 -0.1Average monthly earnings ($) 1,126.13 1,027.99 98.15 0.0 9.6 127.37Average weekly hours worked 28.3 26.8 1.4 0.0 5.3 1.9Average hourly wage ($) 8.49 7.88 0.61 0.0 7.8 0.79
Last Quarter
Ever employed (%) 78.2 71.1 7.1 0.0 10.0 9.2Ever employed full-time1 (%) 68.4 65.6 2.8 0.0 4.3 3.7Months employed 2.2 2.1 0.1 0.0 5.9 0.2Months employed full-time 1.9 1.9 0.0 0.0 0.7 0.0Average monthly earnings ($) 1,153.30 1,045.57 107.73 0.0 10.3 139.80Average weekly hours worked 27.9 26.9 1.1 0.0 3.9 1.4Average hourly wage ($) 7.94 6.88 1.06 * 15.4 1.38
Sample size (N=363) 211 152
SOURCE: MDRC calculations from the Career Academies Evaluation Four-Year Post-High School Follow-Up Survey Database.
NOTES: Measures reflect a 48-month period ending in June of 2000, 2001, or 2002: the fourth year following scheduled high school graduation for each sample member. Estimates are regression-adjusted using maximum likelihood estimation, controlling for background characteristics. Standard errors are adjusted to account for the clustering of students within schools and random assignment years. Rounding may cause slight discrepancies in calculating differences. A two-tailed t-test was applied to differences between the Academy and non-Academy groups. Statistical significance levels are indicated as: *** = 1 percent; ** = 5 percent; * = 10 percent. Percent change is the impact divided by the non-Academy group average. Impact per enrollee is defined as the impact divided by the difference in the percentage of Academy and non-Academy group members ever enrolled in a Career Academy. The numbers in this table are italicized because they are nonexperimental. Respondents directly reported hours worked per week, weeks worked per month, and hourly wages. Earnings were calculated for each month by multiplying the wage by the hours worked times the number of weeks worked in that month. The maximum number of weeks in each month was capped at 4. Respondents reported their ending or most recent wages and hours worked for each job. This rate was assumed to apply to the entire duration of the job. Thus, if wages or hours were lower at the beginning of each job, these measures may overestimate true average wages and earnings. For respondents who were never employed during a given month, earnings, hours, and wages are included in these averages as zeros. 1Students were considered employed full-time if they reported working 30 or more hours per week.

-83-
Career Academies Evaluation
Exhibit 4.2-YWC
Academy Non-Academy Percent Impact perOutcome Group Group Impact Change Enrollee
Ever enrolled in a Career Academyduring high school (%) 83.3 6.3 77.1 *** -- --
Was enrolled in a Career Academyat the end of scheduled grade 12 (%) 41.3 4.2 37.1 *** -- --
High school completion status (%)
Earned high school diploma or GED 84.7 83.3 1.5 0.0 1.7 1.9
Earned high school diploma 75.2 72.0 3.2 0.0 4.5 4.2On-time graduate1 63.5 59.5 4.0 0.0 6.8 5.2Late graduate 10.4 11.4 -1.0 0.0 -8.8 -1.3
Earned a GED 10.2 11.8 -1.6 0.0 -13.8 -2.1
Post-secondary education enrollment2 (%)
Ever enrolled in post-secondary education 68.0 64.5 3.4 0.0 5.3 4.4
Highest post-secondary education enrollmentFour-year college 13.3 10.5 2.8 0.0 27.1 3.7Two-year college 30.7 29.6 1.1 0.0 3.7 1.4Skills training, technical or trade school 24.1 24.7 -0.6 0.0 -2.4 -0.8
Months enrolled in post-secondary education 11.9 12.0 0.0 0.0 -0.2 0.0
Highest credential completed or in progress3 (%)
Any post-secondary credential 42.3 46.1 -3.8 0.0 -8.3 -4.9Completed 25.7 27.0 -1.3 0.0 -4.8 -1.7In progress 16.0 18.6 -2.6 0.0 -14.2 -3.4
Bachelor's degree 6.4 5.6 0.9 0.0 15.3 1.1Completed 1.5 0.7 0.8 0.0 105.6 1.0In progress 5.0 4.9 0.1 0.0 2.7 0.2
Associate's degree 12.8 13.0 -0.2 0.0 -1.5 -0.2Completed 2.7 2.5 0.1 0.0 4.9 0.2In progress 9.8 10.3 -0.4 0.0 -4.0 -0.5
Skills training certificate or license 23.9 28.6 -4.7 0.0 -16.5 -6.1Completed 21.6 23.7 -2.1 0.0 -8.8 -2.7In progress 2.5 5.1 -2.5 0.0 -50.1 -3.3
Years of schooling completed4 12.1 12.1 0.0 0.0 0.3 0.0
Sample size (N=363) 211 152(continued)
Impacts on Educational Attainment for Young Women With Children

-84-
Exhibit 4.2-YWC (continued)
SOURCE: MDRC calculations from the Career Academies Evaluation Four-Year Post-High School Follow-Up Survey Database. NOTES: Unless otherwise indicated, statuses reflect a 48-month period ending in June of 2000, 2001, or 2002: the fourth year following scheduled high school graduation for each sample member. Estimates are regression-adjusted using maximum likelihood estimation, controlling for background characteristics. Standard errors are adjusted to account for the clustering of students within schools and random assignment years. Rounding may cause slight discrepancies in calculating sums and differences. A two-tailed t-test was applied to differences between the Academy and non-Academy groups. Statistical significance levels are indicated as: *** = 1 percent; ** = 5 percent; * = 10 percent. Percent change is the impact divided by the non-Academy group average. Impact per enrollee is defined as the impact divided by the difference in the percentage of Academy and non-Academy group members ever enrolled in a Career Academy. The numbers in this table are italized because they are nonexperimental. 1Students were considered on-time graduates if they graduated in June or earlier of the year they were scheduled to graduate. 2Students must have earned a high school diploma or GED to be considered enrolled in a post-secondary education program. 3A credential was considered "in progress" if the student reported attempting it in a program that he/she was currently attending (within three months of the end of the follow-up period) and expected to complete. 4Years of school completed was calculated by assigning 12 years to a completed high school diploma or GED, 14 years to an associate's or 16 years to a completed bachelor's degree. For those who did not complete an associate's or bachelor's degree, years of school completed was calculated as 12 plus the percentage of the degree completed through the end of the follow-up period. For those who did not complete a high school diploma or a GED years of school completed was calculated as a percentage of the 12 years given for a completed high school diploma or a GED.

Unit 5
Impacts for Risk Subgroups

-86-
Career Academies Evaluation
Exhibit 5.1-HR
Academy Non-Academy Percent Impact perOutcome Group Group Impact Change Enrollee
Years 1-4
Ever employed (%) 98.6 96.7 1.9 0.0 1.9 2.3Ever employed full-time1 (%) 96.1 95.5 0.6 0.0 0.7 0.8Months employed 35.6 33.4 2.2 0.0 6.6 2.7Months employed full-time 30.7 27.8 2.9 * 10.3 3.5Average monthly earnings ($) 1,204.27 1,036.20 168.07 * 16.2 204.81Average weekly hours worked 30.1 27.9 2.2 0.0 8.0 2.7Average hourly wage ($) 9.28 8.74 0.53 0.0 6.1 0.65Total number of jobs held 3.0 2.9 0.2 0.0 5.9 0.2Average job duration, in months 15.9 15.6 0.4 0.0 2.2 0.4
Year 1
Ever employed (%) 82.0 81.9 0.1 0.0 0.1 0.1Ever employed full-time1 (%) 69.7 67.2 2.5 0.0 3.7 3.0Months employed 7.8 7.2 0.7 0.0 9.3 0.8Months employed full-time 6.3 5.5 0.8 0.0 14.9 1.0Average monthly earnings ($) 847.78 720.40 127.38 0.0 17.7 155.23Average weekly hours worked 25.2 22.6 2.7 0.0 11.8 3.2Average hourly wage ($) 6.58 6.44 0.14 0.0 2.1 0.17
Year 2
Ever employed (%) 88.1 85.5 2.6 0.0 3.0 3.2Ever employed full-time1 (%) 78.3 74.1 4.2 0.0 5.7 5.1Months employed 8.9 8.7 0.3 0.0 3.4 0.4Months employed full-time 7.6 6.9 0.7 0.0 10.3 0.9Average monthly earnings ($) 1,137.85 996.22 141.63 0.0 14.2 172.59Average weekly hours worked 30.7 28.5 2.2 0.0 7.7 2.7Average hourly wage ($) 7.91 7.85 0.05 0.0 0.7 0.06
Year 3
Ever employed (%) 92.8 87.0 5.8 * 6.7 7.1Ever employed full-time1 (%) 84.3 80.7 3.6 0.0 4.5 4.4Months employed 9.3 8.8 0.5 0.0 5.9 0.6Months employed full-time 8.1 7.6 0.5 0.0 6.8 0.6Average monthly earnings ($) 1,321.71 1,173.74 147.97 0.0 12.6 180.32Average weekly hours worked 31.7 30.1 1.6 0.0 5.3 1.9Average hourly wage ($) 9.23 8.33 0.90 * 10.9 1.10
Sample size (N=360) 206 154(continued)
Year-by-Year Impacts on Employment and Earningsfor the High-Risk Subgroup

-87-
Exhibit 5.1-HR (continued)
Academy Non-Academy Percent Impact perOutcome Group Group Impact Change Enrollee
Year 4
Ever employed (%) 91.2 84.6 6.6 * 7.8 8.1Ever employed full-time1 (%) 85.1 79.2 5.9 0.0 7.4 7.2Months employed 9.5 8.8 0.7 0.0 8.1 0.9Months employed full-time 8.6 7.8 0.8 0.0 10.0 1.0Average monthly earnings ($) 1,515.32 1,271.53 243.79 * 19.2 297.09Average weekly hours worked 32.9 30.7 2.2 0.0 7.2 2.7Average hourly wage ($) 10.12 8.82 1.30 * 14.8 1.58
Last Quarter
Ever employed (%) 85.5 76.7 8.8 * 11.5 10.7Ever employed full-time1 (%) 77.4 69.1 8.3 * 12.0 10.1Months employed 2.4 2.2 0.2 0.0 9.0 0.2Months employed full-time 2.2 2.0 0.2 0.0 12.1 0.3Average monthly earnings ($) 1,584.88 1,347.85 237.03 * 17.6 288.85Average weekly hours worked 33.0 30.4 2.6 0.0 8.6 3.2Average hourly wage ($) 9.99 8.74 1.25 0.0 14.3 1.52
Sample size (N=360) 206 154
SOURCE: MDRC calculations from the Career Academies Evaluation Four-Year Post-High School Follow-Up Survey Database.
NOTES: Measures reflect a 48-month period ending in June of 2000, 2001, or 2002: the fourth year following scheduled high school graduation for each sample member. Estimates are regression-adjusted using maximum likelihood estimation, controlling for background characteristics. Standard errors are adjusted to account for the clustering of students within schools and random assignment years. Rounding may cause slight discrepancies in calculating differences. A two-tailed t-test was applied to differences between the Academy and non-Academy groups. Statistical significance levels are indicated as: *** = 1 percent; ** = 5 percent; * = 10 percent. The definition of risk subgroups involved identifying background characteristics that best predicted dropping out among students in the non-Academy group. High-risk students (approximately 25 percent of both the Academy and the non-Academy groups) have an array of these characteristics associated with the highest likelihood of droping out. Percent change is the impact divided by the non-Academy group average. Impact per enrollee is defined as the impact divided by the difference in the percentage of Academy and non-Academy group members ever enrolled in a Career Academy. It is italicized because its calculation does not involve a direct comparison of Academy and non-Academy students. See Exhibit 3.6 for the percentage of the Academy and the non-Academy group ever enrolled in a Career Academy. Respondents directly reported hours worked per week, weeks worked per month, and hourly wages. Earnings were calculated for each month by multiplying the wage by the hours worked times the number of weeksworked in that month. The maximum number of weeks in each month was capped at 4. Respondents reported their ending or most recent wages and hours worked for each job. This rate was assumed to apply to the entire duration of the job. Thus, if wages or hours were lower at the beginning of each job, these measures may overestimate true average wages and earnings. For respondents who were never employed during a given month, earnings, hours, and wages are included in these averages as zeros. 1Students were considered employed full-time if they reported working 30 or more hours per week.

-88-
Career Academies Evaluation
Exhibit 5.2-HR
Month-by-Month Impacts on Average Earningsfor the High-Risk Subgroup
(200)
0
200
400
600
800
1,000
1,200
1,400
1,600
1,800
2,000
1 3 5 7 9 11 13 15 17 19 21 23 25 27 29 31 33 35 37 39 41 43 45 47
Months After Scheduled High School Graduation
Mon
thly
Ear
ning
s ($)
Impacts Academy Group Non-Academy Group
SOURCE: MDRC calculations from the Career Academies Evaluation Four-Year Post-High School Follow-Up Survey Database.
NOTES: Measures reflect a 48-month period ending in June of 2000, 2001, or 2002: the fourth year following scheduled high school graduation for each sample member. Estimates are regression-adjusted using maximum likelihood estimation, controlling for background characteristics. Standard errors are adjusted to account for the clustering of students within schools and random assignment years. A two-tailed t-test was applied to differences between the Academy and non-Academy groups. Differences in monthly earnings are significant at the .10 level or lower in 37 out of the 48 months studied. The definition of risk subgroups involved identifying background characteristics that best predicted dropping out among students in the non-Academy group. High-risk students (approximately 25 percent of both the Academy and the non-Academy groups) have an array of these characteristics associated with the highest likelihood of dropping out. Respondents directly reported hours worked per week, weeks worked per month, and hourly wages. Earnings were calculated for each month by multiplying the wage by the hours worked times the number of weeks worked in that month. The maximum number of weeks in each month was capped at 4. Respondents reported their ending wage at each job, and this rate was assumed to apply to the entire duration of the job. Thus, if wages or hours were lower at the beginning of each job, these measures may overestimate true average earnings. For respondents who were never employed during a given month, earnings are included in these averages as zeros.
Impacts
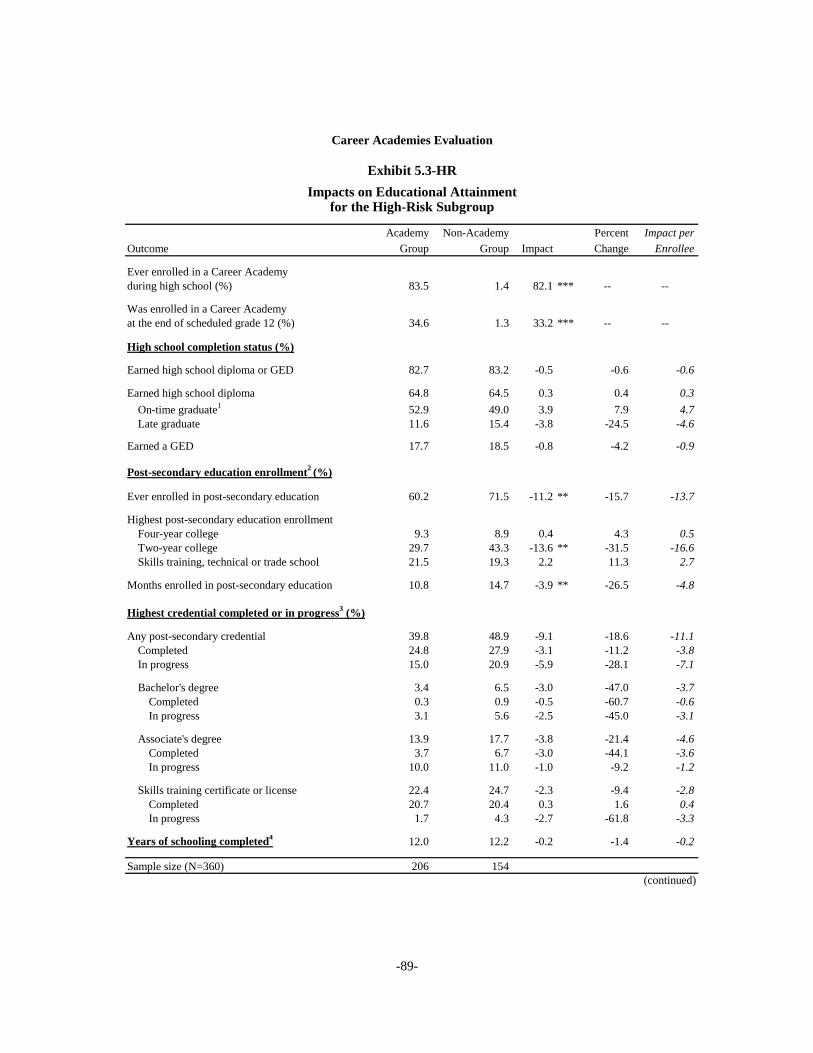
-89-
Career Academies Evaluation
Exhibit 5.3-HR
Academy Non-Academy Percent Impact perOutcome Group Group Impact Change Enrollee
Ever enrolled in a Career Academyduring high school (%) 83.5 1.4 82.1 *** -- --
Was enrolled in a Career Academyat the end of scheduled grade 12 (%) 34.6 1.3 33.2 *** -- --
High school completion status (%)
Earned high school diploma or GED 82.7 83.2 -0.5 0.0 -0.6 -0.6
Earned high school diploma 64.8 64.5 0.3 0.0 0.4 0.3On-time graduate1 52.9 49.0 3.9 0.0 7.9 4.7Late graduate 11.6 15.4 -3.8 0.0 -24.5 -4.6
Earned a GED 17.7 18.5 -0.8 0.0 -4.2 -0.9
Post-secondary education enrollment2 (%)
Ever enrolled in post-secondary education 60.2 71.5 -11.2 ** -15.7 -13.7
Highest post-secondary education enrollmentFour-year college 9.3 8.9 0.4 0.0 4.3 0.5Two-year college 29.7 43.3 -13.6 ** -31.5 -16.6Skills training, technical or trade school 21.5 19.3 2.2 0.0 11.3 2.7
Months enrolled in post-secondary education 10.8 14.7 -3.9 ** -26.5 -4.8
Highest credential completed or in progress3 (%)
Any post-secondary credential 39.8 48.9 -9.1 0.0 -18.6 -11.1Completed 24.8 27.9 -3.1 0.0 -11.2 -3.8In progress 15.0 20.9 -5.9 0.0 -28.1 -7.1
Bachelor's degree 3.4 6.5 -3.0 0.0 -47.0 -3.7Completed 0.3 0.9 -0.5 0.0 -60.7 -0.6In progress 3.1 5.6 -2.5 0.0 -45.0 -3.1
Associate's degree 13.9 17.7 -3.8 0.0 -21.4 -4.6Completed 3.7 6.7 -3.0 0.0 -44.1 -3.6In progress 10.0 11.0 -1.0 0.0 -9.2 -1.2
Skills training certificate or license 22.4 24.7 -2.3 0.0 -9.4 -2.8Completed 20.7 20.4 0.3 0.0 1.6 0.4In progress 1.7 4.3 -2.7 0.0 -61.8 -3.3
Years of schooling completed4 12.0 12.2 -0.2 0.0 -1.4 -0.2
Sample size (N=360) 206 154(continued)
Impacts on Educational Attainmentfor the High-Risk Subgroup

-90-
Exhibit 5.3-HR (continued)
SOURCE: MDRC calculations from the Career Academies Evaluation Four-Year Post-High School Follow-Up Survey Database.
NOTES: Unless otherwise indicated, statuses reflect a 48-month period ending in June of 2000, 2001, or 2002: the fourth year following scheduled high school graduation for each sample member. Estimates are regression-adjusted using maximum likelihood estimation, controlling for background characteristics. Standard errors are adjusted to account for the clustering of students within schools and random assignment years. Rounding may cause slight discrepancies in calculating sums and differences. A two-tailed t-test was applied to differences between the Academy and non-Academy groups. Statistical significance levels are indicated as: *** = 1 percent; ** = 5 percent; * = 10 percent. The definition of risk subgroups involved identifying background characteristics that best predicted dropping out among students in the non-Academy group. High-risk students (approximately 25 percent of both the Academy and the non-Academy groups) have an array of these characteristics associated with the highest likelihood of dropping out. Percent change is the impact divided by the non-Academy group average. Impact per enrollee is defined as the impact divided by the difference in the percentage of Academy and non-Academy group members ever enrolled in a Career Academy. It is italicized because its calculation does not involve a direct comparison of Academy and non-Academy students. 1Students were considered on-time graduates if they graduated in June or earlier of the year they were scheduled to graduate. 2Students must have earned a high school diploma or GED to be considered enrolled in a post-secondary education program. 4Years of school completed was calculated by assigning 12 years to a completed high school diploma or GED, 14 years to an associate's or 16 years to a completed bachelor's degree. For those who did not complete an associate's or a bachelor's degree, years of school completed was calculated as 12 plus the percentage of the degree completed through the end of the follow-up period. For those who did not complete a high school diploma or a GED, years of school completed was calculated as a percentage of the 12 years given for a completed high school diploma or a GED.

-91-
Career Academies Evaluation
Exhibit 5.4-HRYear-by-Year Impacts on Months Spent Attending School or Working
for the High-Risk Subgroup
4.75.2
5.76.3
2.1
2.3
2.6
1.2
0.50.7
7.36.96.2
5.7
2.4
2.7
3.4
2.3
3.1
1.7
0.9 1.20.5
0.9
0
1
2
3
4
5
6
7
8
9
10
11
12
Academy Group
Non-Academy Group
Academy Group
Academy Group
Non-Academy Group
Non-Academy Group
Non-Academy Group
Academy Group
Attending school only
Working and attending school
Working only
SOURCE: MDRC calculations from the Career Academies Evaluation Four-Year Post-High School Follow-Up Survey Database.
NOTES: All measures reflect the average number of months spent in each status during each year of the 48-month follow-up period ending in June of 2000, 2001, or 2002: the fourth year following scheduled high school graduation for each sample member. Estimates are regression-adjusted using maximum likelihood estimation, controlling for background characteristics. Standard errors are adjusted to account for the clustering of students within schools and random assignment years. Rounding may cause slight discrepancies in calculating sums and differences. A two-tailed t-test was applied to differences between the Academy and non-Academy groups. The difference between total months in any activity in year 4 was significant at .1 or lower. The definition of risk subgroups involved identifying background characteristics that best predicted dropping out among students in the non-Academy group. High-risk students (approximately 25 percent of both the Academy and the non-Academy groups) have an array of these characteristics associated with the highest likelihood of dropping out.
Num
ber
of M
onth
s
8.8
Year 1 Year 2 Year 3 Year 4
9.8 9.8 9.7 9.710.1
9.09.6

-92-
Career Academies Evaluation
Exhibit 5.5-HR
Academy Non-Academy Percent Impact perOutcome (%) Group Group Impact Change Enrollee
Is a parent 48.9 45.0 3.9 0.0 8.8 4.8
Is a custodial single parent 27.7 22.4 5.3 0.0 23.5 6.4
Marital Status Married 23.3 20.2 3.1 0.0 15.4 3.8Single 74.9 76.9 -1.9 0.0 -2.5 -2.4Divorced, separated, or widowed 1.7 2.9 -1.2 0.0 -40.9 -1.5
Lives with parent(s) or guardian(s) 42.3 51.8 -9.5 * -18.3 -11.6
Ever gone without health insurance in past year 30.2 32.8 -2.6 0.0 -7.9 -3.1
Received TANF or cash assistance in past year 10.4 6.3 4.1 0.0 64.1 4.9
Received food stamps in the past year 10.5 9.4 1.1 0.0 11.7 1.4
Registered to vote 63.2 56.7 6.5 0.0 11.5 7.9
Any recent illegal or drug-related activity1 12.6 13.3 -0.7 0.0 -5.4 -0.9
Sample size (N=360) 206 154
Impacts on Family Formation, Public Assistance, and Behaviorsfor the High-Risk Subgroup
SOURCE: MDRC calculations from the Career Academies Evaluation Four-Year Post-High School Follow-Up Survey Database.
NOTES: Unless otherwise indicated, statuses reflect a 48-month period ending in June of 2000, 2001, or 2002: the fourth year following scheduled graduation. Estimates are regression-adjusted using maximum likelihood estimation, controlling for background characteristics. Standard errors are adjusted to account for the clustering of students within schools and random assignment years. Rounding may cause slight discrepancies in calculating differences. A two-tailed t-test was applied to differences between the Academy and non-Academy groups. Statistical significance levels are indicated as: *** = 1 percent; ** = 5 percent; * = 10 percent. The definition of risk subgroups involved identifying background characteristics that best predicted dropping out among students in the non-Academy group. High-risk students (approximately 25 percent of both the Academy and the non-Academy groups) have an array of these characteristics associated with the highest likelihood of dropping out. Percent change is the impact divided by the non-Academy group average. Impact per enrollee is defined as the impact divided by the difference in the percentage of Academy and non-Academy group members ever enrolled in a Career Academy. It is italicized because its calculation does not involve a direct comparison of Academy and non-Academy students. 1This measure includes illegal drug use in the past 2 weeks, breaking the law (other than traffic violations) in the past 2 weeks, current gang membership, and any arrests or convictions in the past year.

-93-
Career Academies Evaluation
Exhibit 5.1-LR
Academy Non-Academy Percent Impact perOutcome Group Group Impact Change Enrollee
Years 1-4
Ever employed (%) 97.9 96.8 1.2 0.0 1.2 1.6Ever employed full-time1 (%) 92.4 85.6 6.7 ** 7.9 9.1Months employed 35.9 36.2 -0.3 0.0 -0.8 -0.4Months employed full-time 25.8 24.3 1.6 0.0 6.5 2.1Average monthly earnings ($) 1,013.89 987.10 26.78 0.0 2.7 36.13Average weekly hours worked 27.7 26.6 1.1 0.0 3.9 1.4Average hourly wage ($) 8.95 8.63 0.32 0.0 3.8 0.43Total number of jobs held 3.1 3.1 0.0 0.0 -0.9 0.0Average job duration, in months 16.2 16.5 -0.2 0.0 -1.5 -0.3
Year 1
Ever employed (%) 80.6 85.5 -4.8 0.0 -5.7 -6.5Ever employed full-time1 (%) 60.4 62.7 -2.4 0.0 -3.8 -3.2Months employed 7.5 8.1 -0.6 0.0 -7.5 -0.8Months employed full-time 5.1 5.3 -0.2 0.0 -4.3 -0.3Average monthly earnings ($) 664.38 733.80 -69.42 0.0 -9.5 -93.66Average weekly hours worked 21.7 22.9 -1.3 0.0 -5.5 -1.7Average hourly wage ($) 6.20 6.45 -0.24 0.0 -3.8 -0.32
Year 2
Ever employed (%) 90.6 90.8 -0.2 0.0 -0.2 -0.2Ever employed full-time1 (%) 70.6 69.9 0.7 0.0 1.0 1.0Months employed 9.0 9.1 0.0 0.0 -0.2 0.0Months employed full-time 6.3 6.1 0.2 0.0 3.9 0.3Average monthly earnings ($) 915.76 931.56 -15.80 0.0 -1.7 -21.32Average weekly hours worked 27.8 26.9 0.9 0.0 3.5 1.3Average hourly wage ($) 7.50 7.67 -0.17 0.0 -2.3 -0.23
Year 3
Ever employed (%) 92.1 90.4 1.7 0.0 1.9 2.3Ever employed full-time1 (%) 79.0 72.5 6.5 0.0 8.9 8.7Months employed 9.6 9.3 0.3 0.0 3.3 0.4Months employed full-time 7.2 6.2 0.9 0.0 14.6 1.2Average monthly earnings ($) 1,150.24 1,062.94 87.30 0.0 8.2 117.78Average weekly hours worked 30.8 28.2 2.6 0.0 9.3 3.5Average hourly wage ($) 8.67 8.32 0.35 0.0 4.2 0.47
Sample size (N=376) 208 168(continued)
Year-by-Year Impacts on Employment and Earningsfor the Low-Risk Subgroup

-94-
Exhibit 5.1-LR (continued)
Academy Non-Academy Percent Impact perOutcome Group Group Impact Change Enrollee
Year 4
Ever employed (%) 92.2 91.8 0.4 0.0 0.4 0.5Ever employed full-time1 (%) 78.1 70.7 7.5 0.0 10.6 10.1Months employed 9.8 9.7 0.0 0.0 0.2 0.0Months employed full-time 7.5 6.7 0.8 0.0 11.3 1.0Average monthly earnings ($) 1,331.53 1,228.70 102.82 0.0 8.4 138.72Average weekly hours worked 30.8 28.8 2.0 0.0 6.8 2.6Average hourly wage ($) 9.84 9.36 0.48 0.0 5.1 0.65
Last Quarter
Ever employed (%) 85.4 85.3 0.1 0.0 0.1 0.2Ever employed full-time1 (%) 66.7 63.8 2.9 0.0 4.5 3.9Months employed 2.5 2.5 -0.1 0.0 -2.2 -0.1Months employed full-time 1.9 1.8 0.1 0.0 3.7 0.1Average monthly earnings ($) 1,395.55 1,326.93 68.62 0.0 5.2 92.58Average weekly hours worked 31.0 30.3 0.6 0.0 2.0 0.8Average hourly wage ($) 9.45 9.00 0.46 0.0 5.1 0.62
Sample size (N=376) 208 168
SOURCE: MDRC calculations from the Career Academies Evaluation Four-Year Post-High School Follow-Up Survey Database.
NOTES: Measures reflect a 48-month period ending in June of 2000, 2001, or 2002: the fourth year following scheduled high school graduation for each sample member. Estimates are regression-adjusted using maximum likelihood estimation, controlling for background characteristics. Standard errors are adjusted to account for the clustering of students within schools and random assignment years. Rounding may cause slight discrepancies in calculating differences. A two-tailed t-test was applied to differences between the Academy and non-Academy groups. Statistical significance levels are indicated as: *** = 1 percent; ** = 5 percent; * = 10 percent. The definition of risk subgroups involved identifying background characteristics that best predicted dropping out among students in the non-Academy group. Low-risk students (approximately 25 percent of both the Academy and the non-Academy groups) have an array of these characteristics associated with the lowest likelihood of dropping out. Percent change is the impact divided by the non-Academy group average. Impact per enrollee is defined as the impact divided by the difference in the percentage of Academy and non-Academy group members ever enrolled in a Career Academy. It is italicized because its calculation does not involve a direct comparison of Academy and non-Academy students. See Exhibit 3.6 for the percentage of the Academy and the non-Academy group ever enrolled in a Career Academy. Respondents directly reported hours worked per week, weeks worked per month, and hourly wages. Earnings were calculated for each month by multiplying the wage by the hours worked times the number of weeks worked in that month. The maximum number of weeks in each month was capped at 4. Respondents reported their ending or most recent wages and hours worked for each job. This rate was assumed to apply to the entire duration of the job. Thus, if wages or hours were lower at the beginning of each job, these measures may overestimate true average wages and earnings. For respondents who were never employed during a given month, earnings, hours, and wages are included in these averages as zeros. 1Students were considered employed full-time if they reported working 30 or more hours per week.
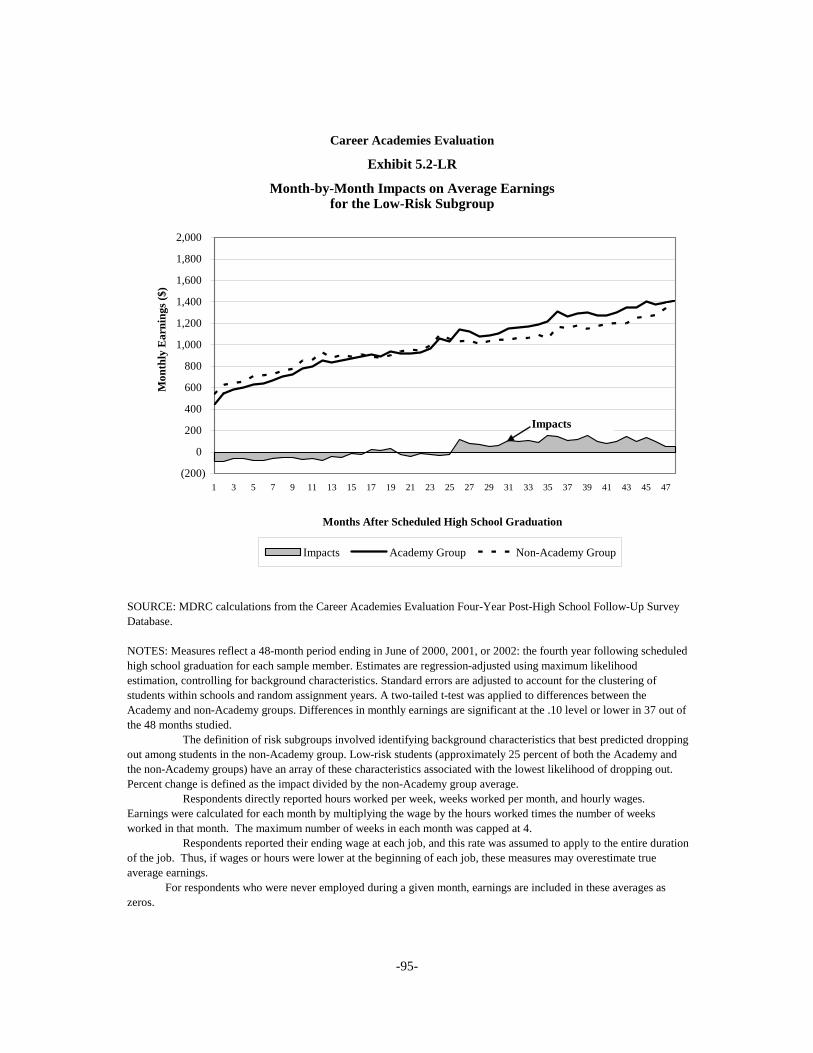
-95-
Career Academies Evaluation
Exhibit 5.2-LR
Month-by-Month Impacts on Average Earningsfor the Low-Risk Subgroup
(200)
0
200
400
600
800
1,000
1,200
1,400
1,600
1,800
2,000
1 3 5 7 9 11 13 15 17 19 21 23 25 27 29 31 33 35 37 39 41 43 45 47
Months After Scheduled High School Graduation
Mon
thly
Ear
ning
s ($)
Impacts Academy Group Non-Academy Group
SOURCE: MDRC calculations from the Career Academies Evaluation Four-Year Post-High School Follow-Up Survey Database.
NOTES: Measures reflect a 48-month period ending in June of 2000, 2001, or 2002: the fourth year following scheduled high school graduation for each sample member. Estimates are regression-adjusted using maximum likelihood estimation, controlling for background characteristics. Standard errors are adjusted to account for the clustering of students within schools and random assignment years. A two-tailed t-test was applied to differences between the Academy and non-Academy groups. Differences in monthly earnings are significant at the .10 level or lower in 37 out of the 48 months studied. The definition of risk subgroups involved identifying background characteristics that best predicted dropping out among students in the non-Academy group. Low-risk students (approximately 25 percent of both the Academy and the non-Academy groups) have an array of these characteristics associated with the lowest likelihood of dropping out. Percent change is defined as the impact divided by the non-Academy group average. Respondents directly reported hours worked per week, weeks worked per month, and hourly wages. Earnings were calculated for each month by multiplying the wage by the hours worked times the number of weeks worked in that month. The maximum number of weeks in each month was capped at 4. Respondents reported their ending wage at each job, and this rate was assumed to apply to the entire duration of the job. Thus, if wages or hours were lower at the beginning of each job, these measures may overestimate true average earnings. For respondents who were never employed during a given month, earnings are included in these averages as zeros.
Impacts

-96-
Career Academies Evaluation
Exhibit 5.3-LR
Academy Non-Academy Percent Impact perOutcome Group Group Impact Change Enrollee
Ever enrolled in a Career Academyduring high school (%) 86.0 11.9 74.1 *** -- --
Was enrolled in a Career Academyat the end of scheduled grade 12 (%) 65.3 10.3 55.1 *** -- --
High school completion status (%)
Earned high school diploma or GED 100.0 99.4 0.6 0.0 0.6 0.8
Earned high school diploma 94.9 97.5 -2.6 0.0 -2.7 -3.5On-time graduate1 89.2 91.1 -1.9 0.0 -2.1 -2.6Late graduate 5.7 6.4 -0.7 0.0 -10.9 -0.9
Earned a GED 5.0 1.8 3.2 0.0 174.8 4.3
Post-secondary education enrollment2 (%)
Ever enrolled in post-secondary education 93.7 91.4 2.3 0.0 2.6 3.1
Highest post-secondary education enrollmentFour-year college 46.9 47.0 -0.1 0.0 -0.3 -0.2Two-year college 37.8 34.7 3.0 0.0 8.8 4.1Skills training, technical or trade school 9.0 9.5 -0.5 0.0 -4.8 -0.6
Months enrolled in post-secondary education 30.2 31.5 -1.3 0.0 -4.0 -1.7
Highest credential completed or in progress3 (%)
Any post-secondary credential 68.0 69.1 -1.1 0.0 -1.6 -1.5Completed 25.9 23.8 2.2 0.0 9.1 2.9In progress 42.1 45.5 -3.4 0.0 -7.5 -4.6
Bachelor's degree 31.6 37.8 -6.1 0.0 -16.2 -8.3Completed 6.8 4.2 2.5 0.0 59.6 3.4In progress 24.8 33.5 -8.7 * -25.9 -11.7
Associate's degree 22.0 16.3 5.6 0.0 34.4 7.6Completed 7.6 5.5 2.1 0.0 37.3 2.8In progress 14.0 10.7 3.3 0.0 31.2 4.5
Skills training certificate or license 14.9 15.2 -0.3 0.0 -1.9 -0.4Completed 11.5 13.8 -2.3 0.0 -16.7 -3.1In progress 3.3 1.3 2.0 0.0 155.3 2.7
Years of schooling completed4 13.3 13.4 -0.1 0.0 -0.4 -0.1
Sample size (N=376) 208 168(continued)
Impacts on Educational Attainmentfor the Low-Risk Subgroup

-97-
Exhibit 5.3-LR (continued)
SOURCE: MDRC calculations from the Career Academies Evaluation Four-Year Post-High School Follow-Up Survey Database.
NOTES: Unless otherwise indicated, statuses reflect a 48-month period ending in June of 2000, 2001, or 2002: the fourth year following scheduled high school graduation for each sample member. Estimates are regression-adjusted using maximum likelihood estimation, controlling for background characteristics. Standard errors are adjusted to account for the clustering of students within schools and random assignment years. Rounding may cause slight discrepancies in calculating sums and differences. A two-tailed t-test was applied to differences between the Academy and non-Academy groups. Statistical significance levels are indicated as: *** = 1 percent; ** = 5 percent; * = 10 percent. The definition of risk subgroups involved identifying background characteristics that best predicted dropping out among students in the non-Academy group. Low-risk students (approximately 25 percent of both the Academy and the non-Academy groups) have an array of these characteristics associated with the lowest likelihood of dropping out. Percent change is the impact divided by the non-Academy group average. Impact per enrollee is defined as the impact divided by the difference in the percentage of Academy and non-Academy group members ever enrolled in a Career Academy. It is italicized because its calculation does not involve a direct comparison of Academy and non-Academy students. 1Students were considered on-time graduates if they graduated in June or earlier of the year they were scheduled to graduate. 2Students must have earned a high school diploma or GED to be considered enrolled in a post-secondary education program. 4Years of school completed was calculated by assigning 12 years to a completed high school diploma or GED, 14 years to an associate's or 16 years to a completed bachelor's degree. For those who did not complete an associate's or a bachelor's degree, years of school completed was calculated as 12 plus the percentage of the degree completed through the end of the follow-up period. For those who did not complete a high school diploma or a GED, years of school completed was calculated as a percentage of the 12 years given for a completed high school diploma or a GED.

-98-
Career Academies Evaluation
Exhibit 5.4-LRYear-by-Year Impacts on Months Spent Attending School or Working
for the Low-Risk Subgroup
2.8 2.8 3.03.8
4.8
5.25.9
2.9
1.4 1.5
4.53.7
2.72.7
5.36.3 6.2
5.96.3
2.3
2.2 2.01.5 1.9
0
1
2
3
4
5
6
7
8
9
10
11
12
Attending school only
Working and attending school
Working only
SOURCE: MDRC calculations from the Career Academies Evaluation Four-Year Post-High School Follow-Up Survey Database.
NOTES: All measures reflect the average number of months spent in each status during each year of the 48-month follow-up period ending in June of 2000, 2001, or 2002: the fourth year following scheduled high school graduation for each sample member. Estimates are regression-adjusted using maximum likelihood estimation, controlling for background characteristics. Standard errors are adjusted to account for the clustering of students within schools and random assignment years. Rounding may cause slight discrepancies in calculating sums and differences. A two-tailed t-test was applied to differences between the Academy and non-Academy groups. The difference between total months in any activity in year 4 was significant at .1 or lower. The definition of risk subgroups involved identifying background characteristics that best predicted dropping out among students in the non-Academy group. Low-risk students (approximately 25 percent of both the Academy and the non-Academy groups) have an array of these characteristics associated with the lowest likelihood of dropping out.
Num
ber
of M
onth
s
10.4
Year 1 Year 2 Year 3 Year 4
11.2 11.0 11.1 11.2 11.110.4
11.2
Academy Group
Non-Academy Group
Academy Group
Academy Group
Non-Academy Group
Non-Academy Group
Non-Academy Group
Academy Group

-99-
Career Academies Evaluation
Exhibit 5.5-LR
Academy Non-Academy Percent Impact perOutcome (%) Group Group Impact Change Enrollee
Is a parent 27.2 18.7 8.5 * 45.3 11.5
Is a custodial single parent 14.4 10.2 4.2 0.0 40.5 5.6
Marital Status Married 17.6 15.6 2.0 0.0 12.6 2.7Single 78.2 82.0 -3.8 0.0 -4.6 -5.1Divorced, separated, or widowed 4.3 2.5 1.8 0.0 74.3 2.5
Lives with parent(s) or guardian(s) 51.9 57.3 -5.4 0.0 -9.5 -7.3
Ever gone without health insurance in past year 27.2 27.8 -0.5 0.0 -2.0 -0.7
Received TANF or cash assistance in past year 4.2 2.6 1.6 0.0 63.2 2.2
Received food stamps in the past year 6.4 5.2 1.2 0.0 22.2 1.6
Registered to vote 67.0 65.5 1.5 0.0 2.3 2.0
Any recent illegal or drug-related activity1 4.1 1.5 2.7 0.0 181.0 3.6
Sample size (N=376) 208 168
Impacts on Family Formation, Public Assistance, and Behaviorsfor the Low-Risk Subgroup
SOURCE: MDRC calculations from the Career Academies Evaluation Four-Year Post-High School Follow-Up Survey Database.
NOTES: Unless otherwise indicated, statuses reflect a 48-month period ending in June of 2000, 2001, or 2002 the fourth year following scheduled graduation. Estimates are regression-adjusted using maximum likelihood estimation, controlling for background characteristics. Standard errors are adjusted to account for the clustering of students within schools and random assignment years. Rounding may cause slight discrepancies in calculating differences. A two-tailed t-test was applied to differences between the Academy and non-Academy groups. Statistical significance levels are indicated as: *** = 1 percent; ** = 5 percent; * = 10 percent. The definition of risk subgroups involved identifying background characteristics that best predicted dropping out among students in the non-Academy group. Low-risk students (approximately 25 percent of both the Academy and the non-Academy groups) have an array of these characteristics associated with the lowest likelihood of dropping out. Percent change is the impact divided by the non-Academy group average. Impact per enrollee is defined as the impact divided by the difference in the percentage of Academy and non-Academy group members ever enrolled in a Career Academy. It is italicized because its calculation does not involve a direct comparison of Academy and non-Academy students. 1This measure includes illegal drug use in the past 2 weeks, breaking the law (other than traffic violations) in the past 2 weeks, current gang membership, and any arrests or convictions in the past year.

-100-
Career Academies Evaluation
Exhibit 5.1-MR
Academy Non-Academy Percent Impact perOutcome Group Group Impact Change Enrollee
Years 1-4
Ever employed (%) 98.8 97.6 1.2 0.0 1.2 1.4Ever employed full-time1 (%) 95.9 94.6 1.4 0.0 1.5 1.7Months employed 37.4 35.5 1.9 * 5.3 2.3Months employed full-time 30.5 28.3 2.2 * 7.6 2.6Average monthly earnings ($) 1,171.31 1,030.08 141.23 ** 13.7 170.59Average weekly hours worked 31.1 28.6 2.5 ** 8.7 3.0Average hourly wage ($) 9.22 8.69 0.53 ** 6.1 0.64Total number of jobs held 3.1 3.2 0.0 0.0 -1.0 0.0Average job duration, in months 16.0 15.5 0.5 0.0 3.4 0.6
Year 1
Ever employed (%) 89.1 81.3 7.7 *** 9.5 9.3Ever employed full-time1 (%) 74.0 67.3 6.7 * 9.9 8.1Months employed 8.4 7.6 0.8 ** 11.0 1.0Months employed full-time 6.2 5.7 0.5 0.0 8.6 0.6Average monthly earnings ($) 855.99 704.75 151.24 *** 21.5 182.68Average weekly hours worked 26.3 23.2 3.1 ** 13.4 3.7Average hourly wage ($) 7.15 6.04 1.11 *** 18.4 1.34
Year 2
Ever employed (%) 92.0 91.7 0.3 0.0 0.3 0.4Ever employed full-time1 (%) 81.2 78.4 2.8 0.0 3.5 3.3Months employed 9.5 9.0 0.5 0.0 5.4 0.6Months employed full-time 7.6 7.1 0.6 0.0 8.0 0.7Average monthly earnings ($) 1,128.96 964.71 164.25 ** 17.0 198.39Average weekly hours worked 31.4 28.9 2.5 * 8.6 3.0Average hourly wage ($) 8.08 7.60 0.49 * 6.4 0.59
Year 3
Ever employed (%) 93.9 91.5 2.4 0.0 2.6 2.9Ever employed full-time1 (%) 84.2 79.8 4.5 0.0 5.6 5.4Months employed 9.6 9.5 0.2 0.0 2.0 0.2Months employed full-time 8.2 7.6 0.6 * 8.3 0.8Average monthly earnings ($) 1,278.19 1,152.52 125.67 0.0 10.9 151.79Average weekly hours worked 33.2 31.0 2.2 0.0 7.0 2.6Average hourly wage ($) 8.86 8.32 0.54 * 6.5 0.65
Sample size (N=722) 385 337(continued)
Year-by-Year Impacts on Employment and Earningsfor the Medium-Risk Subgroup

-101-
Exhibit 5.1-MR (continued)
Academy Non-Academy Percent Impact perOutcome Group Group Impact Change Enrollee
Year 4
Ever employed (%) 91.7 92.3 -0.7 0.0 -0.7 -0.8Ever employed full-time1 (%) 85.8 83.1 2.7 0.0 3.3 3.3Months employed 9.8 9.5 0.4 0.0 3.8 0.4Months employed full-time 8.4 8.0 0.5 0.0 5.8 0.6Average monthly earnings ($) 1,421.97 1,301.85 120.11 0.0 9.2 145.08Average weekly hours worked 33.5 31.4 2.2 0.0 6.9 2.6Average hourly wage ($) 9.64 9.42 0.22 0.0 2.3 0.27
Last Quarter
Ever employed (%) 84.0 82.6 1.4 0.0 1.7 1.7Ever employed full-time1 (%) 75.6 71.2 4.4 0.0 6.2 5.3Months employed 2.4 2.4 0.0 0.0 1.1 0.0Months employed full-time 2.1 2.0 0.1 0.0 4.4 0.1Average monthly earnings ($) 1,464.00 1,394.51 69.49 0.0 5.0 83.94Average weekly hours worked 33.1 31.7 1.4 0.0 4.3 1.7Average hourly wage ($) 9.34 9.00 0.33 0.0 3.7 0.40
Sample size (N=722) 385 337
SOURCE: MDRC calculations from the Career Academies Evaluation Four-Year Post-High School Follow-Up Survey Database.
NOTES: Measures reflect a 48-month period ending in June of 2000, 2001, or 2002: the fourth year following scheduled high school graduation for each sample member. Estimates are regression-adjusted using maximum likelihood estimation, controlling for background characteristics. Standard errors are adjusted to account for the clustering of students within schools and random assignment years. Rounding may cause slight discrepancies in calculating differences. A two-tailed t-test was applied to differences between the Academy and non-Academy groups. Statistical significance levels are indicated as: *** = 1 percent; ** = 5 percent; * = 10 percent. The definition of risk subgroups involved identifying background characteristics that best predicted dropping out among students in the non-Academy group. Medium-risk students (approximately 50 percent of both the Academy and the non-Academy groups) have an array of these characteristics associated with neither a particularly low nor particularly high likelihood of dropping out. Percent change is the impact divided by the non-Academy group average. Impact per enrollee is defined as the impact divided by the difference in the percentage of Academy and non-Academy group members ever enrolled in a Career Academy. It is italicized because its calculation does not involve a direct comparison of Academy and non-Academy students. See Exhibit 3.6 for the percentage of the Academy and the non-Academy group ever enrolled in a Career Academy. Respondents directly reported hours worked per week, weeks worked per month, and hourly wages. Earnings were calculated for each month by multiplying the wage by the hours worked times the number of weeks worked in that month. The maximum number of weeks in each month was capped at 4. Respondents reported their ending or most recent wages and hours worked for each job. This rate was assumed to apply to the entire duration of the job. Thus, if wages or hours were lower at the beginning of each job, these measures may overestimate true average wages and earnings. For respondents who were never employed during a given month, earnings, hours, and wages are included in these averages as zeros. 1Students were considered employed full-time if they reported working 30 or more hours per week.

-102-
Career Academies Evaluation
Exhibit 5.2-MR
Month-by-Month Impacts on Average Earningsfor the Medium-Risk Subgroup
(200)
0
200
400
600
800
1,000
1,200
1,400
1,600
1,800
2,000
1 3 5 7 9 11 13 15 17 19 21 23 25 27 29 31 33 35 37 39 41 43 45 47
Months After Scheduled High School Graduation
Mon
thly
Ear
ning
s ($)
Impacts Academy Group Non-Academy Group
SOURCE: MDRC calculations from the Career Academies Evaluation Four-Year Post-High School Follow-Up Survey Database. NOTES: Measures reflect a 48-month period ending in June of 2000, 2001, or 2002: the fourth year following scheduled high school graduation for each sample member. Estimates are regression-adjusted using maximum likelihood estimation, controlling for background characteristics. Standard errors are adjusted to account for the clustering of students within schools and random assignment years. A two-tailed t-test was applied to differences between the Academy and non-Academy groups. Differences in monthly earnings are significant at the .10 level or lower in 37 out of the 48 months studied. The definition of risk subgroups involved identifying background characteristics that best predicted dropping out among students in the non-Academy group. Medium-risk students (approximately 50 percent of both the Academy and the non-Academy groups) have an array of these characteristics associated with neither a particularly low nor a particularly high likelihood of dropping out. Respondents directly reported hours worked per week, weeks worked per month, and hourly wages. Earnings were calculated for each month by multiplying the wage by the hours worked times the number of weeks worked in that month. The maximum number of weeks in each month was capped at 4. Respondents reported their ending wage at each job, and this rate was assumed to apply to the entire duration of the job. Thus, if wages or hours were lower at the beginning of each job, these measures may overestimate true average earnings. For respondents who were never employed during a given month, earnings are included in these averages as zeros.
Impacts

-103-
Career Academies Evaluation
Exhibit 5.3-MR
Academy Non-Academy Percent Impact perOutcome Group Group Impact Change Enrollee
Ever enrolled in a Career Academyduring high school (%) 88.8 6.0 82.8 *** -- --
Was enrolled in a Career Academyat the end of scheduled grade 12 (%) 55.9 3.2 52.7 *** -- --
High school completion status (%)
Earned high school diploma or GED 92.9 92.1 0.7 0.0 0.8 0.9
Earned high school diploma 82.0 85.2 -3.3 0.0 -3.8 -3.9On-time graduate1 74.2 74.0 0.2 0.0 0.3 0.3Late graduate 7.7 11.2 -3.5 0.0 -31.0 -4.2
Earned a GED 10.8 6.9 3.9 * 56.8 4.7
Post-secondary education enrollment2 (%)
Ever enrolled in post-secondary education 80.1 79.2 1.0 0.0 1.2 1.2
Highest post-secondary education enrollmentFour-year college 22.5 22.9 -0.4 0.0 -1.9 -0.5Two-year college 43.3 36.7 6.6 * 18.0 8.0Skills training, technical or trade school 14.6 19.7 -5.1 * -25.8 -6.2
Months enrolled in post-secondary education 22.3 20.6 1.7 0.0 8.4 2.1
Highest credential completed or in progress3 (%)
Any post-secondary credential 56.0 55.3 0.7 0.0 1.3 0.9Completed 26.3 30.8 -4.5 0.0 -14.6 -5.4In progress 29.9 24.9 5.1 0.0 20.4 6.1
Bachelor's degree 14.2 13.0 1.1 0.0 8.7 1.4Completed 0.7 3.3 -2.6 ** -77.9 -3.1In progress 13.4 9.8 3.6 0.0 37.0 4.4
Associate's degree 19.8 17.2 2.6 0.0 15.2 3.2Completed 5.8 4.7 1.1 0.0 23.9 1.3In progress 14.1 12.6 1.5 0.0 12.1 1.8
Skills training certificate or license 21.9 25.0 -3.1 0.0 -12.4 -3.8Completed 19.6 22.6 -3.0 0.0 -13.3 -3.6In progress 2.3 2.4 -0.1 0.0 -4.8 -0.1
Years of schooling completed4 12.6 12.6 0.0 0.0 0.2 0.0
Sample size (N=722) 385 337(continued)
Impacts on Educational Attainmentfor the Medium-Risk Subgroup

-104-
Exhibit 5.3-MR (continued)SOURCE: MDRC calculations from the Career Academies Evaluation Four-Year Post-High School Follow-Up Survey Database.
NOTES: Unless otherwise indicated, statuses reflect a 48-month period ending in June of 2000, 2001, or 2002: the fourth year following scheduled high school graduation for each sample member. Estimates are regression-adjusted using maximumlikelihood estimation, controlling for background characteristics. Standard errors are adjusted to account for the clustering of students within schools and random assignment years. Rounding may cause slight discrepancies in calculating sums and differences. A two-tailed t-test was applied to differences between the Academy and non-Academy groups. Statistical significance levels are indicated as: *** = 1 percent; ** = 5 percent; * = 10 percent. The definition of risk subgroups involved identifying background characteristics that best predicted dropping out among students in the non-Academy group. Medium-risk students (approximately 50 percent of both the Academy and the non-Academy groups) have an array of these characteristics associated with neither a particularly low nor a particularly high likelihood of dropping out. Percent change is the impact divided by the non-Academy group average. Impact per enrollee is defined as the impact divided by the difference in the percentage of Academy and non-Academy group members ever enrolled in a Career Academy. It is italicized because its calculation does not involve a direct comparison of Academy and non-Academy students. 1Students were considered on-time graduates if they graduated in June or earlier of the year they were scheduled to graduate. 2Students must have earned a high school diploma or GED to be considered enrolled in a post-secondary education program. 3A credential was considered "in progress" if the student reported attempting it in a program that he/she was currently attending (within three months of the end of the follow-up period) and expected to complete. 4Years of school completed was calculated by assigning 12 years to a completed high school diploma or GED, 14 years to an associate's or 16 years to a completed bachelor's degree. For those who did not complete an associate's or a bachelor's degree, years of school completed was calculated as 12 plus the percentage of the degree completed through the end of the follow-up period. For those who did not complete a high school diploma or a GED, years of school completed was calculated as a percentage of the 12 years given for a completed high school diploma or a GED.

-105-
Career Academies Evaluation
Exhibit 5.4-MRYear-by-Year Impacts on Months Spent Attending School or Working
for the Medium-Risk Subgroup
4.04.5
5.25.9
3.9
4.2 3.6
1.6
1.10.9
5.75.0
4.54.5
3.6
5.04.6
4.7 4.3
1.9
1.3
1.4
1.21.1
0
1
2
3
4
5
6
7
8
9
10
11
12
Attending school only
Working and attending school
Working only
SOURCE: MDRC calculations from the Career Academies Evaluation Four-Year Post-High School Follow-Up Survey Database.
NOTES: All measures reflect the average number of months spent in each status during each year of the 48-month follow-up period ending in June of 2000, 2001, or 2002: the fourth year following scheduled high school graduation for each sample member. Estimates are regression-adjusted using maximum likelihood estimation, controlling for background characteristics. Standard errors are adjusted to account for the clustering of students within schools and random assignment years. Rounding may cause slight discrepancies in calculating sums and differences. A two-tailed t-test was applied to differences between the Academy and non-Academy groups. The difference between total months in any activity in year 4 was significant at .1 or lower. The definition of risk subgroups involved identifying background characteristics that best predicted dropping out among students in the non-Academy group. Medium-risk students (approximately 50 percent of both the Academy and the non-Academy groups) have an array of these characteristics associated with neither a particularly low nor a particularly high likelihood of dropping out.
Num
ber
of M
onth
s
9.5
Year 1 Year 2 Year 3 Year 4
10.810.5
10.9 10.6 11.0
10.10.4
Academy Group
Non-Academy Group
Academy Group
Academy Group
Non-Academy Group
Non-Academy Group
Non-Academy Group
Academy Group

-106-
Exhibit 5.5-MR
Academy Non-Academy Percent Impact perOutcome (%) Group Group Impact Change Enrollee
Is a parent 34.7 37.3 -2.6 0.0 -7.0 -3.1
Is a custodial single parent 16.9 18.0 -1.1 0.0 -6.3 -1.4
Marital Status Married 19.1 20.4 -1.4 0.0 -6.7 -1.7Single 77.5 77.3 0.3 0.0 0.3 0.3Divorced, separated, or widowed 3.3 2.1 1.2 0.0 57.6 1.5
Lives with parent(s) or guardian(s) 49.4 49.9 -0.6 0.0 -1.1 -0.7
Ever gone without health insurance in past year 27.0 33.4 -6.5 * -19.3 -7.8
Received TANF or cash assistance in past year 7.2 7.3 -0.1 0.0 -0.8 -0.1
Received food stamps in the past year 11.3 8.7 2.6 0.0 30.3 3.2
Registered to vote 67.2 67.7 -0.6 0.0 -0.8 -0.7
Any recent illegal or drug-related activity1 5.1 4.7 0.4 0.0 9.3 0.5
Sample size (N=722) 385 337
Impacts on Family Formation, Public Assistance, and Behaviorsfor the Medium-Risk Subgroup
SOURCE: MDRC calculations from the Career Academies Evaluation Four-Year Post-High School Follow-Up Survey Database.
NOTES: Unless otherwise indicated, statuses were reported for the end of a 48-month period ending in June of 2000, 2001, or 2002: the fourth year following scheduled high school graduation. Estimates are regression-adjusted using maximum likelihood estimation, controlling for background characteristics. Standard errors are adjusted to account for the clustering of students within schools and random assignment years. Rounding may cause slight discrepancies in calculating differences. A two-tailed t-test was applied to differences between the Academy and non-Academy groups. Statistical significance levels are indicated as: *** = 1 percent; ** = 5 percent; * = 10 percent. The definition of risk subgroups involved identifying background characteristics that best predicted dropping out among students in the non-Academy group. Medium-risk students (approximately 50 percent of both the Academy and the non-Academy groups) have an array of these characteristics associated with neither a particularly low nor a particularly high likelihood of dropping out. Percent change is the impact divided by the non-Academy group average. Impact per enrollee is defined as the impact divided by the difference in the percentage of Academy and non-Academy group members ever enrolled in a Career Academy. It is italicized because its calculation does not involve a direct comparison of Academy and non-Academy students. See Exhibit 3.6. 1This measure includes illegal drug use in the past 2 weeks, breaking the law (other than traffic violations) in the past 2 weeks, current gang membership, and any arrests or convictions in the past year.