impactsof(surface(ozone(polluon( on(global(agriculture:( ·...
TRANSCRIPT
Impacts of Surface Ozone Pollu4on on Global Agriculture:
Present, Future Projec4ons, and Strategies to Reduce Damages
Denise L. Mauzerall
with Shiri Avnery, Larry Horowitz, Arlene Fiore, Junfeng Liu
AgMIP Global Workshop Columbia University
October 28, 2013
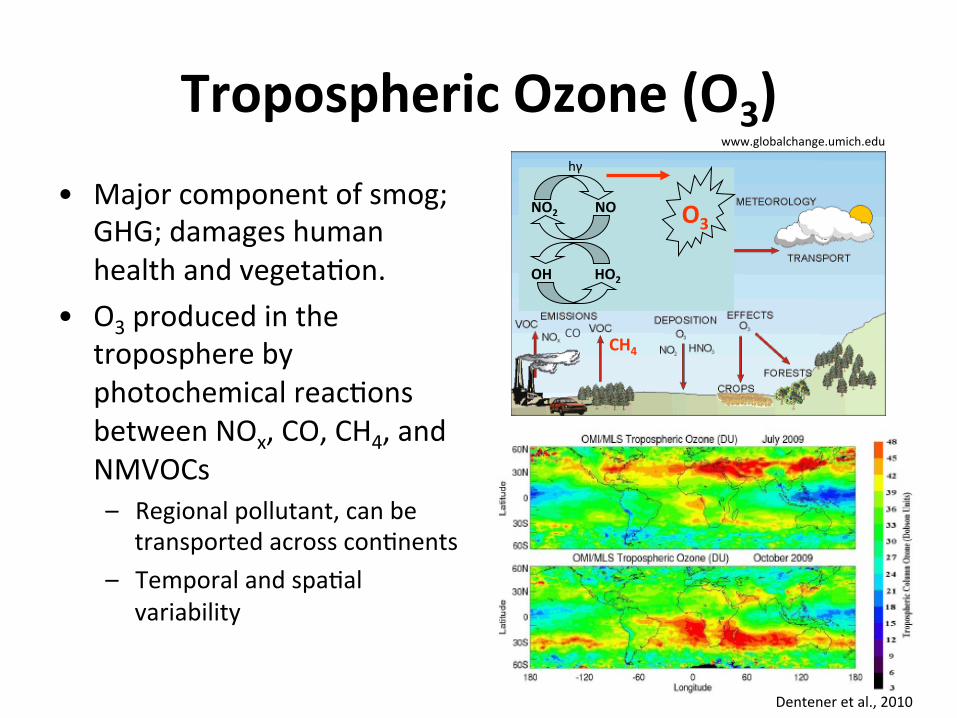
Tropospheric Ozone (O3) • Major component of smog;
GHG; damages human health and vegeta9on.
• O3 produced in the troposphere by photochemical reac9ons between NOx, CO, CH4, and NMVOCs – Regional pollutant, can be
transported across con9nents – Temporal and spa9al
variability
http://www.globalchange.umich.edu
Dentener et al., 2010
CH4
HO2 OH
NO NO2
CO
hγ
O3
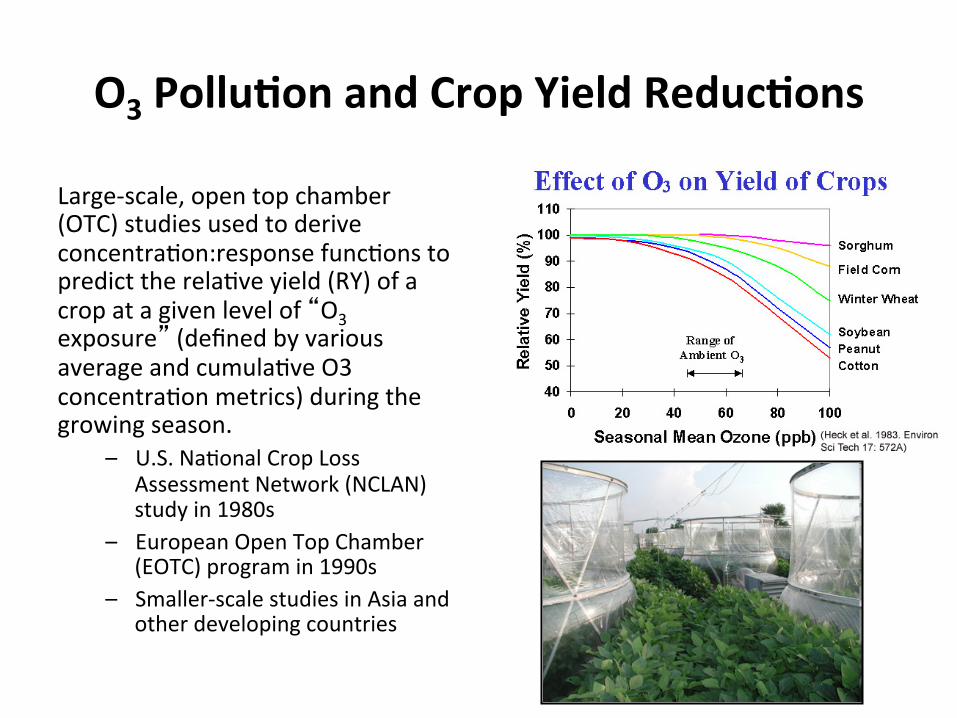
O3 Pollu4on and Crop Yield Reduc4ons
Large-‐scale, open top chamber (OTC) studies used to derive concentra9on:response func9ons to predict the rela9ve yield (RY) of a crop at a given level of “O3 exposure” (defined by various average and cumula9ve O3 concentra9on metrics) during the growing season.
– U.S. Na9onal Crop Loss Assessment Network (NCLAN) study in 1980s
– European Open Top Chamber (EOTC) program in 1990s
– Smaller-‐scale studies in Asia and other developing countries
Key Ques4ons 1. What are present crop losses due to O3 exposure?
2. What might future crop losses due to O3 exposure be given op4mis4c and pessimis4c trajectories of O3 precursor emissions?
3. How much can methane reduc4ons reduce surface O3 concentra9ons and hence protect crops while providing co-‐benefits for climate?
4. How much can agricultural produc9on be improved by choosing O3 resistant crop cul4vars?
5. How do O3-‐induced agricultural losses today and in the near future compare to projected impacts from climate change?
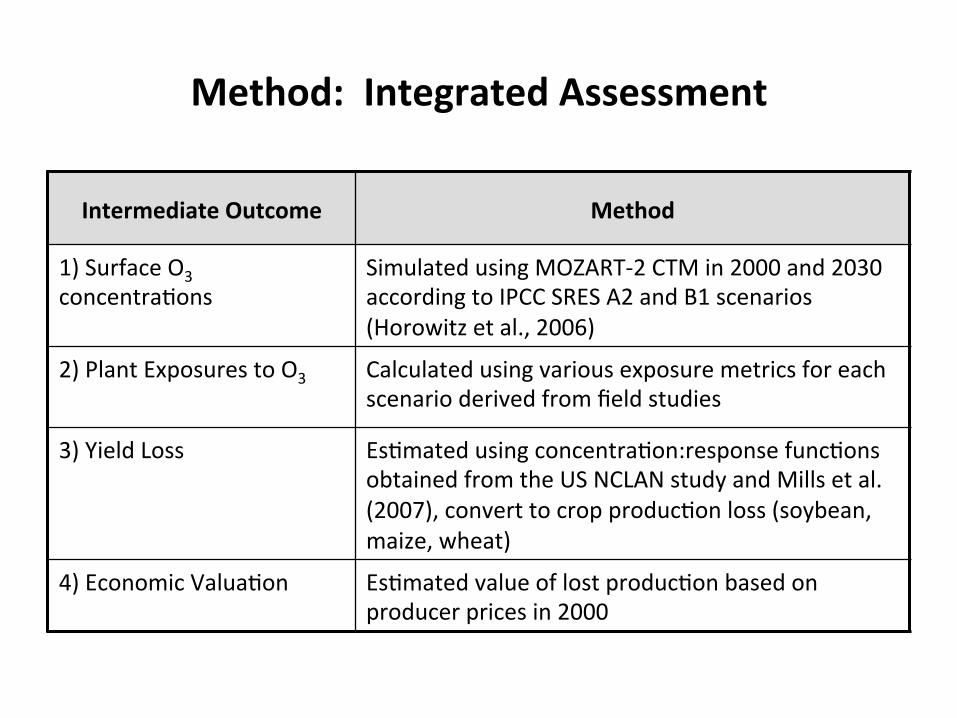
Method: Integrated Assessment
Intermediate Outcome Method
1) Surface O3 concentra9ons
Simulated using MOZART-‐2 CTM in 2000 and 2030 according to IPCC SRES A2 and B1 scenarios (Horowitz et al., 2006)
2) Plant Exposures to O3 Calculated using various exposure metrics for each scenario derived from field studies
3) Yield Loss Es9mated using concentra9on:response func9ons obtained from the US NCLAN study and Mills et al. (2007), convert to crop produc9on loss (soybean, maize, wheat)
4) Economic Valua9on Es9mated value of lost produc9on based on producer prices in 2000
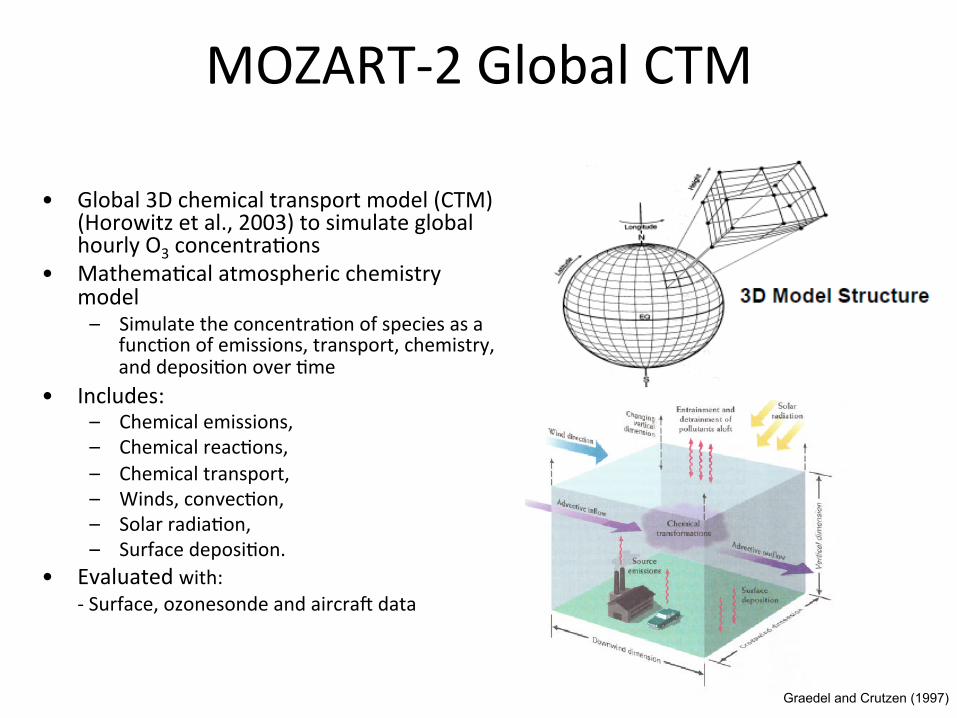
MOZART-‐2 Global CTM
• Global 3D chemical transport model (CTM) (Horowitz et al., 2003) to simulate global hourly O3 concentra9ons
• Mathema9cal atmospheric chemistry model – Simulate the concentra9on of species as a
func9on of emissions, transport, chemistry, and deposi9on over 9me
• Includes: – Chemical emissions, – Chemical reac9ons, – Chemical transport, – Winds, convec9on, – Solar radia9on, – Surface deposi9on.
• Evaluated with: -‐ Surface, ozonesonde and aircraf data
Graedel and Crutzen (1997)
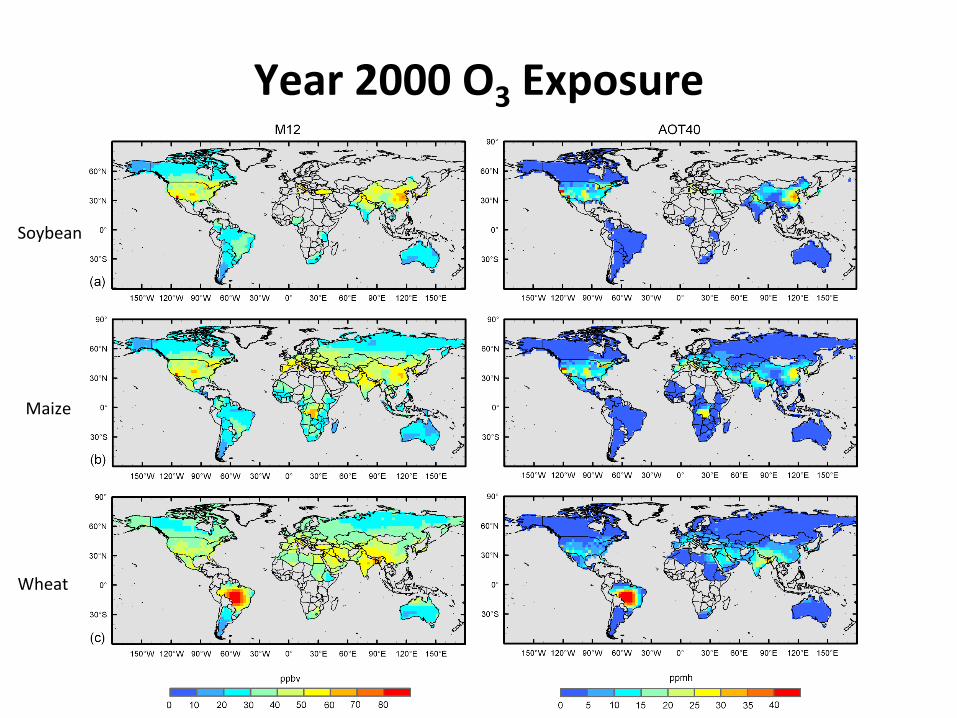
Year 2000 O3 Exposure
Soybean
Maize
Wheat

Yield Loss in 2000
Soybean
Maize
Wheat
Avnery et al., Atmospheric Environment 45 (2011), doi:10.1016/j.atmosenv.2010.11.045
• Global year 2000 yield losses 4-‐15% for wheat, 9-‐14% soybean, 2-‐6% for maize • Crop produc9on losses ~80-‐120 Mt worth $11-‐18 billion USD2000 annually

Total EL
0 1000 2000 3000 4000
U.S.
China
India
Iran
Canada
Pakistan
Turkey
Italy
Syria
Brazil
EL (Million USD)
AverageM12AOT40
Economic Losses from Reduced Grain Yields in 2000
NMVOC Emissions
050
100150200250
2000 2010 2020 2030Tg
/ yr
CH4 Emissions
0100200300400500600
2000 2010 2020 2030
Tg C
H4 / y
r
A2B1
NOx Emissions
050
100150200250
2000 2010 2020 2030
Tg N
O2 / y
r
CO Emissions
0250500750
100012501500
2000 2010 2020 2030
Tg C
O / yr
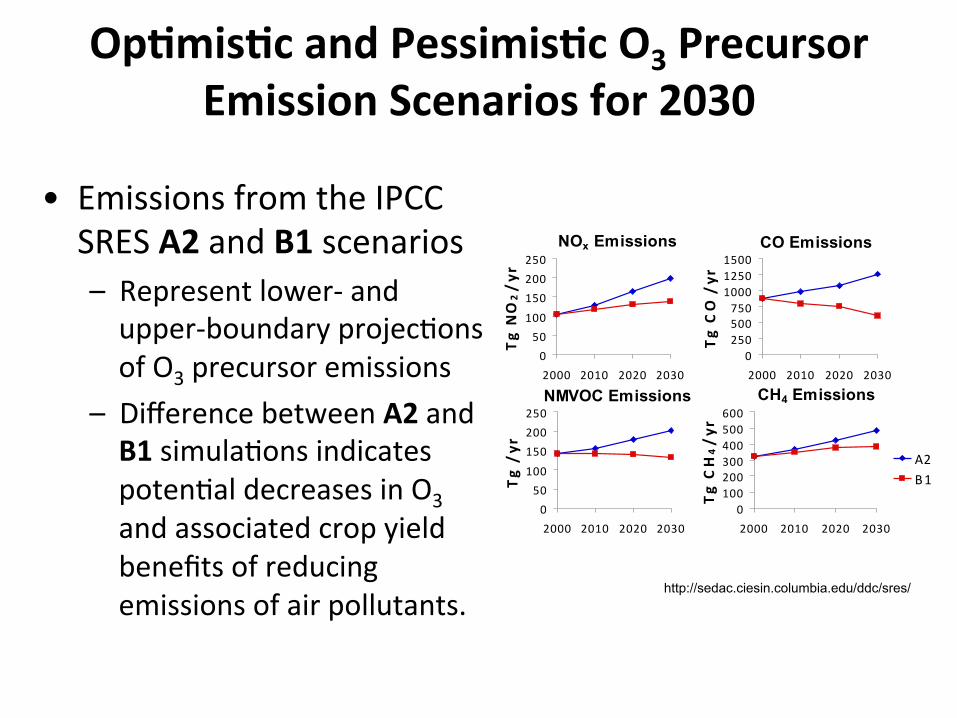
Op4mis4c and Pessimis4c O3 Precursor Emission Scenarios for 2030
• Emissions from the IPCC SRES A2 and B1 scenarios – Represent lower-‐ and upper-‐boundary projec9ons of O3 precursor emissions
– Difference between A2 and B1 simula9ons indicates poten9al decreases in O3 and associated crop yield benefits of reducing emissions of air pollutants.
http://sedac.ciesin.columbia.edu/ddc/sres/
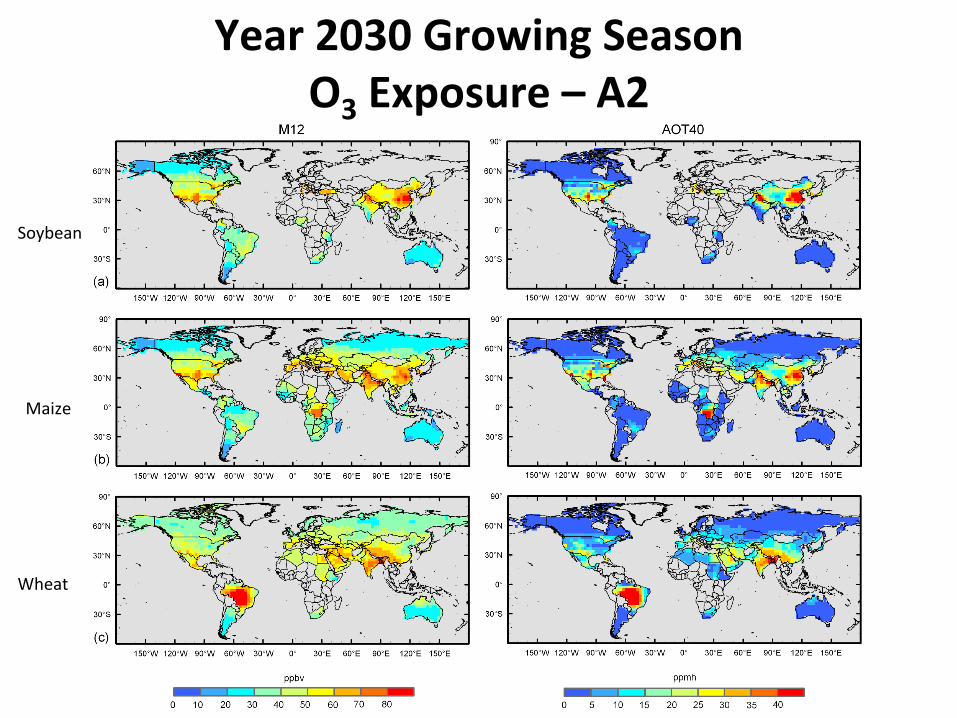
Year 2030 Growing Season O3 Exposure – A2
Soybean
Maize
Wheat

Yield Loss in 2030 (A2)
Soybean
Maize
Wheat
Avnery et al., Atmospheric Environment 45 (2011), doi:10.1016/j.atmosenv.2011.01.002
• 2030 A2 yield losses range from 5-‐26% (+2-‐10%) globally for wheat, 15-‐19% (+1-‐11%) for soybean, 4-‐9% for maize (+2-‐3%)
• Crop produc9on losses 120-‐230 Mt worth $17-‐35 USD2000 (+$6-‐17 billion) annually
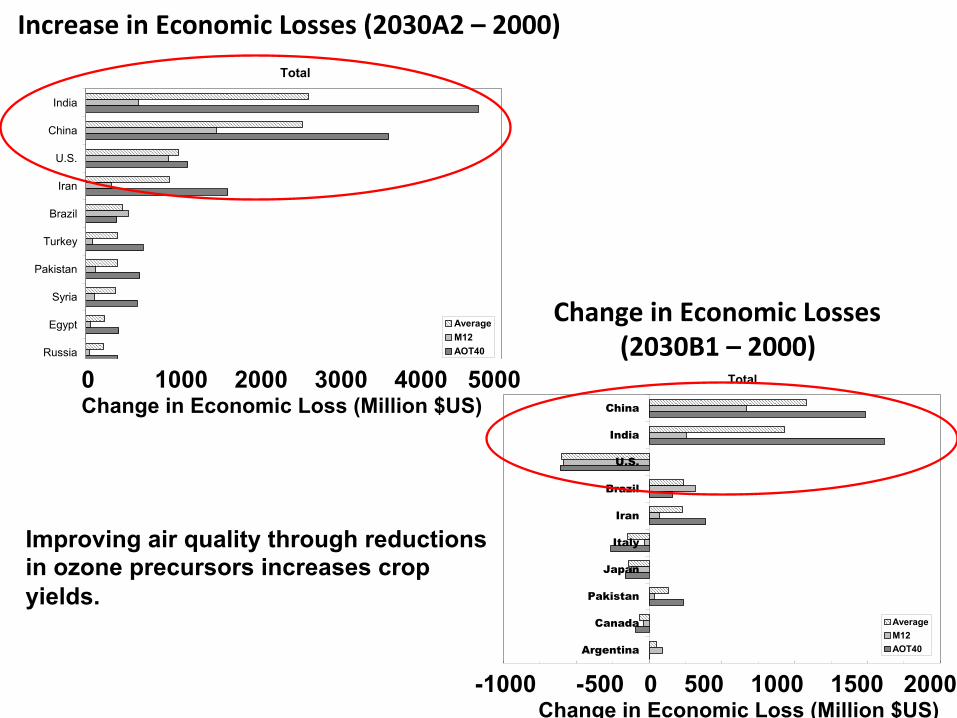
Total
0 1000 2000 3000 4000 5000
India
China
U.S.
Iran
Brazil
Turkey
Pakistan
Syria
Egypt
Russia
Change in EL (Million USD)
AverageM12AOT40
0 1000 2000 3000 4000 5000 Change in Economic Loss (Million $US)
Increase in Economic Losses (2030A2 – 2000)
Change in Economic Losses (2030B1 – 2000)
Total
-1000 -500 0 500 1000 1500 2000
China
India
U.S.
Brazil
Iran
Italy
Japan
Pakistan
Canada
Argentina
Change in EL (Million USD)
AverageM12AOT40
Improving air quality through reductions in ozone precursors increases crop yields.
-1000 -500 0 500 1000 1500 2000 Change in Economic Loss (Million $US)
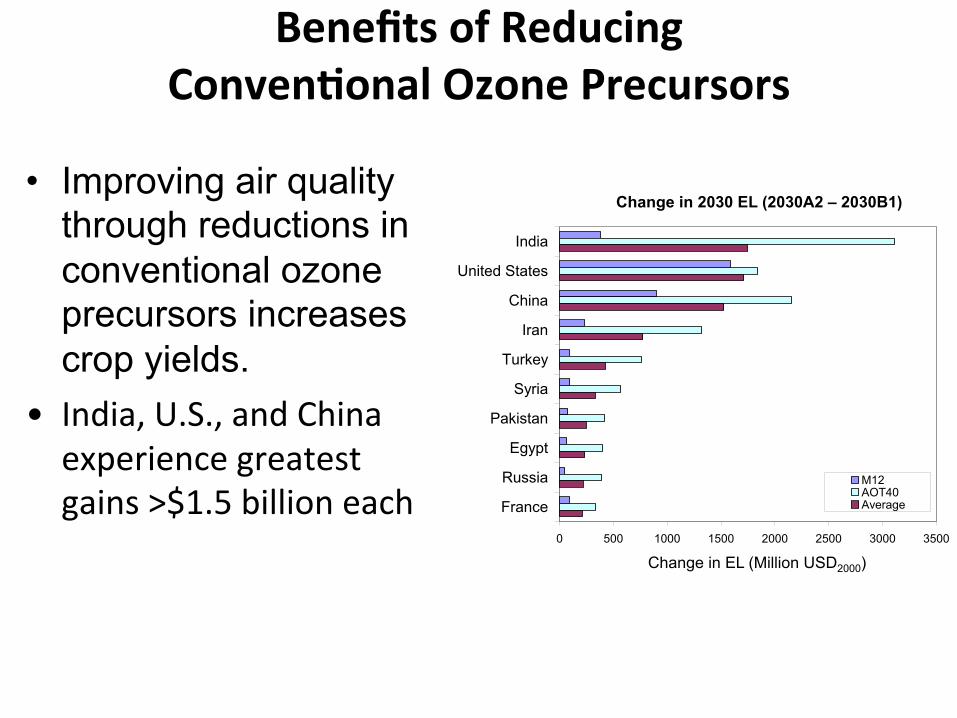
Benefits of Reducing Conven4onal Ozone Precursors
• Improving air quality through reductions in conventional ozone precursors increases crop yields.
• India, U.S., and China experience greatest gains >$1.5 billion each
Change in EL (Million USD2000) 0 500 1000 1500 2000 2500 3000 3500
India
United States
China
Iran
Turkey
Syria
Pakistan
Egypt
Russia
France
M12AOT40Average
Change in 2030 EL (2030A2 – 2030B1)
How much can Methane (CH4) Mi4ga4on or use of O3 Resistant Crop cul4vars Improve Crop
Produc4on?
Method: Same approach as part 1, but…
• Methane Mi9ga9on Benefits – 2030 CLE emissions scenario compared with 2030 CLE scenario with reduced methane emissions (2030 CH4-‐red scenario ).
• Crop Cul9var Selec9on Benefits – Use minimum-‐sensi9vity O3-‐response func9on for each crop and compare to median-‐sensi9vity results
– 2030 CLE scenario benefits of adapta9on only policy – 2030 CH4-‐red scenario benefits of both mi9ga9on & adapta9on policies.
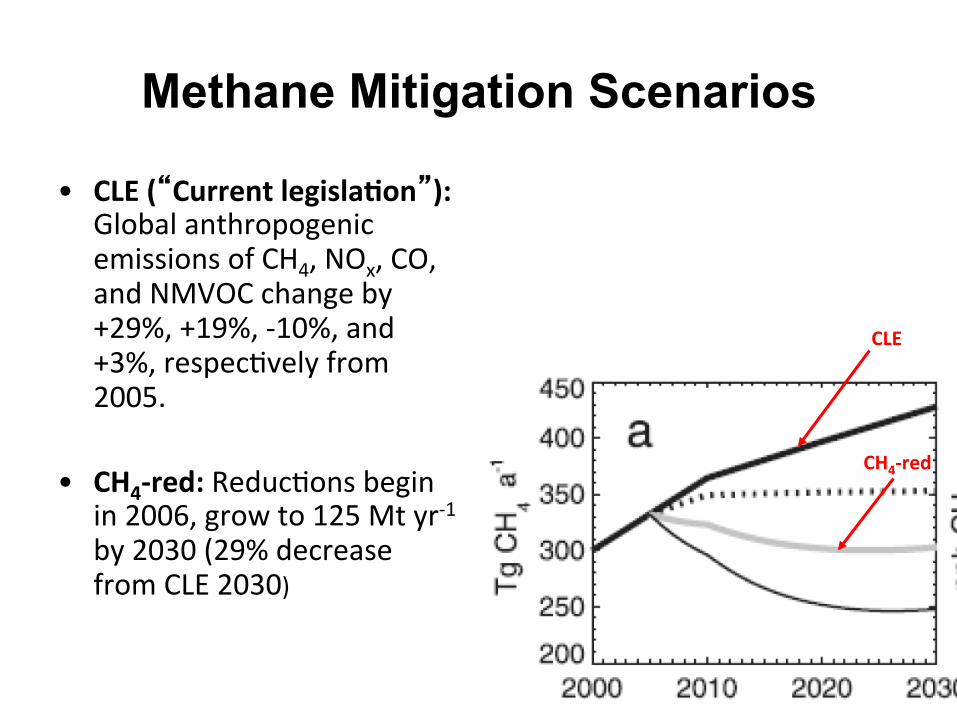
Methane Mitigation Scenarios
• CLE (“Current legisla4on”): Global anthropogenic emissions of CH4, NOx, CO, and NMVOC change by +29%, +19%, -‐10%, and +3%, respec9vely from 2005.
• CH4-‐red: Reduc9ons begin in 2006, grow to 125 Mt yr-‐1 by 2030 (29% decrease from CLE 2030)
CLE
CH4-‐red
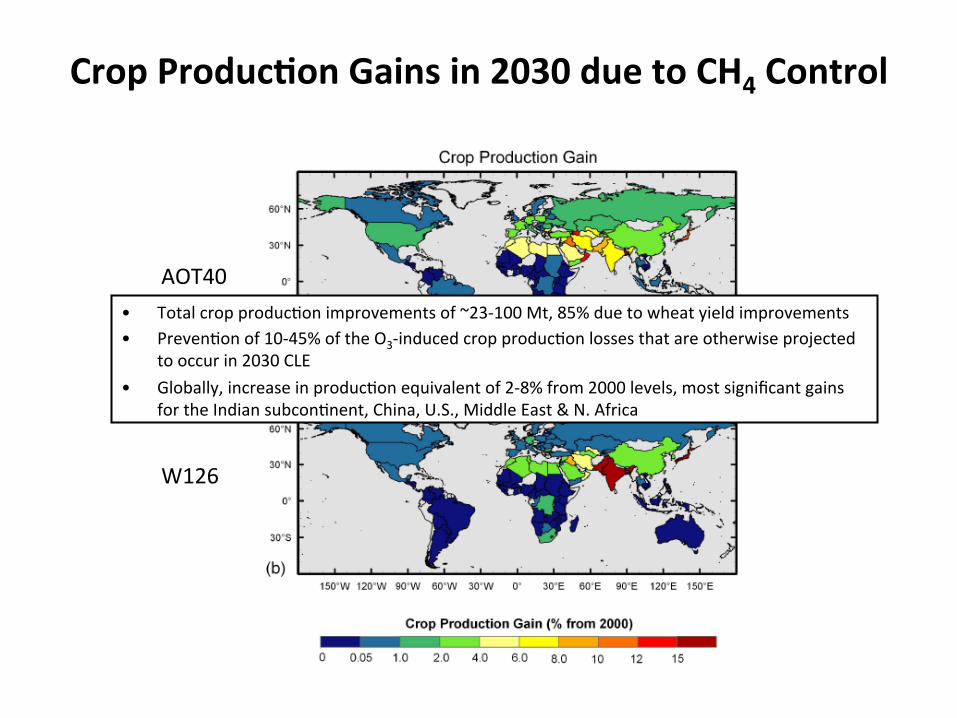
Crop Produc4on Gains in 2030 due to CH4 Control
AOT40
W126
• Total crop produc9on improvements of ~23-‐100 Mt, 85% due to wheat yield improvements • Preven9on of 10-‐45% of the O3-‐induced crop produc9on losses that are otherwise projected
to occur in 2030 CLE • Globally, increase in produc9on equivalent of 2-‐8% from 2000 levels, most significant gains
for the Indian subcon9nent, China, U.S., Middle East & N. Africa

Economic Gains in 2030 due to CH4 Control
AOT40
W126
• Crop produc9on gains due to CH4 mi9ga9on worth $3.5-‐15 billion • Significant regional variability, economic benefits concentrated in regions of
major agricultural produc9on (Indian subcon9nent, China, U.S.)
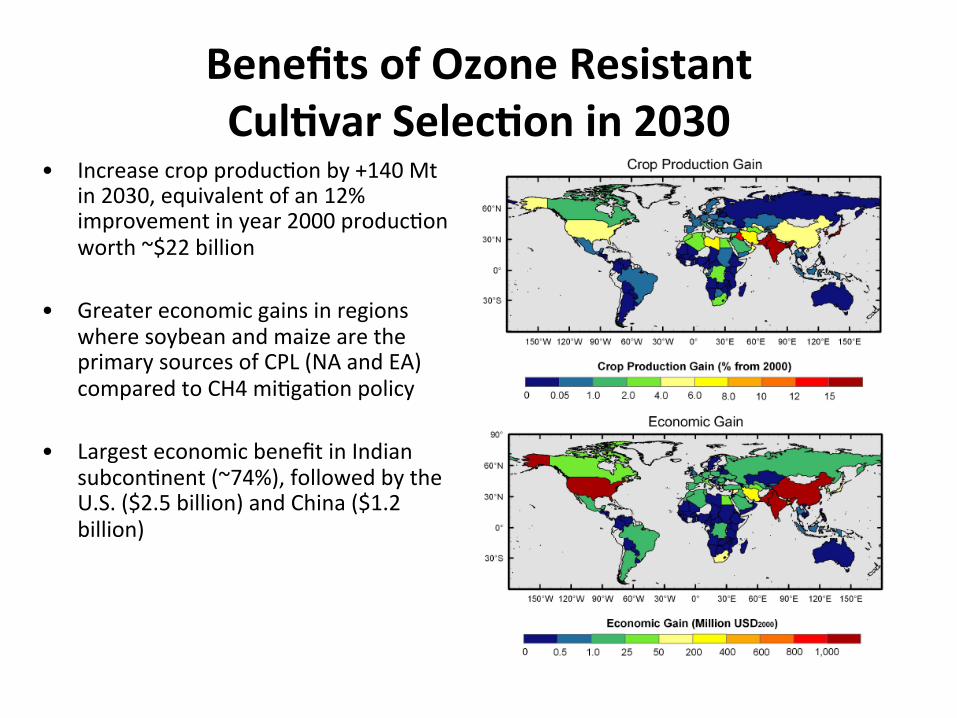
Benefits of Ozone Resistant Cul4var Selec4on in 2030
• Increase crop produc9on by +140 Mt in 2030, equivalent of an 12% improvement in year 2000 produc9on worth ~$22 billion
• Greater economic gains in regions where soybean and maize are the primary sources of CPL (NA and EA) compared to CH4 mi9ga9on policy
• Largest economic benefit in Indian subcon9nent (~74%), followed by the U.S. ($2.5 billion) and China ($1.2 billion)

Benefits of Combined Methane Mi4ga4on and Ozone Resistant Crop Cul4var Selec4on
• Lead to crop produc9on improvements of +170 Mt in 2030, equivalent +14% from year 2000 produc9on, worth $26 billion.
• Benefits to agriculture less than fully addi9ve.
• How do predicted O3 impacts on agriculture compare with those of climate change?
• Is agriculture in certain regions of the world at risk of nega9ve impacts from both O3 exposure and climate change?
Comparison of Impacts of Ozone Exposure and Climate Change
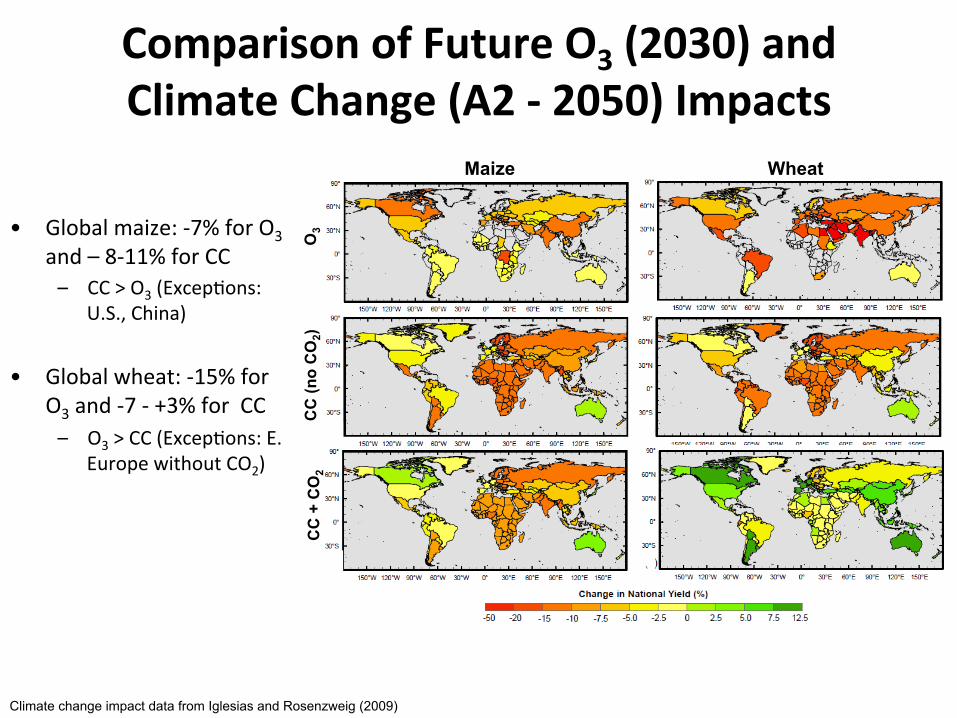
Comparison of Future O3 (2030) and Climate Change (A2 -‐ 2050) Impacts
• Global maize: -‐7% for O3
and – 8-‐11% for CC – CC > O3 (Excep9ons:
U.S., China)
• Global wheat: -‐15% for O3 and -‐7 -‐ +3% for CC – O3 > CC (Excep9ons: E.
Europe without CO2)
Climate change impact data from Iglesias and Rosenzweig (2009)
Maize Wheat
O3
CC
(no
CO
2)
CC
+ C
O2
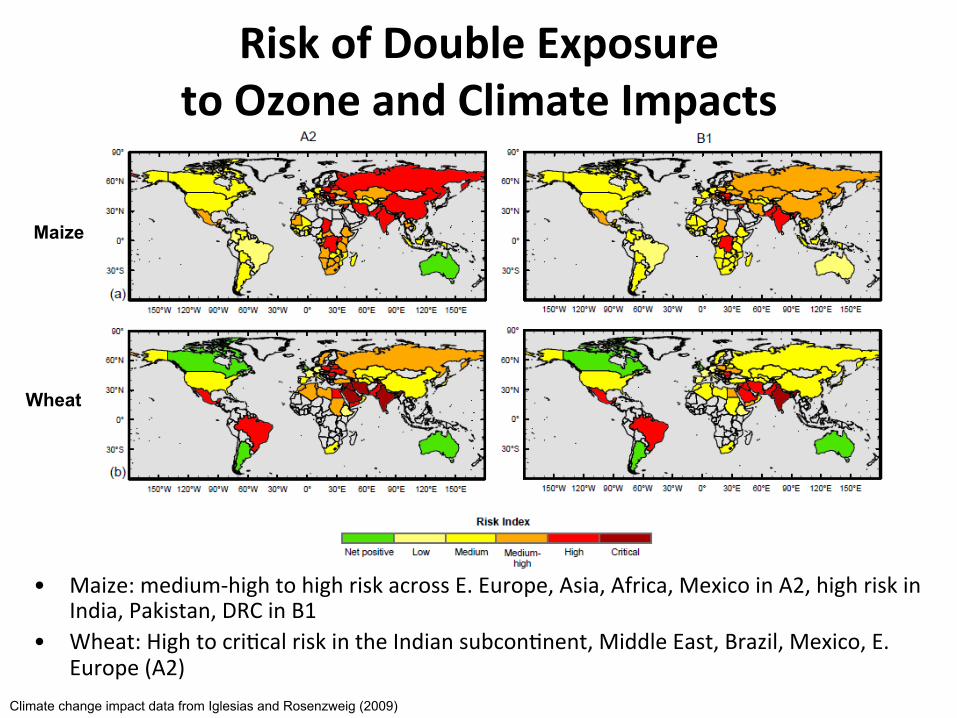
Risk of Double Exposure to Ozone and Climate Impacts
• Maize: medium-‐high to high risk across E. Europe, Asia, Africa, Mexico in A2, high risk in India, Pakistan, DRC in B1
• Wheat: High to cri9cal risk in the Indian subcon9nent, Middle East, Brazil, Mexico, E. Europe (A2)
Maize
Wheat
Climate change impact data from Iglesias and Rosenzweig (2009)
Conclusions • O3 exposure results in substan9al yield reduc9ons in
many parts of the world.
• Depending on future emissions of O3 precursors, global impacts could increase substan9ally.
• Opportuni9es to improve yields sustainably exist via reduc9on in short-‐lived O3 precursors and CH4 as well as through use of O3 resistant crop cul9vars.
• In the next couple of decades O3 impacts may exceed adverse impacts of climate change.
• Some regions will be par9cularly hard hit by both O3 pollu9on and climate change (eg. India, Middle East, Brazil, Eastern Europe, etc.).
Results summarized in two posters here and three papers
• Avnery, S, DL Mauzerall, J Liu, LW Horowitz. Global Crop Yield Reduc9ons due to Surface Ozone Exposure: 1. Year 2000 Crop Produc9on Losses and Economic Damage, Atmospheric Environment, 45, 2284-‐2296, 2011.
• Avnery, S, DL Mauzerall, J Liu, LW Horowitz. Global Crop Yield Reduc9ons due to Surface Ozone Exposure: 2. Year 2030 Poten9al Crop Produc9on Losses and Economic Damage under Two Scenarios of O3 Pollu9on, Atmospheric Environment, 45, 2297-‐2309, 2011.
• Avnery, S, DL Mauzerall, AM Fiore. Increasing global agricultural produc9on by reducing ozone damages via methane emission controls and ozone resistant cul9var selec9on, Global Change Biology, 19, 1285-‐1299, 2013.


Overview of Major Sources of Uncertainty • Simulated hourly O3 concentra9ons by a global CTM to predict O3
exposure • Metrics and CR rela9onships that were derived from OTC studies in the
U.S. and EU in the 1980s/90s applied globally due to the lack of similar large-‐scale studies elsewhere – Recent studies suggest current cul9vars are at least as sensi9ve to those
from which CR func9ons were derived (Morgan et al., 2006; Biswas et al., 2008; Emberson et al., 2009; Feng and Kobayashi, 2010; Zhu et al., 2011; EPA, 2011)
• For benefits of CH4 mi9ga9on, O3 reduc9ons will con9nue beyond 2030; benefits not included
• Changes in future produc9on or commodity prices not accounted for • No provision for farmer adapta9on to O3, but benefits of altering crop
calendars or watering regimes appear limited globally (Teixeira et al., 2011)
• Poten9al effect of climate change on stomatal conductance not accounted for, nor direct impact of climate change on crops
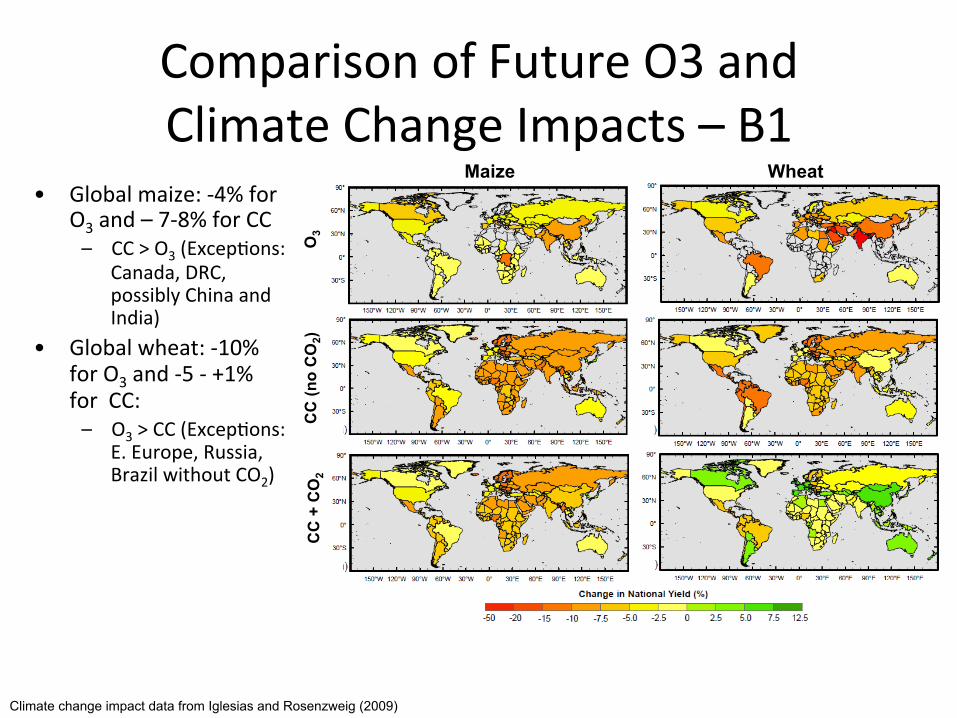
Comparison of Future O3 and Climate Change Impacts – B1
• Global maize: -‐4% for O3 and – 7-‐8% for CC – CC > O3 (Excep9ons:
Canada, DRC, possibly China and India)
• Global wheat: -‐10% for O3 and -‐5 -‐ +1% for CC: – O3 > CC (Excep9ons:
E. Europe, Russia, Brazil without CO2)
Climate change impact data from Iglesias and Rosenzweig (2009)
Wheat
O3
CC
(no
CO
2)
CC
+ C
O2
Maize