implementation of msfd in slovenia, 2011 - circabc strategy... · implementation of msfd in ....
TRANSCRIPT

Implementation of MSFD in Slovenia, 2011
Dr. Monika Peterlin and Špela PetelinInstitute for Water of the Republic of Slovenia (IWRS)
WG ESA MeetingBonn, October 2011

Content
• Organiosationla structure• Work plan and progress 2008-2015• Initial assessment• GES• Case study: maritime transport• Where are we in 2011?• Main problems• Way forward
Foto: UNIC-SUB, L. Fonda
Foto: OMEGA STUDIO, A. Primčič
Foto: OMEGA STUDIO, A. Primčič
Foto: OMEGA STUDIO, A. Primčič

Competent authority
• Ministry of the Environment and Spatial Planning (MESP)
• Link: http://www.mop.gov.si/
• Tasks: water protection, use and management, including marine waters
• Responsible for implementation of WFD, MSFD and other relevant legislation

Institutions involved
• Institute for water of the Republic of Slovenia (lead)
• Other institutions involved:– Environmental Agency of Slovenia– Marine Biology Station Piran (NIB-MBP)– Institute of the RS for Nature Conservation – Fisheries Research Institute– Biotechnical Faculty– Institute of Occupational Health– Other expert institutions

Work plan and progress 2008-2015
Task 2008 2009 2010 2011 2012 2013-2015
Work program
Institutional framework setting
Transposition
Initial assessment (Art.8)
GES and targets (Art. 9, 10)
Monitoring programme
Management measures
Data management on national level
Consultation
Regional cooperation
Planned Realised Partial realisation Not realised

MSFD operational scheme
Characteristics(Annex III, Table 1)
Pressures and impacts(Annex III, Table 2)
Socio-economic assessment
Initial assessment (art 8)
GES (art. 9(1))Selection of indicators
Targets (art 10)
Description ofenvironmnetal status, relevant pressures and
relevance of activities forthe society
Guidance
IA – Directive WG ESA - Guidance on SEAWG GES - Council decision (2010)
- TG reports on descriptors

1. Initial assessment
Physical, chemical & biologicalfeatures (Annex III, Table 1)
Pressures & Impacts (Annex III; Table 2)
Over-Fishing
Eutrophication
Traffic
Exploration
Shipping
Industries
Waste water
Tourism
Agriculture
Muuhh
Economic & social analysis(costs of degradation)
Eutrophication
Oil spilsOver - Fishing
Industrials TrafficAgriculture
ShippingMarine ProtectionArea
Sustainable Use
GES NON-GES
•Assessment of current status, impacts and pressures• Trends •Identification of problem areas and related activities
•Importance of marine services for the society•Relevant sectors•SE aspects, trends, objectives of the society

Where are we in autumn 2011?Socio-economy in the national strategy
GES and targets(Art 9, 10)
Program ofmeasures
Riskassessment
Consideration of SE concerns in
setting of targets
SE analysis of the use of marine
waters
SE analysis of the cost of
degradation
Initial assessment(Art 8)
Socio-economic (SE) content
SE aspects of measures
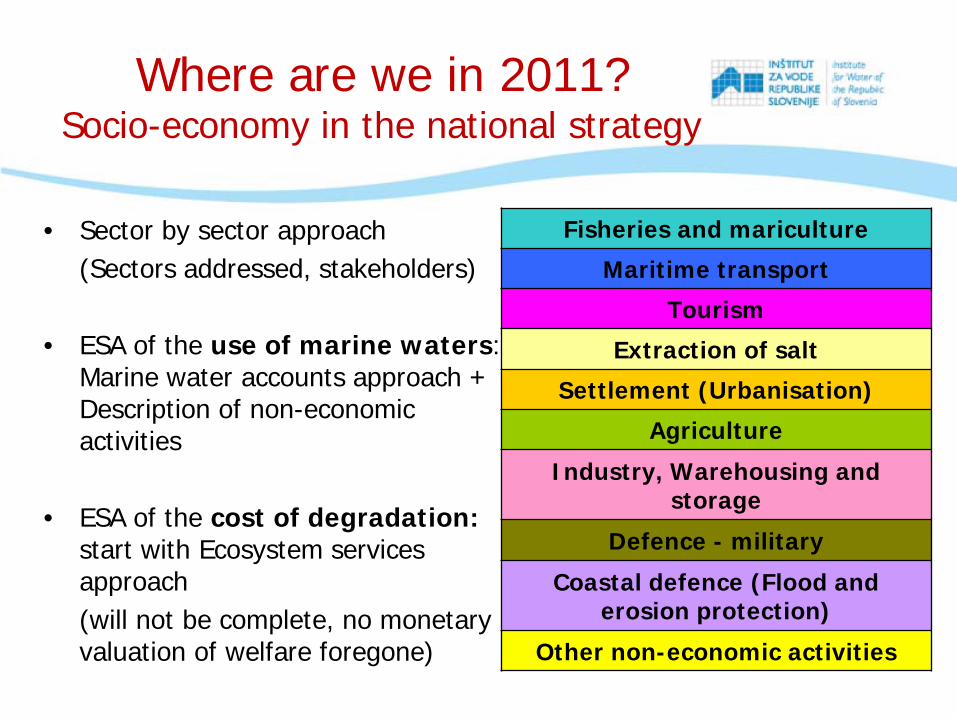
• Sector by sector approach (Sectors addressed, stakeholders)
• ESA of the use of marine waters: Marine water accounts approach +Description of non-economic activities
• ESA of the cost of degradation: start with Ecosystem services approach (will not be complete, no monetary valuation of welfare foregone)
Where are we in 2011?Socio-economy in the national strategy
Fisheries and mariculture
Maritime transport
Tourism
Extraction of salt
Settlement (Urbanisation)
Agriculture
Industry, Warehousing and storage
Defence - military
Coastal defence (Flood and erosion protection)
Other non-economic activities
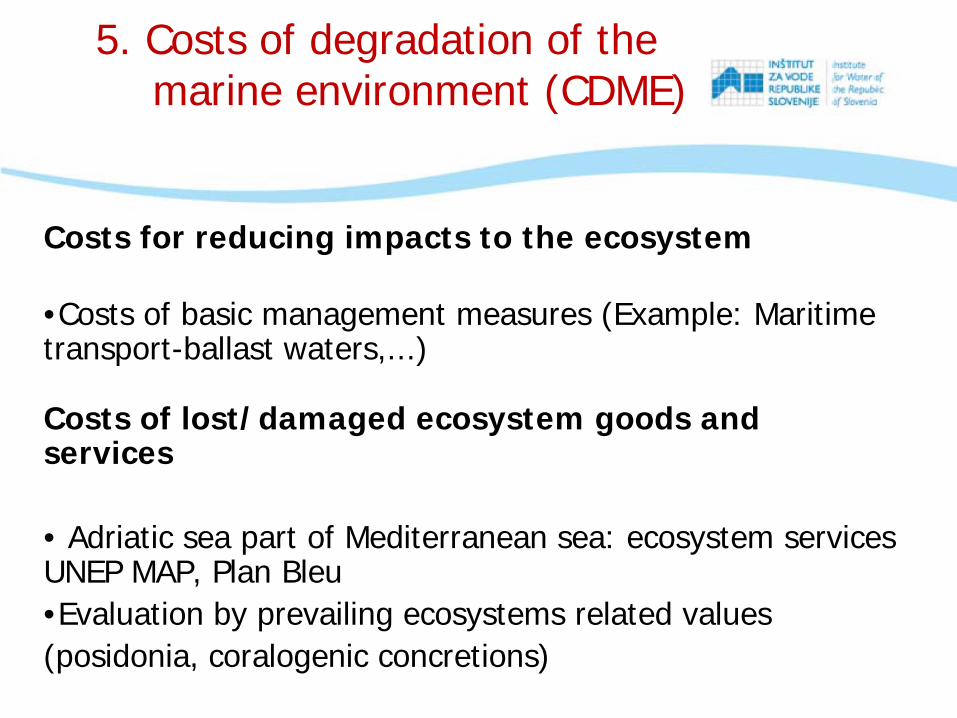
5. Costs of degradation of the marine environment (CDME)
Costs for reducing impacts to the ecosystem
•Costs of basic management measures (Example: Maritime transport-ballast waters,...)
Costs of lost/damaged ecosystem goods and services
• Adriatic sea part of Mediterranean sea: ecosystem services UNEP MAP, Plan Bleu•Evaluation by prevailing ecosystems related values(posidonia, coralogenic concretions)

Plan Blue, 2010
5. CDME – expected ecosystem services list
Extraction function Regulatory function Cultural and recreational
function
Food production
Global climate regulation
Mitigation of natural hazards
Waste treatment Amenities
Support to recreational
activities
Seabed habitats
Habitat spawning ground,
Nursery for fisheries resource
CO2 sequestration
Reduction of erosion
Contribution to the
absorption of organic
discharge
Contributes to coastal
landscape and to the presence
of specific biocenosis
Diving, swimming
Open seaHabitat for fisheries resource
CO2 sequestration, rainfall from evaporation
Contribution to the
absorption of organic
discharge and to the dilution of
other discharges
Contributes to coastal
landscape and to the presence
of specific biocenosis, affects local
climate
Yachting, cruising, whale
watching, water sports

IWRS-ZVDLj
IWRS-Eco Vitae
VURS, NIB-MBS
IJS, ZVDMb, NIB-MBS
NIB-MBS,
ZVNRS
ZZRRS
ZZRRS, NIB-MBP, ZVNRS
NIB-MBS
NIB-MBS, ZVNRS
NIB-MBS, ZVNRS
NIB-MBS
GESWhat is
=56 criteria
2. GES and targets

Current level of indicators development in Slovenia
DES
CRIP
TORS
NUMBER OF INDICATORS
GES and targets
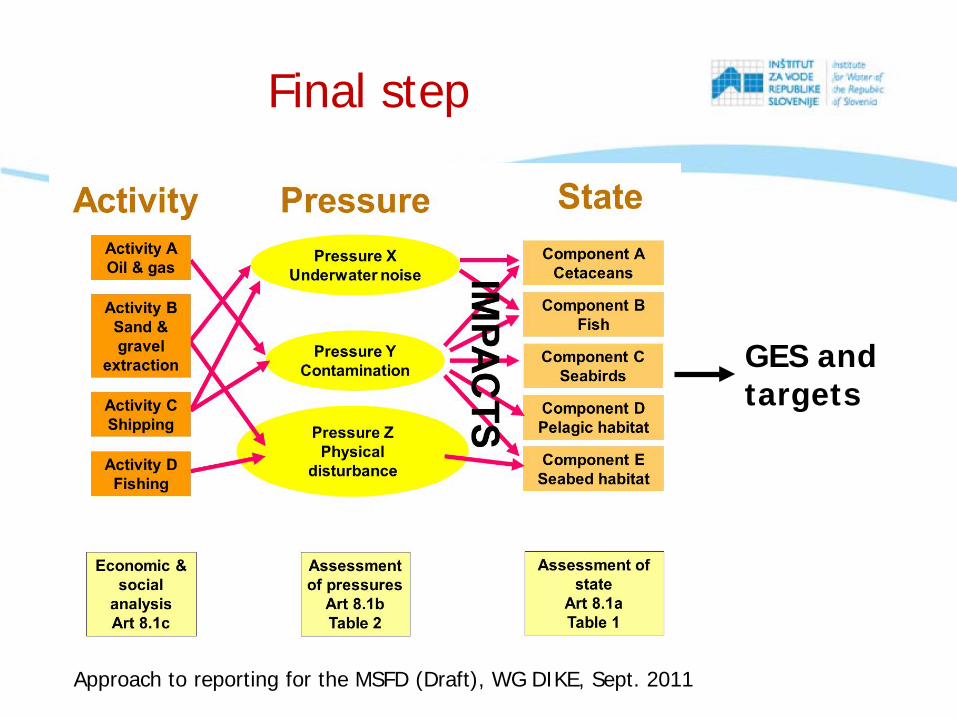
Approach to reporting for the MSFD (Draft), WG DIKE, Sept. 2011
Final step

How does it work in praticein relation to reporting requirements
1. What are the characteristics of the activity, including any seasonal variation?
2. What is the current distribution and intensity of the activity, and how is this changing over time?
3. What are the economic and social benefits of the activity (e.g. employment, annual productivity)?
4. What are the key pressures arising from the activity?5. What are the costs of degradation of the marine environment
(addressing both costs for reducing impacts to the ecosystem and costs of lost/damaged ecosystem goods and services)?
Approach to reporting for the MSFD (Draft), WG DIKE, Sept. 2011
Case study: maritime transport
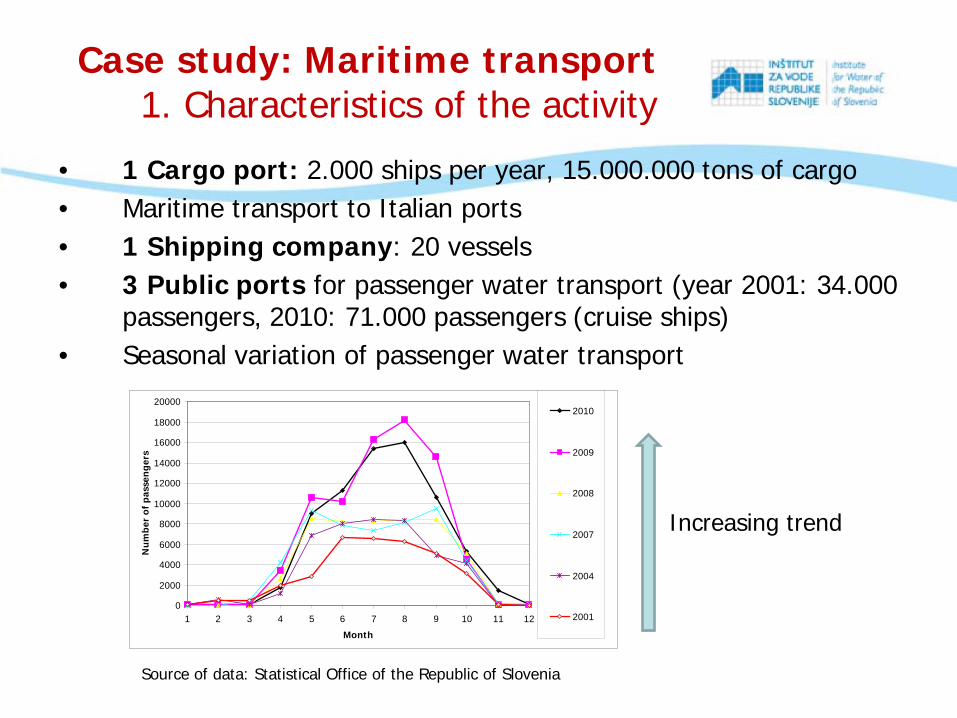
Case study: Maritime transport1. Characteristics of the activity
Source of data: Statistical Office of the Republic of Slovenia
• 1 Cargo port: 2.000 ships per year, 15.000.000 tons of cargo• Maritime transport to Italian ports• 1 Shipping company: 20 vessels • 3 Public ports for passenger water transport (year 2001: 34.000
passengers, 2010: 71.000 passengers (cruise ships)• Seasonal variation of passenger water transport
Increasing trend
0
2000
4000
6000
8000
10000
12000
14000
16000
18000
20000
1 2 3 4 5 6 7 8 9 10 11 12
Month
Nu
mb
er o
f p
asse
ng
ers
2010
2009
2008
2007
2004
2001

Case study: Maritime transport 2. Current distribution of the activity

Case study: Maritime transport 2. Current distribution of the activity

Case study: Maritime transport 2. Intensity of the activity, trends
0
500
1.000
1.500
2.000
2.500
3.000
1997
1998
1999
2000
2001
2002
2003
2004
2005
2006
2007
2008
2009
2010
Year
Num
ber
of s
hips
0
1.000.000
2.000.000
3.000.000
4.000.000
5.000.000
6.000.000
7.000.000
8.000.000
9.000.000
1996
1997
1998
1999
2000
2001
2002
2003
2004
2005
2006
2007
2008
2009
2010
Year
Qua
ntity
of
carg
o [t
]
General cargo
Containers
Vehicles
Dry bulk cargo
Liquid bulk cargo
Source of data: Luka Koper d.d.; Peterlin, David, Kramar, 2011
Number of ships
Cargo

Case study: Maritime transport3. Economic benefits of the activity
• One of the most important sectors that use marine waters
Source of data: Agency of the Republic of Slovenia for Public Legal Records and Related Services
Sea and coastal passenger and freight water transport
Service activities incidental to water
transportation, cargo handling, other
transportation support
Building, repair and maintenance of ships and
boats
Fisheries
Tourism
Maritime transport
Extraction of saltAgriculture
Industry, Warehousing and
storage
0
20.000.000
40.000.000
60.000.000
80.000.000
100.000.000
120.000.000
140.000.000
160.000.000
Va
lue
ad
de
d (
EU
R)

Case study: Maritime transport 3. Social benefits of the activity
Source of data: Agency of the Republic of Slovenia for Public Legal Records and Related Services
Fisheries
Maritime transport
Tourism
Agriculture in coastal
municipalities
Extraction of salt
Industry, Warehousing and
storage
0
500
1.000
1.500
2.000
2.500
3.000
3.500
4.000
Em
plo
ym
en
t-F
TE
Building, repair and maintenance of ships and
boats
Service activities incidental to water transportation,
cargo handling, other transportation support
activities
Sea and coastal passenger and freight water transport

Physical loss
Physical damage-dredging
Other physical disturbance-noise
Interference with hydrological processes
Contamination by hazardous substances
Systematic and/or intentional release of
substances
Nutrient and organic matter enrichment
Biological disturbance Source of data: Luka Koper d.d.; Peterlin, David, Kramar, 2011
0
1.000.000
2.000.000
3.000.000
4.000.000
5.000.000
6.000.000
7.000.000
8.000.000
9.000.000
1996
1997
1998
1999
2000
2001
2002
2003
2004
2005
2006
2007
2008
2009
2010
Year
Qua
ntity
of
carg
o [t
]General cargo
Containers
Vehicles
Dry bulk cargo
Liquid bulk cargo
Case study: Maritime transport 4. Key pressures

Case study: Maritime transport 4. Key pressures and impacts
PRESSURES
Physical loss and damageSealing (construction of port facilities)
Changes in siltation ( oncreased runoff, dredging)Abrasion of seabed
Other physical disturbanceUnderwater noise
Marine litterInterference with hydrological processes
Significant changes in salinity regime (construction, impeding)
Contamination by hazardous substancesEmissions (air-water)
Accidental releaseAntifauling substances
Nutrient and organic matter enrichmentEmisions of Nox to airBiological disturbance
Introduction of pathogens , alien species
IMPACTS
Physical featuresExtent of area affecte
Biological feturesHabitat typesEcosystems
Extent of area affectedImpact of hydrographical change
Impacts of litterImpacts of underwater niseImpacts of invasive species
Effects of contaminants
LINK TO CHARACTERISTICS (GES)

Maritimetransport
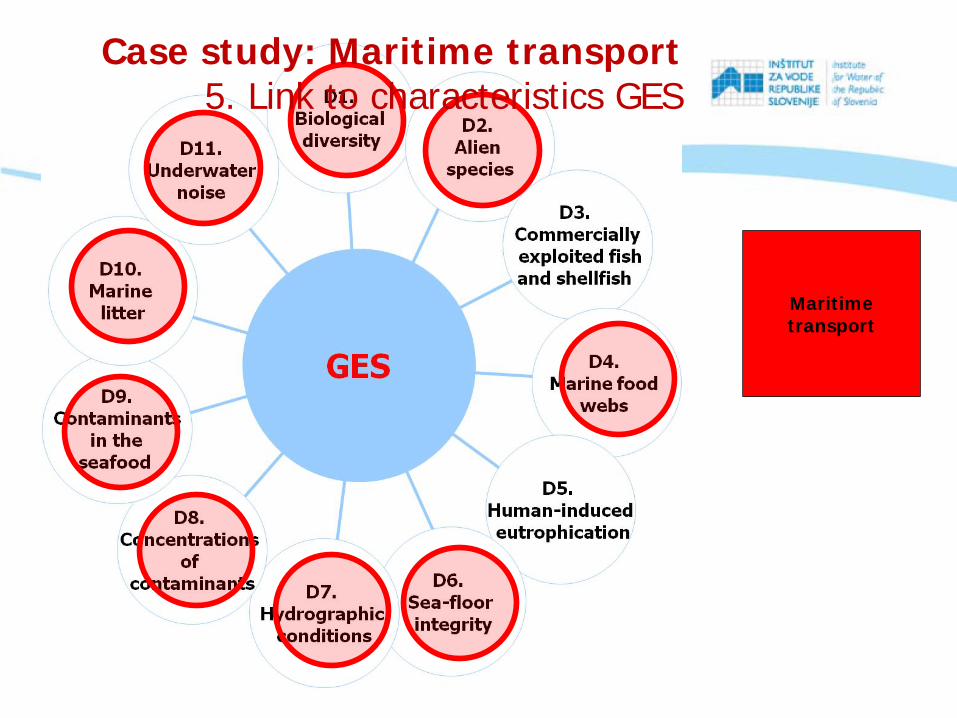
Case study: Maritime transport 5. Link to characteristics GES

GESPartial information ondescriptors, few trends
How to define targets?
Socio-economySectors development, trends,demography
Pressures, impacts identification
Mostly qualitative targets, risk based

Where are we in 2011
Characteristics(Annex III, Table 1)
Pressures and impacts(Annex III, Table 2)
Socio-economic assessment
Initial assessment (art 8)
GES (art. 9(1))Selection of indicators
Targets (art 10)
Description ofenvironmnetal status, relevant pressures and
relevance of activities forthe society Low confidence level
Ongoing
Ongoing
Ongoing Not startedyet
PROBLEMS- Mostly short time series- Several elementsmissing- No cooperation amongneighbouring countries

Way forward
• Long term - improve scientiffic knowledege on descriptors and links to pressures
• Short term - setting up of working groups for descriptors on the regional level– Exchange of knowledge– Common work on indicators selection– Common target setting– Comparision of socio-economic analysis results
Foto: UNIC-SUB, L. Fonda
Foto: OMEGA STUDIO, A. Primčič
Foto: OMEGA STUDIO, A. Primčič
Foto: OMEGA STUDIO, A. Primčič

Thank you for your attention
Foto: UNIC-SUB, L. Fonda
Foto: OMEGA STUDIO, A. Primčič
Foto: OMEGA STUDIO, A. Primčič
Foto: OMEGA STUDIO, A. Primčič