implicit value of retail beef brands and retail meat product attributes
TRANSCRIPT

Implicit Value of Retail Beef Brands
and Retail Meat Product Attributes
by
Jennifer M. Dutton, Clement E. Ward, and Jayson L. Lusk
Suggested citation format:
Dutton, J. M., C. E. Ward, and J. L. Lusk. 2007. “Implicit Value of Retail Beef Brands and Retail Meat Product Attributes.” Proceedings of the NCCC-134 Conference on Applied Commodity Price Analysis, Forecasting,and Market Risk Management. Chicago, IL. [http://www.farmdoc.uiuc.edu/nccc134].
Implicit Value of Retail Beef Brands and Retail Meat Product Attributes
Jennifer M. Dutton, Clement E. Ward,
and Jayson L. Lusk*
Paper presented at the NCCC-134 Conference on Applied Commodity Price Analysis, Forecasting, and Market Risk Management
Chicago, Illinois, April 16-17, 2007
Copyright 2007 by Jennifer M. Dutton, Clement E. Ward, and Jayson L. Lusk. All rights reserved. Readers may make verbatim copies of this document for non-commercial purposes by
any means, provided this copyright notice appears on all copies. * Jennifer M. Dutton is a graduate research assistant ([email protected] ), Clement E. Ward is a Professor and Extension Economist ([email protected]), and Jayson L. Lusk, is the Willard Sparks Endowed Professor of Agribusiness ([email protected] ), all in the Department of Agricultural Economics at Oklahoma State University.
2
Implicit Value of Retail Beef Brands and Retail Meat Product Attributes Practitioner’s Abstract: Consumers reveal preferences for fresh beef attributes through their retail beef purchases. Hedonic pricing methods were used to estimate the value consumers place on observable characteristics of fresh beef products, especially on retail beef brands. Primary data were collected from 65 randomly generated grocery stores located in three metropolitan areas, Oklahoma City and Tulsa, Oklahoma, and Denver, Colorado. Retail beef package data were collected on 462 ground products, 175 roast products, and 756 steak products. There was some evidence retail beef brands command a price premium compared with unbranded, generic products. In this study, branding programs classified as “special” (i.e. no antibiotics, no hormones, all natural) offered the largest price premiums, but “other” types of branding programs offered price premiums as well. Price premiums for special brands were $1.45/lb. for ground products and $5.87/lb. for steak products. Labeling variables were not consistently significant in this study, indicating that labels associated with a brand name might offer consumers the most reassurance for their purchasing decision. The most important attributes affecting retail price per pound of ground beef products are store location (metropolitan area), store type, type of product, fat content, package size and type, expiration dates, brands and labels. Store location (metropolitan area) was important but store type was less important for explaining steak items than ground items. Steak prices were influenced by cut type, USDA quality grade, package size and type, and slightly by expiration date. Keywords: Beef, Hedonic pricing, Marketing, Retail beef brands, Retail prices Introduction Declining demand for beef has been attributed to competitive pricing, safety concerns, changing consumer lifestyles, quality, and convenience (Johnson and Ward 2005). Consumers also have expressed concern about the use of hormones, steroids, antibiotics, as well as bacterial contamination and health risks associated with red meat consumption. Consumers demand that producers and food companies provide a consistent, tender, high quality product which consumers find difficult to locate in a traditional grocery store meat case (Barkema 2001; Fanatico 2006). Limited information exists on fresh beef brands and consumer preferences for many retail beef attributes (Feldkamp, Schroeder, and Lusk 2005; Lusk et al. 2001; Menkhaus et al. 1993). With considerable interest in branded beef at retail (Brocklebank and Hobbs 2004), little information exists on the prices consumers pay for various types of brands such as store brand, packer or processor brand, and program brand (e.g., Certified Angus Beef) relative to generic (unbranded) beef. Revealed preference theory is used in this study to determine consumer preferences for several retail beef product attributes.
3
This paper reports on a study to determine the value consumers place on descriptive characteristics of fresh beef, especially retail beef brands. It will also identify the extent of brands and labeling that already exists for fresh beef. Hedonic models are estimated to determine the marginal implicit value of retail beef brands and retail beef attributes for fresh beef products. Conceptual Framework Hedonic pricing uses market transactions for differentiated goods to determine the value of key product attributes revealed to purchasers. Beef is a product composed of both observable and unobservable characteristics, and differences in quality can be real or perceived by the consumer. Therefore, in order to describe pricing behavior, a hedonic, or attribute based, methodology was chosen. Since consumers have differing tastes and preferences, retailers must use pricing, presentation (package material and label), and branding to influence purchasing decisions. Retail branding becomes important to consumers when there are perceived or real quality differences in products offered in the marketplace. Typically it is assumed brands indicate some given level of quality (often superior) which cannot be measured by a consumer’s visual inspection. Brands are simply an assurance of quality (Png and Reitman 1995). Fresh beef consumers increasingly demand assurance of quality and consistency, so branding beef products could be very beneficial for producers, suppliers, and retailers. Since branded products indicate a product of superior quality, the product generally will command a higher retail price. Hedonic prices are defined as the implied prices for product characteristics revealed from observed prices of differentiated products and specific amounts of characteristics associated with them (Rosen 1974). The hedonic method is an indirect valuation method where we cannot directly observe the value consumers have for a specific characteristic, but infer value from market transactions (Taylor 2003). For this research, it is assumed that consumers are willing to pay prices that were observed in the fresh meat case. A heterogeneous product refers to products whose characteristics vary, creating different varieties of a commodity even though they are sold in a single market (grocery stores). The variation in product attributes gives rise to variation in price for fresh beef products in retail stores. The hedonic method relies on market transactions, or in this case, available market transactions, to determine the value of key underlying characteristics (Taylor 2003). Hedonic analysis contains two parts. The first part is the most commonly used, where a hedonic price function is estimated for varying prices and characteristic information associated with the commodity. The result is implicit prices of various characteristics that reveal details on the underlying preferences for each attribute. The second step is dependent on the first, where the implicit prices for varying characteristics are used to derive demand functions for each characteristic (Taylor 2003). This research uses the first stage of hedonic analysis. Using hedonic models, implicit prices for different product attributes will help explain the role consumer tastes and preferences play in consumer demand for retail beef. Hedonic pricing theory is an easy way to characterize the concept that consumers demand a product with multiple attributes and more than one factor affects their purchase decision. Consumer goods characteristics models explain product heterogeneity coming from products having different
4
kinds and/or amounts of characteristics (Ladd and Suvannunt 1976). With this in mind, consumers derive their total utility from the total bundle of characteristics purchased in a single good. Price differences from the hedonic model identify the marginal implicit value consumers place on beef product attributes, including retail brands. Revealed Preference Literature Several studies have been conducted in which consumers are asked to state their preferences or participate in a survey where their revealed preferences, or what they actually do in a buying situation, can be recorded. An important line of such research focuses on consumers’ willingness-to-pay for varying product attributes. In this section a sample of different studies looking at factors that affect meat purchase decisions will be reviewed. Factors affecting purchase decisions A consumer survey by Purcell (1993) found that cholesterol, fat level, quality, and convenience of preparation are non-price factors which influence consumers’ buying behavior. Later research by Purcell confirmed earlier findings. Consumers rated on a scale of 10 = very important and 1 = not important, the importance of factors affecting their purchase decisions. Consumers rated several factors as being more important than price (in order; taste, fat content, cholesterol level, and ease of preparation). Marbling impacts The level of marbling or intramuscular fat is a primary indicator of USDA quality grade. Abundantly marbled steaks are given a higher USDA quality grade while leaner steaks containing less intramuscular fat are given a lower USDA quality grade. Killinger et al. (2004b) studied consumer sensory acceptance and value for beef steaks of similar tenderness but that differed in marbling level. Consumers were willing to pay a premium for steak that was consistent with the marbling level of their choice. As a whole, consumers in Chicago and San Francisco found high marbled steaks to be more adequate than low marbled steaks. This study found Chicago participants to be willing to pay between $0.24/lb and $1.13/lb premium for high-marbled steaks, while those preferring a low-marbled steak were willing to pay a premium between $0.05/lb and $1.40/lb. Their San Francisco counterparts were willing to pay $1.47/lb premium for high-marbled steaks and $1.94/lb premium for low-marbled steaks (Killinger et. al 2004b). Willingness-to-pay was much lower in a laboratory setting, where consumers were willing-to-pay $0.15/lb and $0.13/lb for high-marbled steaks and low-marbled steaks, respectively (Killinger et. al 2004b). Growth hormones and consumer preferences The European Union banned use of growth hormones in 1985. If the U.S. were to completely abolish the use of growth hormones, it is estimated that the ban would cost producers approximately $314 million (Kenney and Fallart 1989). Kenney and Fallart indicated growth hormones increase weight gain in cattle by 5-20%, feed efficiency by 5-12%, and lean meat growth by 15-25%. Nixon (2007) reports similar losses in weight gain and feed efficiency with bodyweight decreased 70-100 lbs and feed efficiency 10-15% less than animals which are administered growth hormones.

5
Results from a study by Lusk, Roosen, and Fox (2003) show the preference for steaks from cattle produced without the use of growth hormones over steaks from cattle administered growth hormones is similar across France, Germany, the United Kingdom, and the U.S. The study estimated the value consumers attributed to steak produced without the use of growth hormones over steak produced with growth hormones. In order for consumers to trade their steak produced without the use of growth hormones for the steak produced with growth hormones the price would have to be $0.92, $0.82, $1.22, and $2.63/lb less for consumers in France, Germany, the U.K. and the U.S., respectively. Therefore, results indicated that U.S. consumers are willing-to-pay more for beef produced without the use of growth hormones than counterparts from European countries (Lusk, Roosen, and Fox 2003). Meat purchase decisions Parcell and Schroeder (2007) estimated hedonic prices of retail beef attributes in the study most closely approaching research reported in this paper. Unlike the current study, they utilized data from the Meat Panel Diary (MPD) database. Data were more aggregated but also included consumer demographic information regarding the purchasing household. Specific product information data included type of meat purchased, package weight, price, whether or not the product was discounted, grade, and fat content. For beef transactions, only those that reported a brand were used, limiting the dataset to approximately 2,300 observations. Steaks were divided into three groups of varying degrees of quality; low, medium, and high. Each additional pound of ground beef per package reduced the purchase price by $0.23/lb and each lower percentage point of fat increased the sale price by $0.04/lb. For roasts, each additional pound increased price $0.28/lb. Steak prices declined $0.74/lb for each additional pound of package weight. Consumers paid a $0.27/lb premium for USDA grade Prime steaks compared with steaks of medium quality. They paid $0.04/lb less for USDA grade Select steaks when compared to steaks that did not disclose USDA grade (Parcell and Schroeder 2007). Results showed the implicit price for brand was statistically different from zero for roasts and steaks; however, brand was not statistically significant for ground beef. The premium for roasts was $0.34/lb. compared to store branded roasts. Similarly, the premium for branded steaks was $0.76/lb. to $1.26/lb. compared to store branded steaks. Higher premiums were associated with steaks that were of medium and high quality (Parcell and Schroeder 2007). Data and Methodology Data collection and sample size A data collection instrument was designed for a two-person team to collect data from each store sampled. After developing a list of variables believed to affect the retail price of beef, use of the data collection sheet was pilot-tested at a supermarket in Stillwater, Oklahoma. Afterwards, minor modifications were made to the data collection instrument to increase its ease of use. The order of the questions was changed and the sheets were bound into four
6
separate books for each metropolitan area to make the amount of materials that had to be carried to each store minimal. Data collected consisted of various types of information related to each package of beef for selected primal cuts and product types. Data were collected on ground beef, ground chuck, chuck roast, round roast, ribeye steak, sirloin steak, round steak, and T-bone steak. Multi-level data were collected including information at the store level and product level. Store level data included store type (specialty, supermarket, discount, and warehouse club), store name, location, and presence of an in-store butcher. Product level data included information about product type (ground, roast, and steak), cut or product name, price per pound, package weight, package material (chub, foam tray, case ready, custom cut, etc.), USDA quality grade (Prime, Choice, Select, no grade indicated) for roasts and steaks, fat content for ground products, information on feature or markdown price, brand category (generic, store, program, etc.), brand name, and special label (no antibiotics, no hormones, organic, etc.). Data were collected from two metropolitan areas in Oklahoma (Oklahoma City and Tulsa) and the Denver, Colorado metropolitan area. Cities in the Oklahoma City area consisted of Oklahoma City, Edmond, Midwest City, Yukon and Moore; in the Tulsa area, Tulsa, Sand Springs, Broken Arrow, Owasso, and Sapulpa; and in the Denver area, Denver, Arvada, Aurora, Lakewood, Littleton, and Westminster. A sample of retail stores was drawn in each metropolitan area, with consideration given to store ownership/affiliation, type, and socioeconomic makeup of the store locations so as to represent the diversity of each respective metropolitan area. Data were collected from the fresh meat case in each sampled retail store over a short time period (less than one week) in each metropolitan area during July-August 2006. An online sample size calculator from the Aborigine Mundi website (http://www.aboriginemundi.com/ssc/ ) was used to determine the number of stores needed to be surveyed in each metropolitan area. In calculating the number of stores needed, a 95% confidence level was used for all cuts in each metropolitan area. Tolerance levels of $0.03, $0.02, and $0.05/lb was used for roast, ground beef, and steak, respectively. The standard deviation of price per pound varied for each cut and was $0.186, $0.147, and $0.351/lb respectively. Therefore, we are 95% confident the estimated price mean will be plus or minus $0.186, $0.147, and $0.351/lb from the actual mean for roast, ground beef, and steak, respectively. From the sample size calculator, it was estimated that data needed to be collected from at least 14.8 stores in each metropolitan area; Oklahoma City, Tulsa, and Denver to achieve a representative sample. It was estimated that there would be 570 ground observations, 435 roast observations, and 440 steak observations would be collected across all metropolitan areas. Actual number of observations collected is shown in Table 1, by cut type and metropolitan area. Online yellow pages were used to compile store lists for each suburban area. Each suburban area store was chosen independently of other areas. Each store was assigned a unique identification number. Using Microsoft Excel, stores were listed in alphabetical order and then assigned a random number. Then stores were sorted in ascending order by their corresponding randomly generated number. The first 19 stores were chosen to be sampled. Stores were checked to see
7
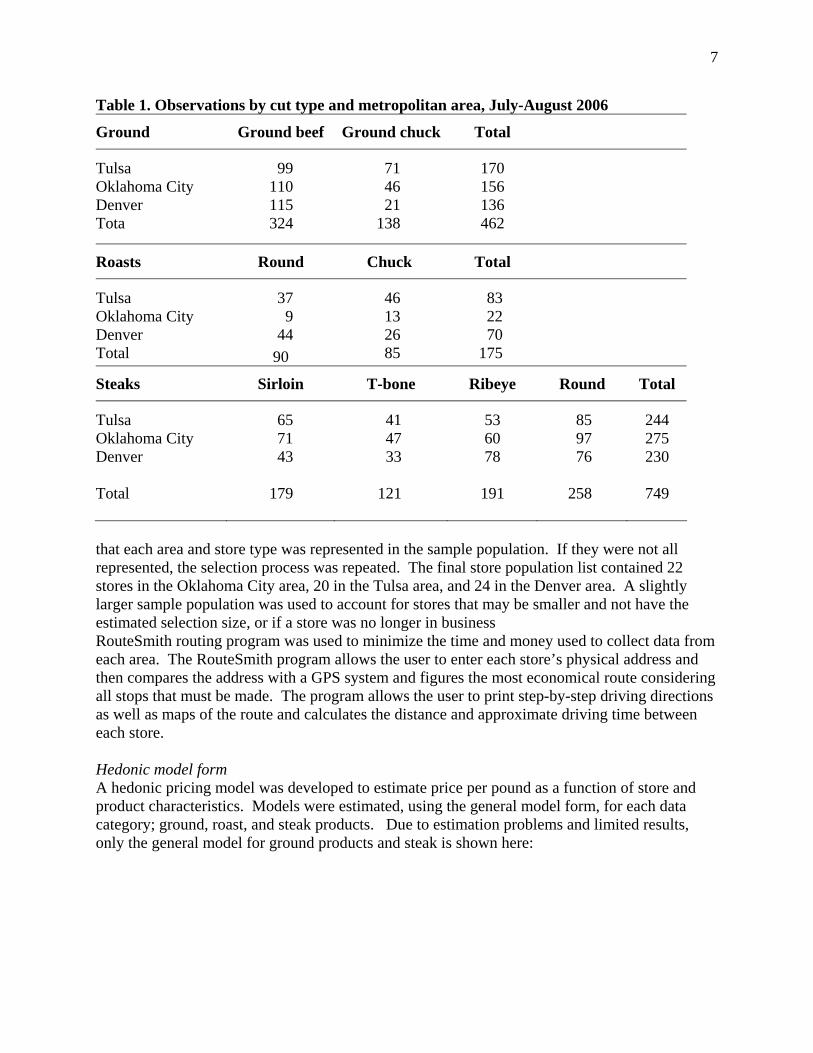
Table 1. Observations by cut type and metropolitan area, July-August 2006
Ground Ground beef Ground chuck Total
Tulsa 99 71 170 Oklahoma City 110 46 156 Denver 115 21 136 Tota 324 138 462
Roasts Round Chuck Total
Tulsa 37 46 83 Oklahoma City 9 13 22 Denver 44 26 70 Total 90 85 175
Steaks Sirloin T-bone Ribeye Round Total
Tulsa 65 41 53 85 244 Oklahoma City 71 47 60 97 275 Denver 43 33 78 76 230
Total 179 121 191 258 749
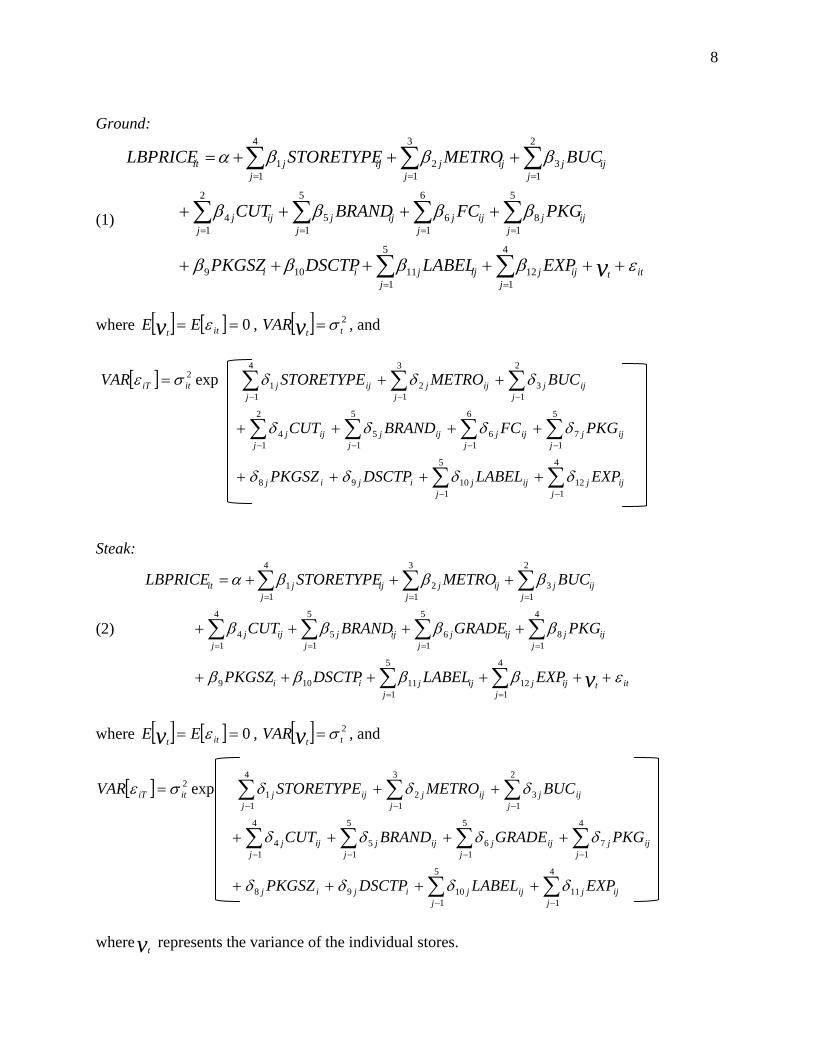
that each area and store type was represented in the sample population. If they were not all represented, the selection process was repeated. The final store population list contained 22 stores in the Oklahoma City area, 20 in the Tulsa area, and 24 in the Denver area. A slightly larger sample population was used to account for stores that may be smaller and not have the estimated selection size, or if a store was no longer in business RouteSmith routing program was used to minimize the time and money used to collect data from each area. The RouteSmith program allows the user to enter each store’s physical address and then compares the address with a GPS system and figures the most economical route considering all stops that must be made. The program allows the user to print step-by-step driving directions as well as maps of the route and calculates the distance and approximate driving time between each store. Hedonic model form A hedonic pricing model was developed to estimate price per pound as a function of store and product characteristics. Models were estimated, using the general model form, for each data category; ground, roast, and steak products. Due to estimation problems and limited results, only the general model for ground products and steak is shown here:
8
Ground:
(1)
ittijj
jijj
jii
ijj
jijj
jijj
jijj
j
ijj
jijj
jijj
jit
vEXPLABELDSCTPPKGSZ
PKGFCBRANDCUT
BUCMETROSTORETYPELBPRICE
εββββ
ββββ
βββα
++++++
++++
+++=
∑∑
∑∑∑∑
∑∑∑
==
====
===
4
112
5
111109
5
18
6
16
5
15
2
14
2
13
3
12
4
11
where [ ] [ ] 0== itt EE v ε , [ ] 2
ttvVAR σ= , and
[ ]
ijj
jijj
jijij
ijj
jijj
jijj
jijj
j
ijj
jijj
jijj
jitiT
EXPLABELDSCTPPKGSZ
PKGFCBRANDCUT
BUCMETROSTORETYPEVAR
∑∑
∑∑∑∑
∑∑∑
−−
−−−−
−−−
++++
++++
++=
4
112
5
11098
5
17
6
16
5
15
2
14
2
13
3
12
4
11
2 exp
δδδδ
δδδδ
δδδσε
Steak:
(2)
ittij
jjij
jjii
ijj
jijj
jijj
jijj
j
ijj
jijj
jijj
jit
vEXPLABELDSCTPPKGSZ
PKGGRADEBRANDCUT
BUCMETROSTORETYPELBPRICE
εββββ
ββββ
βββα
++++++
++++
+++=
∑∑
∑∑∑∑
∑∑∑
==
====
===
4
112
5
111109
4
18
5
16
5
15
4
14
2
13
3
12
4
11
where [ ] [ ] 0== itt EE v ε , [ ] 2
ttvVAR σ= , and
[ ]
ijj
jijj
jijij
ijj
jijj
jijj
jijj
j
ijj
jijj
jijj
jitiT
EXPLABELDSCTPPKGSZ
PKGGRADEBRANDCUT
BUCMETROSTORETYPEVAR
∑∑
∑∑∑∑
∑∑∑
−−
−−−−
−−−
++++
++++
++=
4
111
5
11098
4
17
5
16
5
15
4
14
2
13
3
12
4
11
2 exp
δδδδ
δδδδ
δδδσε
wherev represents the variance of the individual stores. t
9
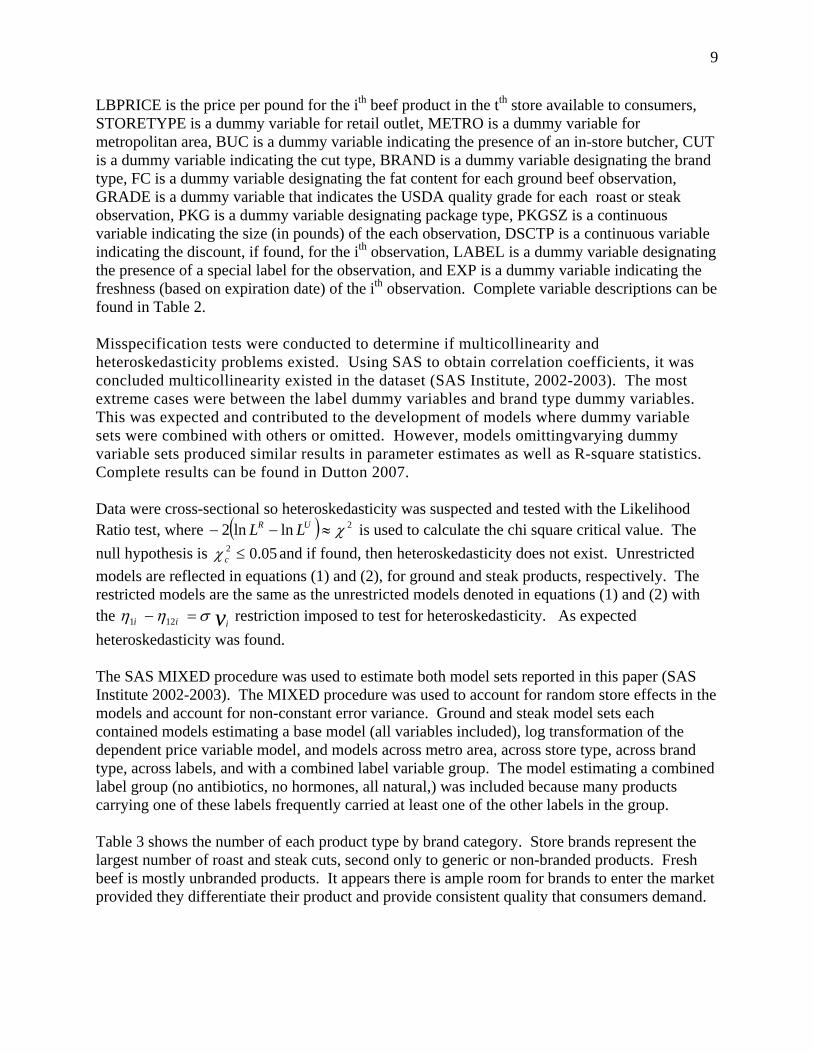
LBPRICE is the price per pound for the ith beef product in the tth store available to consumers, STORETYPE is a dummy variable for retail outlet, METRO is a dummy variable for metropolitan area, BUC is a dummy variable indicating the presence of an in-store butcher, CUT is a dummy variable indicating the cut type, BRAND is a dummy variable designating the brand type, FC is a dummy variable designating the fat content for each ground beef observation, GRADE is a dummy variable that indicates the USDA quality grade for each roast or steak observation, PKG is a dummy variable designating package type, PKGSZ is a continuous variable indicating the size (in pounds) of the each observation, DSCTP is a continuous variable indicating the discount, if found, for the ith observation, LABEL is a dummy variable designating the presence of a special label for the observation, and EXP is a dummy variable indicating the freshness (based on expiration date) of the ith observation. Complete variable descriptions can be found in Table 2. Misspecification tests were conducted to determine if multicollinearity and heteroskedasticity problems existed. Using SAS to obtain correlation coefficients, it was concluded multicollinearity existed in the dataset (SAS Institute, 2002-2003). The most extreme cases were between the label dummy variables and brand type dummy variables. This was expected and contributed to the development of models where dummy variable sets were combined with others or omitted. However, models omittingvarying dummy variable sets produced similar results in parameter estimates as well as R-square statistics. Complete results can be found in Dutton 2007. Data were cross-sectional so heteroskedasticity was suspected and tested with the Likelihood Ratio test, where ( ) 2lnln2 χ≈−− UR LL is used to calculate the chi square critical value. The null hypothesis is and if found, then heteroskedasticity does not exist. Unrestricted models are reflected in equations (1) and (2), for ground and steak products, respectively. The restricted models are the same as the unrestricted models denoted in equations (1) and (2) with the restriction imposed to test for heteroskedasticity. As expected heteroskedasticity was found.
05.02 ≤cχ
viii σηη =− 121
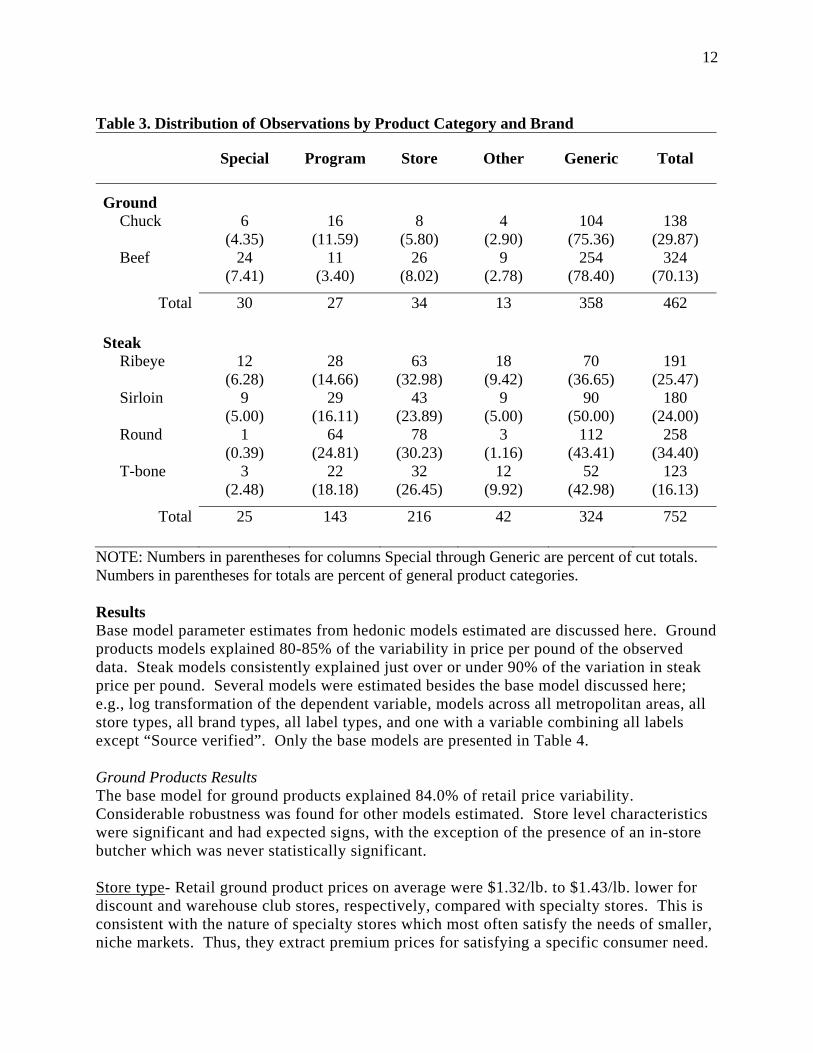
The SAS MIXED procedure was used to estimate both model sets reported in this paper (SAS Institute 2002-2003). The MIXED procedure was used to account for random store effects in the models and account for non-constant error variance. Ground and steak model sets each contained models estimating a base model (all variables included), log transformation of the dependent price variable model, and models across metro area, across store type, across brand type, across labels, and with a combined label variable group. The model estimating a combined label group (no antibiotics, no hormones, all natural,) was included because many products carrying one of these labels frequently carried at least one of the other labels in the group. Table 3 shows the number of each product type by brand category. Store brands represent the largest number of roast and steak cuts, second only to generic or non-branded products. Fresh beef is mostly unbranded products. It appears there is ample room for brands to enter the market provided they differentiate their product and provide consistent quality that consumers demand.
10
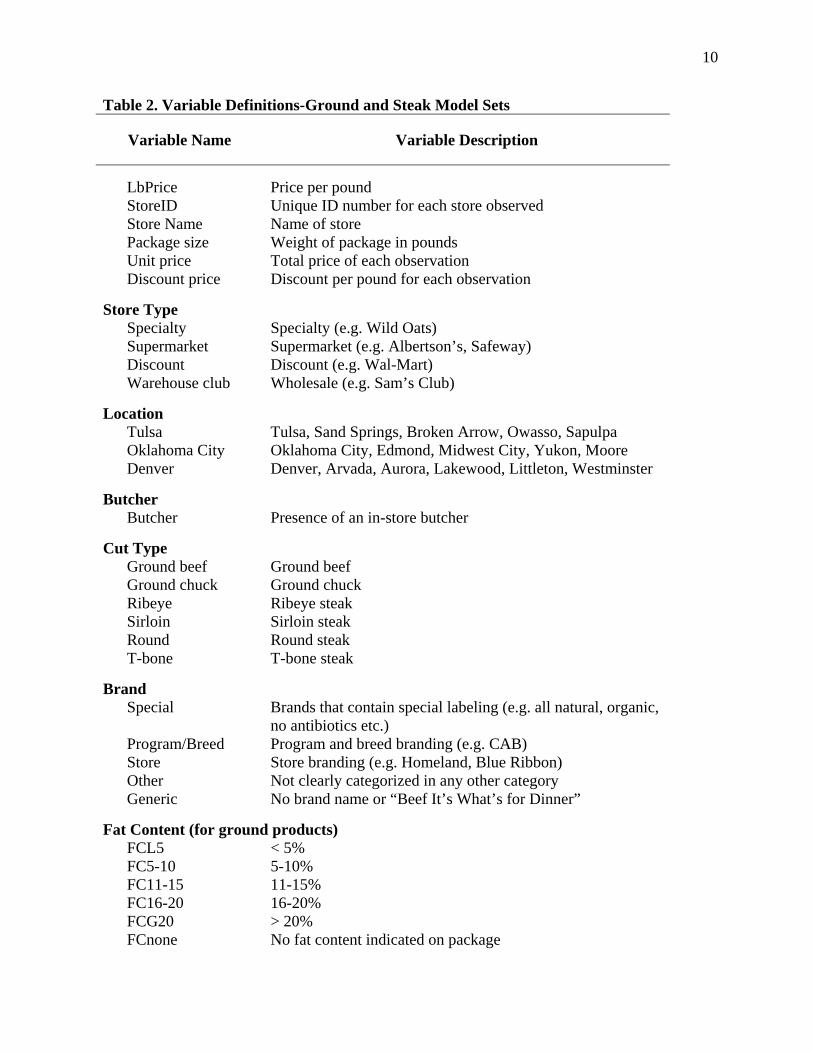
Table 2. Variable Definitions-Ground and Steak Model Sets
Variable Name Variable Description
LbPrice Price per pound StoreID Unique ID number for each store observed Store Name Name of store Package size Weight of package in pounds Unit price Total price of each observation Discount price Discount per pound for each observation
Store Type
Specialty Specialty (e.g. Wild Oats) Supermarket Supermarket (e.g. Albertson’s, Safeway) Discount Discount (e.g. Wal-Mart) Warehouse club Wholesale (e.g. Sam’s Club)
Location
Tulsa Tulsa, Sand Springs, Broken Arrow, Owasso, Sapulpa Oklahoma City Oklahoma City, Edmond, Midwest City, Yukon, Moore Denver Denver, Arvada, Aurora, Lakewood, Littleton, Westminster
Butcher Butcher Presence of an in-store butcher
Cut Type
Ground beef Ground beef Ground chuck Ground chuck Ribeye Ribeye steak Sirloin Sirloin steak Round Round steak T-bone T-bone steak
Brand
Special Brands that contain special labeling (e.g. all natural, organic, no antibiotics etc.)
Program/Breed Program and breed branding (e.g. CAB) Store Store branding (e.g. Homeland, Blue Ribbon) Other Not clearly categorized in any other category Generic No brand name or “Beef It’s What’s for Dinner”
Fat Content (for ground products)
FCL5 < 5% FC5-10 5-10% FC11-15 11-15% FC16-20 16-20% FCG20 > 20% FCnone No fat content indicated on package

11
Table 2. Variable Definitions-Ground and Steak Model Sets
Variable Name Variable Description
Quality Grade (for steak products)
Standard USDA Standard Select USDA Select Choice USDA Choice Prime USDA Prime Grdnone No USDA grade indicated
Package Material
Chub Chub packaging-ground products Foam tray Foam tray packaging-all cuts Case ready Case ready packaging-all cuts (i.e. hard plastic tray, clear top
covering) Custom cut Custom cut by butcher-all cuts Vacuum sealed Vacuum sealed packaging-all cuts
Label Antibiotics “No antibiotics used” labeling Hormones “No hormones used” labeling All natural “All natural” labeling Source verified “Source verified” labeling Quality guaranteed “Guaranteed quality” labeling
Days until Expiration
ExpL1 <1 day until expiration Exp1-7 > 1, < 8 days until expiration ExpG7 > 7 days until expiration Expnone No expiration date indicated
A higher percentage of branded steak products was found than for roast or ground products. This finding was expected because steaks are higher value cuts than either roast or ground products, so there is a higher expected premium associated with branding higher value cuts. Generic products accounted for 75.4% and 78.4% of ground chuck and ground beef products, respectively. However, generic steak products accounted for a much smaller proportion of steak products. Generic ribeye steaks accounted for 36.7% of ribeye steaks; generic sirloin, 50.0% of sirloin steaks; generic round, 43.4% of round steaks; and generic T-bone steaks, 43.0% of T-bone steaks.
12
Table 3. Distribution of Observations by Product Category and Brand
Special Program Store Other Generic Total
Ground Chuck 6
(4.35) 16
(11.59) 8
(5.80) 4
(2.90) 104
(75.36) 138
(29.87) Beef 24
(7.41) 11
(3.40) 26
(8.02) 9
(2.78) 254
(78.40) 324
(70.13)
Total 30 27 34 13 358 462 Steak
Ribeye 12 (6.28)
28 (14.66)
63 (32.98)
18 (9.42)
70 (36.65)
191 (25.47)
Sirloin 9 (5.00)
29 (16.11)
43 (23.89)
9 (5.00)
90 (50.00)
180 (24.00)
Round 1 (0.39)
64 (24.81)
78 (30.23)
3 (1.16)
112 (43.41)
258 (34.40)
T-bone 3 (2.48)
22 (18.18)
32 (26.45)
12 (9.92)
52 (42.98)
123 (16.13)
Total 25 143 216 42 324 752
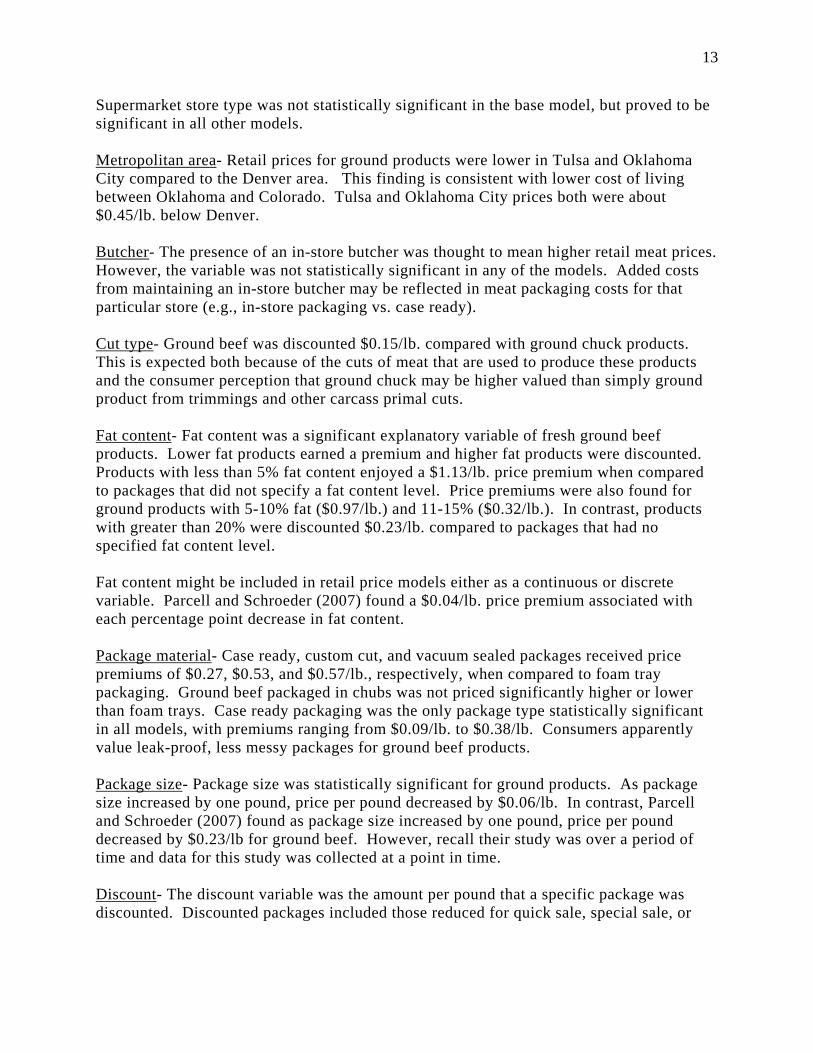
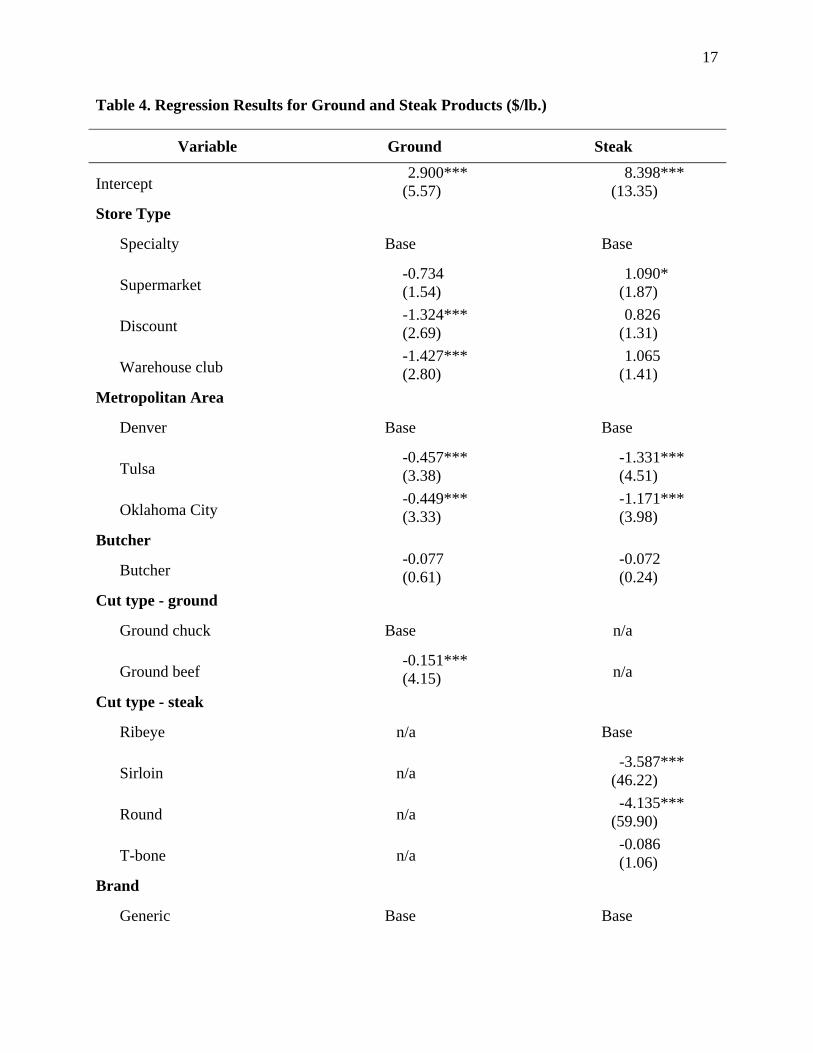
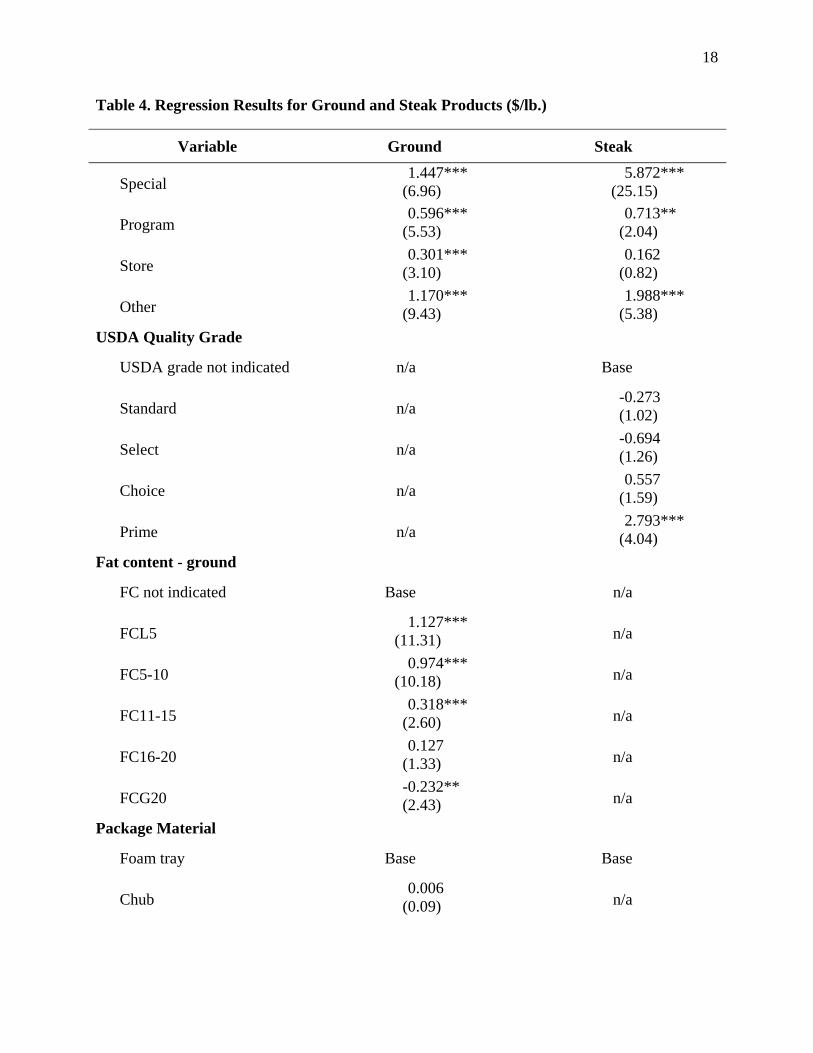
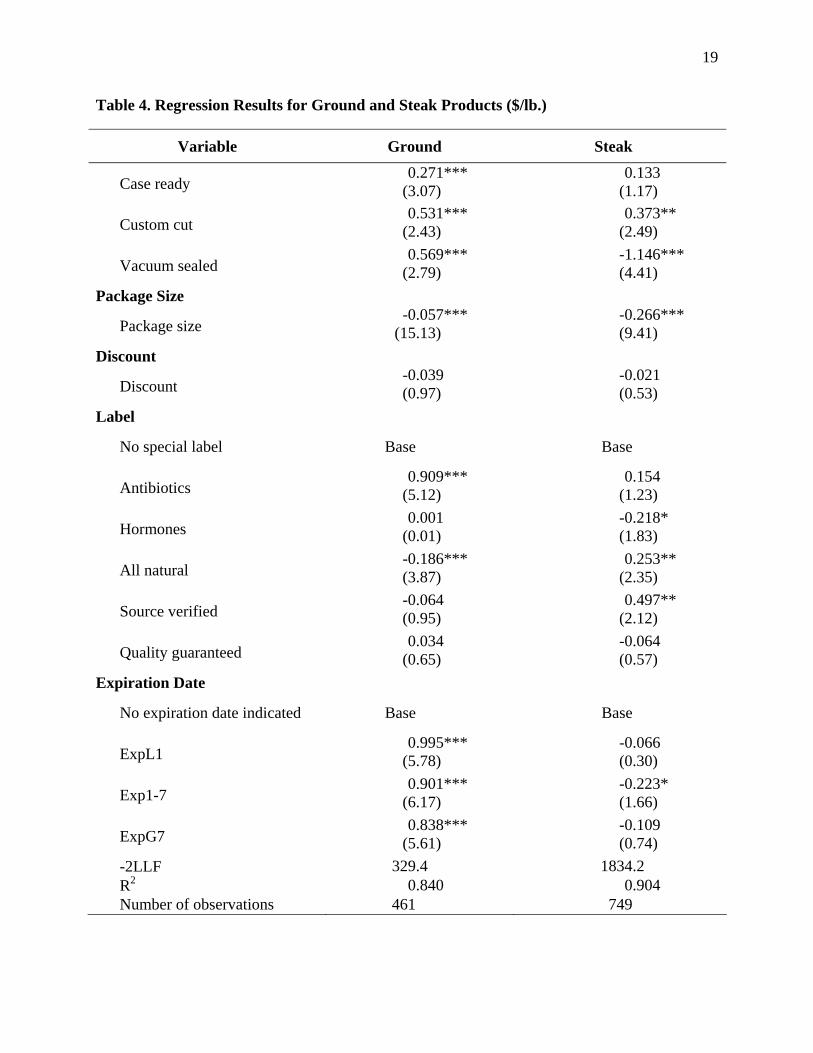
NOTE: Numbers in parentheses for columns Special through Generic are percent of cut totals. Numbers in parentheses for totals are percent of general product categories. Results Base model parameter estimates from hedonic models estimated are discussed here. Ground products models explained 80-85% of the variability in price per pound of the observed data. Steak models consistently explained just over or under 90% of the variation in steak price per pound. Several models were estimated besides the base model discussed here; e.g., log transformation of the dependent variable, models across all metropolitan areas, all store types, all brand types, all label types, and one with a variable combining all labels except “Source verified”. Only the base models are presented in Table 4. Ground Products Results The base model for ground products explained 84.0% of retail price variability. Considerable robustness was found for other models estimated. Store level characteristics were significant and had expected signs, with the exception of the presence of an in-store butcher which was never statistically significant. Store type- Retail ground product prices on average were $1.32/lb. to $1.43/lb. lower for discount and warehouse club stores, respectively, compared with specialty stores. This is consistent with the nature of specialty stores which most often satisfy the needs of smaller, niche markets. Thus, they extract premium prices for satisfying a specific consumer need.
13
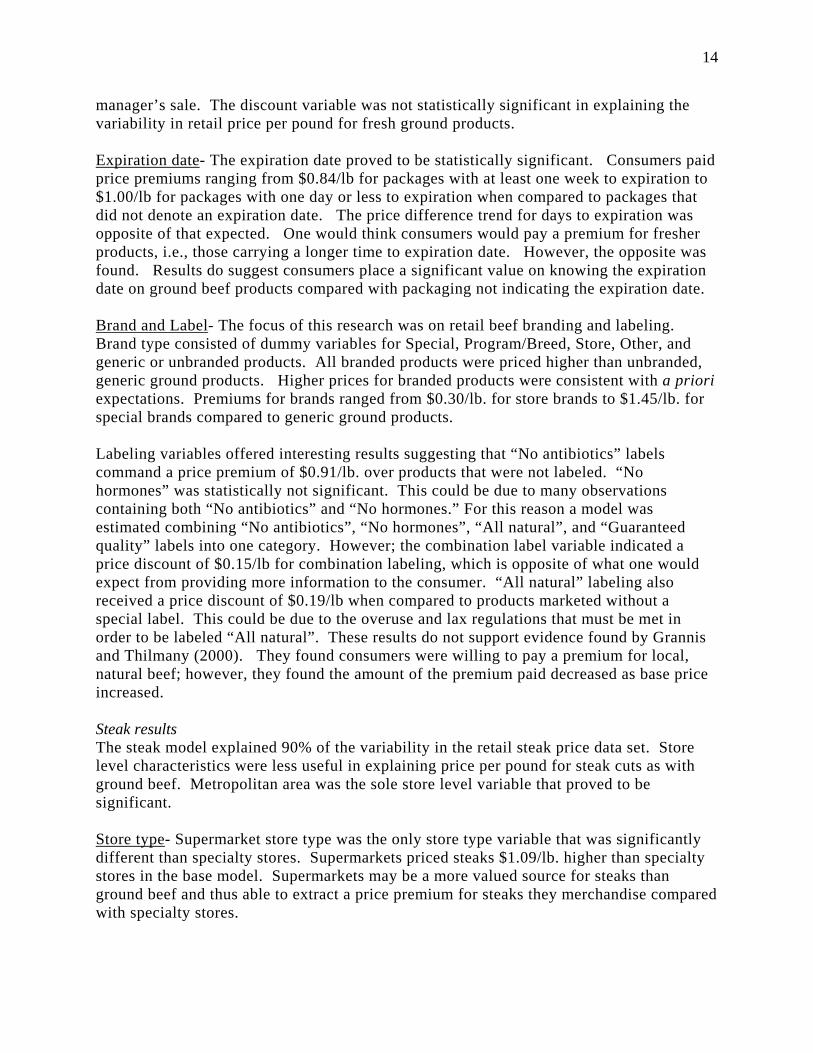
Supermarket store type was not statistically significant in the base model, but proved to be significant in all other models. Metropolitan area- Retail prices for ground products were lower in Tulsa and Oklahoma City compared to the Denver area. This finding is consistent with lower cost of living between Oklahoma and Colorado. Tulsa and Oklahoma City prices both were about $0.45/lb. below Denver. Butcher- The presence of an in-store butcher was thought to mean higher retail meat prices. However, the variable was not statistically significant in any of the models. Added costs from maintaining an in-store butcher may be reflected in meat packaging costs for that particular store (e.g., in-store packaging vs. case ready). Cut type- Ground beef was discounted $0.15/lb. compared with ground chuck products. This is expected both because of the cuts of meat that are used to produce these products and the consumer perception that ground chuck may be higher valued than simply ground product from trimmings and other carcass primal cuts. Fat content- Fat content was a significant explanatory variable of fresh ground beef products. Lower fat products earned a premium and higher fat products were discounted. Products with less than 5% fat content enjoyed a $1.13/lb. price premium when compared to packages that did not specify a fat content level. Price premiums were also found for ground products with 5-10% fat ($0.97/lb.) and 11-15% ($0.32/lb.). In contrast, products with greater than 20% were discounted $0.23/lb. compared to packages that had no specified fat content level. Fat content might be included in retail price models either as a continuous or discrete variable. Parcell and Schroeder (2007) found a $0.04/lb. price premium associated with each percentage point decrease in fat content. Package material- Case ready, custom cut, and vacuum sealed packages received price premiums of $0.27, $0.53, and $0.57/lb., respectively, when compared to foam tray packaging. Ground beef packaged in chubs was not priced significantly higher or lower than foam trays. Case ready packaging was the only package type statistically significant in all models, with premiums ranging from $0.09/lb. to $0.38/lb. Consumers apparently value leak-proof, less messy packages for ground beef products. Package size- Package size was statistically significant for ground products. As package size increased by one pound, price per pound decreased by $0.06/lb. In contrast, Parcell and Schroeder (2007) found as package size increased by one pound, price per pound decreased by $0.23/lb for ground beef. However, recall their study was over a period of time and data for this study was collected at a point in time. Discount- The discount variable was the amount per pound that a specific package was discounted. Discounted packages included those reduced for quick sale, special sale, or
14
manager’s sale. The discount variable was not statistically significant in explaining the variability in retail price per pound for fresh ground products. Expiration date- The expiration date proved to be statistically significant. Consumers paid price premiums ranging from $0.84/lb for packages with at least one week to expiration to $1.00/lb for packages with one day or less to expiration when compared to packages that did not denote an expiration date. The price difference trend for days to expiration was opposite of that expected. One would think consumers would pay a premium for fresher products, i.e., those carrying a longer time to expiration date. However, the opposite was found. Results do suggest consumers place a significant value on knowing the expiration date on ground beef products compared with packaging not indicating the expiration date. Brand and Label- The focus of this research was on retail beef branding and labeling. Brand type consisted of dummy variables for Special, Program/Breed, Store, Other, and generic or unbranded products. All branded products were priced higher than unbranded, generic ground products. Higher prices for branded products were consistent with a priori expectations. Premiums for brands ranged from $0.30/lb. for store brands to $1.45/lb. for special brands compared to generic ground products. Labeling variables offered interesting results suggesting that “No antibiotics” labels command a price premium of $0.91/lb. over products that were not labeled. “No hormones” was statistically not significant. This could be due to many observations containing both “No antibiotics” and “No hormones.” For this reason a model was estimated combining “No antibiotics”, “No hormones”, “All natural”, and “Guaranteed quality” labels into one category. However; the combination label variable indicated a price discount of $0.15/lb for combination labeling, which is opposite of what one would expect from providing more information to the consumer. “All natural” labeling also received a price discount of $0.19/lb when compared to products marketed without a special label. This could be due to the overuse and lax regulations that must be met in order to be labeled “All natural”. These results do not support evidence found by Grannis and Thilmany (2000). They found consumers were willing to pay a premium for local, natural beef; however, they found the amount of the premium paid decreased as base price increased. Steak results The steak model explained 90% of the variability in the retail steak price data set. Store level characteristics were less useful in explaining price per pound for steak cuts as with ground beef. Metropolitan area was the sole store level variable that proved to be significant. Store type- Supermarket store type was the only store type variable that was significantly different than specialty stores. Supermarkets priced steaks $1.09/lb. higher than specialty stores in the base model. Supermarkets may be a more valued source for steaks than ground beef and thus able to extract a price premium for steaks they merchandise compared with specialty stores.
15
Metropolitan area- As with ground products, both Tulsa and Oklahoma City prices were lower than Denver ($1.33/lb. for Tulsa and $1.17/lb. for Oklahoma City). The variation in the price discount was small across all models estimated. Butcher- Like models for ground products, the presence of an in-store butcher was not statistically significant in any steak model estimated. Cut type- Two of three dummy variables for steak cut were statistically significant. Ribeye was the highest price steak cut, exhibiting a price premium of $3.59/lb. compared with sirloin steak and $4.14/lb. for round steaks. T-bone steaks were statistically not significantly different than ribeye steaks. Price differences in other models estimated were quite robust. USDA quality grade- Steaks with Prime grade designations were priced significantly higher throughout the model set estimated. This is expected because Prime grade is the highest USDA quality grade for beef. It was expected that Choice steaks sold at retail would be priced significantly above Select grade steaks or ungraded steaks, sometimes called no-roll beef. USDA Prime steaks were found to receive a $2.79/lb. premium over steaks that without a grade designation. Parcell and Schroeder (2007) found price premiums ranging from $0.27/lb. to $2.46/lb. for prime steaks when compared to ungraded steaks. Studies by Killinger et. al (2004b) found willingness-to-pay price premiums for highly marbled steaks (Prime) ranging from $0.24/lb. to $1.13/lb. for Chicago participants while San Francisco participants revealed willingness-to-pay premiums of $1.47/lb. Package material- Vacuum sealed and custom cut packaging proved to be significant frequently in models estimated. Cuts packaged in vacuum sealed packages were price discounted $1.15/lb, while custom cut steaks received price premiums of $0.37/lb. Vacuum sealed packaging may not connote freshness to the consumer despite the longer shelf life due to slower deterioration from bacteria growth. Case ready packaging was not significant in any steak model estimated. Package size- Package size was significant in all models estimated. Increasing package size by one pound indicated a cost savings of $0.27/lb., slightly less than the $0.64/lb. to $0.89/lb. premiums found by Parcell and Schroeder (2007) for steak products of varying quality levels. Discount- Sale prices were not significant in any model that was estimated for the steak data set. Expiration date- Expiration date was less important for steaks than for ground products. This is not surprising as shelf life for ground products is likely perceived to be shorter than for steaks. Unlike results for ground products, the sign was as expected for steaks. For steak packages with one week to expiration, price was discounted $0.22/lb. compared to steak packages that did not have an expiration date.
16
In contrast, Killinger et al. (2004a) found consumers were willing to pay premiums of $0.74/lb. for bright, cherry-red colored steaks. Color has traditionally been used as an indicator of freshness for fresh beef. Brands and Labels- Price differences were found for retail brands of steak. Steak packages carrying a brand classified as “special”, “other”, or “program” were significant and price premiums ranged from $0.71/lb. to $5.87/lb. over generic products in the base model. Many special brands were found in specialty stores and were priced higher compared to generic products. Products carrying a special brand received an average premium of $5.87/lb. over generic products. Products with an “other” brand, on average, received $1.99/lb. price premium when compared to generic products and program brands were priced $0.71/lb. higher than unbranded steaks. Parcell and Schroeder (2007) found an average price premium of $1.08/lb. associated with an Angus branded product when compared to a store brand product. Labels that were statistically significant were “No hormones”, “All natural”, and “Source verified” labels. The “No hormones” label had a negative relationship with retail price, averaging $0.22/lb. less than steak with no special labels. This is opposite of what was expected and of what previous research has indicated. Lusk, Roosen, and Fox (2003) found consumers in France, Germany, the U.K., and the U.S. were willing to pay premiums of $0.92/lb., $0.82/lb., $1.22/lb., and $2.63/lb., respectively, for steaks produced without growth hormones. The “All natural” label increased price by approximately $0.25/lb. in the base model. This agrees with evidence found by Grannis and Thilmany (2000) showing consumers are willing to pay a premium for local, natural beef. Again, the amount of the premium consumers were willing to pay in their study decreased as base price increased for steak. Steaks labeled “Source verified” commanded an average price premium of $0.50/lb. compared to products that did not have a special label. Without additional information, one cannot determine whether this reflects a potential preference for country-of-origin or similar source-identified labels. Summary and Conclusions Primary data were collected from 65 grocery stores located in three metropolitan areas, Oklahoma City and Tulsa, Oklahoma, and Denver, Colorado. The sample population was randomly generated and attempted to represent all suburban areas in each metropolitan area, as well as, store types (specialty, supermarket, discount and warehouse club). Data were collected on 462 ground products, 175 roast products, and 756 steak products. Hedonic pricing methods were used to estimate the value consumers place on observable characteristics of fresh beef products There was some evidence retail beef brands command a price premium compared with unbranded, generic products. However, the cost of producing and processing beef products for
17
Table 4. Regression Results for Ground and Steak Products ($/lb.)
Variable Ground Steak
Intercept 2.900***
(5.57) 8.398***
(13.35) Store Type
Specialty Base Base
Supermarket -0.734 (1.54)
1.090* (1.87)
Discount -1.324*** (2.69)
0.826 (1.31)
Warehouse club -1.427*** (2.80)
1.065 (1.41)
Metropolitan Area
Denver Base Base
Tulsa -0.457*** (3.38)
-1.331*** (4.51)
Oklahoma City -0.449*** (3.33)
-1.171*** (3.98)
Butcher
Butcher -0.077 (0.61)
-0.072 (0.24)
Cut type - ground
Ground chuck Base n/a
Ground beef -0.151*** (4.15) n/a
Cut type - steak
Ribeye n/a Base
Sirloin n/a -3.587***
(46.22)
Round n/a -4.135***
(59.90)
T-bone n/a -0.086 (1.06)
Brand
Generic Base Base
18
Table 4. Regression Results for Ground and Steak Products ($/lb.)
Variable Ground Steak
Special 1.447***
(6.96) 5.872***
(25.15)
Program 0.596***
(5.53) 0.713**
(2.04)
Store 0.301***
(3.10) 0.162
(0.82)
Other 1.170***
(9.43) 1.988***
(5.38) USDA Quality Grade
USDA grade not indicated n/a Base
Standard n/a -0.273 (1.02)
Select n/a -0.694 (1.26)
Choice n/a 0.557
(1.59)
Prime n/a 2.793***
(4.04) Fat content - ground
FC not indicated Base n/a
FCL5 1.127***
(11.31) n/a
FC5-10 0.974***
(10.18) n/a
FC11-15 0.318***
(2.60) n/a
FC16-20 0.127
(1.33) n/a
FCG20 -0.232** (2.43) n/a
Package Material
Foam tray Base Base
Chub 0.006
(0.09) n/a
19
Table 4. Regression Results for Ground and Steak Products ($/lb.)
Variable Ground Steak
Case ready 0.271***
(3.07) 0.133
(1.17)
Custom cut 0.531***
(2.43) 0.373**
(2.49)
Vacuum sealed 0.569***
(2.79) -1.146*** (4.41)
Package Size
Package size -0.057***
(15.13) -0.266*** (9.41)
Discount
Discount -0.039 (0.97)
-0.021 (0.53)
Label
No special label Base Base
Antibiotics 0.909***
(5.12) 0.154
(1.23)
Hormones 0.001
(0.01) -0.218* (1.83)
All natural -0.186*** (3.87)
0.253** (2.35)
Source verified -0.064 (0.95)
0.497** (2.12)
Quality guaranteed 0.034
(0.65) -0.064 (0.57)
Expiration Date
No expiration date indicated Base Base
ExpL1 0.995***
(5.78) -0.066 (0.30)
Exp1-7 0.901***
(6.17) -0.223* (1.66)
ExpG7 0.838***
(5.61) -0.109 (0.74)
-2LLF 329.4 1834.2 R2 0.840 0.904 Number of observations 461 749
20
branding and developing a branded beef program would need to be addressed to determine if price premiums are sufficient to make beef brands profitable. This research could not address the volume impact of brands, whether or not consumers purchase more branded products due to their presumed quality and consistency. In this study, branding programs classified as “special” (i.e. no antibiotics, no hormones, all natural) offered the largest price premiums, but “other” types of branding programs offered price premiums as well. Price premiums for special brands were $1.45/lb. for ground products and $5.87/lb. for steak products. Labeling variables were not consistently significant in this study, indicating that labels associated with a brand name might offer consumers the most reassurance for their purchasing decision. From this research, the most important attributes affecting retail price per pound of ground beef products are store location (metropolitan area), store type, type of product, fat content, package size and type, expiration dates, brands and labels. Store type may be related to store reputation and the influence a store has on consumers’ perception of food safety and quality of fresh beef products. Fat content premiums and discounts were as expected. Models indicated price premiums were paid for case ready packaging. This could be due to the cleaner nature of the packaging compared to foam tray packaging. As mentioned above, both labeling and branding influence price of fresh ground products. Store location (metropolitan area) was important but store type was less important for explaining steak items than ground items. Steak prices were influenced by cut type, USDA quality grade, package size and type, and slightly by expiration date. Special brands, those paired with a special label, were priced significantly higher ($5.87/lb.) than unbranded, generic steaks. However, premiums for other brand types (program, store, and other) were smaller. Information generated from this project can be useful in designing and developing an effective retail beef marketing and branded beef marketing program. However, the research needs to be broadened geographically and repeated over time. While useful in identifying attributes or characteristics for which consumers pay a premium or expect a price discount, no demographic information was collected regarding consumers who shop at each of the 65 stores. Even with its limitations, this research may serve as a “benchmark” for future research. Comparison research may determine whether or not consumer value for a type of brand or retail beef attribute is increasing or decreasing and whether or not marketing and promotion efforts are effective at changing consumer preferences. References Barkema, A. “The New U.S. Meat Industry.” AgDM Newsletter, Iowa StateUniversity. Retrieved
January 10, 2007, from www.extension.iastate.edu/agdm/articles/others/BarJuly01.htm.
Brocklebank, A. and J. E. Hobbs. “Building Brands: Supply Chain Alliances in the Canadian Beef Industry.” University of Saskatchewan, Department of Agricultural Economics, Report prepared for Canfax Research Services, October 2004.
21
Dutton, J. “Estimating the Value of Brand and Attributes for Retail Fresh Beef Products.” Unpublished MS thesis, Oklahoma State University, 2007.
Fanatico, A. “Beef Marketing Alternatives.” Alternative Beef Marketing, Appropriate
Technology Transfer for Rural Areas. Retrieved March 30, 2007, from www.attra.ncat.org
Feldkamp, T.J., T.C. Schroeder, and J.L. Lusk. “Determining Consumer Valuation of
Differentiated Beef Steak Quality Attributes.” Journal of Muscle Foods 16(2005):1-15. Grannis, J., and D. Thilmany. “Marketing Opportunities for Natural Beef Products in the
Intermountain West.” Dept. Agri and Resource Econ. Bull. AMR 00-02, Colorado State University, June 2000.
Johnson, H., and C. E. Ward. “Market Signals Transmitted by Grid Pricing,” Journal of
Agricultural and Resource Economics 30,3(2005):3-21. Kenney, J. and D. Fallart. “Livestock Hormones in the United States.” National Food Review,
Economic Research Service, U.S. Department of Agriculture. 12(1989):21-24.
Killinger, K., C. Calkins, W. Umberger, D. Feuz, and K. Eskridge. “Consumer Sensory Acceptance and Value for Beef Steaks of Similar Tenderness, but Differing in Marbling Level.” Journal of Animal Science 82(2004a):3294-3301.
. “Consumer Visual Preference and Value for Beef Steaks Differing in Marbling Level and Color.” Journal of Animal Science 82(2004b):3288-3293.
Ladd, G.W., and V. Suvannunt. “A Model of Consumer Goods Characteristics”. American Journal of Agricultural Economics 58,3(1976):504-510.
Lusk, J., J. Fox, T. Schroeder, J. Mintert, and M. Koohmaraie. “In-Store Valuation of Steak Tenderness.” American Journal of Agricultural Economics. 83,3(2001): 539-550.
Lusk, J., J. Roosen, and J. Fox. “Demand for Beef from Cattle Administered Growth Hormones or Fed Genetically Modified Corn: A Comparison of Consumers in France, Germany, the United Kingdom, and the United States”. American Journal of Agricultural Economics. February. 85,1(2003):16-29.
Menkhaus, D J., D P.M. Colin, G. D. Whipple, and R. A. Field. “The Effects of Perceived Product Attributes on the Perception of Beef.” Agribusiness 9,1(1993):57-63.
Nixon, L. “Exploring Natural”. Beef. April, 2007.
Parcell, J. and T. Schroeder. “Hedonic Retail Beef and Pork Product Prices”. Journal of Agricultural and Applied Economics. 39,1(2007):29-46.
Png, I., and D. Reitman. “Why are Some Products Branded and Others Not?” Journal of Law and Economics. April, 38,1(1995): 207-224.
22
Purcell, W.D. “Price and Non-Price Factors Affecting Demand for Meats: Emphasis on Beef.” Dept. Ag Econ. Bull. No 4-93, Virginia Tech, November 1993.
Rosen, S. “Hedonic Prices and Implicit markets: Product Differentiation in Pure Competition. The Journal of Political Economy, 82,1(1974):34-55.
SAS Institute. SASTM system under Microsoft Windows. Release 9.1. SAS Institute Inc., Cary, NC 2002-2003.
Taylor, L.O. A Primer on Nonmarket Valuation (Vol. 3). Norwell, MA: Kluwer Academic Publishers. 2003.