improved culvert load rating through an evaluation of the
TRANSCRIPT

Improved Culvert Load Rating
Through an Evaluation of the Influence of
Cover Soil Depth,
Demand Model Sophistication, and
Live Load Attenuation Method
by
Timothy A. Wood, MSCE
A Dissertation In
Civil Engineering
Submitted to the Graduate Faculty of Texas Tech University in
Partial Fulfillment of the Requirements for
the Degree of
DOCTOR OF PHILOSOPHY
Approved by
William D. Lawson, P.E., Ph.D. Chair of Committee
Priyantha W. Jayawickrama, Ph.D.
Hoyoung Seo, Ph.D., P.E.
James G. Surles, Ph.D.
Mark Sheridan, Ph.D.
Dean of the Graduate School
December 2015

Timothy A. Wood
Copyright 2015

Texas Tech University, Timothy A. Wood, December 2015
i
TABLE OF CONTENTS
Abstract ......................................................................................................................... v
List of Tables .............................................................................................................. vii
List of Figures ............................................................................................................ viii
CHAPTER 1 Introduction ............................................................................................. 1
Policy ........................................................................................................................ 3
Load Rating Concept ................................................................................................ 4
Culvert Load Rating Research at Texas Tech University ......................................... 5
Challenges for CIP RC Box Culvert Load Rating .................................................... 7
Development of Production-Simplified Demand Models ........................................ 9
Factors Influencing Culvert Load Rating ............................................................... 14
Dissertation Outline ................................................................................................ 16
CHAPTER 2 Cover Soil Depth .................................................................................. 17
Chapter Summary ................................................................................................... 17
Introduction and Background ................................................................................. 18
Load Rating Process ........................................................................................... 18
History of Culvert Design and Load Rating Policy ............................................ 20
Use of Standard Designs ..................................................................................... 22
Method .................................................................................................................... 23

Texas Tech University, Timothy A. Wood, December 2015
ii
Population of Evaluated Culvert Standard Designs ............................................ 23
Load Rating Procedure ....................................................................................... 25
Results ..................................................................................................................... 28
Observations ....................................................................................................... 28
Distribution of load rating vs. cover soil depth relationship in the population ... 36
Implications ......................................................................................................... 39
Conclusions ............................................................................................................. 41
Acknowledgements ................................................................................................. 43
CHAPTER 3 Production-Simplified Demand Model Sophistication ......................... 44
Chapter Summary ................................................................................................... 44
Introduction ............................................................................................................. 45
Literature Review .................................................................................................... 47
Method .................................................................................................................... 51
Field test program ............................................................................................... 51
Loading method .................................................................................................. 55
Comparative analysis .......................................................................................... 56
Findings and Discussion ......................................................................................... 62
Overall performance ........................................................................................... 62
Moment diagrams ............................................................................................... 63

Texas Tech University, Timothy A. Wood, December 2015
iii
Model performance by cover soil depth ............................................................. 65
Member performance .......................................................................................... 68
Member performance summary .......................................................................... 74
Other Observations ............................................................................................. 76
Conclusions ............................................................................................................. 77
Acknowledgements ................................................................................................. 79
CHAPTER 4 Production-Simplified Live Load Attenuation Method ........................ 80
Chapter Summary ................................................................................................... 80
Introduction and Background ................................................................................. 81
Disconnect Between Observed Structural Performance and Calculated Load
Ratings ...................................................................................................................... 81
Load Rating with Production-Simplified Demand Models ................................ 83
Live Load Attenuation, Past and Present ............................................................ 86
Live Load Attenuation Methods ............................................................................. 89
Current “Top-Slab-Calibrated” Live Load Attenuation Method ........................ 89
New “Depth-Calibrated” Live Load Attenuation Method .................................. 90
Measured Moment Data .......................................................................................... 91
Data Sources ....................................................................................................... 91
Predicted Moment Calculations .......................................................................... 93

Texas Tech University, Timothy A. Wood, December 2015
iv
Typical Moment Envelopes ................................................................................ 94
Findings and Discussion ......................................................................................... 97
Observations of Moment Bias ............................................................................ 98
Observations of Moment Bias by Section .......................................................... 99
Observations of Moment Bias by Live Load Distribution ................................ 101
Load Rating Case Study .................................................................................... 104
Improved Live Load Distribution ..................................................................... 106
Conclusions ........................................................................................................... 107
Acknowledgements ............................................................................................... 107
CHAPTER 5 Conclusions ........................................................................................ 108
Summary ............................................................................................................... 108
Major Findings ...................................................................................................... 109
Limitations ............................................................................................................ 110
Future Work .......................................................................................................... 111
Work Cited ................................................................................................................ 113
APPENDIX A Distributions of Culvert Designs ...................................................... 121
APPENDIX B Moment Plots Comparing Live Load Attenuation Methods ............ 125

Texas Tech University, Timothy A. Wood, December 2015
v
ABSTRACT
This dissertation evaluates the influence of three factors – cover soil depth, demand
model sophistication, and live load attenuation method – on the load rating of cast-in-
place (CIP), reinforced-concrete (RC) box culverts. Concrete box culvert load rating
appears simple but is quite complex. The governing federal policy, analysis principles,
challenges, and the disconnect between load rating calculations and field inspection
observations are discussed in detail.
Cover soil depth above the culvert directly influences culvert load rating results in
non-linear ways. A population of Texas Department of Transportation CIP RC culvert
standard designs developed between 1930 and 1980 were load rated using AASHTO
policy guidance and a direct-stiffness demand model for a full range of cover soil depths.
Three typical rating vs. depth relationships are illustrated and described in detail. The
distribution of characteristic rating vs. depth relationships based on culvert geometry,
design cover soil depth, and design era are explored. Cover soil depth is shown to be a
critical parameter that must be explicitly considered for the intelligent load rating and
design of reinforced concrete box culverts.
Demand model sophistication influences the accuracy and precision of culvert load
rating calculations. Two production-simplified culvert load rating demand models were
analyzed using live load test data from three instrumented reinforced concrete box
culverts under four cover soil depths. The demand models were a structural-frame model
and a soil-structure interaction model. As expected, increased sophistication in the soil-
structure interaction model as compared to the structural-frame model resulted in higher

Texas Tech University, Timothy A. Wood, December 2015
vi
precision and accuracy for predicted moments. Variations in predicted moment accuracy
and precision were not uniform but are a function of the critical section location in the
culvert structure.
The soil-structure interaction model requires an out-of-plane, live load attenuation
method; this method directly affects the accuracy and precision of the culvert load rating
calculation. A new method, called the depth-calibrated method, attenuates out-of-plane
live load to the critical section depths in a culvert. The depth-calibrated method improves
current practice by increasing the accuracy and precision of live load demand predictions,
particularly in culvert walls and bottom slabs. Use of the depth-calibrated method helps
close the disconnect between calculated load rating and observed structural performance
by more accurately predicting both the location of the weakest critical section and the live
load magnitude. The effectiveness of the depth-calibrated method was evaluated by
comparing predicted live load moments to measured live load moments obtained from
published datasets from full-scale culvert load tests. A load rating example shows the
improved alignment between load rating and observed performance.
Understanding the influence of cover soil depth, modeling sophistication, and live
load attenuation allows for more accurate and precise load rating of cast-in-place,
reinforced-concrete, box culverts and better correspondence between load rating
calculations and field inspection observations. This dissertation advances the state of
production-simplified load rating practice and knowledge.

Texas Tech University, Timothy A. Wood, December 2015
vii
LIST OF TABLES
Table 1. Test culvert parameters ....................................................................................... 53
Table 2. Axle and wheel loads for test dump trucks ......................................................... 55
Table 3. Moment of inertia for specific critical sections .................................................. 58
Table 4. Project data for measured live load moments from field-tested culverts in Texas
(Lawson, et al., 2010; Wood, et al., 2015) and Nebraska (Tadros & Benak, 1989;
Abdel-Karim, et al., 1993) .................................................................................... 93

Texas Tech University, Timothy A. Wood, December 2015
viii
LIST OF FIGURES
Figure 1. A five span, CIP RC box culvert ......................................................................... 2
Figure 2. Critical section schematic .................................................................................... 5
Figure 3. Production-simplified direct-stiffness model (Lawson, et al., 2009) ................ 10
Figure 4. Production-simplified soil-structure interaction model ..................................... 13
Figure 5. Example standard designs: (a) cross-section view of pre-WWII design with
haunches (Source: TxDOT standard sheet ‘MBC-3-34-F’), and (b) post-WWII
design without haunches (Source: TxDOT standard sheet ‘MC9-1’) .................. 24
Figure 6. Representative load rating vs. cover soil depth plots for increasing, decreasing
and constant relationships (a) Increasing relationship (Source: MBC-2-34-F 1938
2 boxes 1.5mx1.5m (5ftx5ft)); (b) Decreasing relationship (Source: MC9-1 1958
5 boxes 2.7mx2.4m (9ftx8ft)); (c) Constant relationship (Source: MC10-3 1977 3
boxes 3mx2.7m (10ftx9ft)) ................................................................................... 29
Figure 7. (a) Dead load and (b) live load relationship with cover soil depth ................... 32
Figure 8. Trend plot of load rating vs. cover soil depth plot shape by design era ............ 37
Figure 9. Trend plots of load rating vs. cover soil depth relationship by culvert geometry:
(a) aspect ratio, (b) span length, and (c) barrel height .......................................... 38
Figure 10. Trend plot of load rating vs. cover soil depth plot shape by design cover soil
depth ...................................................................................................................... 39
Figure 11. Modeling sophistication illustrations: (a) Level 1, two-dimensional, direct-
stiffness, structural-frame model (Lawson, et al., 2009); (b) Level 3, two-
dimensional, linear-elastic finite-element soil-structure interaction model .......... 51

Texas Tech University, Timothy A. Wood, December 2015
ix
Figure 12. Test culvert locations and culvert images: (a) Texas county map showing test
culvert locations; (b) Swisher county; (c) Hale county; (d) Lubbock county ....... 52
Figure 13. Typical gage plan: Lubbock County culvert; white circles indicate gage pairs,
black circles indicate single gages, open circles indicate no gages ...................... 54
Figure 14. Live load configurations for the culvert load test: (a) One truck straddling gage
line; (b) Wheel on gage line; (c) Two trucks straddling gage line; (d) Data
acquisition and recording ...................................................................................... 56
Figure 15. Live load moment demand envelopes for each load test: (a) Swisher County
culvert; 0.5m (1.5ft) cover depth; (b) Lubbock County culvert; 0.6m (2ft) cover
depth; (c) Hale County culvert; 1.1m (3.5ft) cover depth; (d) Lubbock County
culvert; 1.2m (4ft) cover depth ............................................................................. 64
Figure 16. Predicted vs. measured moment demand ratios by model and cover soil depth
............................................................................................................................... 66
Figure 17. Predicted vs. measured moment demand ratios by critical section type: (a) Top
slab critical sections; (b) Bottom slab critical sections; (c) Interior wall critical
sections; (d) Exterior wall critical sections ........................................................... 69
Figure 18. Evaluation modeling accuracy for each critical section type in the primary
bending direction .................................................................................................. 75
Figure 19. (a) A five-span reinforced concrete box culvert in Swisher Co., TX; (b) critical
section schematic .................................................................................................. 85
Figure 20. (a) production-simplified, two-dimensional, linear elastic, finite element, soil-
structure interaction model for in-plane live load distribution for a two span

Texas Tech University, Timothy A. Wood, December 2015
x
reinforced concrete box culvert in Sarpy Co., NE; (b) estimated out-of-plane live
load distribution .................................................................................................... 88
Figure 21. Typical moment envelopes for the 4 span, Hale County, TX culvert. See
Figure 1 for critical section locations .................................................................... 95
Figure 22. Histogram of moment biases from 11 culvert load tests using the (a) top-slab-
calibrated method and (b) depth-calibrated method ............................................. 98
Figure 23. (a) mean and (b) standard deviation of moment bias by critical section ....... 100
Figure 24. Live load attenuation factor, 1/w (ft/ft (m/m)), as a function of depth from
ground surface for a single HS-20 truck for three live load distribution models:
elastic (Poulos & Davis, 1991; Katona, 2015), SSHB (AASHTO, 2002) and
LRFD (AASHTO, 2014) .................................................................................... 102
Figure 25. (a) mean and (b) standard deviation of bias by live load distribution ........... 103
Figure A.1. Distribution plot of load rating vs. cover soil depth plot shape by design era
............................................................................................................................. 122
Figure A.2. Trend plots of load rating vs. cover soil depth relationship by culvert
geometry: (a) aspect ratio, (b) span length, and (c) barrel height ....................... 123
Figure A.3. Distribution plot of load rating vs. cover soil depth plot shape by designcover
soil depth ............................................................................................................. 124
Figure B.1. Moment plot for Swisher Co., TX (Table 4) culvert under 1.5ft of cover soil
............................................................................................................................. 126
Figure B.2. Moment plot for Lubbock Co., TX (Table 4) culvert under 2.0ft of cover soil
............................................................................................................................. 126

Texas Tech University, Timothy A. Wood, December 2015
xi
Figure B.3. Moment plot for Hale Co., TX (Table 4) culvert under 3.5ft of cover soil . 127
Figure B.4. Moment plot for Lubbock Co., TX (Table 4) culvert under 4.0ft of cover soil
............................................................................................................................. 127
Figure B.5. Moment plot for Sarpy Co., NE (Table 4) culvert under 0ft of cover soil .. 128
Figure B.6. Moment plot for Sarpy Co., NE (Table 4) culvert under 2.0ft of cover soil 128
Figure B.7. Moment plot for Sarpy Co., NE (Table 4) culvert under 3.5ft of cover soil 129
Figure B.8. Moment plot for Sarpy Co., NE (Table 4) culvert under 6.0ft of cover soil 129
Figure B.9. Moment plot for Sarpy Co., NE (Table 4) culvert under 8.0ft of cover soil 130
Figure B.10. Moment plot for Sarpy Co., NE (Table 4) culvert under 10.0ft of cover soil
............................................................................................................................. 130
Figure B.11. Moment plot for Sarpy Co., NE (Table 4) culvert under 12.0ft of cover soil
............................................................................................................................. 131

Texas Tech University, Timothy A. Wood, December 2015
1
CHAPTER 1
INTRODUCTION
This dissertation evaluates the influence of three factors – cover soil depth, demand
model sophistication, and live load attenuation method – on the load rating of cast-in-
place (CIP), reinforced-concrete (RC) box culverts. Figure 1 shows a typical CIP RC box
culvert of the type explored in this dissertation. Load rating such a structure involves the
analytical determination of the live load capacity of all potential critical sections in the
culvert and reporting the worst-case as the maximum allowable live load for the structure.
Cover soil depth is the distance from the top slab of the culvert to the ground surface and
directly influences the dead and live loads applied to the culvert. Demand models are
analytical methods used to predict the response of the culvert to load. These demand
models vary in degree of sophistication from simple, two-dimensional (2D), production-
simplified, direct-stiffness, structural-frame models to complex, three-dimensional,
research-intensive, non-linear, finite-element, soil-structure interaction models. This
dissertation focuses on two, 2D, linear-elastic, production simplified models: (1) a direct-
stiffness, structural-frame model and (2) a linear-elastic, finite-element soil-structure
interaction model. The live load attenuation method defines how wheel loads on an actual
culvert are evaluated in a 2D demand model, particularly in the out-of-plane direction.
The actual live load must be attenuated in the out-of-plane direction in order to predict
real, three-dimensional, structural response using a 2D model. Historically, the live load
attenuation is top-slab-calibrated as a function of the cover soil depth only. This

Texas Tech University, Timothy A. Wood, December 2015
2
dissertation introduces a new live load attenuation method specifically to address load
rating challenges of critical sections at various depths. The new, depth-calibrated live
load attenuation method calculates demand magnitude as a function of the critical section
depth from the ground surface. This dissertation discusses the influence of factors in
terms of accuracy and precision. Accuracy is the degree to which the model or method
predicts the true performance and is typically quantified by the mathematical mean.
Precision deals with the scatter in the predictions and is typically quantified by range and
standard deviation. Taken together, increased understanding of cover soil depth,
modeling sophistication, and live load attenuation significantly increases accuracy and
precision in load rating calculations for CIP RC box culverts.
Figure 1. A five span, CIP RC box culvert

Texas Tech University, Timothy A. Wood, December 2015
3
Policy
Culvert load rating is one component of the National Bridge Inspection Standards
(NBIS) (Bridges, Structures, and Hydraulics, 2009). The NBIS is concerned with “the
proper safety inspection and evaluation of all highway bridges” and establishes a required
system for bridge inspection and evaluation programs (Bridges, Structures, and
Hydraulics, 2009). The NBIS references the AASHTO Manual for Bridge Evaluations
(MBE) as the document of technical authority for all its components. The MBE defines
eight phases for a complete bridge inspection plan: (1) purpose and scope, (2)
documentation, (3) bridge management systems, (4) field inspection types and frequency,
(5) inspection and evaluation methods, (6) load rating, (7) evaluation of structural fatigue
and (8) field load testing (AASHTO, 2013). This dissertation is focused on the load
rating aspect for CIP RC box culverts.
The MBE identifies three methods for load rating: load and resistance factor rating
(LRFR), load factor rating (LFR), and allowable stress rating (ASR). Additional guidance
for LRFR comes from the AASHTO LRFD Bridge Design Specifications (AASHTO,
2014). For ASR and LFR, the MBE references the Standard Specifications for Highway
Bridges (AASHTO, 2002). This dissertation primarily uses the LFR method. Each of the
three load rating methods is concerned with identifying the “live load carrying capacity
of a bridge” (Bridges, Structures, and Hydraulics, 2009).

Texas Tech University, Timothy A. Wood, December 2015
4
Load Rating Concept
The central idea of the load rating calculation is to compare the live load capacity
(capacity reduced by the dead load demand) to the live load demand. The rating factor
equation for LFR shown in Equation 1 illustrates the relationship.
RF = C − A(DA*L 1 + I
(1)
where: RF = the rating factor C = the structural capacity of the member D = the dead load effect on the member L = the live load effect on the member I = the impact factor, IM A1 = 1.3 = factor for dead loads A2 = 2.17 for Inventory Level = factor for live loads = 1.3 for Operating Level = factor for live loads (AASHTO, 2013)
Equation 1 is applied at each critical section seen in Figure 2. Critical sections are
locations on the structure where load stresses may induce failure, and for a box culvert
include midspans and corners in the top slabs, bottom slabs, and walls. The capacity,
dead load demand and live load demand must be calculated at each critical section for
each type of load (moment, shear, thrust) and each load case (total, reduced) in order to
determine the controlling rating factor for a culvert. A load rating calculation requires
that the rating factor equation be evaluated for every potential critical section location
and load case in a structure, and the lowest rating factor controls the load rating for the
whole structure. As an example, for a typical four-span culvert, the single lowest rating
factor from 468 rating factors determines the load rating for the structure. The tonnage of
the load rating vehicle used to determine the live load demand is multiplied by the lowest

Texas Tech University, Timothy A. Wood, December 2015
5
rating factor to calculate the load rating. The final load rating is the largest truck tonnage
of a particular pattern that can be carried by the structure. The typical load rating vehicle
is the HS20 truck (AASHTO, 2013). Furthermore, the critical section corresponding to
the controlling rating factor should be where initial damage on the structure would occur
as this is the analytically-identified weakest section. The load rating calculation is the
analytical component of the bridge evaluation process.
Figure 2. Critical section schematic
Culvert Load Rating Research at Texas Tech University
Culvert load rating at Texas Tech University has been funded by the Texas
Department of Transportation (TxDOT) since 2007. The first research project funded by
TxDOT, project 0-5849, explored culvert load rating and the influence of soil-structure
interaction (Lawson, et al., 2010). This project resulted in the repeatable load rating
procedure articulated in the Culvert Rating Guide and included live load field testing of
three in-service culverts. TxDOT project 0-5849 is the backbone of this dissertation. The

Texas Tech University, Timothy A. Wood, December 2015
6
Culvert Rating Guide establishes the two production-simplified models – the structural-
frame model and soil-structure interaction model – used in this dissertation (Lawson, et
al., 2009). The research report contains details associated with the measured data used to
evaluate the influence of the model sophistication and live load attenuation (Lawson, et
al., 2010).
In 2012, TxDOT funded two implementation projects with Texas Tech University.
Project 5-5849-01 resulted in the development of a culvert load rating program called
CULVLR. CULVLR allows for the rapid and error-resistant load rating of CIP RC box
culverts using both the structural-frame and soil-structure interaction models (TxDOT,
2013). Along with the development of CULVLR, TxDOT sponsored project 5-5849-03
to perform load rating calculations on a set of TxDOT design standards. The design
standard load ratings resulted in the data set used to explore the influence of cover soil
depth on culvert load rating (Wood, et al., 2013).
Most recently, TxDOT approached Texas Tech University to perform load rating
calculations for 11,000 in-service culverts on Texas roads built prior to 1980. This
research project provided the additional insight, motivation, and funding to develop the
improved depth-calibrated live load attenuation method. This latest study shows that the
improved load rating developed in the dissertation helps close the gap between load
rating results and field inspection observations (TxDOT, 2014).

Texas Tech University, Timothy A. Wood, December 2015
7
Challenges for CIP RC Box Culvert Load Rating
As simple as the rating factor equation (Equation 1) appears, culvert load rating faces
several challenges. First, CIP RC box culverts appear deceptively simply when they are
actually very complex. Structurally, a box culvert is a three-dimensional, indeterminate,
reinforced concrete structure with many critical sections. Buried structure behavior only
further complicates the prediction of performance. These complications require
specialized knowledge or overly-conservative simplifications of complex soil-structure
interaction. The combination of complex structural response and a massive number of
required calculations make culvert load rating very difficult.
Second, the load rating process for CIP RC box culverts has historically been unclear
and undocumented. A survey of state departments of transportation (DOTs) revealed
widespread confusion about the process for load rating culverts (Lawson, et al., 2010). In
response, the Texas Department of Transportation (TxDOT) generated the Culvert Rating
Guide to articulate a repeatable procedure for culvert load rating (Lawson, et al., 2009).
At the national level, the 2013 interim revisions to the MBE included explicit guidance
for box culvert load rating (AASHTO, 2013). These documents not only define the load
rating process, they also enumerate the factors that impact culvert load rating, including
those discussed in this dissertation.
Third, while improved guidance leads to increased repeatability in the load rating
process, the load rating values from the established load rating processes have failed to
corroborate field inspection observations. Load rating engineers have identified this
phenomenon as a “disconnect” between observed structure performance and calculated

Texas Tech University, Timothy A. Wood, December 2015
8
load rating. Consider a typical example; inspection of a CIP RC box culvert which shows
mild cracking in the top slab. However, when the load rating is calculated using the
methods and models recommended by the MBE, the calculations suggest load rating is
governed by a bottom slab critical section. Not only does the governing section not match
the location of the observed structural distress, but also the load rating value is low,
indicating a need for replacement. Research at both state and federal levels has attempted
to explain and reduce this disconnect (NCHRP 15-54, 2015; Han, et al., 2013; Orton, et
al., 2013; Lawson, et al., 2010; TxDOT, 2014). This dissertation seeks to shed light on
why the disconnect between observed performance and calculated load ratings exists and
how such variance might be overcome in production load rating.
Finally, load rating is performed on existing culverts. This distinction sets load rating
apart from the design of new culverts. In the case of culvert design, excessive
conservatism in the demand calculations can be “overcome” by increasing the structural
capacity with more steel and concrete. However, for load rating, the capacity is a fixed
quantity; the structure is built, completed, and in the ground. Short of retrofit or other
repair, the load rater has no ability to improve the capacity portion of the load rating
factor equation (Equation 1). If the load rater desires to improve the load rating for a
culvert that performs adequately under field inspection observation, the rater may only
improve the estimate of the dead and live load demands. This dissertation focuses on
these demand calculations.

Texas Tech University, Timothy A. Wood, December 2015
9
Development of Production-Simplified Demand Models
Additionally, this dissertation is limited to culvert load rating using production-
simplified demand models. Demand models are used to calculate the dead load and live
load demands at critical sections in a culvert structure. Demand models can range in
sophistication from research-intensive models that fully characterize the problem in three
dimensions to production-simplified models that make assumptions such that the
modeling is conservative, repeatable, and expedient. The emphasis in this dissertation is
on production load rating; therefore, this dissertation uses production-simplified models
that intentionally and conservatively simplify the soil-structure system to allow an
engineer to reliably calculate the load rating. The use of production-simplified demand
models carries with it various advantages and disadvantages.
The MBE recommends the use of a production-simplified demand model that treats
the culvert as a two-dimensional (2D) concrete frame with applied dead loads from soil
and self-weight, and applied live load from a truck load attenuated to account for cover
soil to the top slab of the culvert. This direct-stiffness, structural-frame model can be seen
in Figure 3. The benefit of the structural-frame model is that it provides a “quick,
conservative, repeatable load rating” (AASHTO, 2013). The drawback is over-
conservatism in the rating value, “particularly in the bottom slab” (AASHTO, 2013). This
over-conservatism is partially responsible for the disconnect between load rating
calculations and field inspection observations.

Texas Tech University, Timothy A. Wood, December 2015
10
Figure 3. Production-simplified direct-stiffness model (Lawson, et al., 2009)
This 2D structural-frame model is rightfully the simplest of the production-simplified
models. Culvert load rating is a subset of bridge load rating; therefore, production-
simplified culvert analysis follows bridge analysis. This approach can be described as
loads on a structure. In this case, the structure is the concrete box, and the surrounding
soil is treated as an applied load. Many years of research have attempted to accurately
define loads on buried structures. The goal of this prior research has been to define and
simplify the load conditions such that they can be applied to a structural-frame demand
model (Spangler, et al., 1926; James & Brown, 1987; Tadros, et al., 1989). Much of this
work has focused on installation stresses that are critical to culvert design; however, for

Texas Tech University, Timothy A. Wood, December 2015
11
load rating, the installation stresses are assumed to have dissipated. At the time of this
dissertation, research on long-term dead load stresses on RC box culverts is not available.
A common approach of the most recent research has been to use research-intensive,
three-dimensional, soil-structure interaction models to characterize the loads on the
structure and then simplify those loads so they may be applied to a production-simplified,
structural-frame model (McGrath, et al., 2005; Petersen, et al., 2010). This approach of
estimating loads and applying them to a culvert is a natural and appropriate way to
approach the analysis of CIP RC box culverts.
The structural-frame model carries with it certain limitations that become particularly
apparent when load rating culverts. When considering dead load, the direct-stiffness
model as applied using AASHTO guidance assumes a generally conservative soil unit
weight (18.9 kN/m3 (120pcf)) for vertical loads. Lateral loads to the exterior walls are
estimated using equivalent fluid weight for the soil based on a range of at-rest lateral
earth pressure coefficients, K0 from 0.25 to 0.5 (φ ≈ 30° - 49°). Some DOTs have found
even this lateral earth pressure to be unreasonably conservative and therefore, assume K0
varies between 0.19 to 0.38 (φ ≈ 38° - 54°) (Lawson, et al., 2010). The use of a two load
cases (total and reduced lateral load cases) to account for the unknown variability in at-
rest lateral earth pressures is helpful; however, such high internal friction angles are
inconsistent with observed construction practice of backfilling culvert installations with
native soil. Nevertheless, taken together, the assumptions for dead load are consistent
with conservative geotechnical design assumptions.

Texas Tech University, Timothy A. Wood, December 2015
12
Live load demands are very different; here the simplifications required for a
structural-frame model carry many overly-conservative assumptions. First, the live load
is attenuated as a function of depth from the ground surface to the top slab. This is
typically a conservative approximation of the elastic solution. The real challenge is how
live load is supported by the bottom slab. In a structural-frame model, the bottom slab
carries the entire load applied to the top slab, and this leads to the conservatism in the
bottom slab noted by AASHTO (AASHTO, 2013). In real culvert structures, the live load
is further attenuated through the soil and along the flow length and depth of the culvert.
The load rating values produced using the structural-frame model tend to be very
conservative and to poorly predict the regions of a culvert most likely to show damage.
The way to overcome this shortcoming is by increasing the model sophistication.
An enhanced production-simplified model is a 2D, linear-elastic, finite-element, soil-
structure interaction model shown in Figure 4. In this model, the soil-structure system is
used to predict structural response due to self-weight and vehicle loads. This increase in
modeling sophistication increases the analysis effort required, but the goal of a
production-simplified model is to generate “quick, conservative, and repeatable” load
ratings (AASHTO, 2013). The Culvert Rating Guide and the corresponding software,
CULVLR, define a soil-structure interaction model that is production-simplified
(Lawson, et al., 2009; TxDOT, 2013). This model was developed to improve load rating
accuracy and precision. Fundamentally, this model seeks to predict structural response in
the soil-structure system, rather than simply model structural response to loads on a
structure. The simplified soil loads of a structural-frame model greatly reduce the

Texas Tech University, Timothy A. Wood, December 2015
13
accuracy and precision of the predicted demands. The soil-structure system more
realistically models the actual soil-structure system. Research focused on loads-on-a-
structure has been modified to realistically estimate the structural response when
modeling the whole soil-structure system. Much of this dissertation is focused on
showing the improvement in modeling accuracy and precision that can be achieved by
this soil-structure interaction model.
Figure 4. Production-simplified soil-structure interaction model
For dead load, the soil-structure interaction model uses the unit weight, a soil
stiffness, and Poisson’s ratio to define the soil mass. The self-weight is sufficient to
define the soil-structure response under dead load.
For live load, the in-plane distribution is modeled by applying wheel loads to the
ground surface and letting the finite-element mesh redistribute the load into the structure.

Texas Tech University, Timothy A. Wood, December 2015
14
The result is a far more accurate in-plane live load distribution to the bottom slab and
walls. The out-of-plane live load distribution is still an approximation derived from
loads-on-a-structure research. The simplest application of the out-of-plane live load
distribution is to attenuate the live load to the top slab, but this approach neglects the
additional, out-of-plane distribution when estimating the bottom slab response. Since the
goal is the accurate prediction of structural response, the more natural method is to
attenuate the live load for the out-of-plane distribution to the depth of the critical section
of interest. This depth-calibrated method in a soil-structure interaction model overcomes
many of the shortcomings of the structural-frame model.
These two production-simplified models – the structural-frame model and the soil-
structure interaction model – are used in this dissertation to explore load rating of CIP RC
box culverts.
Factors Influencing Culvert Load Rating
Load rating is influenced by several factors. Some of these factors are well defined;
though they matter a great deal to the outcome of a load rating calculation, they are
expressed in the load rating problem with little room for interpretation. Other factors
require greater judgment and permit a wider range of variability.
The prime example of a well-defined factor is the culvert design. The design defines
the geometry, quality, and quantity of the steel and concrete used to build the culvert.
Clearly, design is the greatest single factor impacting a load rating; it fully defines culvert
capacity, and capacity represents one-third of the rating factor equation. Another well-

Texas Tech University, Timothy A. Wood, December 2015
15
defined factor is cover soil depth. For a particular culvert, the cover soil depth is set by
the field conditions, but it has significant impact on culvert load rating.
Other factors that influence load rating require greater engineering judgment to
define. The most significant factor requiring engineering judgment is modeling
sophistication. As discussed previously, the two models used in this dissertation are a
structural-frame model and a soil-structure interaction model, and both of these models
are considered production-simplified.
As part of the specification of these demand models, the live load distribution also
has a significant impact on the load rating. Several different live load distributions have
been developed including the elastic solution (Poulos & Davis, 1991), the SSHB
distribution (AASHTO, 2002), and various iterations on the LRFD solution (AASHTO,
2014; AASHTO, 2012; Han, et al., 2013).
The final factor that requires some engineering judgment is how the lateral soil
pressures are determined. For the structural-frame model, a range of at-rest lateral earth
pressure coefficients could be appropriate. For the soil-structure interaction model, the
main parameter is the soil stiffness. All these parameters require engineering judgment to
correctly define, and the selected values drastically influence the load rating results for a
given culvert (Lawson, et al., 2010). Each of these factors – design, cover soil depth,
modeling sophistication, live load attenuation, and lateral earth pressure – deserve
exploration. This dissertation considers cover soil depth, modeling sophistication and live
load attenuation for the load rating of CIP RC box culverts.
Texas Tech University, Timothy A. Wood, December 2015
16
Dissertation Outline
Chapter 1 of this dissertation introduces the culvert load rating concept including key
factors impacting load rating. In Chapter 2, the structural-frame model is used to evaluate
the effect of cover soil depth on culvert load rating for a population of culvert standard
designs. Chapter 3 explores the influence of modeling sophistication by comparing the
accuracy and precision of the structural-frame model versus the soil-structure interaction
model using full-scale live load test data. Here the structural-frame model is referred to as
the Level 1 model, and the soil-structure interaction model is referred to as the Level 3
model. In Chapter 4, the soil-structure interaction model is used to explore the influence
of live load attenuation method. That is, a comparison is made between the traditional
top-slab-calibrated method versus the proposed depth-calibrated method. Chapter 5
summarizes the major findings of this research and outlines those factors that remain to
be explored. This dissertation includes two appendices that present data used in the
analyses but which have not been published previously. Appendix A contains plots that
define the population of designs used in Chapter 2. Appendix B contains all moment
diagram plots used in Chapter 4.

Texas Tech University, Timothy A. Wood, December 2015
17
CHAPTER 2
COVER SOIL DEPTH
Note: Previously published as:
Wood, T. A., Lawson, W. D., & Jayawickrama, P. J. (2015). Influence of Cover Soil Depth on
Reinforced Concrete Box Culvert Load Rating. Transportation Research Record 2511, 61-
71.
Chapter Summary
This chapter describes the influence of cover soil depth on the load rating of multi-
barrel, cast-in-place (CIP), reinforced concrete (RC) box culvert designs and highlights
implications for the load rating and design of culvert structures. The basics of culvert
load rating are discussed followed by the history of culvert design policy and the
challenges created by the use of culvert standard designs. A population of Texas
Department of Transportation (TxDOT) CIP RC culvert standard designs developed
between 1930 and 1980 were load rated using AASHTO policy guidance and a two-
dimensional, direct-stiffness, structural-frame demand model for a full range of cover soil
depths. This analysis resulted in a set of 1081 load rating vs. cover soil depth
relationships. Three typical rating vs. depth relationships are illustrated and described in
detail. The distribution of characteristic rating vs. depth relationships based on culvert
geometry, design cover soil depth, and design era are explored. Cover soil depth is shown
to be a critical parameter which must be explicitly considered for the intelligent load
rating and design of reinforced concrete box culverts.

Texas Tech University, Timothy A. Wood, December 2015
18
Introduction and Background
State Departments of Transportation (DOTs) are required by federal regulation to
load rate bridge-class, cast-in-place (CIP) reinforced concrete (RC) box culverts as part
of their bridge inspection program (Bridges, Structures, and Hydraulics, 2009). The
AASHTO Manual for Bridge Evaluation (hereafter, MBE) (AASHTO, 2013) is the
document of technical authority providing policy guidance for the load rating process
using both Load and Resistance Factor Rating (LRFR) based on the current AASHTO
LRFD Bridge Design Specifications (AASHTO, 2014) , and Load Factor Rating (LFR)
and Allowable Stress Rating based on the current AASHTO Standard Specifications for
Highway Bridges (AASHTO, 2002). Throughout this chapter the LFR method has been
used consistent with the accepted MBE requirements and current implementation by state
DOTs. Observations and findings from this study may be considered generally applicable
to all three load rating methods. Load ratings are referred to in terms of tractor tonnage
for a design truck loading, often an HS20 truck.
Load Rating Process
The load rating for a culvert structure is calculated by evaluating the rating factor for
each critical section, failure mode, and load case. In box culverts, this requires that a load
rating factor be calculated for all critical sections (corners and midspans for each span
and wall), three failure modes (bending, shear, and thrust), maximum and minimum live
load demands, and, per AASHTO policy, a total and reduced lateral load case. For a two
barrel culvert, the smallest number of spans evaluated in this study, this requires the

Texas Tech University, Timothy A. Wood, December 2015
19
calculation of 21 x 3 x 2 x 2 = 252 load rating factors. Equation (1) shows the AASHTO
rating factor for the LFR method (AASHTO, 2013).
The lowest rating factor in the comprehensive set of rating factors defines the
controlling load rating for a culvert structure. This controlling rating factor is multiplied
by the tractor tonnage to calculate the load rating. The structure’s load rating essentially
defines the maximum truck load the structure can carry. By using different load factors,
two rating levels have been defined in the MBE LFR approach. The inventory rating (IR)
is the “live load which can safely utilize the bridge [or culvert] for an indefinite period of
time” (AASHTO, 2013). The operating rating (OR) is a larger load intended to identify
“the maximum permissible live load to which the structure [culvert] may be subjected"
(AASHTO, 2013). A culvert or bridge structure with an operating rating below HS20
usually requires load posting or replacement.
Three main factors contribute to the load rating of a RC box culvert: the section
capacity, dead load demand, and live load demand. Each of these factors can be
calculated based on the current policy contained in the Manual for Bridge Evaluation
(AASHTO, 2013) and Standard Specification for Highway Bridges (AASHTO, 2002) for
LFR. The Method section of this chapter provides specifics of these calculations using
LFR.

Texas Tech University, Timothy A. Wood, December 2015
20
History of Culvert Design and Load Rating Policy
Prior to World War II, culverts were often designed based on H15 and HS15 design
truck loads using allowable stress design (ASD). The modern semi-truck had yet to be
developed, and truck loads in excess of 80,000lbs which have become typical in today’s
rapidly expanding energy sector were unimaginable. Further, typical culvert spans in the
pre-WWII era were relatively small (less than 7ft), and under this situation, minimum
reinforcing steel was more than sufficient to resist design loads. Pre-WWII culvert
designs also featured haunches to reduce the demand moments in the corners. These
factors resulted in robust CIP RC box culvert designs.
After WWII, during construction of the Interstate Highway system, new culvert
standard designs were developed with an emphasis on construction economy. These
designs removed the labor-intensive haunch details and employed thinner slabs. Policy
also changed; the HS20 truck was added to the code in 1944 but was heavily debated for
decades. In 1949, the AASHTO Standard Specifications for Highway Bridges modified
the allowable stress design such that the effective soil unit weight was reduced to 70% of
18.8kN/m3 (120pcf), i.e., 13.2kN/m3 (84pcf). This was intended to produce a 40%
increase in dead load allowable stress over live load as a recognition of the increased
variability in live load compared to dead load (AASHTO, 1949). These factors made
Interstate Highway era culvert designs more economical to construct, but these culvert
structures are more prone to under-perform when evaluated by today’s load rating policy
(Kulicki, 2013).

Texas Tech University, Timothy A. Wood, December 2015
21
In the early 1970s, AASHTO adopted Load Factor Design that effectively replaced
the 70% reduction in soil dead load. Further, HS20 trucks became the required design
load (AASHTO, 1977). These policy changes required new culvert standard designs that
explicitly met the new requirements. Along with the increases in demand loads, grade 60
reinforcing steel was becoming increasingly common. Some state DOTs took advantage
of this shift by simply reissuing Interstate Highway era designs with grade 60 steel
instead of the previously-required grade 40 steel. This change significantly improved
structural capacity, thereby improving culvert performance under current load rating
requirements.
In 1994, AASHTO adopted its first LRFD Bridge Design Specifications (AASHTO,
1994) which, among other things, changed the live load distribution. In 2007, LRFD
became the exclusive design method for new structures (AASHTO, 2007).
This brief account of RC box culvert design and load rating development would be
incomplete without mentioning precast concrete boxes. Precast concrete box culverts
emerged in the 1970s as a viable solution, complete with design guidance (ASTM
Standard C1433-14, 2014; ASTM Standard C789-00, 2000; ASTM Standard C850,
2000) and analysis software (Latona, et al., 1973; FHWA, 2010). Single-cell, precast
concrete box culverts are a major section of concrete box culvert systems today, but as
noted earlier, this chapter focuses on load rating CIP RC multi-barrel box culverts.

Texas Tech University, Timothy A. Wood, December 2015
22
Use of Standard Designs
In addition to changes in policy, state DOTs, both in the past and now, have relied on
culvert standard designs to build culverts. Typically, standard design sheets present
multiple culvert designs on a single sheet, with the various designs addressing a range of
spans and box geometry but with all designs on a given sheet intended for use under one
defined range of cover soil depth. Such standard designs provide an approved and quick
way to specify a culvert for a construction project.
However, the idea of culvert standard designs has carried with it a unique set of
challenges. Often, the defined range of cover soil depths for a given culvert standard
design is rather wide (i.e., a meter or more). Functionally, a particular culvert design is
presumed to be uniformly appropriate for the entire design soil depth range. However,
this is rarely the case. The relationship between load rating and cover soil depth is highly
nonlinear. Far from being uniformly appropriate over a range of soil depths, as will be
discussed in detail in the next section, a culvert design may swing from unconservative to
overly conservative within just a meter of cover soil depth. This chapter seeks to illustrate
and describe the nonlinear interaction between culvert load rating and the cover soil
depth.

Texas Tech University, Timothy A. Wood, December 2015
23
Method
This study evaluated a set of standard CIP RC culvert designs. A culvert design will
typically have a load rating vs. cover soil depth relationship, because a design is often
applicable over a range of cover soil depths. In contrast, a culvert structure has an actual
load rating corresponding to its actual cover soil depth. At no point in this study was an
actual culvert load rated, and this is an important distinction. Further, data presented
herein will suggest that certain designs do not perform adequately when evaluated under
contemporary load rating policy. While it is reasonable to describe trends and to observe
that some designs perform better than others, this study should not be construed as the
final determination about the efficacy of a given design. Resolving such issues was
beyond the scope of this study. Other research indicates that more advanced demand
analytical modeling or non-destructive load tests may result in an adequate evaluation of
load rating performance (AASHTO, 2013; Das, 2013; Wood, et al., 2015). The results
presented herein deal only with load rating calculations for CIP RC culvert designs.
Population of Evaluated Culvert Standard Designs
The dataset evaluated in this study consisted of 1081 culvert standard designs
developed by the Texas Department of Transportation (TxDOT) between 1930 and 1980.
These standard designs were generated over three design eras: pre-WWII designs
developed in the 1930s typically with haunches (see Figure 5(a)), Interstate Highway era
designs developed in 1958 typically without haunches (see Figure 5(b)), and modernized
designs (also Figure 5(b)) which are 1977 re-releases of the Interstate Highway era
Texas Tech University, Timothy A. Wood, December 2015
24
designs with reinforcing steel increased from grade 40 to grade 60. The pre-WWII
designs comprise 30% of the population and the Interstate Highway and modernized
designs each comprise 35% of the population.
(a)
(b)
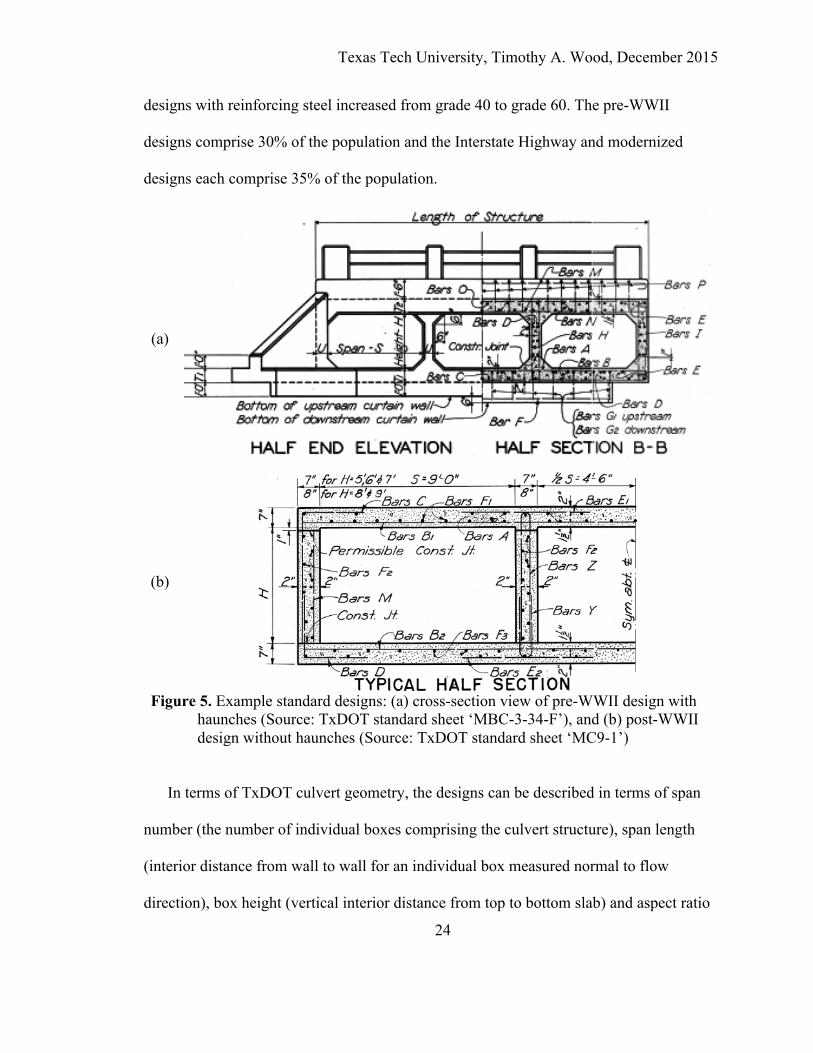
Figure 5. Example standard designs: (a) cross-section view of pre-WWII design with
haunches (Source: TxDOT standard sheet ‘MBC-3-34-F’), and (b) post-WWII design without haunches (Source: TxDOT standard sheet ‘MC9-1’)
In terms of TxDOT culvert geometry, the designs can be described in terms of span
number (the number of individual boxes comprising the culvert structure), span length
(interior distance from wall to wall for an individual box measured normal to flow
direction), box height (vertical interior distance from top to bottom slab) and aspect ratio

Texas Tech University, Timothy A. Wood, December 2015
25
(span divided by height). Each era had roughly the same distribution of designs by span
number - ranging from 2 to 6 spans. Aspect ratio was also fairly uniform between design
eras. Pre-WWII designs tend to be smaller, both in terms of span and height, compared to
post-WWII designs. The one exception to this trend is a set of 20 pre-WWII designs with
heights of 3.3m to 3.7m (11ft to 12ft). Otherwise, span length (range - 1.5m to 3m (5ft to
10ft)) and box height (range - 0.6m to 3m (2ft to 10ft)) distributions are consistently
represented in each era. Appendix A provides distributions of these independent variables
within the design standards.
The distribution of culvert designs by design cover soil depth range is also reasonably
uniform between eras. A culvert is considered a “direct traffic” culvert if the cover soil
depth is from 0m to 0.6m (0ft to 2ft). The post-WWII era standards were typically
designed for 0.6m (2ft) soil depth increments, hence designs in the 0 to 0.6m (0ft to 2ft),
0.6m to 1.2m (2ft to 4ft), and 1.2m to 1.8m (4ft to 6ft) categories. The majority of the fill
culvert designs from the pre-WWII era were intended to function over a full range of
cover soil from direct traffic up to the maximum design depth of 1.8m (6ft).
Load Rating Procedure
AASHTO policy provides guidance for load rating. For the LFR method, the capacity
calculations are consistent with civil engineering practice for CIP RC one-way slabs. The
demand guidelines in AASHTO define loads to be applied directly to an analytical
structural culvert model. The loads include dead loads (culvert self-weight plus soil) and
live loads (traffic). Vertical dead loads are determined from soil unit weight of
18.9kN/m3 (120pcf). Lateral dead loads are applied using an equivalent fluid unit weight

Texas Tech University, Timothy A. Wood, December 2015
26
of 9.4kN/m3 (60pcf). Live loads are HS20 patterned truck loads, distributed, both in-
plane and out-of-plane, through the cover soil to the top slab. AASHTO policy then
requires consideration of two load cases. A total load case applies all the dead load, truck
load, and a 0.6m (2ft) lateral traffic surcharge to the structure. A reduced lateral load case
reduces the total load case by removing the lateral traffic surcharge and half of the lateral
dead load. In this way, AASHTO documentation defines simplified soil-structure
interaction for CIP RC box culverts that can be evaluated using a simple, structural-frame
model. (AASHTO, 2013; AASHTO, 2014)
The AASHTO guidance presumes a reasonable structural-frame model will be used
to calculate demands at critical sections in the culvert. Many states have developed
software programs for the calculation of predicted demands on concrete culverts
including Alabama (Lakmazaheri & Edwards, 1996), Texas (TxDOT, 2003), and
Wyoming (Wyoming DOT, 2008). Each of these programs assumes AASHTO loadings
applied to a direct-stiffness structural-frame model. More complex multi-barrel culvert
analysis tools exist, most notably CANDE (Katona, 2015), but these require specification
of parameters beyond those provided in the AASHTO guidelines. In this study a two-
dimensional direct-stiffness, structural-frame model was used to determine demands from
policy loadings.
The modeling tool used for this study was CULV5, TxDOT's publically available
culvert analysis program (TxDOT, 2003). CULV5 uses a simple 3 line text-based input
(updated from the original punch card system) to quickly calculate demand moments,
shears, and thrusts according to AASHTO policy requirements. Furthermore, the CULV5

Texas Tech University, Timothy A. Wood, December 2015
27
analysis engine has been incorporated into TxDOT’s load rating specific software
program CULVLR (TxDOT, 2013). CULVLR allows for the digitization of culvert
parameters required for load rating. The program uses CULV5 to rapidly calculate all the
load rating factors and identifies the controlling load rating factor. With valid input
information, the calculation of a load rating, typically tedious and error-prone if done by
hand or spreadsheet, is rapid and accurate. The TxDOT Culvert Rating Guide and
CULVLR documentation provide further details about the application of AASHTO load
rating policy and the load rating method used in this study (TxDOT, 2013; Lawson, et al.,
2009).
The data evaluated in this study were generated by digitizing the population of
TxDOT culvert standard designs described previously and performing load rating
calculations for each design, over a range of soil depths, iterated at 0.15m (0.5ft)
increments. All totaled, the synthesis information described herein is based upon the
calculation of 24,015 unique culvert load ratings and over 15 million load rating factors.

Texas Tech University, Timothy A. Wood, December 2015
28
Results
The results are presented in three parts. First, observations will be made about the
typical relationships between load rating and cover soil depth. Second, the distribution of
load rating vs. cover soil depth relationship will be explored by design era, culvert
geometry, and design cover soil depth. Third, the implications of these observations for
culvert designers and load raters will be described.
Observations
Each of the 1081 standard culvert designs has a distinct load rating vs. cover soil
depth relationship. Though each culvert standard design is essentially unique, three types
(or forms) of rating vs. depth relationships emerge that are characteristic of the full
population of designs. These are termed “increasing”, “decreasing”, and “constant” as
shown in Figure 6. As the name implies, the “increasing” relationship depicts a culvert
load rating vs. cover soil depth interaction where the load rating increases with increasing
cover soil thickness above the top slab. A “decreasing” relationship is one where the load
rating decreases with increasing cover soil thickness. A “constant” relationship is one
where the culvert load rating remains essentially unchanged, regardless of the amount of
cover soil.

Texas Tech University, Timothy A. Wood, December 2015
29
(a) (b) (c)Figure 6. Representative load rating vs. cover soil depth plots for increasing, decreasing
and constant relationships (a) Increasing relationship (Source: MBC-2-34-F 1938 2 boxes 1.5mx1.5m (5ftx5ft)); (b) Decreasing relationship (Source: MC9-1 1958 5 boxes 2.7mx2.4m (9ftx8ft)); (c) Constant relationship (Source: MC10-3 1977 3 boxes 3mx2.7m (10ftx9ft))
All 1081 designs analyzed herein can be assigned to one of these three categories.
The criterion used to categorize a design as having an increasing trend required that the
operating rating increase by at least 5 HS truck tons from 0.6m to 1.8m (2ft to 6ft) of soil,
and these types of designs comprise 656/1081, or 61% of the population. The criteria for
the decreasing trend were (a) the rating vs. depth relationship maximized under 0.3m
(1ft) of soil, (b) the rating decreased between 0.6m to 1.8m (2ft and 6ft) of soil, or (c) the
design failed under dead load above 1.8m (6ft) of cover soil. Designs in the decreasing
0
1
2
3
4
0
2
4
6
8
10
12
14
16
0 10 20 30 40 50 60 70
coversoildep
th,D
(m)
coversoildep
th,D
(ft)
loadrating(HStrucktonnage)
0
1
2
3
4
0
2
4
6
8
10
12
14
16
0 10 20 30 40 50 60 70
coversoildep
th,D
(m)
coversoildep
th,D
(ft)
loadrating(HStrucktonnage)
0
1
2
3
4
0
2
4
6
8
10
12
14
16
0 10 20 30 40 50 60 70
coversoildep
th,D
(m)
coversoildep
th,D
(ft)
loadrating(HStrucktonnage)

Texas Tech University, Timothy A. Wood, December 2015
30
category comprise 314/1081, or 29% of the population. Any design not categorized as
increasing or decreasing was assigned to the “constant” category, and these comprise
111/1081, or 10% of the population.
Figure 6 provides load rating vs. cover soil depth curves for standard designs which
are illustrative of the three categories of rating vs. depth relationship. The charts in Figure
6 share some common characteristics. First, each chart provides load rating relationships
for both the inventory rating (IR) and the operating rating (OR). However, since load
posting and other culvert operational decisions focus more on the OR, this chapter will
implicitly focus on the OR curve. Second, each chart includes a shaded area, and this
shaded area corresponds to the design cover soil depth range for that particular standard
design. For example, the design cover soil depth range for the “constant” curve is 1.2m to
1.8m (4ft to 6ft); whereas, the culvert standard illustrative of the “increasing” category
was designed for a range of soil thickness from 0m to 1.8m (0ft to 6ft). Third, as an aid to
interpreting the magnitude of the OR curve, the HS20 rating is emphasized. Culvert
structures (not designs) with load ratings greater than or equal to HS20 do not require
load posting; however, structures with OR less than HS20 do require load posting.
Finally, it is helpful to think of each rating vs. depth curve in terms of three distinct depth
zones. The upper zone, from 0m to 0.6m (0ft to 2ft) of soil, corresponds to direct traffic
culverts. The deepest zone occurs below the inflection point where the rating starts to
decrease, and the zone between these two is the “low-fill” zone. Again, by way of
example, the upper zone for the “increasing” category is 0m to 0.6m (0ft to 2ft), the low-

Texas Tech University, Timothy A. Wood, December 2015
31
fill zone is 0.6m to 2.1m (2ft to 7ft), and the deepest zone extends from 2.1m to 4.6m (7ft
to 15ft). General observations can be made about these three characteristic relationships.
The first and most important observation is that each rating vs. depth curve is
nonlinear and, notwithstanding the labels, non-constant for all three categories. This
nonlinearity is expected and can be explained by considering the relationships between
capacity, dead load and live load variables in the rating factor equation (Equation 1). Per
LFR, the capacity for a particular critical section of a particular culvert design is constant;
therefore, the load rating factor can only change through changes in the dead load and
live load. The basic relationship is that an increase in dead load (more cover soil) reduces
the numerator of the rating factor equation, so the rating factor decreases. However,
increased soil attenuates (decreases) live load, and this attenuation simultaneously
increases the rating factor. Figure 7 illustrates this dynamic imbalance in the rating factor
associated with changing distributions of live load and dead load with cover soil depth.

Texas Tech University, Timothy A. Wood, December 2015
32
(a) (b)
Figure 7. (a) Dead load and (b) live load relationship with cover soil depth
Figure 7(a) illustrates how the dead load increases linearly with depth. If this alone
impacted the culvert load rating, the load rating would decrease linearly. But such is not
the case, and Figure 7(b) shows how additional cover soil depth attenuates the live load.
While the dead load relationship is linear, the live load relationship per AASHTO policy
is highly nonlinear. For 0m to 0.6m (0ft to 2ft) of cover soil, the direct traffic range, the
live load attenuates slowly due to the impact factor and direct traffic requirements. The
discontinuity in the live load attenuation at 0.3m (1.0ft) is due to the step function used to
define the impact factor for LFR (AASHTO, 2002). From 0.6m to 1.2m (2ft to 4ft), the
live load attenuates far more rapidly than the dead load builds. In this range, the load
0 25 50 75 100 125
0
1
2
3
4
0
2
4
6
8
10
12
14
16
0 1 2 3
soilpressure,σ(kPa)
coversoildep
th,D
(m)
coversoildep
th,D
(ft)
soilpressure,σ(ksf)
verticalsoilstresstotalloadcaselateralstressreducedlateralloadcaselateralstress
0
1
2
3
4
0
2
4
6
8
10
12
14
16
0% 5% 10% 15% 20%
coversoildep
th,D
(m)
coversoildep
th,D
(ft)
%ofgrossHStruckweightcarriedbya0.3m(1ft)crosssectionofculvert
liveloadattenuation

Texas Tech University, Timothy A. Wood, December 2015
33
rating is expected to rise. At 1.2m (4ft) of cover soil, live load attenuation begins to taper
off, dead load continues to increase linearly, and for 1.2m (4ft) or more of cover soil, the
load rating tends to level off until the dead load increase overshadows the live load
attenuation. It is highly unusual for a culvert design to yield anything approaching a
constant load rating vs. depth relationship. Nonlinearity in the load rating should be
expected.
Another commonality between the rating vs. depth relationships for the evaluated
culvert designs is their behavior under direct traffic. Recall that “direct traffic culverts”
are defined as having cover soil depths from 0m to 0.6m (0ft to 2ft). In this range, the live
load is completely un-attenuated by cover soil, yet dead load is increasing. The impact
factor does decrease with increasing cover soil thickness, but the net result is that through
the upper soil depth range, the load rating tends to be relatively constant. This
phenomenon holds for all three categories of rating vs. depth.
A final universal trend, already mentioned, is that for each rating vs. depth
relationship, there is an inflection point, typically at a slightly greater cover soil depth
than the maximum load rating, after which the load rating precipitously decreases to less
than zero. Through this range the factored dead load demands increase faster than the
factored live load demands attenuate until the dead load demands overwhelm the capacity
at the controlling critical section. This behavior occurs for every design, regardless of the
trend in the rating vs. depth relationship prior to the inflection point. Having made these
general observations, unique aspects of each type of relationship can be discussed.

Texas Tech University, Timothy A. Wood, December 2015
34
Increasing Load Rating vs. Cover Soil Depth Relationship
Figure 6(a) shows a representative example of a culvert design with an increasing
relationship between load rating and cover soil depth. The increasing relationship
between load rating and cover soil depth is the intuitively expected relationship for
culvert structures: lowest load rating around 0.3m (1ft), constant load rating from 0m to
0.6m (0ft to 2ft), increasing from 0.6m to 2.4m (2ft to 8ft) of fill, and precipitous
decrease in load rating as dead load overwhelms the capacity. The load rating factor
equation, capacity minus dead load divided by live load, suggests that this relationship
would be typical for cases where the capacity is adequate to resist dead load. A design
with an increasing rating vs. depth relationship is particularly helpful for culverts
intended for use under more than 0.6m (2ft) of soil.
Figure 6(a) illustrates another key load rating issue. Here, the culvert performs well
over a range from 0.9m to 4.0m (3ft to 13ft) of cover soil. However, the design was
intended for use as a direct traffic culvert. Note that even though the culvert design
exhibits suitable performance over a wide range of cover soil depths, by virtue of its
stated design soil depth range from 0m to 1.8m (0ft to 6ft), a structure based on this
design may not load rate adequately if the cover soil depth is less than 0.9m (3ft). The
nonlinear rating vs. soil depth relationship highlights how a particular culvert design may
work well for some cover soil depths, but not for others. In particular, the direct traffic
condition tends to represent the most severe loading.

Texas Tech University, Timothy A. Wood, December 2015
35
Decreasing Load Rating vs. Cover Soil Depth Relationship
Figure 6(b) shows a typical decreasing relationship between load rating and cover
soil depth. Again, in the direct traffic range from 0m to 0.6m (0ft to 2ft) of cover soil, the
load rating is relatively constant. Culvert designs characterized by this decreasing rating
vs. depth relationship have such a narrow gap between capacity and dead load that, as
dead load increases, the load rating plummets.
Designs with a decreasing relationship between load rating and cover soil depth may
indicate an economical culvert design where the design is intended for use as a direct
traffic culvert. In this case, there is no need for additional capacity at greater cover soil
depths. However, a load rating is defined by the worst-case critical section; other sections
may not be so economically designed. Unfortunately, designs characterized by decreasing
relationships often do not load rate acceptably for any cover soil depth, and such is the
case for the example depicted in Figure 6(b). In general, a decreasing relationship
between rating and depth is undesirable.
Constant Load Rating vs. Cover Soil Depth Relationship
In between culvert designs with increasing relationships and designs with decreasing
relationships are those with a constant rating vs. depth relationship. Figure 6(c) shows a
representative example. For this case, the capacity is such that the increases in dead load
and decreases in live load balance each other, providing a relatively constant load rating.
Such designs, while rare, might be very economical across a wide range of soil
depths, assuming the culvert load rates adequately (above HS20) for the intended design
cover soil depth. The example in Figure 6(c) is a case in point. Unfortunately, most of the

Texas Tech University, Timothy A. Wood, December 2015
36
curves in this category do not load rate adequately. Even if the design has an adequate,
constant relationship between rating and depth, it might only have one economically
designed critical section. Other sections might be over conservative, and not reflected in
the load rating.
Distribution of load rating vs. cover soil depth relationship in the
population
Additional analyses were performed to identify the distribution of the three
characteristic rating vs. depth relationships by design era, culvert geometry, and design
cover soil depth. Figure 8 illustrates the distribution between rating vs. depth
relationships and the design era. The modernized designs are the most likely to have an
increasing relationship between rating and depth. This better performance is expected due
to higher capacities associated with the wholesale shift from grade 40 reinforcing steel to
grade 60 and the use of design truck loads which are very similar to the current policy
loads. The pre-WWII era culvert designs are twice as likely to have an increasing
relationship rather than a decreasing relationship between rating and depth. Again, this is
not inconsistent with expected performance due to excess conservatism in the analysis
methods and the design philosophy of that era. The Interstate Highway era designs are
the most likely to have a decreasing rating vs. depth relationship.

Texas Tech University, Timothy A. Wood, December 2015
37
Figure 8. Trend plot of load rating vs. cover soil depth plot shape by design era
Figure 9 illustrates the distribution of typical rating vs. depth relationships by culvert
geometry. The likelihood of a design having an increasing rating vs. depth relationship
increases with increasing aspect ratio, as shown in Figure 9(a). Square box culvert
designs have roughly similar numbers of decreasing and increasing rating vs. depth
relationships. However, rectangular culvert designs (long span, low height) are most
likely to have an increasing relationship between rating and depth.
208
143
305
12
56
43101181
32
0%10%20%30%40%50%60%70%80%90%
100%
pre-WWII InterstateHighway
modernized%ofculvertdesignsby
desig
nera
designera
increasing constant decreasing

Texas Tech University, Timothy A. Wood, December 2015
38
(a) (b)
(c)
Figure 9. Trend plots of load rating vs. cover soil depth relationship by culvert geometry: (a) aspect ratio, (b) span length, and (c) barrel height
Figure 9(b) shows the strong correlation between the rating vs. depth relationship and
the span length. The smallest culvert designs (shorter span, lowest height) almost always
have increasing relationships. As the span increases, the likelihood of an increasing
relationship reduces. Figure 9(c) shows a similar trend based on box height. Culvert
124171 120
177
6430
3926
15
1
11885 47 59
5
0%10%20%30%40%50%60%70%80%90%
100%
1 1.25 1.5 2 2.5
%ofculvertdesignsbyaspe
ctra
tio
aspectratio,S/H
157142
13996
6557
317
9
21
38
23
3
5262 71
126
1.5 1.8 2.1 2.4 2.7 3.0
0%10%20%30%40%50%60%70%80%90%
100%
5 6 7 8 9 10
span,S(m)
%ofculvertdesignsbyspan
span,S(ft)
40102
128 127111
75 62
11
68 15
17
17 17
29
2
525 26
4659 49
44
428
10
0.6 0.9 1.2 1.5 1.8 2.1 2.4 2.7 3.0 3.3 3.6
0%10%20%30%40%50%60%70%80%90%
100%
2 3 4 5 6 7 8 9 10 11 12
height,H(m)
%ofculvertdesignsbyhe
ight
height,H(ft)
increasing constant decreasing

Texas Tech University, Timothy A. Wood, December 2015
39
designs with taller walls often have decreasing rating vs. depth relationships while culvert
designs with shorter walls often have increasing relationships between rating and depth.
Figure 10 illustrates the relationship between load rating vs. depth trend and the
design cover soil depth. That is, this chart compares how culverts perform vs. how they
were designed. As the maximum design cover soil depth increases, the likelihood of a
culvert design having an increasing rating vs. depth relationship improves. This is
consistent with the notion that a culvert designer would, at a minimum, check for
adequate capacity at the maximum and minimum design cover soil depths.
Figure 10. Trend plot of load rating vs. cover soil depth plot shape by design cover soil
depth
Implications
The nonlinearity of the load rating vs. cover soil depth relationship has profound
implications for engineers working with culvert standard designs. For load rating
engineers, this nonlinearity must be considered from the beginning. It is not sufficient to
114101 69
240132
28
3130
20
2
195
6831
20
DT(0-0.6m) 0.6-1.2m 0-1.2m 1.2-1.8m 0-1.8m
0%10%20%30%40%50%60%70%80%90%
100%
DT(0-2ft) 2-4ft 0-4ft 4-6ft 0-6ft
designcoversoildepthrange
%ofculvertdesignsby
desig
ncoversoildep
thra
nge
designcoversoildepthrange
increasing constant decreasing

Texas Tech University, Timothy A. Wood, December 2015
40
simply load rate a design for the “worst case” and assume that every application of the
design is acceptable. There is no way to identify the worst case cover soil depth for a
design without investigating the full range of depths. Rather, if load rating calculations
for a standard design are required, a load rating vs. cover soil depth curve is needed. In
practice, a load rating should be performed for an actual culvert considering the actual
cover soil depth.
Even if the CIP RC box culvert designs can be shown to load rate adequately
throughout the design range, these designs can still create challenges for engineers
involved in roadway rehabilitation or road widening projects. If the cover soil depth is
changed, a culvert which has stood the test of time under one cover soil depth may no
longer perform adequately under a new (thicker or thinner) cover soil depth. Engineers in
this position must consider the final cover soil depth explicitly.
Though culvert design was outside the scope of this study, these findings have
implications for the design process as well. For culvert designers, knowledge of the
relationship between rating and depth will help them more intelligently design
economical and serviceable culverts. Economical standards could be achieved through
tailoring designs to cover specific soil depth ranges. Improved serviceability can be
achieved by explicitly identifying the complete soil range for which the design is
appropriate.
This chapter does not explicitly address the implications of the LRFR method for load
rating CIP RC box culverts. Rather the LFR method has been used. The influence of
cover soil depth over box culverts is a function of soil-structure mechanics and therefore

Texas Tech University, Timothy A. Wood, December 2015
41
the observations made in this study concerning LFR analysis of CIP RC box culverts will
have similar implications for LRFR and design for box culvert systems.
Conclusions
The following conclusions have been demonstrated through the evaluation of 1081
standard CIP RC box culvert designs developed in Texas between 1930 and 1980.
1. The relationship between culvert load rating and cover soil depth is highly
nonlinear and non-constant. This derives from the simultaneous, yet unbalanced,
linear increase in dead load and nonlinear decrease in live load with increasing
cover soil depth.
2. Culvert designs can be characterized by three typical rating vs. depth relationships:
a. The increasing relationship between rating and depth is the preferable and
expected relationship, particularly for culvert designs intended for use with
more than 0.6m (2ft) of cover soil. The increasing relationship comprises 61%
of the evaluated standard design population.
b. The decreasing relationship between rating and depth may be acceptable for
direct traffic (0m to 0.6m (0ft to 2ft) of cover soil) culverts. However, for the
observed population, most of the time, decreasing culvert designs did not rate
acceptably at any cover soil depth. The decreasing relationship comprises 29%
of the evaluated standard design population.

Texas Tech University, Timothy A. Wood, December 2015
42
c. The constant relationship between rating and depth represents a dynamic
balance in which the increase in dead load demand and decrease in live load
demand create a near-constant load rating. The constant relationship comprises
10% of the evaluated standard design population. This rare situation is not
readily predicted by other culvert parameters. Culvert designs in this class
rarely rate acceptably at any depth.
3. Culvert design era is associated with the characteristic rating vs. depth
relationships. Modernized designs are the most likely to have an increasing
relationship and the least likely to have a decreasing relationship. The Interstate
Highway era designs are the most likely to have a decreasing relationship and the
least likely to have an increasing relationship. The pre-WWII era designs are
slightly more likely to have an increasing relationship and slightly less likely to
have a decreasing relationship.
4. Trends exist between rating vs. depth relationship and culvert aspect ratio, span
length, box height, and design cover soil depth. The likelihood of a standard design
having an increasing relationship between rating and depth improves with
increasing aspect ratio, decreasing span length, decreasing box height, and
increasing maximum design cover soil depth.
The nonlinear nature of the relationship between load rating and cover soil depth is
not always appreciated by the culvert load rating and design community. This chapter

Texas Tech University, Timothy A. Wood, December 2015
43
argues that cover soil depth must be carefully considered to effectively and intelligently
address current culvert load rating and design needs.
Acknowledgements
The Texas Department of Transportation sponsored the research work described in
this chapter. The author thanks Bernie Carrasco, P.E., Keith Ramsey, P.E., and Gregg
Freeby, P.E. of TxDOT for their technical guidance during this research.

Texas Tech University, Timothy A. Wood, December 2015
44
CHAPTER 3
PRODUCTION-SIMPLIFIED DEMAND MODEL
SOPHISTICATION
Note: Previously published as:
Wood, T. A., Lawson, W. D., Jayawickrama, P. W., & Newhouse, C. D. (2015). Evaluation of Production
Models for Load Rating Reinforced Concrete Box Culverts. J. Bridge Engineering , 20 (1),
04014057.
Chapter Summary
Analyses of two production-simplified culvert load rating demand models were
performed using live load test data from three instrumented reinforced concrete box
culverts under four cover soil depths. The demand models were a two-dimensional,
direct-stiffness, structural-frame model represented by the program, CULV5, and a two-
dimensional soil-structure interaction model represented by the program, RISA. As
expected, increased sophistication in the soil-structure model as compared to the
structural-frame model resulted in higher precision and accuracy for predicted moments.
The impact of modeling accuracy for sections in a culvert where the demand moments
approach zero was deemed practically insignificant; when evaluating model accuracy, it
is of first importance that the models predict meaningful load magnitudes. Variations in
predicted moment accuracy and precision were not uniform but are a function of the
critical section location in the culvert structure. Improvements in modeling prediction
associated with increased modeling sophistication were only seen when the structural-
frame model was very imprecise.

Texas Tech University, Timothy A. Wood, December 2015
45
Introduction
This chapter describes an evaluation of the precision and accuracy of two production-
simplified models for load rating reinforced concrete box culverts. State Departments of
Transportation (DOTs) are required by federal law (Bridges, Structures, and Hydraulics,
2009) to load rate all bridge-class structures, including bridge-class culverts, in their
systems using the American Association of State Highway and Transportation Officials
the Manual for Bridge Evaluation (MBE) (AASHTO, 2013). Load rating is an analytical
component of the structural condition evaluation process and consists of determining the
safe load carrying capacity of the culvert, determining whether specific legal or
overweight vehicles can safely cross the culvert, and determining if the culvert needs to
be restricted and, if so, what level of posting is required. The load rating process first
requires an evaluation of the structural capacity at sections that are deemed critical,
followed by estimates of the dead and live load demands under specified loading
conditions at those same sections.
Determination of structural capacities for sections within a reinforced concrete box
culvert is relatively straightforward and requires knowledge of the section and material
properties. Calculation of the demands, on the other hand, is more challenging as many
uncertainties must be considered. The degree to which the soil surrounding the culvert
loads and/or supports the culvert, the three-dimensional nature of the culvert, and the
distribution of traffic loads through the soil into the structure are just a few of the factors
which influence demand predictions.

Texas Tech University, Timothy A. Wood, December 2015
46
In routine culvert load rating applications, engineers use simple direct-stiffness
structural-frame models to evaluate the demand loads according to guidance published in
AASHTO’s Standard Specification for Highway Bridges (AASHTO, 2002) and LRFD
Bridge Design Specification (AASHTO, 2014). Such basic models are expedient and
conservative; however, over-conservatism (lack of accuracy) can lead to load rating
results that do not correspond with observed culvert performance. When culverts are
determined to be structurally deficient based on the load rating, the DOTs must load-post
or replace the structure.
This chapter is based on the idea that critical review of the culvert load rating process
– in particular, the precision and accuracy inherent in production-ready culvert models –
may offer cost-effective analytical alternatives to load-posting or replacement. The
literature review describes the establishment of a repeatable culvert load rating procedure
as derived from various policy sources. Two production-simplified box culvert load
rating models of differing sophistication are evaluated by comparing predicted moment
demands obtained from the models to measured moment demands obtained from full-
scale live load testing performed on three reinforced concrete box culverts under four
cover soil depths. Research findings will demonstrate that a soil-structure model more
precisely and accurately predicts measured structural response than a structural-frame
model. The increase in precision and accuracy is not uniform throughout the structure,
however. The implication is that when the initial load rating for a culvert is lower than
desired, a higher-order but still production-simplified model may be used to establish the

Texas Tech University, Timothy A. Wood, December 2015
47
load rating. From the findings, conclusions about the value of increasing modeling
sophistication for culvert load rating are made.
Literature Review
Culvert load rating is a subset of bridge load rating. AASHTO defines load rating as
the maximum truck tractor tonnage, typically expressed in terms of HS load designation
for older structures, permitted across a bridge [or culvert]. The load rating is expressed in
terms of two separate ratings – an Inventory Rating and an Operating Rating. The
Inventory Rating (IR) is the “live load which can safely utilize the bridge [or culvert] for
an indefinite period of time” (AASHTO, 2013). The Operating Rating (OR) is “the
maximum permissible live load to which the structure [culvert] may be subjected”
(AASHTO, 2013). The AASHTO MBE (AASHTO, 2013) provides a complex load and
resistance factor rating equation, but for the purposes of this chapter the general load
rating factor equation (Equation 1) based on the load factor rating method will suffice.
Equation 1 can be thought of as a weighted live load factor of safety calculated from
estimates of section capacity and corresponding dead and live load demands. A rating
factor must be calculated for each critical section and load combination in the structure.
In typical bridges, calculations are performed at midspans, supports, and other unique
cross-sections. The same applies to box culverts, and although they may seem simpler
than bridges, box culverts are complex indeterminate structures with many critical
sections. Each slab and wall element contains three critical sections (two corners and
midspan). Furthermore, each critical section must be checked for bending, shear and axial
thrust and each of these conditions must be checked at the maximum and minimum live

Texas Tech University, Timothy A. Wood, December 2015
48
load for a total lateral load case and a reduced lateral load case. This means that for a
culvert with N number of barrels, the number of load rating factors which must be
calculated is (9*N + 3)*3*2*2. For a single barrel culvert, 144 load rating factors must be
evaluated, and for a four barrel culvert, the number of load rating factors increases to 468.
Having calculated all these load rating factors for the critical sections, the lowest factor is
the one which controls the load rating for a culvert.
Beyond the sheer number of load rating factor evaluations, calculation of the
individual components in the load rating equation can be computationally difficult. The
capacity of each section in a reinforced concrete box culvert can be conveniently
established by interpreting the culvert members as doubly-reinforced, one-way slabs.
Demand modeling is more nuanced. The AASHTO bridge design standards (AASHTO,
2002; AASHTO, 2014) and the MBE (AASHTO, 2013) contain guidance on soil weights,
equivalent earth fluid weights and live load distributions. “In lieu of a more precise
analysis,” the default parameters are applied directly to a structural-frame model
(AASHTO, 2014). In fact, the 2013 Interim Revision to the MBE explicitly defines a
two-dimensional, direct-stiffness, structural-frame model as the preferred, conservative
load rating model (AASHTO, 2013).
Research has been done on many aspects of culvert inspection and management of
which load rating is one small part (Cahoon, et al., 2002; Salem, et al., 2012; Wissink, et
al., 2005). Still more work has been done related to culvert demands including the topics
of soil-structure interaction (Duane, et al., 1986; Gardner & Jeyapalan, 1982; Katona &
Vittes, 1982; Roschke & Davis, 1986), pressure distributions (Bennett, 2005; Kim &

Texas Tech University, Timothy A. Wood, December 2015
49
Yoo, 2005; Tadros, et al., 1989; Yang, 1999) and live load distributions (Abdel-Karim, et
al., 1990; Kitane & McGrath, 2006; Tadros & Benak, 1989). These studies focus on
demand predictions as part of design and analysis, but have not considered the impact of
demands on load rating explicitly. This chapter seeks to build upon these contributions by
considering the conceptual intersection of culvert demand modeling and production
culvert load rating.
The state DOTS have interpreted, adjusted and applied the default AASHTO
parameters in different ways. A nationwide survey of state DOTs indicates that a great
deal of confusion surrounds load rating culverts (Lawson, et al., 2010). Many states
claimed to use AASHTO, but when asked if their analysis includes soil-structure
interaction, these same states offered a mixed response. Some states modify the
AASHTO parameters in an attempt to make the analysis correspond better with their
visual inspections. The majority of responding DOTs in the study appear to only replace
culverts based on hydraulic functionality, not structural load rating. Several states quoted
the MCEB Section 7.4.1 saying, “A concrete bridge need not be posted for restricted
loading when it has been carrying normal traffic for an appreciable amount of time and
shows no distress” (AASHTO, 2003). The repeatability of culvert load rating analyses is
a concern because there are simply too many poorly-defined or questioned parameters to
be confident that two engineers will calculate the same load rating for a single culvert
structure.
The Texas Department of Transportation (TxDOT) funded research for the
development and validation of a repeatable culvert load rating procedure that fully

Texas Tech University, Timothy A. Wood, December 2015
50
synthesized and applied the available guidance from the various federal policy sources.
The Culvert Rating Guide (Lawson, et al., 2009) was the result. The Culvert Rating
Guide provides details concerning applicable AASHTO sources of policy guidance and
presents a synthesized culvert load rating flow chart including detailed guidance for
calculating section capacities, dead load demands and live load demands. The Culvert
Rating Guide specifies four tiers of analytical rigor associated with demand modeling:
Level 1 production-simplified, two-dimensional, structural-frame model; Level 2
production-simplified, two-dimensional, direct-stiffness, structural-frame model with soil
spring supports; Level 3 production-simplified, two-dimensional, linear-elastic finite-
element, soil-structure interaction model; and Level 4 research-intensive soil-structure
interaction models. The research report in support of the Culvert Rating Guide provides
in-depth details related to model selection and procedure validation (Lawson, et al.,
2010). This chapter follows the Culvert Rating Guide as an expression of the AASHTO
load rating policy relative to reinforced concrete box culverts. Only the Level 1, two-
dimensional, direct-stiffness, structural-frame model and the Level 3, two-dimensional,
linear-elastic finite-element soil-structure interaction model are evaluated in this chapter
(Figure 11). Full-scale live load tests were undertaken to evaluate the precision and
accuracy of these two demand models as one aspect of the load rating method validation
process.

Texas Tech University, Timothy A. Wood, December 2015
51
(a) (b)
Figure 11. Modeling sophistication illustrations: (a) Level 1, two-dimensional, direct-stiffness, structural-frame model (Lawson, et al., 2009); (b) Level 3, two-dimensional, linear-elastic finite-element soil-structure interaction model
Method
Beginning with two, well-defined analytical models, a research method was
developed to evaluate the demand models. The research method included identifying and
instrumenting test culverts, measuring strains while loading the culverts with dump
trucks, and then converting the strains into moments comparable to moment predictions
from the demand models.
Field test program
Test culverts
Three in-service culverts were selected for live load testing. The sample of culverts
represents a range of design eras, barrel sizes and cover soil depths. Each culvert was dry
and the surrounding soil well drained. Figure 12 shows an image and the location of each
culvert. Table 1 summarizes the culvert parameters and soil investigation findings. The

Texas Tech University, Timothy A. Wood, December 2015
52
research report presents additional detail concerning culvert designs, properties, location
and selection (Lawson, et al., 2010).
(b)
(c)
(a) (d)
Figure 12. Test culvert locations and culvert images: (a) Texas county map showing test culvert locations; (b) Swisher county; (c) Hale county; (d) Lubbock county

Texas Tech University, Timothy A. Wood, December 2015
53
Table 1. Test culvert parameters
Location Swisher County, TX
Lubbock County, TX
Hale County, TX
Facility carried FM-1318 US-84 SH-194 Annual average daily traffic, AADT,
(vehicles/day) 240 7400 2900
Culvert Properties
Cover depth of soil 0.5m (1.5ft)
0.6m-1.2m (2ft-4ft)
1.1m (3.5ft)
No. of barrels 5 4 4 Barrel span 1.8m (6ft) 3m (10ft) 3m (10ft) Height 1.8m (6ft) 2.4m (8ft) 1.8m (6ft) Constructed year 1951 1963 1991 AASHTO default soil unit weight, γ
18.9kN/m3 (120pcf)
18.9kN/m3 (120pcf)
18.9kN/m3 (120pcf)
Specified reinforcing steel strength, Fy 227MPa (33ksi)
276MPa (40ksi)
414MPa (60ksi)
Measured concrete compressive strength, f’c
67MPa (9750psi)
41MPa (6000psi)
55MPa (8000psi)
Cover Soil Properties USCS soil classification sandy clay clayey sand fat clay USCS group symbol CL SC CH
Level 1 Two-Dimensional Structural-Frame Soil Properties
Total equivalent soil fluid unit weight
9.4kN/m3 (60pcf)
9.4kN/m3 (60pcf)
9.4kN/m3 (60pcf)
Reduced equivalent soil fluid unit weight
4.7kN/m3 (30pcf)
4.7kN/m3 (30pcf)
4.7kN/m3 (30pcf)
Level 3 Two-Dimensional, Linear-Elastic, Finite-Element, Soil-Structure Interaction Soil Properties
Soil modulus of elasticity, E 62MPa (9.0ksi)
83MPa (12.0ksi)
55MPa (8.0ksi)
Assumed soil Poisson’s ratio, ν 0.3 0.3 0.3
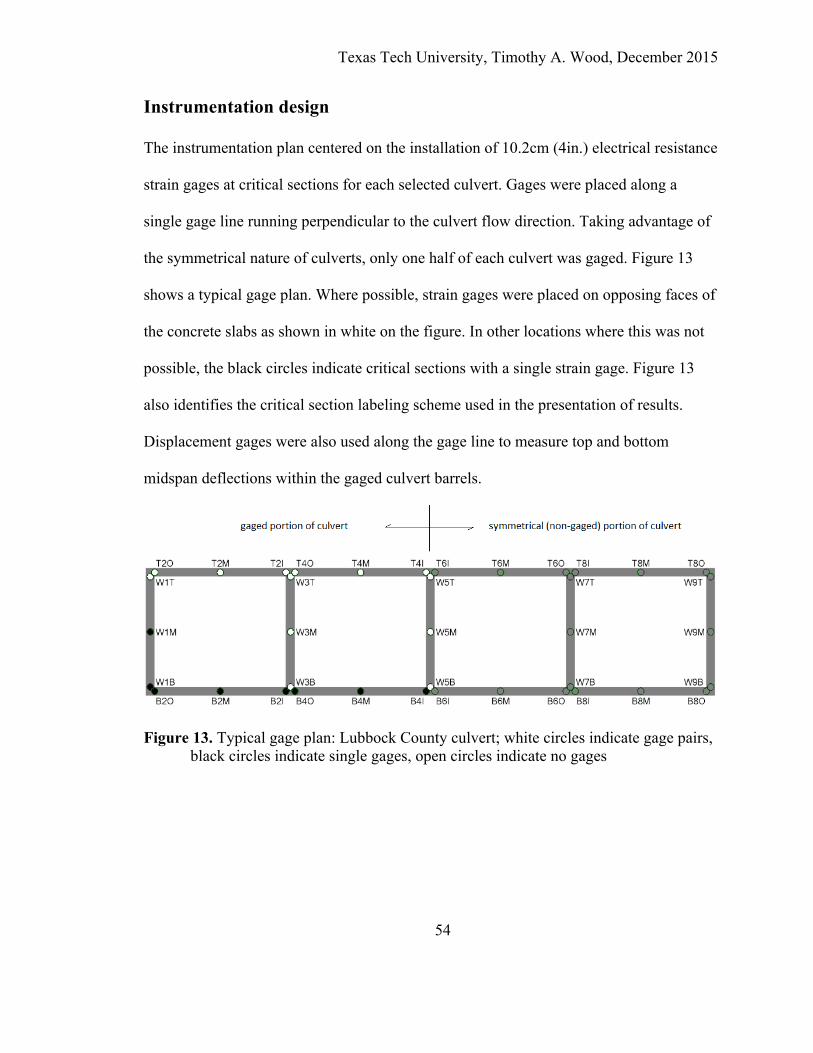
Texas Tech University, Timothy A. Wood, December 2015
54
Instrumentation design
The instrumentation plan centered on the installation of 10.2cm (4in.) electrical resistance
strain gages at critical sections for each selected culvert. Gages were placed along a
single gage line running perpendicular to the culvert flow direction. Taking advantage of
the symmetrical nature of culverts, only one half of each culvert was gaged. Figure 13
shows a typical gage plan. Where possible, strain gages were placed on opposing faces of
the concrete slabs as shown in white on the figure. In other locations where this was not
possible, the black circles indicate critical sections with a single strain gage. Figure 13
also identifies the critical section labeling scheme used in the presentation of results.
Displacement gages were also used along the gage line to measure top and bottom
midspan deflections within the gaged culvert barrels.
Figure 13. Typical gage plan: Lubbock County culvert; white circles indicate gage pairs, black circles indicate single gages, open circles indicate no gages

Texas Tech University, Timothy A. Wood, December 2015
55
Loading method
The load test design was limited to live load testing of in-service culverts in an effort
to minimize costs. The live load consisted of loaded 7.6m3 (10yd3) dump trucks weighing
approximately 222kN (50kips). Each truck had a front single axle and tandem rear axles.
The measured axle and wheel loads for the test trucks are shown in Table 2.
Table 2. Axle and wheel loads for test dump trucks Culvert Swisher County, TX Lubbock County, TX Hale County, TX
Front Axle (single) 55kN (12.3kips) 62kN (14.0kips) 51kN (11.5kips)
Rear Axles (tandem) 172kN (38.7kips) 178kN (40.0kips) 158kN (35.5kips)
Front Wheel 28kN (6.2kips) 31kN (7.0kips) 26kN (5.8kips)
Rear Wheels 43kN (9.7kips) 44kN (10.0kips) 40kN (8.9kips)
The loading design used three truck configurations, with the trucks traveling back and
forth across the culvert to create moment envelopes (Figure 14). Static measurements
were taken with the truck(s) stopped at 0.6m (2ft) intervals along the established gage
line. The goal was to measure the worst case maximum and minimum moment demands
for each critical section.

Texas Tech University, Timothy A. Wood, December 2015
56
(a) (b)
(c) (d)
Figure 14. Live load configurations for the culvert load test: (a) One truck straddling gage line; (b) Wheel on gage line; (c) Two trucks straddling gage line; (d) Data acquisition and recording
Comparative analysis
Converting strains to moment
The load tests facilitated direct measurement of strains at the culvert critical sections;
whereas, the load rating equation requires demand loads at each critical section. Moment
demands are the primary loading for most reinforced concrete box culverts. Therefore,
the measured strains were transformed into moment demands. Converting the strain

Texas Tech University, Timothy A. Wood, December 2015
57
profile into moment requires approximations of the elastic modulus and moment of
inertia for each section.
The concrete elastic modulus was calculated using the widely accepted estimate
based on the measured compressive strength from ACI 318 Section R8.5.1. The actual
concrete elastic modulus can vary from 80% to 120% of the estimated value (ACI
Committee 318, 2011). Throughout the analysis, this variance, ±20%, is presented as the
error for the measured moments.
The effective moment of inertia is a function of the cross-section thickness, amount of
reinforcing, the ratio of steel to concrete stiffness, the degree of cracking and the state of
stress in the section. Most of these parameters are unknown for an in-service culvert, and
incorporating them into an effective moment of inertia is complex. ACI 318 provides
simplified guidance based on the gross moment of inertia of the concrete section,
neglecting steel. Furthermore, ACI 318 Section R10.10.4.1 states that a stiffness
reduction factor of 0.875 was used to determine these values. From this guidance, Table 3
shows the EI stiffness parameters used to convert strain to moment.

Texas Tech University, Timothy A. Wood, December 2015
58
Table 3. Moment of inertia for specific critical sections Section EI Crack Condition
Exterior Walls 0.35𝐼4𝐸60.875 Cracked Wall
Interior Walls 0.70𝐼4𝐸60.875 Uncracked Wall
Slabs 0.25𝐼4𝐸60.875 Cracked Flat Slab
Note: Ig = the gross moment of inertia for the concrete
section, neglecting reinforcing steel Ec = concrete elastic modulus
Strain gages were placed on the inside surface of the culvert walls and slabs. In some
locations, particularly the interior culvert walls, gages were placed on both sides. For
each strain measurement with only one gage at the critical section, the curvature was
calculated assuming no axial load. For each gage couple (inside and outside gage at the
same location) the curvature was calculated based on the difference between the
measured strain on the inside and outside face of the slab.
From these inputs, the moment envelope was calculated for each gaged critical
section. The maximum and minimum moment have an estimated ±20% error based
primarily on variations in the concrete modulus of elasticity.

Texas Tech University, Timothy A. Wood, December 2015
59
Calculation of Level 1 predicted moments
AASHTO’s guidance provides loads which can be directly applied to a structural
model of a concrete culvert. In this way, AASHTO encourages the use of a Level 1 two-
dimensional, direct-stiffness, structural-frame model. State DOTs and researchers use
several programs and methods when performing a Level 1 analysis. Several DOTs have
developed their own design programs including Virginia (Latona, et al., 1973), Alabama
(Lakmazaheri & Edwards, 1996), Wyoming (Wyoming DOT, 2008) and Texas (TxDOT,
2003). In this chapter, TxDOT’s custom concrete box culvert analysis program, CULV5,
has been applied as a representative Level 1 structural-frame model (TxDOT, 2003).
The Level 1 structural-frame analysis requires AASHTO-provided soil unit weight
and lateral earth pressure input parameters as per Table 1. Furthermore, AASHTO
specifies two load cases: a total load case and a reduced lateral load case. The total load
case live load applies a 0.6m (2ft) equivalent surcharge on the exterior walls; the reduced
lateral case live load applies no lateral loads to the culvert.
The truck loads applied to the culvert are also an important Level 1 component.
CULV5 is relatively limited in this regard with only a select number of design loads. The
truck designation which most closely approximates the measured dump truck loads is the
HS25 truck. The CULV5 program automatically converts the wheel loads into distributed
loads. These distributed loads take into account load dissipation in the in-plane and out-
of-plane directions in the soil between the pavement surface and the top slab of the
culvert. They do not account for additional distribution of the wheel loads through the
soil into the walls and bottom slab of the culvert.

Texas Tech University, Timothy A. Wood, December 2015
60
Calculation of Level 3 predicted moments
The Culvert Rating Guide identifies a Level 3 two-dimensional, linear-elastic finite-
element, soil-structure interaction model of greater analytical rigor compared to the
Level 1 structural-frame model. Several types of programs representative of a Level 3
model have been used in research. The most basic and production-simplified types of
programs are represented by two-dimensional, structural-frame programs which are
capable of in-plane, finite-element, plate modeling. RISA is of this type (RISA
Technologies, LLC, 2012).
Other general-use, two-dimensional, structural finite-element programs can also be
used for a Level 3 analysis. These use true finite-element methods (not frame methods) to
model both the soil and the structure. Model generation for such programs tends to be
more text-oriented and less graphically-oriented, therefore, they tend to be more difficult
to use. These are the programs most typically associated with the Level 3 soil-structure
modeling level.
Yet another class of programs capable of Level 3 soil-structure modeling are the soil-
structure specific programs such as the two-dimensional versions of Plaxis (Kitane &
McGrath, 2006), ABAQUS (Kim & Yoo, 2005; Kitane & McGrath, 2006) and CANDE
(Katona & McGrath, 2007; Katona & Vittes, 1982; Tadros & Benak, 1989; Tadros, et al.,
1989; Abdel-Karim, et al., 1990). Though these programs are typically used for non-
linear, soil-structural models, they can be used with simple, linear-elastic soil models.
When used in this way, they are a Level 3, soil-structure model.

Texas Tech University, Timothy A. Wood, December 2015
61
The most popular of these models for culvert analysis is the specially designed
CANDE software. CANDE was created in 1975 and has been updated continuously since
that time. CANDE’s strengths are primarily in construction and dead load calculations
using non-linear soil models. However, for load rating purposes, CANDE is not user-
friendly in that moving live loads must be added as individual load cases (Katona, 2015).
When CANDE is used in conjunction with a linear-elastic soil model, the differences
between RISA with linear-elastic finite-elements and CANDE become negligible.
Therefore, though CANDE has an established history of reliability and validity, for
production load rating, substantially similar results can be achieved using simpler
programs with graphical interfaces.
The bottom line is that though many program options are available for Level 3, soil-
structure modeling, all these programs will produce approximately the same load rating
when used within the context of a two-dimensional, linear-elastic, soil-structural model.
Because the first type is the easiest to use, RISA was selected as the representative
program for a Level 3 model.
The increase in modeling sophistication of a Level 3 analysis requires additional soil
parameters to model the soil-structure interaction. Rather than using estimated lateral
earth pressures, the Level 3 model uses a soil elastic modulus and Poisson’s ratio, both of
which are shown in Table 1.
The equations for live load distribution have been derived from AASHTO’s wheel
load distributions onto a slab. For the Level 3 model, RISA’s algorithm for handling of
moving loads was implemented to apply moving point loads (RISA Technologies, LLC,

Texas Tech University, Timothy A. Wood, December 2015
62
2012). These point loads are unit lengths of equivalent line loads for the out-of-plane
distribution in the soil between the pavement surface and the top slab of the culvert. The
distribution in the in-plane direction is handled by the soil finite-element mesh. The
implication is that in-plane distribution and soil-arching of the live load are applied to the
walls and bottom slab rather than a coarse live load surcharge as used in a Level 1
structural-frame analysis. Out-of-plane distribution of the wheel loads is not accounted
for below the top slab. The measured wheel loads and spacing (Table 2) were used, as
appropriate, for each culvert.
Findings and Discussion
Overall performance
Data collected from the load tests function as reference points for the evaluation of
the models. The first consideration is the precision of the model. For each culvert section
and bending direction, the ratio of predicted moment demand vs. the measured moment
demand becomes a normalized comparator. When a subset of similar ratios is considered,
the model precision can be evaluated. A simple indicator of precision is range; as the
difference between the maximum and minimum predicted vs. measured moment becomes
smaller, the model for that subset of data increases in precision. Another indicator of
precision is scatter or distribution; if the ratios are clustered together or show very tight
inner quartiles, the precision is high. Conversely, if the distribution is uniform and the
quartiles are widely spaced, the precision is low. If the precision is reasonable, then
accuracy can be considered.

Texas Tech University, Timothy A. Wood, December 2015
63
For the purpose of this chapter, accuracy is defined as proximity of the predicted to
the actual (measured) value. As the ratio of predicted moment demand vs. measured
moment demand approaches 1.0, the prediction increases in accuracy. A single data point
can be more or less accurate. By considering the median of a subset of data, the accuracy
for a certain subset of data can be evaluated. Furthermore, if the ratio of predicted vs.
measured moment is greater than 1.0 the model is conservative.
An expected finding is that both models will be conservative. Furthermore, the
increase in sophistication between the Level 1 structural-frame model and the Level 3
soil-structure model should result in an increase in modeling accuracy. The increase in
precision and accuracy is expected for every culvert section, but the degree of precision
and accuracy may not be uniform. Additionally, the measured moments will indicate that
certain sections and bending directions have bending moments which approach zero and
therefore are less significant than larger moments for other sections and bending
directions.
Moment diagrams
Relative to overall performance, Figure 15 shows the measured moment envelope as
per the load tests, and the predicted moment envelopes for both the Level 1 structural-
frame model and the Level 3 soil-structure model for each culvert. The critical section
labels correspond to critical section locations shown in Figure 13.

Texas Tech University, Timothy A. Wood, December 2015
64
(a) (b)
(c) (d)
Figure 15. Live load moment demand envelopes for each load test: (a) Swisher County culvert; 0.5m (1.5ft) cover depth; (b) Lubbock County culvert; 0.6m (2ft) cover depth; (c) Hale County culvert; 1.1m (3.5ft) cover depth; (d) Lubbock County culvert; 1.2m (4ft) cover depth
By inspection, it does appear that both models are conservative. For most sections,
the predicted moments in each bending direction are of greater magnitude than the
measured moments. The Level 1 structural-frame model appears to be more conservative
Texas Tech University, Timothy A. Wood, December 2015
65
and less accurate than the Level 3 soil-structure model as shown by the Level 3 moment
envelope located between the Level 1 structural-frame moment envelope and the
measured moment envelope. This supports the assumption that increases in modeling
sophistication increase the modeling accuracy.
Though all sections and bending directions must be considered in a complete load
rating, Figure 15 illustrates that not all sections and bending directions experience
significant live load bending moment. For example, negative bending moment the top
and bottom midspans are always very nearly zero. These low magnitude live load
demand cases will only govern the load rating when the dead load exceeds the capacity;
otherwise, the load rating factor will be very large (consider the effect of very small live
load on Eq. 1). Therefore, these low magnitude moments should not drastically skew an
understanding of the precision or accuracy of the model. It does not really matter if the
models can accurately predict zero load; instead, the models should accurately predict
meaningful load magnitudes.
Model performance by cover soil depth
Figure 16 presents the ratios of predicted live load moment to measured live load
moment for each critical section by model and cover soil depth. Both positive and
negative bending moments are shown for each critical section (symbol Í). Quartiles for
each set of data are also identified to illustrate distribution and range. The log scale on the
x-axis indicates the ratio of predicted vs. measured moment. This means that a quartile
range to the right side of the plot is actually much larger than a similarly sized quartile
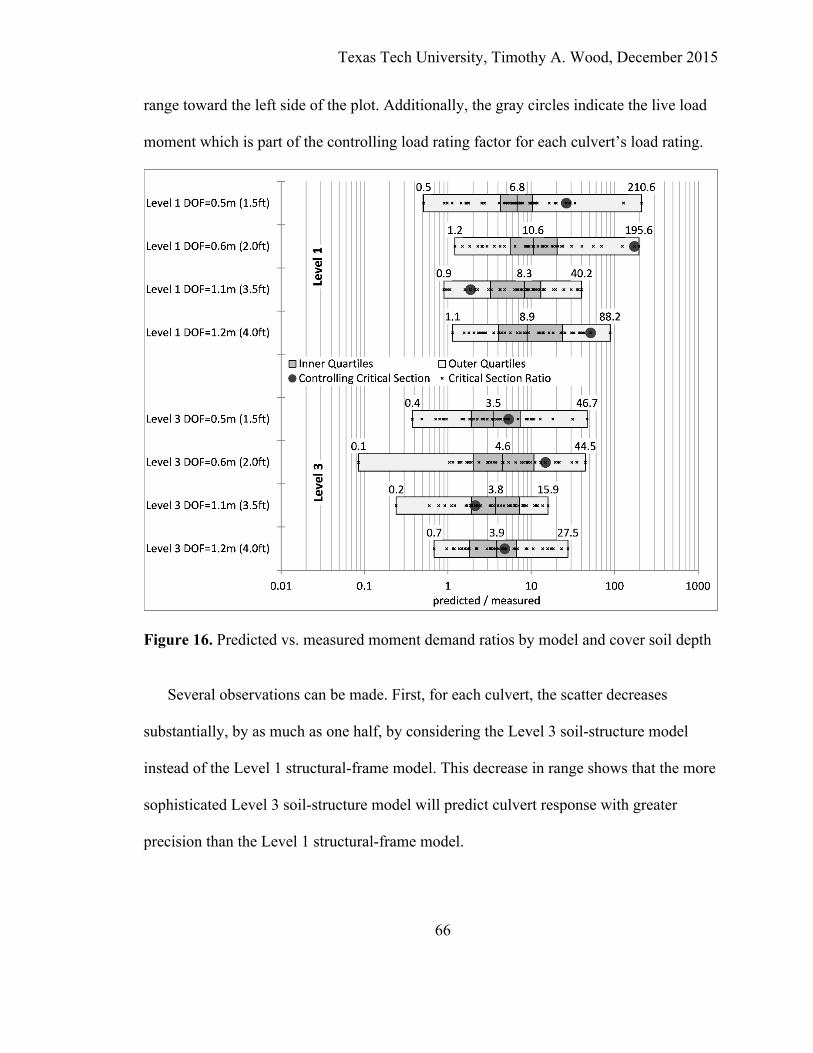
Texas Tech University, Timothy A. Wood, December 2015
66
range toward the left side of the plot. Additionally, the gray circles indicate the live load
moment which is part of the controlling load rating factor for each culvert’s load rating.
Figure 16. Predicted vs. measured moment demand ratios by model and cover soil depth
Several observations can be made. First, for each culvert, the scatter decreases
substantially, by as much as one half, by considering the Level 3 soil-structure model
instead of the Level 1 structural-frame model. This decrease in range shows that the more
sophisticated Level 3 soil-structure model will predict culvert response with greater
precision than the Level 1 structural-frame model.

Texas Tech University, Timothy A. Wood, December 2015
67
A second observation is that the median predicted vs. measured demand ratio for each
culvert decreases by approximately 55% from the Level 1 structural-frame model to the
Level 3 soil-structure model. This illustrates the increased accuracy expected from an
increase in modeling sophistication.
Third, the data suggest that with increasing cover soil depth, the range and scatter
decrease in both the Level 1 and Level 3 models. In particular, the scatter in the 1.2m
(4ft) test is less than the 0.6m (2ft) test; both were performed on the same culvert
(Lubbock County). Comparisons with the 0.5m (1.5ft) and 0.6m (3.5ft) culverts are less
conclusive due to interactions between depth of fill and culvert design. The implication is
that live load demand predictions are more erratic for shallow-fill culverts.
Most importantly, the vast majority (greater than 96% for Level 1 and 91% for Level
3) of the moment ratios are conservative (greater than 1.0). This is expected for any
predictive engineering model. For load rating, however, the final answer is not directly
dependent on the performance of every location in the structure. Rather it the critical
section with the lowest load rating factor which governs the final culvert load rating.
Further, load rating is not only a function of live load, but also of dead load and capacity.
Those locations where live load moment is under-predicted do not necessarily control the
load rating for the culvert. Rather for these load tests, the controlling critical sections
(e.g., the gray circles in Figure 16) all depict predicted vs. measured moment ratios
greater than 1.0. In the case of load rating, the occasional under-prediction of the live
load in one critical section may not result in an under-predicted load rating. Here, the

Texas Tech University, Timothy A. Wood, December 2015
68
conservatism included in the dead load and culvert section capacity values is sufficient to
indicate a load rating based on conservative live load demand predictions.
Member performance
When discussing the precision and accuracy of production-simplified culvert demand
models, it is helpful to compare predicted vs. measured moment demands at similar
critical sections for all four load tests. Though the models do not show uniform accuracy
(as would be illustrated by high precision or no scatter) throughout a single culvert, they
may show a similar level of precision and accuracy for similar sections on all the test
culverts. Such comparisons are made by exploring the ratio of predicted vs. measured
moment for subsets of data, as per Figure 17. Figure 17 must be interpreted in light of
Figure 15, recalling that the precision and accuracy with which a model predicts low
moment is not of practical significance.

Texas Tech University, Timothy A. Wood, December 2015
69
(a) (b)
(c) (d)
Figure 17. Predicted vs. measured moment demand ratios by critical section type: (a) Top slab critical sections; (b) Bottom slab critical sections; (c) Interior wall critical sections; (d) Exterior wall critical sections
Top slab
The top slab of a reinforced box culvert structure typically runs continuously over all
the walls. As a continuous member, positive bending (tension on the inside face of the
culvert) at the midspan and negative bending (tension on the outside face of the culvert)

Texas Tech University, Timothy A. Wood, December 2015
70
at the corners are of significant magnitude. However, negative moments at the midspan
and positive moments at the corners are relatively low and approach zero.
Figure 17(a) shows the ratio of predicted vs. measured moments for each model
(Level 1 structural-frame and Level 3 soil-structure), critical section type (corner or
midspan) and bending direction (positive or negative) for every top slab tested in this
study. For the large magnitude moments (positive bending at the midspans and negative
bending at the corners), the scatter is relatively low. The Level 1 structural-frame model
moment ratios vary from 1.7 to 19.6 and have very tight distributions particularly for the
top slab. The Level 3 soil-structure model moment ratios vary from 0.8 to 15.9 but the
distribution is roughly equivalent for both the midspans and corners. Though the
precision is not much increased, the accuracy (based on the median values) nearly
doubles in the Level 3 soil-structure model over the Level 1 structural-frame model.
For the low magnitude bending moments in the top slab, the precision is quite poor
for the Level 1 structural-frame model (0.9 to 69.9). Given such low precision, it is
unsurprising that the accuracy is also low. The Level 3 soil-structure model has roughly
the same range and accuracy in the low bending direction as the high bending direction.
For the low magnitude subset of data, the increase in modeling sophistication results in a
clear increase in modeling precision and accuracy. However, the ability of a model to
predict low bending moment magnitudes is not of practical interest when evaluating
production load rating demand models.

Texas Tech University, Timothy A. Wood, December 2015
71
Bottom slab
The bottom slab performs much like the top slab. The slab is continuous, and the
larger magnitude moments occur in the positive bending direction for the midspans and
negative bending direction in the corners. However, in contrast to the top slab, all
measured moments in the bottom slab are very low magnitude (see Figure 15). This is
consistent with the three-dimensional nature of the actual culvert. Wheel loads from
traffic are distributed through the soil mass into the top slab of the culvert. The load is
further distributed along the length of the culvert (out-of-plane relative to the model)
before reaction pressures develop in the bottom slab. For both Level 1 and Level 3, the
two-dimensional nature of the models does not additionally distribute the load in the out-
of-plane direction beyond the top slab.
Figure 17(b) shows the ratio of predicted vs. measured moment for all bottom slab
sections. For the Level 1 structural-frame model, there is wide range for every critical
section and every bending direction. The overall range extends from 0.9 to 210.6 times
over-predicted. Even for the most precise critical sections, negative bending in the
corners, the Level 1 structural-frame model moment ratios vary from 5.9 to 42.8. The
Level 3 soil-structure model is more precise in that the ratios range from 0.1 to 44.5, and
therefore are also slightly more accurate. The negative bending moments in the midspans
are all less than 1.0 (un-conservative) in the Level 3 soil-structure model; however, the
actual moment in this direction is very nearly zero. Though bottom slab moments are not
well predicted by either model, it is in this part of the culvert that the improvement in

Texas Tech University, Timothy A. Wood, December 2015
72
precision and accuracy by using the Level 3 soil-structure model instead of the Level 1
structural-frame model is most pronounced.
The bottom slab comparisons of predicted vs. measured moments illustrates that the
Level 1, structural-frame model over-predicts the moment by a greater degree and with
greater scatter than the Level 3, soil-structure model. More noticeably, both models are
far less accurate or precise in the bottom slab than they are in the top slab. However, the
lower magnitude moments in the bottom slab mean that the bottom slab is less likely to
control a load rating.
Interior walls
The interior walls are unique among culvert elements tested in this study because the
interior walls experience no directly-applied load. Rather, rotation in the top and bottom
slabs induces bending in the wall ends. The bending moment in interior wall sections is
therefore much smaller than bending moment in the top and bottom slabs. Because there
is no directly applied load, the bending direction is not critical for the interior walls.
Figure 17(c) shows the ratio of predicted to measured live load demand for the top,
middle and bottom interior wall sections for both the Level 1 and Level 3 analysis. The
top corners of the interior walls are reasonably well modeled by both Level 1 and Level 3
models. For both cases, the ratio between predicted and measured moments varies from
slightly less than 1.0 (under-predicted) to around 4.0 (over-predicted). The median
predicted moment for both models is around 1.8 times the measured moment. Therefore,
the increase in modeling sophistication does not noticeably increase either the accuracy
or precision of the moment prediction for this part of the culvert.

Texas Tech University, Timothy A. Wood, December 2015
73
The midspans and bottom corners in the interior walls are more typical with the
Level 1 structural-frame model having less precision or accuracy than the Level 3 soil-
structure model. The actual moment in these sections is relatively small, therefore any
lack of accuracy in these predictions is unlikely to greatly influence the load rating for the
whole structure.
Exterior walls
The main difference between moments in the exterior walls vs. moments in the
interior walls is the importance of bending direction. For interior walls, the bending is of
the same magnitude in both the positive and negative bending directions due to the lack
of direct load applied to the wall. The exterior wall on the other hand has external soil
load, therefore, the moment is not symmetric. Figure 17(d) illustrates this point by
showing the ratios of predicted to measured live load moment.
For the top corner in the negative bending direction (the direction that matters), both
models are relatively precise and accurate. Where the Level 1 structural-frame model is
precise and accurate, the Level 3 soil-structure model cannot offer much improvement. In
the positive bending direction, the moment predictions for the top corner are less precise,
but the net effect on the final load rating is insignificant since the positive bending
magnitude is so low. For the bottom corner, the Level 3 soil-structure model shows a
moderate degree of precision and accuracy in both bending directions and is slightly
more precise than the Level 1 structural-frame model.
The predicted vs. measured moment ratios in the exterior wall midspans show a great
degree of scatter in both models. Due to dead load, the positive bending case generally
Texas Tech University, Timothy A. Wood, December 2015
74
sees more cumulative (dead and live) moment. In the positive bending direction, the
measured live load moments in the exterior wall midpans are relatively low, therefore,
the predicted moment precision is very poor. For the Level 1 soil-structure model, the
ratios range from 9.0 to 127.8. The Level 3 soil-structure model predicts much more
precisely and accurately, though the ratio range between 1.6 and 46.7 is not excellent.
The attenuation of wheel loads with depth may be affecting the accuracy of the
predictions in much the same way it impacts the relative accuracy between the top and
bottom slabs. As a microcosm of the whole culvert, the exterior walls see great variations
in modeling precision and accuracy between critical sections and bending directions and
mixed degrees of improvement from the Level 3 soil-structure model as opposed to the
Level 1 structural-frame model.
Member performance summary
Figure 18 summarizes the findings from the analysis of modeling accuracy and
precision in each part of the culvert. Data are shown only for the significant bending
direction for each critical section. The y-axis shows the ratio of predicted moment vs.
measured moment in the normal scale. Along this axis, the quartiles for the ratios
associated with the primary bending direction are shown. The x-axis identifies the critical
section classes.

Texas Tech University, Timothy A. Wood, December 2015
75
Figure 18. Evaluation modeling accuracy for each critical section type in the primary bending direction
Figure 18 supports some useful observations. The Level 1 model offers a large level
of conservatism throughout (predicted/measured moment rations greater than 1.0), but the
bottom slab midspan and the exterior wall midspan show excessively large scatter. The
scatter is also proportionally larger for these same sections in the Level 3 analysis even
though the ratios are much improved over the Level 1 analysis. In contrast, the top
exterior wall corner is well predicted by both a Level 1 and Level 3 model. If the top
exterior wall corner controls the load rating, then an increase in modeling sophistication
Texas Tech University, Timothy A. Wood, December 2015
76
is unlikely to achieve an increase in precision or accuracy. The other critical sections
show degrees of improvement with the shift from Level 1 to Level 3.
The clearest observation from Figure 18 is that the precision and accuracy for an
individual analysis method is not uniform for all sections in their most significant
bending directions. Interestingly, only the degree of accuracy and precision is dependent
on model sophistication. Trends for the variation with critical section appear the same for
each model: low accuracy and precision in the bottom slab midspans and exterior wall
midspans, high accuracy and precision in the top slabs and top wall corners.
Other Observations
Throughout this chapter, the findings have been expressed in terms of live load
demand model precision (degree of scatter) and accuracy (proximity of predicted to
measured demands). However, it should be emphasized that live load demands tell only
part of the load rating story. The load rating for a particular culvert structure is intended
to provide a quantitative measure of the condition of the structure. DOTs seldom witness
structural failures of older, in-service reinforced concrete box culverts, yet when these
culverts are load-rated using a Level 1 type demand model, it is not uncommon for the
load rating results to show a need for load-posting or culvert replacement.
The apparent disconnect between observed reinforced concrete box culvert
performance (from a visual inspection) and reinforced concrete box culvert load rating
(from analysis) may be due to over-conservatism stemming from a lack of modeling
precision and accuracy. Alternatively, such a disconnect may be due to limitations of

Texas Tech University, Timothy A. Wood, December 2015
77
visual observations to detect structural damage. For example, cracks forming on the soil
side of the culvert slabs might not be visible during an inspection.
What can meaningfully be extracted from this research is a culvert load rating method
that is repeatable and offers increased precision and accuracy by taking advantage of
increasing sophistication in the production demand models selected for load rating. More
work remains to fully establish correspondence between the actual structural performance
and all aspects of the load rating process. Variations in culvert input parameters, material
strengths, structural damage, backfill conditions, loading history, capacity prediction
models and soil-structure interaction models contribute to the validity of the demand
model and load rating.
Conclusions
In this evaluation of production-simplified culvert load rating models, predicted live
load demand moments have been compared to measured live load demand moments in
order to comment on the precision and accuracy of a Level 1, two-dimensional, direct-
stiffness, structural-frame model and a Level 3, two-dimensional, linear-elastic finite-
element, soil-structure interaction model. The following conclusions are supported with
data from live load testing of three in-service box culverts under four cover soil depths.
1. The Level 1 structural-frame model and the Level 3 soil-structure model provide
conservative predictions for live load demands used in load rating calculations.
Reasonable confidence can be placed in the conservatism of the demand
predictions, particularly when considering the complex and interdependent nature
of load rating as a function of live load, dead load and capacity.

Texas Tech University, Timothy A. Wood, December 2015
78
2. The increase in modeling sophistication from Level 1 to Level 3 improves both the
precision and accuracy of the demand predictions, i.e. the Level 3 soil-structure
model predicts demands better than the Level 1 structural-frame model.
3. Careful analysis of predicted and measured moment demands by culvert section
and bending direction reveals that all culvert sections do not hold the same practical
significance for load rating. When the moment demand for a section and bending
direction approaches zero, the corresponding load rating factor will not control the
load rating; therefore, the relative accuracy of this predicted demand does not
impact the evaluation of the model.
4. The precision and accuracy of both the Level 1 structural-frame model and the
Level 3 soil-structure model vary relative to culvert section (top slab midspans,
bottom slab corners, etc.). Predicted moment demands for top slabs and corners are
far more precise and accurate than predicted moment demands for bottom slabs and
corners.
5. For the top exterior wall corners and top midspans of culverts, the precision and
accuracy of Level 1 structural-frame demand predictions are high and offer little
margin for improvement through reanalysis using the Level 3 soil-structure model.
Conversely, sections where the Level 1 structural-frame modeling precision is low,
significant potential for improvement through a Level 3 soil-structure reanalysis
exists.
Two-dimensional, structural-frame models can be used to quickly predict safe culvert
load ratings. However, when the simplest model identifies a load rating value which calls

Texas Tech University, Timothy A. Wood, December 2015
79
for load-posting or replacement of the culvert, the extra effort needed to identify
parameters and create a two-dimensional, linear-elastic, finite-element, soil-structure
model will likely increase the precision and accuracy of the demand predictions while
still maintaining an appropriate degree of conservatism for the load rating. In states with
thousands of in-service reinforced concrete box culverts, older, adequately-performing
culverts (based on inspection) may be shown sufficient (based on load rating) through
increased, production-simplified, analytical effort at a much lower cost than load-posting
or replacement.
Acknowledgements
The authors thank the Texas Department of Transportation for funding this work as
part of the research project 0-5849 Evaluating Existing Culverts for Load Capacity
Allowing for Soil Structure Interaction.

Texas Tech University, Timothy A. Wood, December 2015
80
CHAPTER 4
PRODUCTION-SIMPLIFIED LIVE LOAD ATTENUATION
METHOD
Note: Submitted to Standing Committee on Culverts and Hydraulic Structures of the Transportation
Research Board for presentation and publication as:
Wood, T. A., Lawson, W. D., Surles, J. G., Jayawickrama, P. J., & Seo, H. (2015). Improved Load
Rating of Reinforced Concrete Box Culverts through Depth-Calibrated Live Load
Attenuation.
Chapter Summary
This chapter describes an out-of-plane live load attenuation method for the load rating
of reinforced concrete box culverts using a production-simplified, two-dimensional,
linear-elastic, finite-element, soil-structure interaction model. The new method, called the
depth-calibrated method, attenuates out-of-plane live load to the critical section depths in
a culvert. The method improves current practice by increasing the accuracy and precision
of live load demand predictions, particularly in culvert walls and bottom slabs. Use of the
depth-calibrated method helps close the disconnect between calculated load rating and
observed structural performance by more accurately predicting both the location of the
weakest critical section and the live load magnitude. The depth-calibrated method also
moves the model toward more uniform accuracy and precision across all critical sections.
This chapter illustrates the effectiveness of the depth-calibrated method by comparing
predicted live load moments to measured live load moments obtained from published
Texas Tech University, Timothy A. Wood, December 2015
81
datasets from full-scale culvert load tests. A load rating case study shows the improved
alignment between load rating and observed performance.
Introduction and Background
This chapter describes a depth-calibrated live load attenuation method that improves
the accuracy and precision of demand predictions for culvert load rating by attenuating
out-of-plane live load to each critical section depth in a culvert. The depth-calibrated
method is specific to cast-in-place (CIP), reinforced concrete (RC) box culverts, and
functions within the following context. First, culvert load rating requires a structural
analysis model, and a valid model should predict both the form and the magnitude of
structural response. Alignment between predicted and measured performance is a
fundamental requirement. Second, engineers typically use production-simplified demand
models for routine culvert load rating as opposed to research-intensive models in an
attempt to balance work effort with analysis sophistication. Third, the state of practice for
culvert load rating with production-simplified models focuses on live load induced
pressures on the top slab. However, load rating of RC box culverts requires evaluation of
all sections of the culvert structure, not just the top slab. Load rating benefits from a focus
on live load induced structural response predicted throughout a culvert.
Disconnect Between Observed Structural Performance and
Calculated Load Ratings
Federal law requires state DOTs to conform to the National Bridge Inspection
Standards (NBIS) for “the proper safety inspection and evaluation of all highway

Texas Tech University, Timothy A. Wood, December 2015
82
bridges” (Bridges, Structures, and Hydraulics, 2009). By NBIS definition, “bridge”
includes RC box culverts with a total span of 6m (20ft) or greater, of which thousands are
in service in the United States. Further, the NBIS incorporates the AASHTO Manual for
Bridge Evaluation (MBE) by reference (AASHTO, 2013). The MBE outlines a system of
documentation, field inspection, load rating, and field-testing that together satisfy the
requirements of the NBIS.
Per the NBIS, typically, routine bridge inspections are performed every 24 months
(Bridges, Structures, and Hydraulics, 2009). A qualified engineer visits and carefully
examines the culvert structure, notes any damage, and assigns condition ratings to the
culvert and its elements (AASHTO, 2013). Culvert elements include top slabs, bottom
slabs and walls. Typically, field inspections show that in-service RC box culverts perform
very well. For example, the Texas Department of Transportation (TxDOT) maintains an
inventory of 11,000 pre-1980 bridge-class culverts, and these structures show an average
overall condition rating of 7 out of 9, which recognizes “light” to “insignificant” damage
“not requiring corrective action” (FHWA, 1995). Structural condition ratings greater than
4 to 5 are typically adequate so as not to require load posting, replacement, or retrofit.
Good structural performance per routine bridge inspections is expected and is
consistent with NBIS goals and objectives. However, highway officials at both the state
and federal levels have noted a disconnect between field inspection results and calculated
load rating values (NCHRP, 2013). The typical case is that an older, in-service RC box
culvert shows little structural damage, but the calculated load rating for the structure
indicates that the culvert does not have adequate capacity for an HS20 truck and would

Texas Tech University, Timothy A. Wood, December 2015
83
require load posting or possibly replacement. The significant problem is that “overly
conservative rating procedures result in expensive replacements or upgrades, while
unconservative rating procedures could result in future highway load limitations,
premature deterioration, and even sudden failures” (NCHRP, 2013). Sponsored research
projects (NCHRP 15-54, 2015; Lawson, et al., 2010; Han, et al., 2013; Orton, et al.,
2013) have sought to overcome this disconnect within the framework of existing policy.
The live load attenuation method introduced in this chapter helps close the disconnect by
improving the accuracy and precision of the demand model.
Load Rating with Production-Simplified Demand Models
Culvert load rating is a component of the NBIS and involves numerical calculations
to determine the safe load carrying capacity of the culvert structure, whether specific
legal or overweight vehicles can safely cross the culvert, and the level of posting required
if needed. The MBE provides three methods for load rating: load and resistance factor
rating (LRFR), load factor rating (LFR), and allowable stress rating (ASR). For this
chapter, the LFR rating factor equation will suffice to summarize the principles of load
rating. Equation 1 shows the rating factor equation.
The rating factor is essentially a live load factor of safety for a particular section in a
structure. If the rating factor is greater than 1.0, the section can carry the applied live load
at that section; if less than 1.0, the section does not have adequate capacity. The LFR
rating factor equation accommodates two rating levels, the inventory rating level (IR) and
operating rating level (OR). The IR represents the design capacity of the structure given
its current condition. The OR represents the maximum load carrying capacity of the

Texas Tech University, Timothy A. Wood, December 2015
84
structure. Repeated loading at the OR level is expected to cause damage to the structure.
The rating for the section is calculated by multiplying the rating factor by the nominal
tonnage of the load rating truck. The typical live load for the LFR method is the HS20
truck, nominally, a 20 ton load rating truck. The lowest rating from all sections governs
the load rating for the structure. (AASHTO, 2013)
The MBE explicitly identifies those critical sections on an RC box culvert where
rating factors must be calculated. Figure 19(a) shows an in-service culvert. Figure 19(b)
illustrates critical sections where demand moments, shears, or thrusts would maximize on
a unique cross section of a culvert element; i.e. corners and midspans. Unique rating
factors must be calculated for all critical sections, demand types, bending directions, and
load cases. For example, a typical 4-span RC box culvert can have as many as 468 rating
factor calculations; the lowest one rating factor will govern the load rating. In this way,
the load rating not only indicates the safe carrying live load capacity of the culvert, but
also the location of the weakest section. Ideally, calculated load rating results will
corroborate field performance by correctly predicting the weakest section where damage
would first occur.
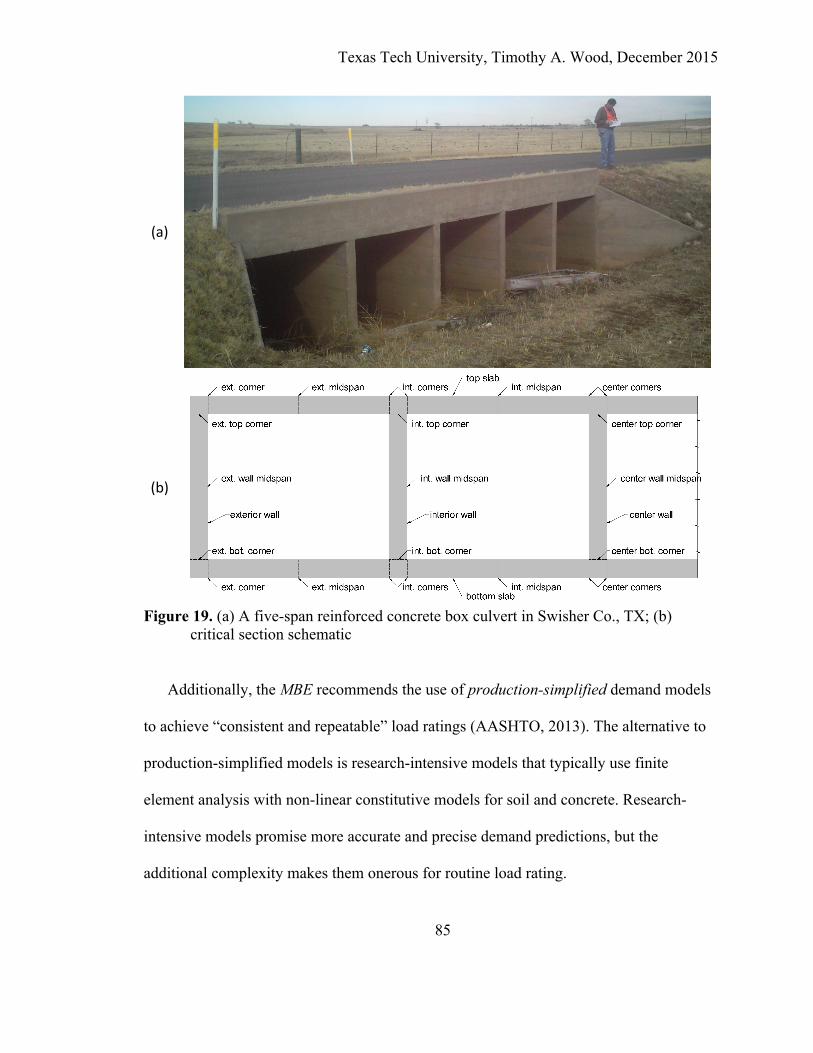
Texas Tech University, Timothy A. Wood, December 2015
85
(a)
(b)
Figure 19. (a) A five-span reinforced concrete box culvert in Swisher Co., TX; (b)
critical section schematic
Additionally, the MBE recommends the use of production-simplified demand models
to achieve “consistent and repeatable” load ratings (AASHTO, 2013). The alternative to
production-simplified models is research-intensive models that typically use finite
element analysis with non-linear constitutive models for soil and concrete. Research-
intensive models promise more accurate and precise demand predictions, but the
additional complexity makes them onerous for routine load rating.

Texas Tech University, Timothy A. Wood, December 2015
86
Live Load Attenuation, Past and Present
The top slabs of RC box culverts have historically been of primary concern for
culvert load rating. From the early days of culvert design and analysis, engineers
recognized that the culvert top slab – especially for structures with shallow cover soil –
directly receives the most intense loading (Spangler, et al., 1926). Therefore, good
performance in the top slab became an obvious structural requirement. The general
approach to culvert design and analysis has been to apply loads from soil and vehicles to
a structure. This has naturally led to a research emphasis on live load induced pressures
on the culvert structure, especially the top slab (James & Brown, 1987; Tadros & Benak,
1989). Generally, top slab pressures are estimated by uniformly distributing wheel loads
over a rectangular area calculated using a variation of the 60° or 2-to-1 rule for discrete
surface loading on soil. Each side of the distributed rectangle is referred to as a live load
patch width (AASHTO, 2014).
AASHTO policy dictates how a production-simplified model should handle live load
attenuation. The LRFD Bridge Design Specifications (hereafter, LRFD Specifications)
states that “live load shall be distributed to the top slabs” of culverts (AASHTO, 2014).
Further, the LRFD Specifications define live load patch widths both parallel to the culvert
span (in-plane attenuation) and transverse to the culvert span (out-of-plane attenuation).
Uniform pressure on the bottom slab balances vertical loads applied to the top slab
(AASHTO, 2013). The live load patch widths, both parallel and transverse to the culvert
span, are a function of the distance from the ground surface to the top slab, called cover
soil depth. The live load distribution attenuates the live load induced pressure to create a

Texas Tech University, Timothy A. Wood, December 2015
87
calibrated culvert response in the top slab. The MBE recommends that this live load
pressure be applied directly to a production-simplified demand model, a unit-width, two-
dimensional, linear-elastic, direct-stiffness, structural-frame demand model.
However, rather than a structural-frame model, the enhanced production-simplified
model used to predict demands in this chapter is a two-dimensional, linear-elastic, finite-
element, soil-structure interaction model. This soil-structure interaction (SSI) model is
repeatable and production-simplified due to clear documentation in Texas Department of
Transportation (TxDOT) Culvert Rating Guide (Lawson, et al., 2009). Furthermore,
published research has illustrated a substantial increase in accuracy and precision
achieved by this SSI model over a structural-frame model (Wood, et al., 2015).
The SSI model treats the soil-culvert system as a whole. As with the structural-frame
model, the in-plane live load distribution runs parallel to culvert span. However, rather
than deriving the in-plane distribution that the direct-stiffness model applies to the top
slab, the SSI model directly handles the in-plane loads applied at the ground surface,
through the cover soil, to the top slab, and on around the entire culvert structure.
Figure 20(a) illustrates this soil-structure in-plane live load distribution. The model itself
responsively predicts demands without the need to calculate intermediate pressures
induced by live load. This allows for a subtle but critical shift in approaching the live
load distribution to a culvert: load rating benefits from calibrated structural response, not
calibrated live load pressures.

Texas Tech University, Timothy A. Wood, December 2015
88
(a)
(b)
Notes: wt = tire patch width
ww = live load patch width at top slab depth per policy (AASHTO, 2014) wtop = live load patch width at top slab critical section depth wwall top = live load patch width at wall top corner critical section depth wwall mid = live load patch width at wall midspan critical section depth wwall bot = live load patch width at wall bottom corner critical section depth wbot = live load patch width at bottom slab critical section depth
Figure 20. (a) production-simplified, two-dimensional, linear elastic, finite element, soil-structure interaction model for in-plane live load distribution for a two span reinforced concrete box culvert in Sarpy Co., NE; (b) estimated out-of-plane live load distribution
The SSI model does require out-of-plane live load distribution such as that shown in
Figure 20(b). The out-of-plane load distribution for the SSI model is the same out-of-
culvert model
wheel loads
production-simplified, 2D, LE, FE, soil model
ground surface
culvert top slab
transverse live load distribution
w
w
w
w
w
w
w
top
wall top
wall mid
wall bot
bot
w t cover soil depth
box culvert height
culvert bottom slab
wheel load
In-Plane Distribution
Out-Of-Plane Distribution

Texas Tech University, Timothy A. Wood, December 2015
89
plane distribution prescribed by the LRFD Specifications. Several different out-of-plane
distributions have been developed to estimate live load attenuation to the top slab
including the elastic distribution (Poulos & Davis, 1991; Katona, 2015), the AASHTO
Standard Specification for Highway Bridges (SSHB) distribution (AASHTO, 2002), and a
family of LRFD Specifications distributions (AASHTO, 2012; AASHTO, 2014; Han, et
al., 2013). A 2D model fundamentally assumes that the conditions modeled in-plane
extend infinitely in the out-of-plane direction. Each live load distribution was developed
to estimate the infinite strip or line load that produces the same live load pressure at the
top slab as the discrete wheel loading does in an actual culvert.
Live Load Attenuation Methods
Current “Top-Slab-Calibrated” Live Load Attenuation Method
The current live load attenuation method is intended to estimate live load induced soil
pressures on the top slab of the culvert. For the out-of-plane loads (transverse to the
culvert span), the LRFD Specifications attenuate live load by dividing wheel loads by a
live load patch width at the depth of the top slab. The live load patch width, ww in Figure
20(b), is a function of cover soil depth. This effectively calibrates the live load
attenuation such that the SSI model will accurately predict the live load induced pressure
on the top slab. Therefore, this chapter refers to this live load attenuation method as the
“top-slab-calibrated method.”
However, the top-slab-calibrated method “tends to produce conservative force
demands, particularly in the bottom slab” (AASHTO, 2013). Any 2D model assumes that
Texas Tech University, Timothy A. Wood, December 2015
90
the same unit width on the bottom slab is all that will resist the loading to the top slab.
But in a 3D loading, the live load continues to be distributed through the top slab, the
walls, and the bottom slab. Once the load has reached the bottom slab, the live load has
attenuated over a much longer out-of-plane length. Because the top-slab-calibrated
method does not consider this behavior, predictions tends to be more accurate and precise
in the top slab than in the bottom slab. Researchers have considered the bottom slab, but
the conservatism in the bottom slab is desirable for design (McGrath, et al., 2005). This
adversely affects the load rating analysis consideration of every critical section. The top-
slab-calibrated method is adequate for the top slab, but a new method should reduce
excess conservatism in the bottom slab and walls.
New “Depth-Calibrated” Live Load Attenuation Method
The new live load attenuation method is intended to estimate the live load induced
structural response at critical section locations. The live load attenuation method
introduced by this chapter considers additional out-of-plane attenuation with depth. As
has been stated, the out-of-plane distribution should provide an equivalent infinite strip or
line load that induces the same response in a 2D model as the wheel load would on an
actual culvert. The out-of-plane distribution is a function of the critical section depth, the
distance from the ground surface to the center of the critical section. Therefore, each
critical section has its own live load patch width. This chapter refers to the new live load
attenuation method as the depth-calibrated method.
Figure 20(b) shows five live load patch widths at unique critical section depths for a
RC box culvert. Rather than one live load patch width, ww, based on cover soil depth for

Texas Tech University, Timothy A. Wood, December 2015
91
the whole culvert as in the top-slab-calibrated method, each critical section has its own
live load patch width based on critical section depth: wtop for top slab critical sections,
wwall top, wwall mid, and wwall bot for wall critical sections, and wbot for bottom slab critical
sections. To estimate the appropriate live load patch widths for each critical section
depth, a live load distribution is needed that attenuates the live load through the soil
above the culvert, along the top slab, through the wall-soil system, and along the bottom
slab. This chapter has not attempted to develop this live load distribution. Rather, the live
load distribution used in this chapter assumes, as a first-order approximation, that the
culvert-soil system is at least as efficient as the soil above the culvert at distributing the
live load out-of-plane. Therefore, the LRFD Specifications distribution has been modified
to consider critical section depth rather than cover soil depth. In the top slab, the
difference between the top-slab-calibrated method and the depth-calibrated method is
minimal. But, as critical section depth increases, the depth-calibrated method continues to
attenuate live load in the out-of-plane direction.
Measured Moment Data
Data Sources
This chapter evaluates predicted live load moment response using measured live load
moments from two published studies of full-scale culvert load tests. Researchers at Texas
Tech University instrumented three culverts and load tested them under a total of four
cover soil depths (Lawson, et al., 2010; Wood, et al., 2015). Researchers at University of
Nebraska – Lincoln instrumented a single culvert and load tested this culvert under seven

Texas Tech University, Timothy A. Wood, December 2015
92
cover soil depths (Tadros & Benak, 1989; Abdel-Karim, et al., 1993). Both studies
instrumented each culvert with strain gages at critical sections. Static truck loads were
placed over the top of the culvert to induce worst-case structural responses, and both
studies reported truck axle loads and wheel spacings. Live load induced moments were
back-calculated from measured strains using ACI recommended effective moment of
inertia calculations for cracked members. Each load test produced a measured moment
envelope by critical section. The extreme values from the measured live load envelopes
are referred to as measured moments. In total, the 11 load tests on four physical culverts
provided 241 measured moments. Of the 241 measured moments, 169 measured
moments were meaningful, that is, significantly different from zero.
Both research studies included geotechnical site investigations. The site investigations
identified the USCS soil classification and group symbol for the surrounding soil (ASTM
Standard D2487-11, 2011). The Texas Tech University study obtained soil stiffness
values using a falling-weight deflectometer (ASTM Standard D4694-09, 2009). Soil
stiffness for the University of Nebraska – Lincoln culvert was assigned using published
soil type / stiffness correlations (Lawson, et al., 2009). Table 4 summarizes the project
data from these published studies including test locations, culvert dimensions, cover soil
depths, soil types, soil stiffness values, truckloads, and the number of measured moments
from each test.

Texas Tech University, Timothy A. Wood, December 2015
93
Table 4. Project data for measured live load moments from field-tested culverts in Texas (Lawson, et al., 2010; Wood, et al., 2015) and Nebraska (Tadros & Benak, 1989; Abdel-Karim, et al., 1993)
location num
ber
of sp
ans
box
span
, m (f
t)
culv
ert h
eigh
t, m
(ft)
cons
truc
ted
year
cove
r so
il de
pth,
m (f
t)
USC
S gr
oup
sym
bol a
soil
mod
ulus
of
elas
ticity
, E, M
Pa (k
si)
live load mea
sure
d m
omen
ts
Swisher Co., TX 5 1.8 (6)
1.8 (6) 1951 0.5 (1.5) CL 62 b
(9) 2, 227kN (51 =kip),
three axle trucks 26
Lubbock Co., TX 4 3 (10)
2.4 (8) 1963 0.6 (2.0) SC 83 b
(12) 2, 240kN (54 =kip),
three axle trucks 28
“ “ “ “ “ 1.2 (4.0) “ “ “ 28
Hale Co., TX 4 3 (10)
1.8 (6) 1991 1.1
(3.5) CH 55 b
(8) 2, 209kN (47kip), three axle trucks 28
Sarpy Co., NE 2 3.7 (12)
3.7 (12) 1987 0.0 (0.0) CL 138 c
(20) 1, 120kN (27kip),
two axle truck 9
“ “ “ “ “ 0.6 (2.0) “ “ “ 9 “ “ “ “ “ 1.1 (3.5) “ “ “ 8 “ “ “ “ “ 1.8 (6.8) “ “ “ 8 “ “ “ “ “ 2.4 (8.0) “ “ “ 8 “ “ “ “ “ 3.0 (10.0) “ “ “ 8 “ “ “ “ “ 3.7 (12.0) “ “ “ 9
Notes: a (ASTM Standard D2487-11, 2011)
b composite soil stiffness from falling weight deflectometer test (ASTM Standard D4694-09, 2009) c assigned soil stiffness based on published correlation with soil classification (Lawson, et al., 2009)
Predicted Moment Calculations
The SSI model was used to predict live load moment envelopes for each load test
identified in Table 4. All culverts were modeled for demand calculations using concrete
stiffness calculated from measured strengths, f’c, and gross section properties. The
models used soil stiffness values shown in Table 4 for the soil mass surrounding each
culvert. The moving live load feature in RISA-3D applied actual truck wheel loads (RISA
Technologies, LLC, 2012). The LRFD Specification out-of-plane distribution accounted

Texas Tech University, Timothy A. Wood, December 2015
94
for overlapping wheel loads at greater depth based on the actual number of trucks applied
to the culvert and the test truck wheel and axle spacings. Additional detail on load rating-
centric modeling using SSI models can be found in TxDOT policy (Lawson, et al., 2009).
Typical Moment Envelopes
The measured moment envelope, the top-slab-calibrated predicted moment envelope,
and the depth-calibrated predicted moment envelope show similar trends for all 11 load
tests. For the purpose of illustration, the moment envelopes for one load test are provided
in this chapter. The Hale Co., TX culvert moment envelope was selected because the
culvert was tested under moderate fill, suffered no gage failures, and had a full set of
measured midspan moments including the interior walls. The Hale Co., TX culvert is
representative of the moment envelopes for all 11 culvert load tests. Similar figures for
the other 10 culvert / cover soil depth test combinations may be found in Appendix B.
Figure 21 shows moment envelopes for the Hale Co, TX culvert, arranged by culvert
element. For this chapter, positive bending induces tensile stress on the inside of the
culvert element. Negative bending induces tensile stress on the outside, typically the soil
side, of the culvert element.
Several observations can be made about both the top-slab-calibrated and depth-
calibrated methods. First, predicted moment envelopes for both methods follow the trend
of the measured moments; that is, the predicted moment magnitude is large where the
measured moment is large and small where the measured moment is small. Second, the
predicted moments appear to be generally conservative, i.e. the predicted moment
envelopes fall mostly outside the measured envelope. In some few cases, such as negative
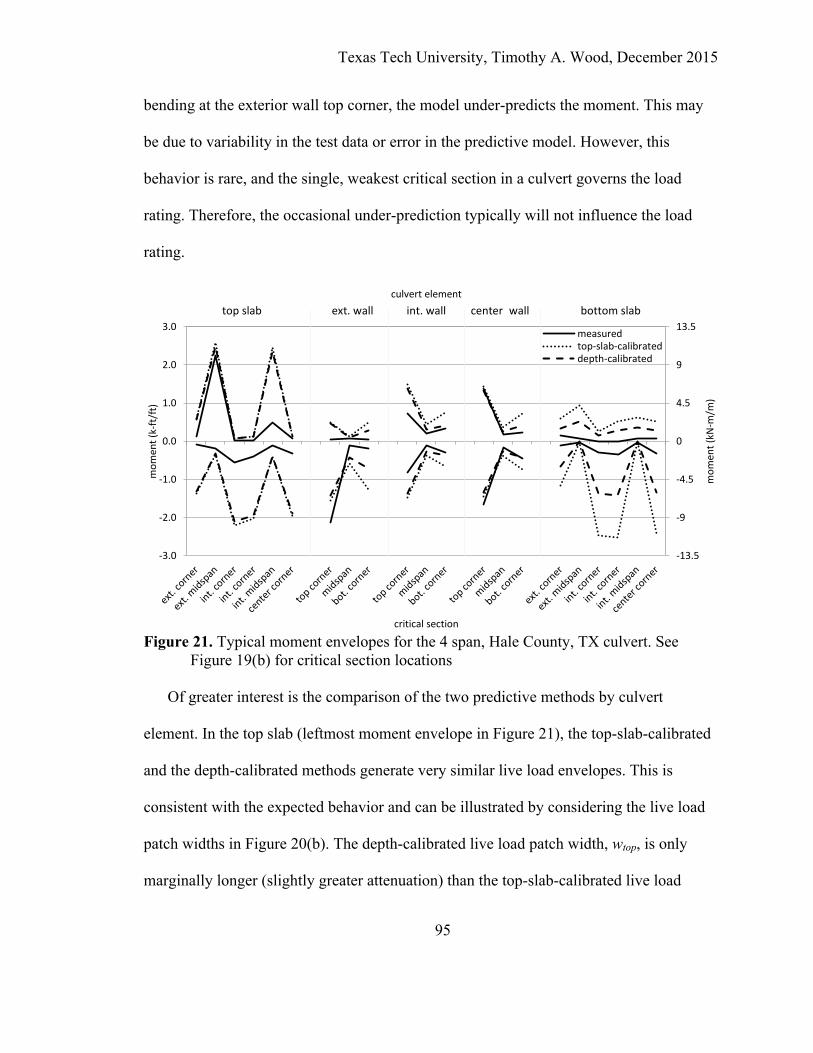
Texas Tech University, Timothy A. Wood, December 2015
95
bending at the exterior wall top corner, the model under-predicts the moment. This may
be due to variability in the test data or error in the predictive model. However, this
behavior is rare, and the single, weakest critical section in a culvert governs the load
rating. Therefore, the occasional under-prediction typically will not influence the load
rating.
Figure 21. Typical moment envelopes for the 4 span, Hale County, TX culvert. See
Figure 19(b) for critical section locations
Of greater interest is the comparison of the two predictive methods by culvert
element. In the top slab (leftmost moment envelope in Figure 21), the top-slab-calibrated
and the depth-calibrated methods generate very similar live load envelopes. This is
consistent with the expected behavior and can be illustrated by considering the live load
patch widths in Figure 20(b). The depth-calibrated live load patch width, wtop, is only
marginally longer (slightly greater attenuation) than the top-slab-calibrated live load
topslab ext.wall int.wall center_wall bottomslab
-13.5
-9
-4.5
0
4.5
9
13.5
-3.0
-2.0
-1.0
0.0
1.0
2.0
3.0
culvertelement
mom
ent(kN
-m/m
)
mom
ent(k-ft/
ft)
criticalsection
measuredtop-slab-calibrateddepth-calibrated

Texas Tech University, Timothy A. Wood, December 2015
96
patch width, ww. Because the live load path widths are so close, the predicted moments in
the top slab are very similar for both the top-slab-calibrated and depth-calibrated
methods.
In contrast, the bottom slab (rightmost moment envelope in Figure 21) most clearly
illustrates the improvement provided by the depth-calibrated method. At the bottom slab
interior corners, the negative bending moments predicted by top-slab-calibrated method
are of the greatest magnitude for the whole structure. This does not match expected or
measured behavior. The depth-calibrated method reduces the predicted moment by half in
the bottom slab interior corners. This matches expected behavior; the depth-calibrated
live load patch width, wbot, is much larger (significantly greater attenuation) than the top-
slab-calibrated live load patch width, ww. The greatest improvement in predictive
accuracy provided by the depth-calibrated method is in the bottom slab.
Each of the walls (the middle three moment envelopes in Figure 21) serves as a case
study of the difference between the top-slab-calibrated and depth-calibrated methods. At
the wall top corners, the difference between the two methods is slight, much like the top
slab. The wall midspans show a divergence between the predictive methods; the depth-
calibrated method predicts live load moment about half way between the top-slab-
calibrated moments and the measured moments. The wall bottom corners show
performance similar to the bottom slab with marked improvement in predicted moments
provided by the depth-calibrated method.
Figure 21 also clearly illustrates the difference between meaningful moments and
practically insignificant moments. As an example, for negative bending in the bottom

Texas Tech University, Timothy A. Wood, December 2015
97
slab midspans, the measured moments, top-slab-calibrated moments and depth-calibrated
moments are all approximately zero. Given the low magnitude, this combination of
critical section and bending direction is unlikely to control the culvert load rating. It
simply does not matter how well the live load method can predict zero. When evaluating
the methods from all load tests, this chapter ignores these practically insignificant
moments. Rather, all further analysis and discussion focuses on meaningful moments:
positive moment in the top and bottom slab midspans, negative moment at top and
bottom slab corners, negative moment at exterior wall corners, and all moments for
exterior wall midspans and interior walls.
Findings and Discussion
The moment envelopes provide valuable insight into the differences between the top-
slab-calibrated and depth-calibrated methods. The influence of method choice can be
further illustrated by evaluating the accuracy and precision of moment results from all 11
load tests. The ratio of the predicted vs. measured live load moment, referred to as the
moment bias, will be evaluated. When moment bias is greater than 1.0, the model over-
predicts the live load moment (conservative); when less than 1.0, the model under-
predicts (unconservative).
Analysis of the moment bias mean and standard deviation quantifies the concepts of
accuracy and precision. Qualitatively, accuracy is the model’s ability to predict the true
moment in the culvert, and precision is the scatter in those predictions. Quantitatively, an
accurate and precise method produces a moment bias mean close to 1.0, a small standard
deviation, and uniform mean and standard deviation at all critical sections. These

Texas Tech University, Timothy A. Wood, December 2015
98
definitions provide an interpretive framework for all 169 moment biases from 11 load
tests.
Observations of Moment Bias
Figure 22 shows the moment bias histogram on the log-scale for both the top-slab-
calibrated and depth-calibrated methods. In both plots the mean, 𝑥, and standard
deviation, s, are shown. Both methods show a precipitous drop in the number of moment
biases less than 1.0. The few moment bias values that are less than 1.0 may be due to
variations in the measured values and are unlikely to control a culvert load rating.
(a)
(b)
Figure 22. Histogram of moment biases from 11 culvert load tests using the (a) top-slab-
calibrated method and (b) depth-calibrated method
0
10
20
30
40
50
60
0.10 1.00 10.00 100.00
numbe
rofm
omen
tbiases
momentbias(predicted/measured)
s=8.9
0
10
20
30
40
50
60
0.10 1.00 10.00 100.00
numbe
rofm
omen
tbiases
momentbias(predicted/measured)
s =4.6
Top-Slab-CalibratedMethod
Depth-CalibratedMethod

Texas Tech University, Timothy A. Wood, December 2015
99
Figure 22(a) shows the moment bias histogram for the top-slab-calibrated method.
The moment bias mean is 6.1, meaning that on average, the method predicts 6.1 times the
live load moment actually in the culvert. The moment bias standard deviation (s=8.9) is
quite large as well. Some of the predicted moments are greater than 50 times the
measured values.
Figure 22(b) shows the moment bias histogram for the depth-calibrated method. The
mean and standard deviation have both improved dramatically (𝑥=3.8, s=4.6). The mean
reduced by almost half and moved closer to 1.0. The standard deviation also reduced by
nearly half. Furthermore, the mode (the peak point on the histogram) is around one for
the depth-calibrated method rather than two for the top-slab-calibrated method. The
improvement in mean and standard deviation indicates that the depth-calibrated method
improves the accuracy and precision of the SSI model.
Observations of Moment Bias by Section
This section considers whether the top-slab-calibrated method or the depth-calibrated
method have uniform moment bias mean and standard deviation between critical
sections. Figure 23 plots the mean and standard deviation of the moment bias by critical
section. The first columns show the mean and standard deviation for all data previously
presented in Figure 22.
The next two columns sets, the top slab and top wall corners, are consistent with
observations from the moment envelope (Figure 21), and show similar moment bias
mean and standard deviation for each method. As expected for the top critical sections,
the difference in live load patch widths between the methods does not significantly

Texas Tech University, Timothy A. Wood, December 2015
100
change in predicted moment. In addition, the mean and standard deviation for top critical
sections are lower than the overall mean and standard deviation for the culvert structure.
(a)
(b)
Figure 23. (a) mean and (b) standard deviation of moment bias by critical section
The bottom slab (far right in Figure 23) has a larger mean and standard deviation than
the top slab counterparts. For both methods, the moment bias mean and standard
deviation are clearly not uniform for the overall culvert structure. However, for the
bottom slab, the depth-calibrated method reduces the moment bias mean and standard
deviation to almost half the top-slab-calibrated values. The improvement in accuracy and
precision in the bottom slab is substantial.
The wall midspan and bottom corner bias data are similar to the bottom slab. Though
the top-slab-calibrated method mean is lower for the wall sections than for the bottom
slab, the depth-calibrated method improves the moment bias mean, again, reducing it by
6.1
3.31.6
3.9
7.1
12.6
3.7 3.21.5
2.7 3.4
6.5
02468101214
all topslab walltopcorner wallmidspan wallbottomcorner
bottomslab
meanmom
entb
ias
(predicted
/measured)
8.9
2.50.8
8.6
12.6
9.8
4.6
2.40.8
6.44.8 5.1
0.02.04.06.08.010.012.014.0
all topslab walltopcorner wallmidspan wallbottomcorner
bottomslab
st.dev.o
fmom
entb
ias
(predicted
/measured)
topslabcalibrated depthcalibrated

Texas Tech University, Timothy A. Wood, December 2015
101
half. The moment bias standard deviation decreased by more than half by using the
depth-calibrated method. The wall midspan has the greatest standard deviation in both
methods; this may be due to a shortcoming in the production-simplified model since this
variation appears in both methods.
Nevertheless, the trend is clear; the depth-calibrated model significantly improves
moment bias mean and standard deviation, particularly in the bottom slab and walls.
Therefore, the depth-calibrated method is the more accurate and precise of the two live
load attenuation methods. Neither method achieves uniform mean or standard deviation.
However, the depth-calibrated method more closely approaches uniform mean and
standard deviation than the top-slab-calibrated method.
Observations of Moment Bias by Live Load Distribution
Throughout this chapter, the top-slab-calibrated and depth-calibrated methods have
been evaluated using the current policy live load distribution, the AASHTO LRFD
distribution. But, the same live load attenuation methods could be used with other
published live load distributions. Figure 24 shows three live load distributions for a single
HS20 truck. The elastic distribution was derived for a single discrete rectangular surface
loading (one wheel) on a homogeneous mass (Poulos & Davis, 1991) and adapted for
out-of-plane distribution (Katona, 2015). Both the SSHB and the LRFD distributions
assume that slab bending behavior controls when the cover soil depth is less than 0.6m
(2.0ft) (McGrath, et al., 2005). Below 0.6 m (2 ft) of cover soil, the SSHB distribution
prescribes an out-of-plane, live load patch width of 1.75 times depth (AASHTO, 2002).
The LRFD distribution prescribes an out-of-plane, live load patch width consisting of the

Texas Tech University, Timothy A. Wood, December 2015
102
initial tire width (0.5m (20in.) for an HS20 truck), a soil distribution width of 1.15 times
depth and a width to account for span length. The LRFD method is consistent with the
60° or 2:1 rule found in soil mechanics textbooks (AASHTO, 2014). At greater depth,
both the SSHB and the LRFD distributions account for overlapping wheel load effects by
distributing the sum of the wheel loads over a cumulative live load patch width.
Figure 24. Live load attenuation factor, 1/w (ft/ft (m/m)), as a function of depth from
ground surface for a single HS-20 truck for three live load distribution models: elastic (Poulos & Davis, 1991; Katona, 2015), SSHB (AASHTO, 2002) and LRFD (AASHTO, 2014)
Figure 25 shows the overall moment bias mean and standard deviation for the live
load distributions shown in Figure 24. For each case, the depth-calibrated method
decreases both the moment bias mean and standard deviation. Regardless of live load
distribution, the depth-calibrated method improves accuracy and precision.
0
2
4
6
8
10
12
14
16
18
20
22
24
26
28
30
0.00 0.05 0.10 0.15 0.20 0.25
depth,H(ft)
attenuationfactor,1/w(ft/ft(m/m))
Elastic
SSHB
LRFD(7th)

Texas Tech University, Timothy A. Wood, December 2015
103
(a)
(b)
Figure 25. (a) mean and (b) standard deviation of bias by live load distribution
The elastic distribution improves the most. This improvement is due to differences in
assumptions between the elastic distributions and the policy distributions. First, the
elastic method models only soil attenuation. Therefore, below 0.6m (2ft) of cover soil,
the live load is much larger than the policy distributions that consider slab distributions at
this depth (see Figure 24). For the top-slab-calibrated method, this method grossly over
predicts live load moment particularly in the bottom slab. Since nearly 42% of the
meaningful moment biases come from such low fill depths, the moment bias mean and
standard deviation are very high for the top-slab-calibrated method. However, when the
elastic distribution is used with the depth-calibrated method, the bottom slab and walls
13.3
6.5 6.1
2.9 3.4 3.7
0
2
4
6
8
10
12
14
elastic SSHB LRFD
meanmom
entb
ias
(predicted
/measured)
34.3
10.3 8.94.7 4.1 4.6
0510152025303540
elastic SSHB LRFD
st.dev.o
fmom
entb
ias
(predicted
/measured)
topslabcalibrated depthcalibrated
Texas Tech University, Timothy A. Wood, December 2015
104
see less live load (greater attenuation) than the policy distributions (Figure 24).
Additionally, the elastic method only considers a single wheel load, whereas, the policy
distributions consider overlapping influence from multiple wheel loads at greater depth;
therefore, the elastic distribution is less conservative at greater depth. These factors
explain why the elastic distribution improves so much when using the depth-calibrated
method.
The SSHB and LRFD distributions experience roughly the same improvement. These
two methods use different distributions, but use the same basic assumptions about slab
distribution for shallow cover soil depths, linear increases in live load patch width with
depth, and overlapping influence from multiple wheel loads at depth. Therefore, the
trends observed in the LRFD distribution hold true for the SSHB distribution; both mean
and standard deviation of the moment bias are reduced by roughly half by using the
depth-calibrated method instead of the top-slab-calibrated method. Though the methods
are different, the live load fit appears to be essentially the same for the SSHB and LRFD
live load distributions.
Figure 25 shows that regardless of the live load distribution used to estimate the live
load attenuation, the depth-calibrated method will improve the modeling accuracy and
precision. The depth-calibrated live load attenuation method can improve the modeling
accuracy and precision of any reasonable live load distribution.
Load Rating Case Study
The depth-calibrated live load attenuation method improves the accuracy and
precision of the moment predictions obtained from a production-simplified demand

Texas Tech University, Timothy A. Wood, December 2015
105
model. However, live load moment is only one component of the rating factor equation
(Equation 1), the others being capacity and dead load demands. Therefore, the influence
of the live load attenuation method on overall culvert load rating is indirect and varies by
structure. An Case Study will illustrate the improvement in overall load rating.
The test culvert in Lubbock Co., TX (Table 4) has approximately 0.6m (2.0ft) of
cover soil under the traffic lanes. Field inspections show this structure has performed
reasonably well with minor cracking and leaching appearing in the top slab and an overall
condition rating of 6. An SSI model using the top-slab-calibrated method calculates an IR
of HS7 and OR of HS12. The design load was an HS20 truck. The analysis identified the
exterior bottom slab corner as governing the load rating. Yet, field inspection did not
show distress in the bottom slab corner, and the magnitude of the load rating values do
not correspond well with the observed performance under normal traffic loads. This
illustrates the DOT-observed disconnect between load rating and field inspection
performance.
Using the depth-calibrated method, the bottom slab critical sections experience a
decrease in live load demand moments. Therefore, the rating factors for the bottom slab
increase. In so doing, the location of the governing rating factor shifts from the bottom
slab corner to the top slab midspan where the field inspections reported cracking.
Furthermore, the magnitude of the load rating increased (IR=HS11, OR=HS19). In this
example, the depth-calibrated method yielded load rating results that more reasonably
correspond with field inspection performance.

Texas Tech University, Timothy A. Wood, December 2015
106
As noted, live load comprises one part of the load rating equation, so the depth-
calibrated method will not provide significant load rating improvement in every case.
Sometimes capacity will drive the load rating process. If the top slab governs the load
rating using the top-slab-calibrated method, the top slab will still govern if the depth-
calibrated method is used. In other cases, the predicted dead load may exceed the critical
section capacity, and this behavior will govern the load rating. But, for cases where the
top-slab-calibrated method shows that a bottom slab, wall midspan, or wall bottom corner
critical section governs the load rating, the depth-calibrated method will improve the load
rating outcome, in some cases dramatically.
Improved Live Load Distribution
Most published research on live loads to RC box culverts has focused on live load
induced pressures on the culvert, particularly loads on the top slab. However, if the
research question were reframed to look at live load induced structural response, a better
out-of-plane live load distribution could be developed. This better distribution should
consider the many sources of live load attenuation including pavement, cover soil, slab
behavior, and soil-culvert interaction. The goal would be an even more accurate and
precise out-of-plane live load distribution that achieves uniform moment bias mean and
standard deviation by critical section.
Additionally, current LRFR calibration methods implicitly assume independent
measurements with uniform bias mean and variance (related to standard deviation).
However, measurements at each critical section on a single culvert are not statistically
independent. Further, the biases at each critical section for a given culvert do not have

Texas Tech University, Timothy A. Wood, December 2015
107
uniform bias mean or variance; rather a relationship exists between bias distribution and
critical section location. Achieving uniform bias through a better out-of-plane live load
distribution would decrease variance and improve calibrated load factors. These issues
should be addressed by a robust LRFR load calibration effort for RC box culverts.
Conclusions
The depth-calibrated live load attenuation method represents a step forward in closing
the disconnect between calculated load rating values and field inspection performance for
RC box culverts. This method reduces over-prediction of live load demand in the bottom
slab and walls of a culvert. Further, existing live load distributions already prescribed by
state and federal policy are compatible with the depth-calibrated method. A better out-of-
plane live load distribution could be determined by using the depth-calibrated method to
estimate live load induced structural response in each portion of the culvert system. The
depth-calibrated live load attenuation method can provide more accurate and precise load
ratings for RC box culverts.
Acknowledgements
The Texas Department of Transportation sponsored the research work described in
this chapter.
Texas Tech University, Timothy A. Wood, December 2015
108
CHAPTER 5
CONCLUSIONS
Summary
This dissertation investigated the influence of three factors on load rating of
reinforced concrete box culverts. The factors explored were (1) cover soil depth in a
structural-frame model, (2) production-simplified modeling sophistication, and (3) live
load attenuation method. This dissertation builds directly upon research performed at
Texas Tech University for TxDOT. Additional information on load rating CIP RC box
culverts can be found in the published research reports (Lawson, et al., 2010; Lawson, et
al., 2009; TxDOT, 2013; TxDOT, 2014).
For each explored factor, the influence was significant. Cover soil depth strongly
influences the load rating results in three characteristic and non-linear ways. Load rating
of a particular culvert must consider the cover soil depths that actually exist on the
culvert. Using field live load tests, a production-simplified soil-structure interaction
model was shown to be an order of magnitude more accurate and precise than the
AASHTO-recommended production-simplified structural-frame model. By using a
depth-calibrated, out-of-plane, live load attenuation model, the live load prediction
accuracy and precision was nearly doubled compared to the traditional top-slab-calibrated
live load attenuation method. Taken together, the improvements in load rating
calculations described in this dissertation help to reduce the disconnect between load
rating calculations and observed field inspection performance of the culvert structure.

Texas Tech University, Timothy A. Wood, December 2015
109
Major Findings
Key findings are defined by factor.
• Cover Soil Depth
o Interaction of live load and dead load with depth causes a non-linear interaction
between cover soil depth and load rating for a structure.
o There is no a priori worst case cover soil depth.
• Demand Model Sophistication
o The structural-frame model is conservative, production-simplified, and reasonable
for the top slab.
o The structural-frame model significantly over-predicts live loads in the bottom slab
and walls.
o The soil-structure interaction model improves in-plane live load attenuation.
o The soil-structure interaction model significantly improves live load accuracy and
precision particularly in the bottom slab and walls.
• Live Load Attenuation Methods
o Depth-calibrated live load attenuation improves out-of-plane live load attenuation.
o Depth-calibrated live load attenuation improves the accuracy and precision of the
soil-structure model in the bottom slab and walls.

Texas Tech University, Timothy A. Wood, December 2015
110
o Depth-calibrated live load attenuation improves correspondence between load
rating values and field inspection observations.
Limitations
This work is specifically limited to load rating cast-in-place, reinforced-concrete box
culverts. First, these findings are specific to load rating. No attempt was made to predict
the impact of applying these findings to culvert design. Current methods for design are
appropriately conservative and can be used without reservations. Important corollaries
exist between load rating and design, but findings from this dissertation must be applied
to design with extreme care as design is outside the scope of this dissertation.
Additionally, the research is focused on CIP RC box culverts. The demand calculation
methods used in this work may be appropriate for certain precast box culverts, but the
capacity calculations for such structures are slightly different. Other culvert types
including rigid and flexible round pipes, arches, and three-sided boxes behave in
fundamentally different ways from CIP RC box culverts. The dissertation makes no
attempt to predict the performance of these structures.
Finally, the dissertation evaluates the structural capacity of culverts in drained soils.
No work has been presented addressing hydraulic performance or the significant
influence of water in the culvert and surrounding soils.

Texas Tech University, Timothy A. Wood, December 2015
111
Future Work
Several factors with significant impact on load rating of box culverts were not
explored in this dissertation including cover soil depth in a soil-structure interaction
model, lateral loading parameters, long-term dead load behavior, and an improved depth-
calibrated live load distribution.
The influence of cover soil depth has not been explored using the soil-structure
interaction model. A non-linear relationship between cover soil depth and load rating
when using the soil-structure interaction model is expected. However, the significant
differences between the structural-frame and soil-structure interaction models mean that
the relationship is unlikely to be identical to the relationships identified for the structural-
frame model. An automated soil-structure interaction model should be developed and
implemented to evaluate the full range of cover soil depths on culvert designs. This
would improve understanding of nuances associated with the soil-structure interaction
model.
The influence of those parameters that define the lateral loading to the culvert –
namely, at-rest lateral earth pressure coefficient for the structural-frame model and soil
modulus for the soil-structure interaction model – have not been fully explored. The
structural-frame model uses a range of at-rest lateral earth pressures that are likely
conservative. No such analysis has been performed using the soil-structure interaction
model. A small scale parametric study from the original research indicates that load
rating is strongly dependent on the soil stiffness (Lawson, et al., 2010). Further, the
nature of the dead loads and live loads suggest that different soil stiffnesses may be

Texas Tech University, Timothy A. Wood, December 2015
112
appropriate for each loading. Dead load may be modeled better using static soil modulus
values while the live load may be better modeled using dynamic or resilient elastic
moduli. Further literature review, field and laboratory testing, and analytical analysis are
required to fully explore the issue of soil stiffness and its impact on lateral loading.
Additionally, long-term dead load behavior for load rating purposes is poorly
understood. Much research has been performed to examine installation-induced soil
stresses. No long-term tests have been performed to identify long-term dead load
behavior. This would require carefully designed, long-term monitoring of full-scale test
culverts or careful scale-model testing.
Finally, an improved depth-calibrated live load distribution is needed that accounts
for out-of-plane distribution from pavement, soil, top slab, culvert-soil interaction, and
bottom slab. The depth-calibrated live load attenuation method introduced here is shown
to improve live load precision and accuracy, particularly in the bottom slab and walls.
The underlying assumption is that the culvert-soil system is at least as effective as the soil
itself in redistributing the live load in the out-of-plane direction. However, additional
analytical work is required to develop a more rational distribution that considers the
greater out-of-plane attenuation likely generated by the culvert top slab, walls, and
bottom slab.

Texas Tech University, Timothy A. Wood, December 2015
113
WORK CITED
AASHTO. (1949). Standard Specifications for Highway Bridges 5th Ed. Washington D.C.:
American Association of State Highway Officials.
AASHTO. (1977). Standard Specifications for Highway Bridges 12th Ed. Washington
D.C.: American Association of State Highway and Transportation Officials.
AASHTO. (1994). LRFD Bridge Design Specifications, Customary U.S. Units, 1st Edition.
Washington, D.C.: American Association of State Highway and Transportation
Officials.
AASHTO. (2002). Standard Specfications for Highway Bridges (SSHB), 17th Ed.
Washington D.C.: American Association of State Highway and Transportation
Officials, Inc. (AASHTO).
AASHTO. (2003). Manual for Condition Evaluation of Bridge (MCEB), 2nd Ed.
Washington D.C.: American Assocaition of State Highway amd Transportation
Officials, Inc. (AASHTO).
AASHTO. (2007). LRFD Bridge Design Specifications, Customary U.S. Units, 4th
Edition. Washington, D.C.: American Assocaition of State Hiwghway and
Transportation Officials.
AASHTO. (2012). LRFD Bridge Design Specifications, Customary U.S. Units, 6th
Edition. Washington, D.C.: American Association of State Highway and
Transportation Officials.
Texas Tech University, Timothy A. Wood, December 2015
114
AASHTO. (2013). Manual for Bridge Evaluation (MBE), 2nd Ed., with 2011 and 2013
Interim Revisions. Washington D.C.: American Association of State Highway and
Transportation Officials, Inc. (AASHTO).
AASHTO. (2014). LRFD Bridge Design Specifications, U.S.Customary Units, 7th Edition.
Washington, D.C.: American Association of State Highway and Transportation
Officials.
Abdel-Karim, A. M., Tadros, M. K., & Benak, J. V. (1990). Live Load Distribution on
Concrete Box Culverts. Washington D.C.: Transportation Research Board.
Abdel-Karim, A. M., Tadros, M. K., & Benak, J. V. (1993). Structural Response of Full-
Scale Concrete Box Culvert. Struc. Eng., 119(11), 3238-3254.
ACI Committee 318. (2011). Building Code Requirements for Structural Concrete and
Commentary. Farmington Hills, MI: American Concrete Institue.
ASTM Standard C1433-14. (2014). Standard Specifcation for Precast Reinforced
Concrete Monolithic Box Sections for Culverts, Storm Drains, and Sewers. West
Conshohocken, PA: ASTM International.
ASTM Standard C789-00. (2000). Standard Specification for Precast Reinforced Concrete
Box Sections for Culverts, Storm Drains, and Sewers. West Conshohocken, PA:
ASTM International.

Texas Tech University, Timothy A. Wood, December 2015
115
ASTM Standard C850. (2000). Standard Specification for Precast Reinforced Concrete
Box Sections for Culverts, Storm Drains, and Sewers with less than 2ft of Cover
Subjected to Highway Loadings. West Conshohocken, PA: ASTM International.
ASTM Standard D2487-11. (2011). Standard Practice for Classification of Soils for
Engineering Purposes (Unified Soil Classification System). West Conshohocken,
PA: ASTM International.
ASTM Standard D4694-09. (2009). Standard Test Method for Deflections with a Falling-
Weight-Type Impulse Load Device. West Conshohocken, PA: ASTM International.
Bennett, R. M. (2005). Vertical Loads on Concrete Box Culverts under High
Embankments. Bridge Eng., 10(6), 643-649.
Bridges, Structures, and Hydraulics. (2009). 23 C.F.R. § 650 Subpart C. In Code of Federal
Regulations.
Cahoon, J. E., Baker, D., & Carson, J. (2002). Factors for Rating Condition of Culverts for
Repair or Replacement Needs. Transportation Research Record, 1814, 197-202.
Das, S. (2013). Application of diagnostic load testing and 3D-FEA in load rating of RC
box culverts. Bridge Structures, 9(4), 155-167.
Duane, J., Robinson, R., & Moore, C. A. (1986). Culvert-Soil Interaction Finite Element
Analysis. Transportation Eng., 112(3), 250-263.
FHWA. (1995). Recording and Coding Guide for the Structure Inventory and Appraisal of
the Nation's Bridges. Washington, D.C.: Federal Highway Administration.

Texas Tech University, Timothy A. Wood, December 2015
116
FHWA. (2010, November). BOXCAR Interactive Software for Box Culvert Analysis and
Reinforcing Design Ver. 3.1. Irving, TX: American Concrete Pipe Association.
Gardner, M. P., & Jeyapalan, J. K. (1982). Preliminary Analysis of the Behavior of
Reinforced Concrete Box Culverts. Washington D.C.: Transportation Research
Board.
Han, J., Acharya, R., Parsons, R. L., & Khatri, D. (2013). Improved Load Distribution for
Load Rating of Low-Fill Box Structures. Topeka, Kansas: Kansas Department of
Transportation.
James, R. W., & Brown, D. E. (1987). Wheel-Load-Induced Earth Pressures on Box
Culverts. Transportation Research Record 1129, 55-62.
Katona, M. G. (2015). CANDE-2015 Culvert Analysis and Design Solution Methods and
Formulations. Washington, D.C.: AASHTO/TRB.
Katona, M. G. (2015). CANDE-2015: Culvert ANalysis and DEsign. Wastington D.C.:
AASHTO/TRB.
Katona, M. G., & McGrath, T. J. (2007). A Guideline for Interpreting AASHTO LRFD
Specifications to Design or Evaluate Buried Structures with Comprehensive
Solution Methods. Transportation Research Board 86th Annual Meeting.
Washington D.C.: Transportation Research Board.
Katona, M. G., & Vittes, P. D. (1982). Soil-Structure Analysis and Evaluation of Buried
Box-Culvert Designs. Washington D.C.: Transportation Research Board.
Texas Tech University, Timothy A. Wood, December 2015
117
Kim, K., & Yoo, C. H. (2005). Design Loading on Deeply Buried Box Culverts.
Geotechnical & Geoenvironmental Eng., 131(1), 20-27.
Kitane, Y., & McGrath, T. J. (2006). Three-Dimensional Modeling of Live Loads on
Culverts. ASCE Conf. Proc. 211, (p. 82).
Kulicki, J. M. (2013, March 22). Observations on AASHTO Bridge Design. Retrieved June
1, 2014, from Lehigh University Fazlur R. Khan Distinguished Lecture Series:
http://www.lehigh.edu/~infrk/2013/frk13kulicki.html
Lakmazaheri, S., & Edwards, P. (1996). Integrated Culvert Design and Detailing in a CAD
Environment. Auburn, AL: Auburn University.
Latona, R. W., Heger, F. J., & Bealey, M. (1973). Computerized Design of Precast
Reinforced Concrete Box Culverts. Washington D.C.: Transportation Research
Board.
Lawson, W. D., Wood, T. A., Newhouse, C. D., & Jayawickrama, P. W. (2009). Culvert
Rating Guide. Austin, TX: Texas Department of Transportation.
Lawson, W. D., Wood, T. A., Newhouse, C. D., & Jayawickrama, P. W. (2010). Evaluating
Existing Culverts for Load Capacity Allowing for Soil Structure Interaction
FHWA/TX-10/0-5849-1. Austin, TX: Texas Department of Transportation.
McGrath, T. J., Liepins, A. A., & Beaver, J. L. (2005). Live Load Distribution Widths for
Reinforced Concrete Box Sections. Transportation Research Record CD 11-S, 99-
108.

Texas Tech University, Timothy A. Wood, December 2015
118
NCHRP 15-54. (2015, July 7). Proposed Modifications to AASHTO Culvert Load Rating
Specifications. Retrieved July 22, 2015, from
http://apps.trb.org/cmsfeed/TRBNetProjectDisplay.asp?ProjectID=3869
NCHRP. (2013). Reasech Needs Statement: Design and Load Rating of Buried Structures.
Washington, D.C.: Transportation Research Board.
Orton, S., Loehr, E., Boeckmann, A., & Havens, G. (2013). Live Load Effect in Reinforced
Concrete Box Culverts Under Soil Fill. Jefferson City, MO: Missouri Department
of Transportation.
Petersen, D. L., Nelson, C. R., Li, G., McGrath, T. J., & Kitane, Y. (2010). NCHRP Report
647: Recommended Design Specifications for Live lOad Distribution to Buried
Structures. Washington, D.C.: Transportation Research Board.
Poulos, H. G., & Davis, E. G. (1991). Elastic Solutions for Soil and Rock Mechanics.
Sydney, Australia: Centre for Geotechnical Research.
RISA Technologies, LLC. (2012). RISA-3D Version 10.0.1. Foothill Ranch, CA: RISA
Technologies, LLC.
Roschke, P. N., & Davis, R. E. (1986). Rigid Culvert Finite Element Analysis.
Geotechnical Eng., 112(8), 749-767.
Salem, O., Salman, B., & Najafi, M. (2012). Culvert Asset Management Practices and
Deterioration Modeling. Transportation Research Record, 2285, 1-7.

Texas Tech University, Timothy A. Wood, December 2015
119
Spangler, M. G., Mason, C., & Winfrey, R. (1926). Experimental Determinations of Statis
and Impact Loads Transmitted to Culverts. Ames, Iowa: Iowa State College of
Agriculture and Mechanic Arts.
Tadros, M. K., & Benak, J. V. (1989). Load Distribution On Box Culverts. Lincoln, NE:
FHWA and Nebraska University.
Tadros, M. K., Benak, J. V., & Gilliland, M. K. (1989). Soil Pressure on Box Culverts. ACI
Structural Journal, 86(4), 439-450.
TxDOT. (2003). CULV5 - Concrete Box Culvert Analysis Program. Austin, TX: Texas
Department of Transportation.
TxDOT. (2013). CULVLR - a program for load rating reinforced concrete box culverts.
Austin, TX: Texas Department of Transportation.
TxDOT. (2014). Load Rating TxDOT pre-1980 In-Service Culverts: 88-4XXIA001. Austin,
TX: Texas Department of Transportation.
Wissink, K., McKee, M., Houghtalen, R., & Sutterer, K. (2005). Simple Rating System for
Identification of Failure-Critical Culverts and Small Structures. Transportation
Research Record, 1928, 226-229.
Wood, T. A., Jayawickrama, P. W., Newhouse, C. D., Morse, S. M., & Lawson, W. D.
(2013). Load Rating TxDOT's Culvert Design Standards. Austin, TX: Texas
Department of Transportation.

Texas Tech University, Timothy A. Wood, December 2015
120
Wood, T. A., Lawson, W. D., & Jayawickrama, P. J. (2015). Influence of Cover Soil Depth
on Reinforced Concrete Box Culvert Load Rating. Transportation Research
Record 2511, 61-71.
Wood, T. A., Lawson, W. D., Jayawickrama, P. W., & Newhouse, C. D. (2015). Evaluation
of Production Models for Load Rating Reinforced Concrete Box Culverts. J. Bridge
Engineering, 20(1), 04014057.
Wyoming DOT. (2008). Analysis, Design and Rating of Reinforced Concrete Box Culverts
BRASS-CULVERT. Cheyenne, WY: Wyoming Department of Transportation.
Yang, M. Z. (1999). Measurement of earth pressures on concrete box culverts under
highway embankments. Proceedings of the 1998 Field Instrumentation for Soil and
Rock, (pp. 87-100).

Texas Tech University, Timothy A. Wood, December 2015
121
APPENDIX A
DISTRIBUTIONS OF CULVERT DESIGNS

Texas Tech University, Timothy A. Wood, December 2015
122
Figure A.1. Distribution plot of load rating vs. cover soil depth plot shape by design
era
208143
305
12
56
43
101181
32
050
100150200250300350400
pre-WWII InterstateHighway
modernizedculvertd
esignsby
desig
nera
designera
increasing constant decreasing

Texas Tech University, Timothy A. Wood, December 2015
123
(a) (b)
(c)
Figure A.2. Trend plots of load rating vs. cover soil depth relationship by culvert geometry: (a) aspect ratio, (b) span length, and (c) barrel height
124171
120177
64
30
39
26
15
1
118
85
47
59
5
0
50
100
150
200
250
300
350
1 1.25 1.5 2 2.5
culvertd
esignsbyaspe
ctra
tio
aspectratio,S/H
157 142 139
9665 57
3 17 9
21
3823
352
6271 126
1.5 1.8 2.1 2.4 2.7 3.0
0
50
100
150
200
250
5 6 7 8 9 10
span,S(m)
%ofculvertdesignsbyspan
span,S(ft)
40
102128 127 111
75 62
11
6
8 1517
1717
29
2
5
25 26 46
5949
44
428 10
0.6 0.9 1.2 1.5 1.8 2.1 2.4 2.7 3.0 3.3 3.6
020406080
100120140160180200
2 3 4 5 6 7 8 9 10 11 12
height,H(m)
%ofculvertdesignsbyhe
ight
height,H(ft)
increasing constant decreasing

Texas Tech University, Timothy A. Wood, December 2015
124
Figure A.3. Distribution plot of load rating vs. cover soil depth plot shape by design
cover soil depth
114 101 69
240
132
28 3130
20
2
195
68
31
20
DT(0-0.6m) 0.6-1.2m 0-1.2m 1.2-1.8m 0-1.8m
050
100150200250300350400
DT(0-2ft) 2-4ft 0-4ft 4-6ft 0-6ft
designcoversoildepthrange
%ofculvertdesignsby
desig
ncoversoildep
thra
nge
designcoversoildepthrange
increasing constant decreasing

Texas Tech University, Timothy A. Wood, December 2015
125
APPENDIX B
MOMENT PLOTS COMPARING LIVE LOAD ATTENUATION
METHODS

Texas Tech University, Timothy A. Wood, December 2015
126
Figure B.1. Moment plot for Swisher Co., TX (Table 4) culvert under 1.5ft of cover soil
Figure B.2. Moment plot for Lubbock Co., TX (Table 4) culvert under 2.0ft of cover soil
-18.0
-13.5
-9.0
-4.5
0.0
4.5
9.0
13.5
18.0
-2.5
-2.0
-1.5
-1.0
-0.5
0.0
0.5
1.0
1.5
2.0
B2O
B2M B2I
B4O
B4M B4I
B6O
B6M
T2O
T2M T2I
T4M T4I
T6O
T6M
W1B
W1M W1T
W3B
W3T
W5B
W5T
mom
ent(kN
-m/m
)
mom
ent(k-ft/ft)
criticalsectionlabel
measuredtop-slabcalibrateddepth-calibrated
-18
-13.5
-9
-4.5
0
4.5
9
13.5
18
-4.0
-3.0
-2.0
-1.0
0.0
1.0
2.0
3.0
4.0
B2O
B2M B2I
B4O
B4M B4I
T2O
T2M T2I
T4O
T4M T4I
W1B
W1M W1T
W3B
W3M W3T
W5B
W5M W5T
mom
ent(kN
-m/m
)
mom
ent(k-ft/ft)
criticalsectionlabel
measuredtop-slabcalibrateddepth-calibrated

Texas Tech University, Timothy A. Wood, December 2015
127
Figure B.3. Moment plot for Hale Co., TX (Table 4) culvert under 3.5ft of cover soil
Figure B.4. Moment plot for Lubbock Co., TX (Table 4) culvert under 4.0ft of cover soil
-13.5
-9
-4.5
0
4.5
9
13.5
-3.0
-2.0
-1.0
0.0
1.0
2.0
3.0
B2O
B2M B2I
B4O
B4M B4I
T2O
T2M T2I
T4O
T4M T4I
W1B
W1M W1T
W3B
W3M W3T
W5B
W5M W5T
mom
ent(kN
-m/m
)
mom
ent(k-ft/ft)
criticalsectionlabel
measuredtop-slabcalibrateddepth-calibrated
-13.5
-9
-4.5
0
4.5
9
13.5
-3.0
-2.0
-1.0
0.0
1.0
2.0
3.0
B2O
B2M B2I
B4O
B4M B4I
T2O
T2M T2I
T4O
T4M T4I
W1B
W1M W1T
W3B
W3M W3T
W5B
W5M W5T
mom
ent(kN
-m/m
)
mom
ent(k-ft/ft)
criticalsectionlabel
measuredtop-slabcalibrateddepth-calibrated

Texas Tech University, Timothy A. Wood, December 2015
128
Figure B.5. Moment plot for Sarpy Co., NE (Table 4) culvert under 0ft of cover soil
Figure B.6. Moment plot for Sarpy Co., NE (Table 4) culvert under 2.0ft of cover soil
-13.5
-9
-4.5
0
4.5
9
13.5
18
22.5
27
-4.0
-3.0
-2.0
-1.0
0.0
1.0
2.0
3.0
4.0
5.0
6.0
B2O B2M B2I T2O T2M T2I W1B W1M W1T
mom
ent(kN
-m/m
)
mom
ent(k-ft/ft)
criticalsectionlabel
measuredtop-slabcalibrateddepth-calibrated
-13.5
-9
-4.5
0
4.5
9
13.5
18
22.5
-3.0
-2.0
-1.0
0.0
1.0
2.0
3.0
4.0
5.0
B2O B2M B2I T2O T2M T2I W1B W1M W1T
mom
ent(kN
-m/m
)
mom
ent(k-ft/ft)
criticalsectionlabel
measuredtop-slabcalibrateddepth-calibrated

Texas Tech University, Timothy A. Wood, December 2015
129
Figure B.7. Moment plot for Sarpy Co., NE (Table 4) culvert under 3.5ft of cover soil
Figure B.8. Moment plot for Sarpy Co., NE (Table 4) culvert under 6.0ft of cover soil
-9
-4.5
0
4.5
9
-2.0
-1.5
-1.0
-0.5
0.0
0.5
1.0
1.5
2.0
2.5
B2O B2M B2I T2O T2M T2I W1B W1M W1T
mom
ent(kN
-m/m
)
mom
ent(k-ft/ft)
criticalsectionlabel
measuredtop-slabcalibrateddepth-calibrated
-6.75
-5.5
-4.25
-3
-1.75
-0.5
0.75
2
3.25
4.5
5.75
-1.5
-1.0
-0.5
0.0
0.5
1.0
1.5
B2O B2M B2I T2O T2M T2I W1B W1M W1T
mom
ent(kN
-m/m
)
mom
ent(k-ft/ft)
criticalsectionlabel
measuredtop-slabcalibrateddepth-calibrated

Texas Tech University, Timothy A. Wood, December 2015
130
Figure B.9. Moment plot for Sarpy Co., NE (Table 4) culvert under 8.0ft of cover soil
Figure B.10. Moment plot for Sarpy Co., NE (Table 4) culvert under 10.0ft of cover soil
-4.5
-3
-1.5
0
1.5
3
4.5
-1.0
-0.8
-0.6
-0.4
-0.2
0.0
0.2
0.4
0.6
0.8
1.0
B2O B2M B2I T2O T2M T2I W1B W1M W1T
mom
ent(kN
-m/m
)
mom
ent(k-ft/ft)
criticalsectionlabel
measuredtop-slabcalibrateddepth-calibrated
-4.5
0
4.5
9
13.5
-1.0
-0.5
0.0
0.5
1.0
1.5
2.0
2.5
3.0
B2O B2M B2I T2O T2M T2I W1B W1M W1T
mom
ent(kN
-m/m
)
mom
ent(k-ft/ft)
criticalsectionlabel
measuredtop-slabcalibrateddepth-calibrated

Texas Tech University, Timothy A. Wood, December 2015
131
Figure B.11. Moment plot for Sarpy Co., NE (Table 4) culvert under 12.0ft of cover soil
-4.5
-2.25
0
2.25
4.5
-1.0
-0.8
-0.6
-0.4
-0.2
0.0
0.2
0.4
0.6
0.8
1.0
B2O B2M B2I T2O T2M T2I W1B W1M W1T
mom
ent(kN
-m/m
)
mom
ent(k-ft/ft)
criticalsectionlabel
measuredtop-slabcalibrateddepth-calibrated