improved models for transcription factor binding site identification
TRANSCRIPT
INVESTIGATION
Improved Models for Transcription FactorBinding Site Identification Using
Nonindependent InteractionsYue Zhao, Shuxiang Ruan, Manishi Pandey, and Gary D. Stormo1
Department of Genetics, Washington University School of Medicine, St. Louis, Missouri 63108
ABSTRACT Identifying transcription factor (TF) binding sites is essential for understanding regulatory networks. The specificity of mostTFs is currently modeled using position weight matrices (PWMs) that assume the positions within a binding site contributeindependently to binding affinity for any site. Extensive, high-throughput quantitative binding assays let us examine, for the first time,the independence assumption for many TFs. We find that the specificity of most TFs is well fit with the simple PWMmodel, but in somecases more complex models are required. We introduce a binding energy model (BEM) that can include energy parameters fornonindependent contributions to binding affinity. We show that in most cases where a PWM is not sufficient, a BEM that includesenergy parameters for adjacent dinucleotide contributions models the specificity very well. Having more accurate models of specificitygreatly improves the interpretation of in vivo TF localization data, such as from chromatin immunoprecipitation followed by sequencing(ChIP-seq) experiments.
TRANSCRIPTION factor proteins (TFs) function by bind-ing to specific sequences in the genome and activating or
repressing the expression of their target genes. Identifyingthe sequences that each TF binds to can help map out tran-scriptional regulatory networks as well as predict how geneticvariation may disrupt normal gene expression, which is oftenassociated with disease. In vivo TF binding locations canbe determined experimentally using techniques such as chro-matin immunoprecipitation (ChIP) followed by microarrayhybridization (ChIP-chip) (Ren et al. 2000) or chromatinimmunoprecipitation followed by sequencing (ChIP-seq)(Johnson et al. 2007). In addition to its intrinsic specificityfor DNA, in vivo TF binding preferences are influenced byother cellular factors such as the presence of cooperating orcompeting TFs as well as the local chromatin state. It ispossible to gain mechanistic insight by comparing the in-trinsic TF specificity measured in vitro, which reflects onlythe bimolecular interaction between the TF and DNA, within vivo binding locations, which are influenced by many
other cellular factors. For example, in vivo binding to a genomicregion without strong binding sites indicates that the TF iseither binding indirectly (the TF itself is not bound to DNA,but is in complex with some other factor that is bound to DNA)or bound to a weak site that is stabilized by a cooperative in-teraction with another factor (Gordan et al. 2009).
Currently, the most widely used mathematical representa-tion of TF specificity is the position weight matrix (PWM)model (Stormo 2000). This model assumes the positions withinthe binding site are independent, and the contribution at oneposition of the binding site to the overall affinity does not de-pend on the identity of nucleotides in other positions of thesite. Despite the restrictions imposed by this strong indepen-dence assumption, the PWM model has been successfully usedto identify TF binding sites (TFBS) in sets of coexpressed genes(Stormo and Hartzell 1989; Roth et al. 1998; Tavazoie et al.1999; Bussemaker et al. 2001) as well as model TF binding siteevolution (Doniger and Fay 2007; Mustonen et al. 2008; Brad-ley et al. 2010). Quantitative analysis of high-throughput bind-ing data has also shown that PWMs are a good quantitativemodel for most TFs (Zhao et al. 2009; Zhao and Stormo 2011).
Despite the success of PWM-based methods, it has longbeen recognized that TF–DNA interaction is highly complexstructurally. Many cases of a single amino acid interactingwith multiple bases simultaneously have been observed in
Copyright © 2012 by the Genetics Society of Americadoi: 10.1534/genetics.112.138685Manuscript received August 22, 2011; accepted for publication April 7, 2012Supporting information is available online at http://www.genetics.org/content/suppl/2012/04/13/genetics.112.138685.DC11Corresponding author: Washington University, 4444 Forest Park Blvd., Room 5524, St.Louis, MO 63108. Email: [email protected]
Genetics, Vol. 191, 781–790 July 2012 781
crystal structures of TF–DNA complexes (Luscombe et al.2001), the overwhelming majority of which are neighbor-ing bases. In addition to direct contact with bases, TFs canrecognize DNA sequence indirectly through sequence-specific DNA conformations, distortions, or water-mediatedcontacts (Sarai and Kono 2005; Rohs et al. 2009, 2010).For example, drastic DNA deformations have been obser-ved in some TF–DNA complexes, including catabolitegene activator protein (CAP or CRP) and TATA bindingprotein (TBP) (Schultz et al. 1991; Kim et al. 1993). Theidentity of bases in neighboring positions is particularlyimportant for DNA deformation energy through theirstacking interactions.
In addition to structural analysis, detailed biochemicalstudies of specific proteins have also shown dependenciesbetween adjacent positions (Man and Stormo 2001; Bulyket al. 2002; Berger et al. 2006). Interactions between non-adjacent bases are possible (Jacobson et al. 1997), but theyappear to be much less common than interactions betweenadjacent positions (Luscombe et al. 2001).
Statistical analyses of collections of known binding siteshave also offered evidence of interactions between positionswithin binding sites for some TFs. Several groups (Barashet al. 2003; Zhou and Liu 2004; Tomovic and Oakeley 2007)have analyzed collections of TF binding sites in the TRANS-FAC and JASPAR databases (Matys et al. 2006; Portales-Casamar et al. 2010) and found statistically significantcorrelated positions. Although these studies successfullyidentified the existence of correlated positions within TFBS,the type of binding data then available imposed severelimits on their analyses. The most serious problem wasthe small number of known binding sites available. Forexample, on average, only 30 binding sites per TF wereused in the Tomovic and Oakeley (2007) study. Anotherproblem is that TFBS collected in databases such asTRANSFAC (Matys et al. 2006) and JASPAR (Portales-Casamar et al. 2010) generally do not include affinitydata; a sequence is simply labeled as a binding site. Thisbinarization results in a loss of information and is espe-cially problematic in the setting of small sample sizes.Finally, because of the nonlinearity between binding prob-ability and binding affinity, the nonindependence in basefrequencies in different positions may be observed evenwhen the binding energy contributions are independent(Djordjevic et al. 2003; Homsi et al. 2009; Zhao et al. 2009).Therefore analyses that specifically model the binding en-ergy contributions of each base at each position can betteraddress the issue of whether they act independently.
Recently, experimental techniques for high-throughput,quantitative measurements of TF binding specificity havebeen developed (Stormo and Zhao 2010). The wealth ofdata generated by these high-throughput experiments pro-vides us with an opportunity to answer questions left openby previous analyses. One such unanswered question is theaverage effect size of interactions between positions. Eventhough statistically significant interactions may exist be-
tween positions within the binding site of a TF, if their effectsize is small, then the PWM model may still provide a goodapproximation of the true TF specificity (Benos et al. 2002).However, if the effect size is large, then more complexstatistical models, requiring additional parameters, mustbe used to adequately model the specificity of the TF. Thishas important practical implications as the vast majorityof existing bioinformatics software use the PWM model.Models designed to accommodate complex interactionswithin a binding site have been developed (Stormo et al.1986; Zhang and Marr 1993; Barash et al. 2003; King andRoth 2003; Zhou and Liu 2004; Sharon et al. 2008; Stormo2011) but have not seen wide adoption.
In this article, we report the results of a quantitativeanalysis of .400 TF specificity data obtained using theuniversal protein-binding microarray (PBM) technology(Berger et al. 2006; Berger and Bulyk 2009) and availablein the UniPROBE database (Robasky and Bulyk 2011). Weuse the binding energy estimate by maximum likelihood forPBM (BEEML-PBM) (Zhao and Stormo 2011) program toparameterize specificity models of varying complexity andfind that improvements from incorporating interactions be-tween positions are usually small, although there are somesignificant exceptions. Moreover, we find that interactionsbetween neighboring bases are stronger than interactionsbetween nonneighboring bases.
Materials and Methods
Model of TF specificity
We use an equilibrium model of binding (Djordjevic et al.2003; Zhao et al. 2009) where the probability that DNAsequence Si is bound by the TF is given by
PðSi is boundÞ¼ 11þ eEðSiÞ2m
; (1)
where E(Si) is the free energy of the TF binding to Si and m
is the chemical potential that is related to the TFconcentration.
We introduce the binding energy model (BEM) as a vectorof energy contributions, E
!. For any sequence, Si, the bind-
ing energy predicted by the model is EðSiÞ ¼ E!� S!i, where
S!
i is the vector encoding of the sequence Si that can includewhatever features of the sequence are relevant to its bindingenergy (Schneider et al. 1984; Stormo et al. 1986; Sharonet al. 2008; Stormo 2011). If the only relevant featuresare which bases occur at each position within the bindingsite, then E
!will be a PWM with the characteristic that
each element is an energy contribution (Djordjevic et al.2003; Zhao et al. 2009). PWMs have been developed usinga variety of techniques. The first use was as a discriminantfunction learned to separate sequences into two classes(Stormo et al. 1982). Staden introduced a probabilisticversion of the PWM (Staden 1984) and a variety of other,mostly ad hoc, methods have also been used. Under certain
782 Y. Zhao et al.
conditions the probabilistic model is equivalent to an energymodel (Berg and von Hippel 1987; Heumann et al. 1994;Stormo and Fields 1998; Lassig 2007), but those conditionsare violated at high concentrations of the TF (Djordjevicet al. 2003; Zhao et al. 2009). By using an energy modeldirectly and including the TF concentration as a separateparameter, m, one can model the nonlinear relationship be-tween the logarithm of binding probability and the bindingfree energy described in Equation 1.
When the energy contributions of each position areindependent, E
!� S!i is explicitly
EðSiÞ ¼XT
b¼A
XL
m¼1
eðb;mÞSiðb;mÞ;
where L is the length of the binding site, e(b,m) are theenergy contributions of base b at position m, and Si(b, m)is an indicator variable with Si(b, m) = 1 if base b occursat position m of sequence Si and Si(b, m) = 0 otherwise(Stormo et al. 1982; Stormo 2000). If we find that thepositions are not independent, we can include pairwiseinteractions between adjacent positions by adding interac-tion terms to the energy function such that E
!� S!i is
EðSiÞ ¼PT
b¼A
PL
m¼1eðb;mÞSiðb;mÞ
þ PL21
m¼1
PL
n¼mþ1
PT
b¼A
PT
c¼Aeðb;m; c; nÞSiðb;m; c; nÞ;
where e(b, m, c, n) is the energy contribution of having baseb at position m and base c at position n. Since the single-basecontributions are included explicitly, in the first set of sums,the dinucleotide contributions explicitly represent the devi-ations from additivity of the individual bases, the energyresiduals not captured by the single-base contributions.Higher-order models can be constructed similarly and ineach case can be represented as E
!� S!i, where both vectorsinclude the relevant elements that contribute to the bindingenergy.
Encoding of DNA sequence
In learning the energy parameters we use the WYK encodingscheme (Stormo 2011), which uses the minimum number ofparameters required of the model and enforces the clearseparation of the contributions of the individual bases fromthe contributions of the interactions between the bases. Thisencoding has the further advantage, especially for some ma-chine-learning and optimization methods (Stormo 2011),that all sequence vectors have the same Euclidian lengthðj S!ij ¼ ð S!l � S!lÞ1=2Þ so the energy of a sequence is propor-tional to the cosine of the angle between it and the energyvector Ei [EðSiÞ ¼ E
!� S!l ¼ j E!jj S!ljcosu; where u is the an-gle between the vectors. For convenience of display and in-terpretation the models are converted to standard ACGTencoding as described above.
Scoring sequences with binding energy models
Given a binding energy model E!, the program BEMSER
scans a sequence and determines the predicted binding en-ergy at every location within the sequence (including bothorientations if desired). If E
!contains only independent base
contributions (it is a PWM), then BEMSER returns the samescores as would be obtained using PatSer (Hertz and Stormo1999), a commonly used program for scanning sequenceswith a PWM. But if E
!also contains energy contributions
from combinations of bases, BEMSER uses those contribu-tions as well to score each potential site (subsequence) inthe sequence. BEMSER as well as all of the BEMs are avail-able for download from http://stormo.wustl.edu/TF-BEMs.
Parameterization of TF specificity model
The models are all determined from PBM data availablefrom the UniPROBE database (Robasky and Bulyk 2011). Allmodels were parameterized using the BEEML-PBM algo-rithm, which has been described in detail previously (Zhaoand Stormo 2011). Briefly, BEEML-PBM employs nonlinearregression to obtain the parameters of the model, E
!and m,
that maximize the fit to the data.
Evaluation of model performance on PBM data
Given a binding energy model the fluorescence of eachprobe is predicted by summing the predicted bindingprobabilities for each position in the probe sequence in bothorientations. Because the individual probe measurementsare somewhat noisy, we determine the median fluorescenceintensity for all 8mers, each of which occurs 32 times on thearray (counting both orientations). We assess the perfor-mance of different models by determining the square of thecorrelation coefficient (r2) between the predicted and mea-sured 8mer intensities. When only one array exists for a spe-cific TF, this is useful in determining how much better fit isobtained (increase in r2) for models that include dinucleo-tide contributions than for those that assume independentbase contributions. Because of the large number of 8mers,even very small changes in r2 are statistically significant(P, 0.05), but may make almost no difference in predictionaccuracy.
A subset of 147 TFs, from the complete set of 401available in UniPROBE, was assayed on two independentarrays with different probe sequences, but each containingall possible 10mers (Berger and Bulyk 2009). In those caseswe can assess how well a model obtained from one arraypredicts the 8mer intensities of the other array for the sameTF; we use the average of the two cross-predictions as theperformance of the model. The squared correlation coeffi-cient between the observed 8mer intensities for the twoarrays is referred to as the replicate reproducibility. In pre-vious work we considered models whose performance wasat least 90% of the replicate reproducibility to provide verygood fits to the data (Zhao and Stormo 2011). But it shouldbe noted that it is possible, in fact common, for the model
Binding Energy Models 783
performance to exceed the replicate reproducibility as weshowed in the supplemental materials of that article. Thiscan occur when one of the two datasets is considerablynoisier than the other. The replicate reproducibility can thenbe fairly low and the predictions using the model from thegood array have low r2 on the noisier array. But we showedthat the noisy array is still capable of generating fairly goodmodels with much higher r2 on the good array. The averageof the two model r2 values can then exceed the replicatereproducibility.
Analysis of ChIP-seq data
The DNA-binding domain of Hepatocyte nuclear factor 4,alpha (Hnf4a) is completely conserved between human andmouse. Since Badis et al. (2009) used only the DNA-bindingdomain of mouse Hnf4a to determine its in vitro bindingspecificity, we used this information to analyze Verziet al.’s (2010) ChIP-seq data even though it was carriedout in human cell lines. Hnf4a ChIP-seq data were down-loaded from Gene Expression Omnibus (accession no.GSM575227) from the study conducted by Verzi et al.(2010) and we used the peak location and summit informa-tion as provided. Binding site location analysis was con-ducted by aligning all peaks by their annotated summitand scoring genomic sequences within 200 bp on each sideof the summit, using each of the different models for pre-dicting the binding sites. For each model, the predicted low-est energy site within that window was considered thebinding site for that peak. In the vast majority of cases thepredicted best binding site was the same for all modelswithin that 400-bp window. We then determined the num-ber of reads that overlap that predicted binding site afterextending each read by 100 bp on each side. While thechoices of 400- and 200-bp windows are somewhat arbi-trary, they are consistent with typical fragmentation sizesfor ChIP-seq experiments. Most importantly, since most ofthe predicted sites are the same for all of the models, we candirectly compare their predicted relative affinities for eachidentified peak without the confounding effect of differentmodels predicting different binding sites. For each modelthe predicted relative binding affinities for the predictedbinding site within each peak were calculated as eðEcon2EsiteÞ,where Econ is the energy of the lowest possible energy site(the consensus sequence for the model) and Esite is the en-ergy of the site being considered.
Primary and secondary PWMs for Hnf4a obtained by theseed-and-wobble method (Berger et al. 2006) were down-loaded from the UniPROBE database (Robasky and Bulyk2011) and converted to energy PWMs. Positions with lowinformation content were trimmed off so both PWMs were8-long, the same size as the BEEML models. The energy ofan 8mer was calculated as the minimum of the energiespredicted by primary and secondary PWMs. If longer modelswere used, the predicted relative affinities would either staythe same (in cases where the predicted site had the consen-sus base in the additional position) or decrease (if it had
a nonconsensus base). So by trimming the UniPROBE mod-els to be 8-long, the differences in the predicted relativeaffinities between different models are minimized.
Results
PBM technology uses double-stranded DNA microarrays tomeasure the binding of TFs to many sequences in a highlyparallel fashion (Bulyk et al. 2001; Mukherjee et al. 2004;Berger et al. 2006). In the current design (Berger et al. 2006;Berger and Bulyk 2009) all possible 10-nucleotide-longbinding sites (10mers) are contained in the sequences ofmicroarray probes. In a recent PBM study, Badis et al.(2009) measured the binding specificity of 104 mouse TFsand found many cases where the best PWM model theyobtained seemed inadequate to represent TF specificity. Infact, the authors invoked a model where TFs could use al-ternative modes of binding, each represented by indepen-dent PWMs, to explain the PBM data. We developeda nonlinear regression method, BEEML-PBM, to estimatePWM parameters from PBM data (Zhao and Stormo2011). Using BEEML-PBM, we showed that, contrary tothe conclusions of Badis et al. (2009), the PWM model pro-vides a good quantitative model of specificity for most of theTFs in their study.
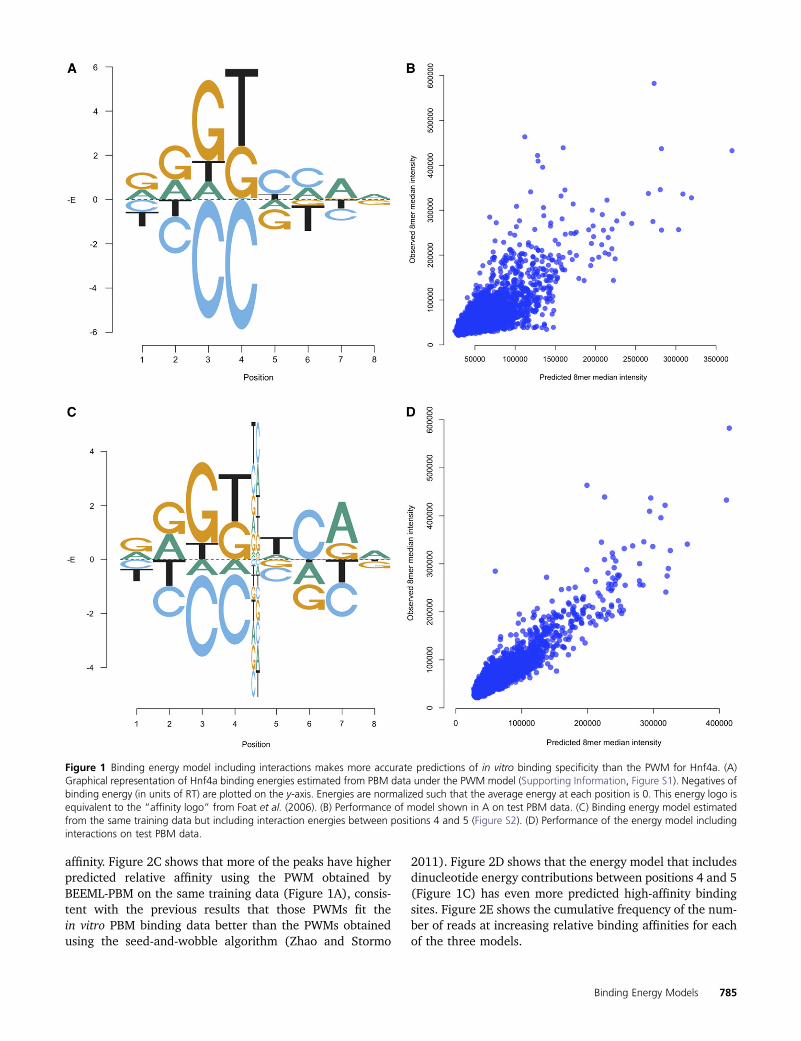
Despite the good performance of the PWM model ingeneral, there were cases where the simple PWM performedpoorly. For example, an 8-long BEEML-PBM PWM for Hnf4atrained on the data from one array is able to predict themedian 8mer intensities of probes on the test array withonly an r2 = 0.55 (Figure 1, A and B), much less than theexperimental reproducibility between the training and test-ing data (r2 = 0.82). A model that includes interactionsbetween all adjacent positions, which requires an additional63 parameters over the PWM, results in significantly im-proved performance (r2 = 0.81). We also tested the perfor-mance of all 28 possible 8-long models that include a singlepairwise interaction between two positions and found thata model with interaction terms only between positions 4 and5 is able to achieve an r2 = 0.78 (Figure 1, C and D). Thismodel appears to capture most of the relevant features ofHnf4a binding and includes only 9 more parameters thanthe PWM.
To determine the biological significance of the positiondependence observed in vitro, we compared different spec-ificity models of Hnf4a learned from PBM data with in vivobinding data from the ChIP-seq experiment conducted byVerzi et al. (2010). Figure 2A shows the primary and sec-ondary PWMs obtained for Hnf4a from the UniProbe data-base (Robasky and Bulyk 2011). Figure 2B shows that thevast majority of best binding sites for the ChIP-seq peakshave very low predicted relative affinity using the UniProbePWMs. Those PWMs are highly specific and the vast major-ity of peaks do not contain consensus sites for either theprimary or the secondary motif or even for variations fromthe consensus that are predicted to be of high relative
784 Y. Zhao et al.
affinity. Figure 2C shows that more of the peaks have higherpredicted relative affinity using the PWM obtained byBEEML-PBM on the same training data (Figure 1A), consis-tent with the previous results that those PWMs fit thein vitro PBM binding data better than the PWMs obtainedusing the seed-and-wobble algorithm (Zhao and Stormo
2011). Figure 2D shows that the energy model that includesdinucleotide energy contributions between positions 4 and 5(Figure 1C) has even more predicted high-affinity bindingsites. Figure 2E shows the cumulative frequency of the num-ber of reads at increasing relative binding affinities for eachof the three models.
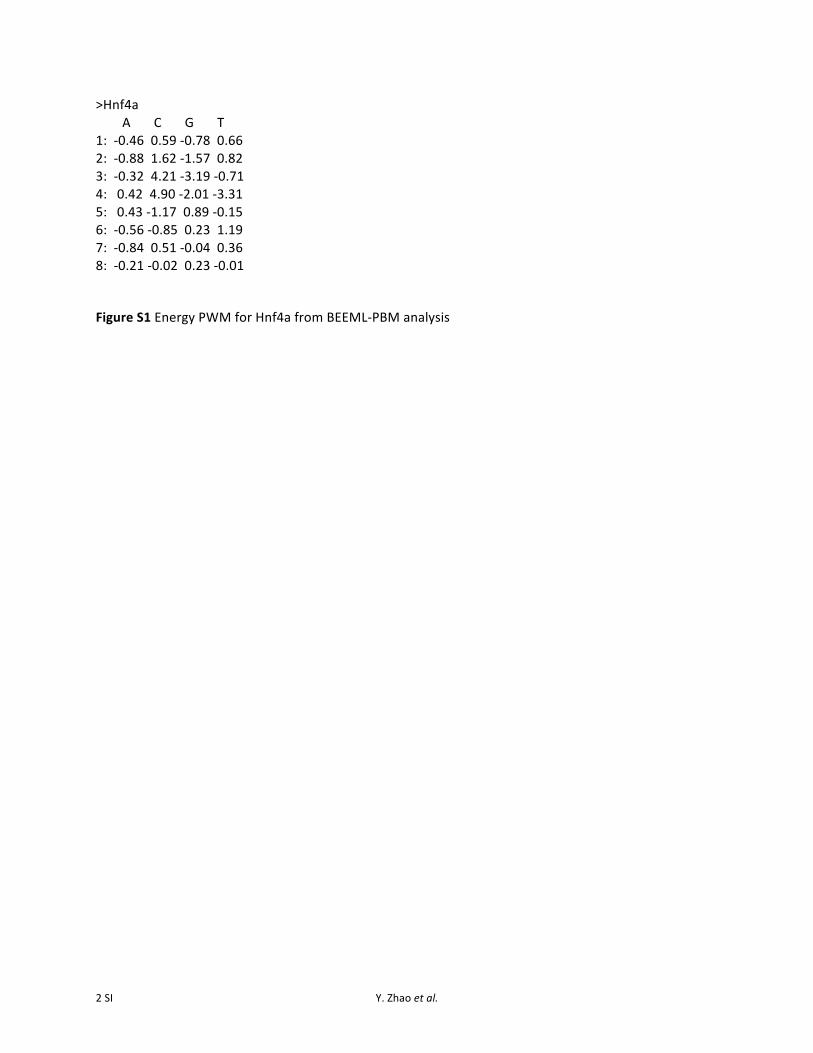
Figure 1 Binding energy model including interactions makes more accurate predictions of in vitro binding specificity than the PWM for Hnf4a. (A)Graphical representation of Hnf4a binding energies estimated from PBM data under the PWM model (Supporting Information, Figure S1). Negatives ofbinding energy (in units of RT) are plotted on the y-axis. Energies are normalized such that the average energy at each position is 0. This energy logo isequivalent to the “affinity logo” from Foat et al. (2006). (B) Performance of model shown in A on test PBM data. (C) Binding energy model estimatedfrom the same training data but including interaction energies between positions 4 and 5 (Figure S2). (D) Performance of the energy model includinginteractions on test PBM data.
Binding Energy Models 785

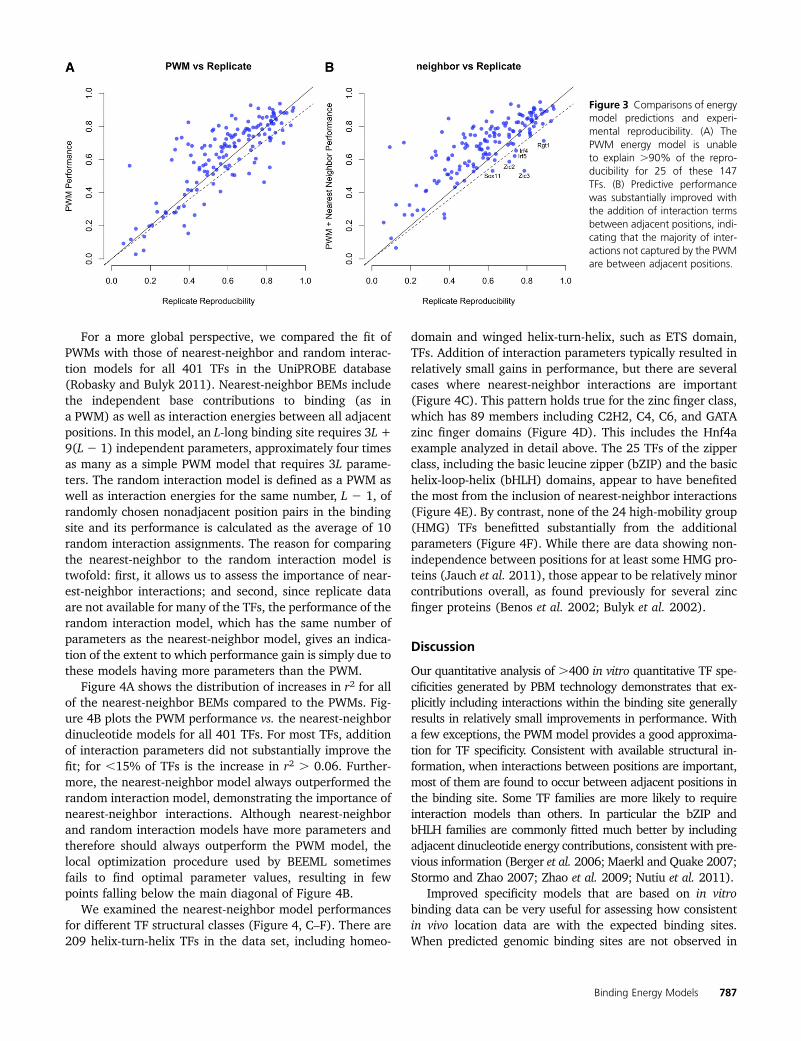
We next examined the 147 TFs in the UniPROBEdatabase (Robasky and Bulyk 2011) for which replicatedata are available. Figure 3A shows that the PWM modelis unable to explain .90% of the reproducibility for 25of these 147 TFs (17%). Note that the models obtainedusing BEEML-PBM are often better at predicting probeintensities than the reproducibility between arrays. Thisis because good models can be obtained even from noisy
experimental data, as demonstrated in the Foxa2 exampleof Figure S4 of Zhao and Stormo (2011). For most ofthe TFs that are not well modeled by simple PWMs, pre-dictive performance was substantially improved withthe addition of interaction terms between adjacent posi-tions (Figure 3B), indicating that the majority of interac-tions not captured by the PWM are between adjacentpositions.
Figure 2 Hnf4a energy model including interactions makes more accurate predictions of in vivo ChIP-seq binding data. (A) Primary and secondarybinding energy models for Hnf4a obtained by UniPROBE (Robasky and Bulyk 2011) (Figure S3). (B) Primary and secondary models predicted affinity ofthe best site under each peak vs. number of reads overlapping the best predicted sites. (C) BEEML-PBM PWM predicted affinities of best sites vs. numberof reads. (D) Energy model including interaction between positions 4 and 5 predicted affinities of best sites vs. number of reads. (E) Cumulativefrequency (fraction of total reads) for each model at increasing predicted relative affinities.
786 Y. Zhao et al.
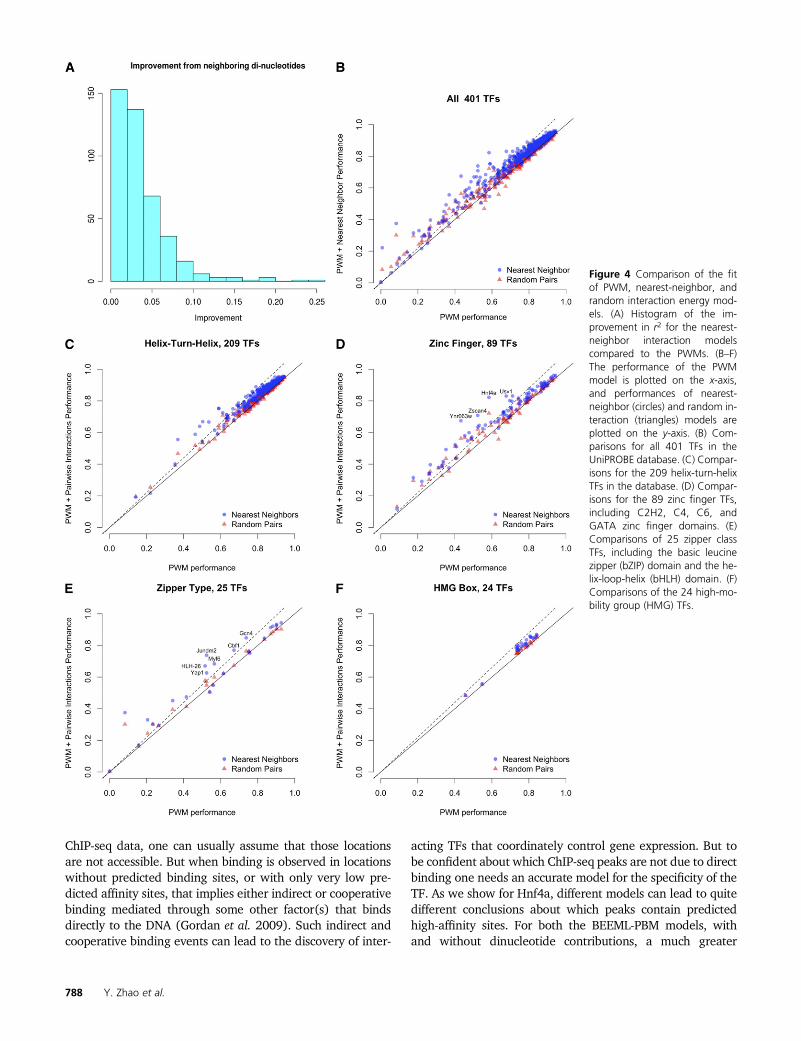
For a more global perspective, we compared the fit ofPWMs with those of nearest-neighbor and random interac-tion models for all 401 TFs in the UniPROBE database(Robasky and Bulyk 2011). Nearest-neighbor BEMs includethe independent base contributions to binding (as ina PWM) as well as interaction energies between all adjacentpositions. In this model, an L-long binding site requires 3L +9(L 2 1) independent parameters, approximately four timesas many as a simple PWM model that requires 3L parame-ters. The random interaction model is defined as a PWM aswell as interaction energies for the same number, L 2 1, ofrandomly chosen nonadjacent position pairs in the bindingsite and its performance is calculated as the average of 10random interaction assignments. The reason for comparingthe nearest-neighbor to the random interaction model istwofold: first, it allows us to assess the importance of near-est-neighbor interactions; and second, since replicate dataare not available for many of the TFs, the performance of therandom interaction model, which has the same number ofparameters as the nearest-neighbor model, gives an indica-tion of the extent to which performance gain is simply due tothese models having more parameters than the PWM.
Figure 4A shows the distribution of increases in r2 for allof the nearest-neighbor BEMs compared to the PWMs. Fig-ure 4B plots the PWM performance vs. the nearest-neighbordinucleotide models for all 401 TFs. For most TFs, additionof interaction parameters did not substantially improve thefit; for ,15% of TFs is the increase in r2 . 0.06. Further-more, the nearest-neighbor model always outperformed therandom interaction model, demonstrating the importance ofnearest-neighbor interactions. Although nearest-neighborand random interaction models have more parameters andtherefore should always outperform the PWM model, thelocal optimization procedure used by BEEML sometimesfails to find optimal parameter values, resulting in fewpoints falling below the main diagonal of Figure 4B.
We examined the nearest-neighbor model performancesfor different TF structural classes (Figure 4, C–F). There are209 helix-turn-helix TFs in the data set, including homeo-
domain and winged helix-turn-helix, such as ETS domain,TFs. Addition of interaction parameters typically resulted inrelatively small gains in performance, but there are severalcases where nearest-neighbor interactions are important(Figure 4C). This pattern holds true for the zinc finger class,which has 89 members including C2H2, C4, C6, and GATAzinc finger domains (Figure 4D). This includes the Hnf4aexample analyzed in detail above. The 25 TFs of the zipperclass, including the basic leucine zipper (bZIP) and the basichelix-loop-helix (bHLH) domains, appear to have benefitedthe most from the inclusion of nearest-neighbor interactions(Figure 4E). By contrast, none of the 24 high-mobility group(HMG) TFs benefitted substantially from the additionalparameters (Figure 4F). While there are data showing non-independence between positions for at least some HMG pro-teins (Jauch et al. 2011), those appear to be relatively minorcontributions overall, as found previously for several zincfinger proteins (Benos et al. 2002; Bulyk et al. 2002).
Discussion
Our quantitative analysis of .400 in vitro quantitative TF spe-cificities generated by PBM technology demonstrates that ex-plicitly including interactions within the binding site generallyresults in relatively small improvements in performance. Witha few exceptions, the PWM model provides a good approxima-tion for TF specificity. Consistent with available structural in-formation, when interactions between positions are important,most of them are found to occur between adjacent positions inthe binding site. Some TF families are more likely to requireinteraction models than others. In particular the bZIP andbHLH families are commonly fitted much better by includingadjacent dinucleotide energy contributions, consistent with pre-vious information (Berger et al. 2006; Maerkl and Quake 2007;Stormo and Zhao 2007; Zhao et al. 2009; Nutiu et al. 2011).
Improved specificity models that are based on in vitrobinding data can be very useful for assessing how consistentin vivo location data are with the expected binding sites.When predicted genomic binding sites are not observed in
Figure 3 Comparisons of energymodel predictions and experi-mental reproducibility. (A) ThePWM energy model is unableto explain .90% of the repro-ducibility for 25 of these 147TFs. (B) Predictive performancewas substantially improved withthe addition of interaction termsbetween adjacent positions, indi-cating that the majority of inter-actions not captured by the PWMare between adjacent positions.
Binding Energy Models 787
ChIP-seq data, one can usually assume that those locationsare not accessible. But when binding is observed in locationswithout predicted binding sites, or with only very low pre-dicted affinity sites, that implies either indirect or cooperativebinding mediated through some other factor(s) that bindsdirectly to the DNA (Gordan et al. 2009). Such indirect andcooperative binding events can lead to the discovery of inter-
acting TFs that coordinately control gene expression. But tobe confident about which ChIP-seq peaks are not due to directbinding one needs an accurate model for the specificity of theTF. As we show for Hnf4a, different models can lead to quitedifferent conclusions about which peaks contain predictedhigh-affinity sites. For both the BEEML-PBM models, withand without dinucleotide contributions, a much greater
Figure 4 Comparison of the fitof PWM, nearest-neighbor, andrandom interaction energy mod-els. (A) Histogram of the im-provement in r2 for the nearest-neighbor interaction modelscompared to the PWMs. (B–F)The performance of the PWMmodel is plotted on the x-axis,and performances of nearest-neighbor (circles) and random in-teraction (triangles) models areplotted on the y-axis. (B) Com-parisons for all 401 TFs in theUniPROBE database. (C) Compar-isons for the 209 helix-turn-helixTFs in the database. (D) Compar-isons for the 89 zinc finger TFs,including C2H2, C4, C6, andGATA zinc finger domains. (E)Comparisons of 25 zipper classTFs, including the basic leucinezipper (bZIP) domain and the he-lix-loop-helix (bHLH) domain. (F)Comparisons of the 24 high-mo-bility group (HMG) TFs.
788 Y. Zhao et al.
fraction of the ChIP-seq reads can be explained by directbinding, with the dinucleotide model explaining the most.
In these analyses we have considered a model to be a goodfit to the PBM data if it can capture .90% of the reproduciblevariance of the experiment. However, some of the data sets arefairly noisy and it is possible that cleaner data would show thateven the interaction models do not capture the specificity well.For example, the Hnf4a PBM data have reproducibility be-tween the two arrays of only r2 = 0.82. The BEM with inter-action terms between only positions 4 and 5 predicts the testarray data with r2 = 0.78, which is nearly all of the reproduc-ible variance. But if additional data had higher consistencybetween experiments, it is possible that additional terms wouldbe required to obtain an adequate model. We can only claimthat, given the current experimental data sets, in most casessimple PWMs fit the data quite well and in most of the remain-ing cases an extended BEM, with energy terms for adjacentdinucleotides, captures most of the remaining variance.
Acknowledgments
We thank all members of the Stormo laboratory for helpfulcomments on this work. Funding was provided by NationalInstitutes of Health grant HG00249 (to G.D.S.).
Literature Cited
Badis, G., M. F. Berger, A. A. Philippakis, S. Talukder, A. R. Gehrkeet al., 2009 Diversity and complexity in DNA recognition bytranscription factors. Science 324: 1720–1723.
Barash, Y., G. Elidan, T. Kaplan, and N. Friedman, 2003 Modelingdependencies in protein-DNA binding sites. Proceedings of the7th Annual International Conference on Computational Molec-ular Biology (RECOMB), ACM, New York, pp. 28–37.
Benos, P. V., M. L. Bulyk, and G. D. Stormo, 2002 Additivity inprotein-DNA interactions: how good an approximation is it?Nucleic Acids Res. 30: 4442–4451.
Berg, O. G., and P. H. von Hippel, 1987 Selection of DNA bindingsites by regulatory proteins. Statistical-mechanical theory andapplication to operators and promoters. J. Mol. Biol. 193:723–750.
Berger, M. F., and M. L. Bulyk, 2009 Universal protein-bindingmicroarrays for the comprehensive characterization of theDNA-binding specificities of transcription factors. Nat. Protoc.4: 393–411.
Berger, M. F., A. A. Philippakis, A. M. Qureshi, F. S. He, P. W. Estep,3rd et al., 2006 Compact, universal DNA microarrays to com-prehensively determine transcription-factor binding site specif-icities. Nat. Biotechnol. 24: 1429–1435.
Bradley, R. K., X. Y. Li, C. Trapnell, S. Davidson, L. Pachter et al.,2010 Binding site turnover produces pervasive quantitativechanges in transcription factor binding between closely relatedDrosophila species. PLoS Biol. 8: e1000343.
Bulyk, M. L., X. Huang, Y. Choo, and G. M. Church,2001 Exploring the DNA-binding specificities of zinc fingerswith DNA microarrays. Proc. Natl. Acad. Sci. USA 98: 7158–7163.
Bulyk, M. L., P. L. Johnson, and G. M. Church, 2002 Nucleotidesof transcription factor binding sites exert interdependent effectson the binding affinities of transcription factors. Nucleic AcidsRes. 30: 1255–1261.
Bussemaker, H. J., H. Li, and E. D. Siggia, 2001 Regulatory ele-ment detection using correlation with expression. Nat. Genet.27: 167–171.
Djordjevic, M., A. M. Sengupta, and B. I. Shraiman, 2003 A bio-physical approach to transcription factor binding site discovery.Genome Res. 13: 2381–2390.
Doniger, S. W., and J. C. Fay, 2007 Frequent gain and loss offunctional transcription factor binding sites. PLoS Comput. Biol.3: e99.
Foat, B. C., A. V. Morozov, and H. J. Bussemaker, 2006 Statisticalmechanical modeling of genome-wide transcription factor occu-pancy data by MatrixREDUCE. Bioinformatics 22: e141–e149.
Gordan, R., A. J. Hartemink, and M. L. Bulyk, 2009 Distinguishingdirect vs. indirect transcription factor-DNA interactions. GenomeRes. 19: 2090–2100.
Hertz, G. Z., and G. D. Stormo, 1999 Identifying DNA and proteinpatterns with statistically significant alignments of multiple se-quences. Bioinformatics 15: 563–577.
Heumann, J. M., A. S. Lapedes, and G. D. Stormo, 1994 Neuralnetworks for determining protein specificity and multiple align-ment of binding sites. Proc. Int. Conf. Intell. Syst. Mol. Biol. 2:188–194.
Homsi, D. S., V. Gupta, and G. D. Stormo, 2009 Modeling thequantitative specificity of DNA-binding proteins from examplebinding sites. PLoS ONE 4: e6736.
Jacobson, E. M., P. Li, A. Leon-del-Rio, M. G. Rosenfeld, and A. K.Aggarwal, 1997 Structure of Pit-1 POU domain bound to DNAas a dimer: unexpected arrangement and flexibility. Genes Dev.11: 198–212.
Jauch, R., C. K. Ng, K. Narasimhan, and P. R. Kolatkar, 2012 Thecrystal structure of the Sox4 HMG domain-DNA complex sug-gests a mechanism for positional interdependence in DNA rec-ognition. Biochem. J. 443: 39–47.
Johnson, D. S., A. Mortazavi, R. M. Myers, and B. Wold,2007 Genome-wide mapping of in vivo protein-DNA interac-tions. Science 316: 1497–1502.
Kim, Y., J. H. Geiger, S. Hahn, and P. B. Sigler, 1993 Crystalstructure of a yeast TBP/TATA-box complex. Nature 365: 512–520.
King, O. D., and F. P. Roth, 2003 A non-parametric model fortranscription factor binding sites. Nucleic Acids Res. 31: e116.
Lassig, M., 2007 From biophysics to evolutionary genetics: statis-tical aspects of gene regulation. BMC Bioinformatics 8(Suppl.6): S7.
Luscombe, N. M., R. A. Laskowski, and J. M. Thornton,2001 Amino acid-base interactions: a three-dimensional anal-ysis of protein-DNA interactions at an atomic level. NucleicAcids Res. 29: 2860–2874.
Maerkl, S. J., and S. R. Quake, 2007 A systems approach to mea-suring the binding energy landscapes of transcription factors.Science 315: 233–237.
Man, T. K., and G. D. Stormo, 2001 Non-independence of Mntrepressor-operator interaction determined by a new quantitativemultiple fluorescence relative affinity (QuMFRA) assay. NucleicAcids Res. 29: 2471–2478.
Matys, V., O. V. Kel-Margoulis, E. Fricke, I. Liebich, S. Land et al.,2006 TRANSFAC and its module TRANSCompel: transcrip-tional gene regulation in eukaryotes. Nucleic Acids Res. 34:D108–D110.
Mukherjee, S., M. F. Berger, G. Jona, X. S. Wang, D. Muzzey et al.,2004 Rapid analysis of the DNA-binding specificities of tran-scription factors with DNA microarrays. Nat. Genet. 36: 1331–1339.
Mustonen, V., J. Kinney, C. G. Callan, Jr., and M. Lassig,2008 Energy-dependent fitness: a quantitative model for theevolution of yeast transcription factor binding sites. Proc. Natl.Acad. Sci. USA 105: 12376–12381.
Binding Energy Models 789
Nutiu, R., R. C. Friedman, S. Luo, I. Khrebtukova, D. Silva et al.,2011 Direct measurement of DNA affinity landscapes ona high-throughput sequencing instrument. Nat. Biotechnol. 29:659–664.
Portales-Casamar, E., S. Thongjuea, A. T. Kwon, D. Arenillas, X.Zhao et al., 2010 JASPAR 2010: the greatly expanded open-access database of transcription factor binding profiles. NucleicAcids Res. 38: D105–D110.
Ren, B., F. Robert, J. J. Wyrick, O. Aparicio, E. G. Jennings et al.,2000 Genome-wide location and function of DNA binding pro-teins. Science 290: 2306–2309.
Robasky, K., and M. L. Bulyk, 2011 UniPROBE, update 2011: ex-panded content and search tools in the online database of pro-tein-binding microarray data on protein-DNA interactions.Nucleic Acids Res. 39: D124–D128.
Rohs, R., S. M. West, A. Sosinsky, P. Liu, R. S. Mann et al.,2009 The role of DNA shape in protein-DNA recognition. Na-ture 461: 1248–1253.
Rohs, R., X. Jin, S. M. West, R. Joshi, B. Honig et al., 2010 Originsof specificity in protein-DNA recognition. Annu. Rev. Biochem.79: 233–269.
Roth, F. P., J. D. Hughes, P. W. Estep, and G. M. Church,1998 Finding DNA regulatory motifs within unaligned non-coding sequences clustered by whole-genome mRNA quantita-tion. Nat. Biotechnol. 16: 939–945.
Sarai, A., and H. Kono, 2005 Protein-DNA recognition patternsand predictions. Annu. Rev. Biophys. Biomol. Struct. 34: 379–398.
Schneider, T. D., G. D. Stormo, M. A. Yarus, and L. Gold,1984 Delila system tools. Nucleic Acids Res. 12: 129–140.
Schultz, S. C., G. C. Shields, and T. A. Steitz, 1991 Crystal struc-ture of a CAP-DNA complex: the DNA is bent by 90 degrees.Science 253: 1001–1007.
Sharon, E., S. Lubliner, and E. Segal, 2008 A feature-based ap-proach to modeling protein-DNA interactions. PLoS Comput.Biol. 4: e1000154.
Staden, R., 1984 Computer methods to locate signals in nucleicacid sequences. Nucleic Acids Res. 12: 505–519.
Stormo, G. D., 2000 DNA binding sites: representation and dis-covery. Bioinformatics 16: 16–23.
Stormo, G. D., 2011 Maximally efficient modeling of DNA sequencemotifs at all levels of complexity. Genetics 187: 1219–1224.
Stormo, G. D., and D. S. Fields, 1998 Specificity, free energy andinformation content in protein-DNA interactions. Trends Bio-chem. Sci. 23: 109–113.
Stormo, G. D., and G. W. Hartzell III. 1989 Identifying protein-binding sites from unaligned DNA fragments. Proc. Natl. Acad.Sci. USA 86: 1183–1187.
Stormo, G. D., and Y. Zhao, 2007 Putting numbers on the net-work connections. BioEssays 29: 717–721.
Stormo, G. D., and Y. Zhao, 2010 Determining the specificity ofprotein-DNA interactions. Nat. Rev. Genet. 11: 751–760.
Stormo, G. D., T. D. Schneider, L. Gold, and A. Ehrenfeucht,1982 Use of the ’Perceptron’ algorithm to distinguish transla-tional initiation sites in E. coli. Nucleic Acids Res. 10: 2997–3011.
Stormo, G. D., T. D. Schneider, and L. Gold, 1986 Quantitativeanalysis of the relationship between nucleotide sequence andfunctional activity. Nucleic Acids Res. 14: 6661–6679.
Tavazoie, S., J. D. Hughes, M. J. Campbell, R. J. Cho, and G. M.Church, 1999 Systematic determination of genetic networkarchitecture. Nat. Genet. 22: 281–285.
Tomovic, A., and E. J. Oakeley, 2007 Position dependencies intranscription factor binding sites. Bioinformatics 23: 933–941.
Verzi, M. P., H. Shin, H. H. He, R. Sulahian, C. A. Meyer et al.,2010 Differentiation-specific histone modifications reveal dy-namic chromatin interactions and partners for the intestinaltranscription factor CDX2. Dev. Cell 19: 713–726.
Zhang, M. Q., and T. G. Marr, 1993 A weight array method forsplicing signal analysis. Comput. Appl. Biosci. 9: 499–509.
Zhao, Y., and G. D. Stormo, 2011 Quantitative analysis demon-strates most transcription factors require only simple models ofspecificity. Nat. Biotechnol. 29: 480–483.
Zhao, Y., D. Granas, and G. D. Stormo, 2009 Inferring bindingenergies from selected binding sites. PLoS Comput. Biol. 5:e1000590.
Zhou, Q., and J. S. Liu, 2004 Modeling within-motif dependencefor transcription factor binding site predictions. Bioinformatics20: 909–916.
Communicating editor: J. Boeke
790 Y. Zhao et al.
GENETICSSupporting Information
http://www.genetics.org/content/suppl/2012/04/13/genetics.112.138685.DC1
Improved Models for Transcription FactorBinding Site Identification Using
Nonindependent InteractionsYue Zhao, Shuxiang Ruan, Manishi Pandey, and Gary D. Stormo
Copyright © 2012 by the Genetics Society of AmericaDOI: 10.1534/genetics.112.138685
Y. Zhao et al. 2 SI
>Hnf4a A C G T 1: -‐0.46 0.59 -‐0.78 0.66 2: -‐0.88 1.62 -‐1.57 0.82 3: -‐0.32 4.21 -‐3.19 -‐0.71 4: 0.42 4.90 -‐2.01 -‐3.31 5: 0.43 -‐1.17 0.89 -‐0.15 6: -‐0.56 -‐0.85 0.23 1.19 7: -‐0.84 0.51 -‐0.04 0.36 8: -‐0.21 -‐0.02 0.23 -‐0.01
Figure S1 Energy PWM for Hnf4a from BEEML-‐PBM analysis

Y. Zhao et al. 3 SI
>Hnf4a-di4.5 1: -0.30 0.37 -0.55 0.48 2: -0.94 1.19 -1.23 0.98 3: 0.73 2.37 -2.72 -0.39 4: 0.59 2.08 -1.15 -1.53 5: -0.03 0.27 0.33 -0.58 6: 0.47 -1.64 0.84 0.33 7: -1.57 1.33 -0.64 0.87 8: -0.29 -0.02 0.25 0.06 4,5: -0.14 0.30 0.35 -0.51 -0.91 0.34 -0.40 0.97 0.84 0.66 -0.68 -0.81 0.21 -1.29 0.72 0.36 Figure S2 Energy model for Hnf4a including di-‐nucleotide interactions between positions 4 and 5.

Y. Zhao et al. 4 SI
>Hnf4a-primary Seed k-mer: GGGGTCAA Enrichment Score: 0.494711 1: -0.71 0.88 -2.53 2.36 2: -1.66 2.44 -3.46 2.68 3: 1.25 2.78 -4.40 0.37 4: 1.67 3.52 -3.64 -1.55 5: 1.54 2.41 0.06 -4.01 6: 2.25 -3.94 1.62 0.07 7: -2.89 -0.61 0.63 2.87 8: -1.60 0.33 0.58 0.68 >Hnf4a-secondary Seed k-mer: AAAGTCCA Enrichment Score: 0.496885 1: -2.55 1.67 0.59 0.29 2: -2.12 1.62 -0.61 1.11 3: -3.57 2.32 -0.44 1.69 4: 1.27 1.86 -4.60 0.93 5: 1.41 2.16 0.42 -3.98 6: 0.51 -3.55 1.97 1.06 7: 2.01 -3.98 1.35 0.62 8: -3.15 2.49 -0.93 1.59 Figure S3 Primary and secondary PWMs from UniProbe database.