improvement of hard cider production
TRANSCRIPT

Project Number: MQP SJK-AANT
Improvement of Hard Cider Production
A Major Qualifying Project Submitted to the Faculty of
Worcester Polytechnic Institute In partial fulfillment of the requirements for the
Chemical Engineering Bachelor of Science Degree
Sponsored by: Ricker Hill Orchards
3 Ricker Hill Rd Turner, ME 04282
Report Prepared by:
Joseph Collins Daniel Gonzalez Paul Johnston
Lina Tran
Advised By: Professor Stephen J. Kmiotek Professor Clarence R. Wobbe
This report represents the work of WPI undergraduate students submitted to the faculty as evidence of completion of a degree requirement. WPI routinely publishes these reports on its website without editorial or peer review. For more information about the projects program at WPI, please see http://www.wpi.edu/academics/ugradstudies/project-learning.html
Abstract
The goal of our project was to enhance the quality and efficiency of Ricker Hill’s hard cider
production. This was accomplished by identifying the species of bacterial infections, developing
cider and juice flavor compounds, determining yeast assimilable nitrogen (YAN) levels in juice
samples, and optimizing Ricker Hill’s cross-flow filter. As a result of our work, Acetobacter was
identified as the primary infecting bacteria. We also concluded through YAN testing that all
samples were nutrient deficient and produced sulfur byproducts during fermentation. The
presence of sulfur compounds was confirmed in the GC-MS analysis. Finally, we found the
optimal pressure and flowrate for Ricker Hill’s crossflow filter.

Acknowledgements:
Our team would like to thank the following individuals for their help and support throughout
the completion of our Major Qualifying Project:
Professor Stephen J. Kmiotek – Thank you for your continuous guidance, patience and
understanding. Our project experience would not be the same without you as a mentor.
Professor C. Richard Wobbe – Thank you for sharing your expertise and lab space. Your
guidance really challenged us to produce quality results for our project.
Professor William M. Clark – Thank you for providing us lab space and equipment to
complete our experiments.
Justin Lagassey – Thank you for allowing us the opportunity to work on this project. We
appreciate everything we have learned through this project.
Cadyn Wilson – Thank you for always keeping Justin organized and maintaining our
communication with Ricker Hill.
Alex R. Maag – Thank you for your patience and making yourself available to help us
obtain experimental results.
Edward A. Partlow – Thank you for teaching us the lab techniques necessary for our
project.

Table of Contents
Abstract ........................................................................................................................................... 2
Acknowledgements: ....................................................................................................................... 3
Table of Contents ............................................................................................................................ 4
Introduction .................................................................................................................................... 1
I. Ricker Hills’ Brewery Operation ........................................................................................... 1
II. Purpose ................................................................................................................................ 2
III. Objectives ......................................................................................................................... 2
Bacterial Infection ........................................................................................................................... 3
I. Background .......................................................................................................................... 3
i. Acetobacter Overview ...................................................................................................... 3
ii. Polymerase Chain Reaction (PCR) and DNA Sequencing ................................................. 5
iii. NCBI’s BLAST Search ..................................................................................................... 5
II. Methodology ........................................................................................................................ 6
III. Results and Discussion ..................................................................................................... 9
i. Isolation of Bacterial Samples .......................................................................................... 9
ii. PCR and Gel Electrophoresis .......................................................................................... 10
iii. DNA Sequencing ......................................................................................................... 12
IV. Conclusion and Recommendations ................................................................................ 14
Cider and Juice Flavor Compounds ............................................................................................... 16
I. Background ........................................................................................................................ 16
i. Gas Chromatography ..................................................................................................... 16
ii. Mass Spectrometry ........................................................................................................ 17
iii. Flavor Profiles of Apples ............................................................................................. 19
II. Methodology ...................................................................................................................... 21
III. Results and Discussion ................................................................................................... 22
i. Internal Standard Calibration ......................................................................................... 22
ii. Comparisons between Maniac Gold Batches ................................................................ 23
iii. Analysis of Maniac Mac Hard Cider and Juice ............................................................ 25
iv. Comparisons between Cranberry- Golden Delicious Juice and Cranberry-Mainiac
Gold 28
v. Qualitative Sensory Analysis .......................................................................................... 29
IV. Conclusion and Recommendations ................................................................................ 30
Yeast Assimilable Nitrogen ........................................................................................................... 32
I. Background ........................................................................................................................ 32
i. Yeast Assimilable Nitrogen Testing (YAN) Introduction ................................................. 32
ii. UV Spectroscopy ............................................................................................................ 33
iii. YAN Test Analysis ........................................................................................................ 34

iv. Apple Variety .............................................................................................................. 35
II. Methodology ...................................................................................................................... 36
III. Results and Discussion ................................................................................................... 38
IV. Conclusion and Recommendations ................................................................................ 41
i. YAN Testing at Ricker Hill ............................................................................................... 42
ii. Apple Variety Study ........................................................................................................ 42
iii. Financial Analysis ........................................................................................................ 42
Crossflow Filtration ....................................................................................................................... 45
I. Background ........................................................................................................................ 45
II. Methodology ...................................................................................................................... 48
i. Pressure Drop versus Flow Analysis ............................................................................... 48
ii. ASPEN simulation ........................................................................................................... 48
III. Results & Discussion ....................................................................................................... 49
i. Pressure Drop versus Flux Analysis ................................................................................ 49
ii. ASPEN Evaluation ........................................................................................................... 50
IV. Conclusion and Recommendations ................................................................................ 50
Overall Conclusion ........................................................................................................................ 51
Works Cited ................................................................................................................................... 52
Appendix ....................................................................................................................................... 56

A. Acid Washed Glass Beads .................................................................................................. 56
B. PCR Protocol....................................................................................................................... 57
C. Gel Electrophoresis ............................................................................................................ 57
D. Full Sequencing Results: ................................................................................................. 58
E. Cider and Juice Flavor Compounds Procedure: ................................................................. 64
F. Mass Spectrometer Data Recorded for Mainiac Gold Batches 25, 26, and 27 ................. 64
G. Mainiac Mac Changes of the Flavor Profile ................................................................... 66
H. Cranberry-Golden Delicious juice and Cranberry-Mainiac Gold .................................... 69
I. Ammonia Nitrogen (AN) Test Procedure ........................................................................... 72
J. Primary Amino Acid Nitrogen (PAAN) Test Procedure: ..................................................... 74
K. YAN Value Calculations ...................................................................................................... 76
L. Pressure Drop versus Flux Analysis .................................................................................... 77
M. Aspen Crossflow Filter Model Procedure ...................................................................... 79
N. Aspen Crossflow Input Files ........................................................................................... 80

Introduction
Ricker Hill Orchards, located in Turner, Maine has been growing a variety of apples on their
1,000 acre farm since 1803. Included on their farm are a variety of other fruits, such as pears,
cranberries, and pumpkins. Ricker Hill is best known for their McIntosh apples, which they sell
up and down the east coast. In August 2014 Ricker Hill started their hard cider brewery with the
help of Mr. Justin Lagassey. The entire process takes place in their new brewing facility located
on the farm. Their flagship product is Mainiac Gold, which is made primarily from Golden
Delicious apples. This product is 5% alcohol by volume and is packaged in an aluminum can. It
can be found in stores throughout Maine and will be available in various stores in New England.
I. Ricker Hills’ Brewery Operation
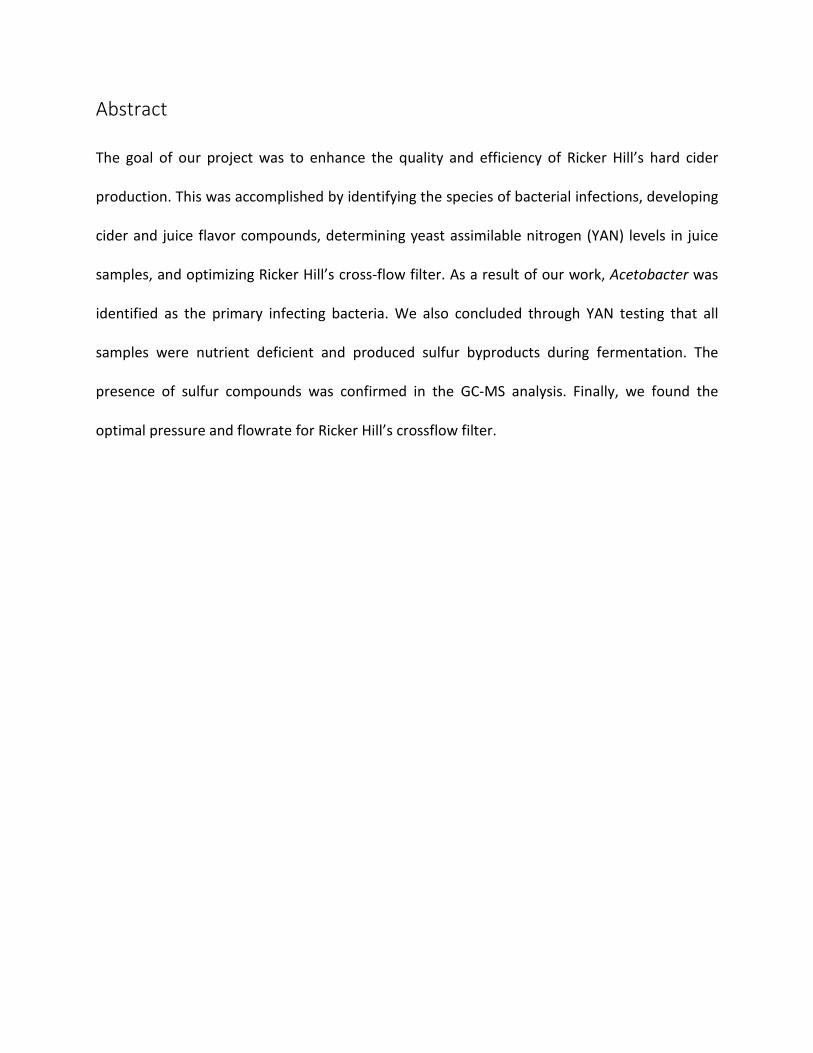
Fresh cider for fermentation is obtained from a nearby juice press. The cider is first filtered
using a crossflow filter, shown in Figure 1, and then pumped into fermentation tanks. Ricker Hill
has 13 tanks in total on its brewery production floor, including four 3,370 gallon tanks. Also on
the production floor is a small titration lab used to test pH levels in the cider before
Figure 1: Ricker Hill's Crossflow filter
1 | P a g e

fermentation. Once fermentation is completed, the finished product is pumped to a canning
line.
II. Purpose
The purpose of this project is to improve the production and quality of hard cider at Ricker
Hill. Ricker Hill is trying to mass produce a consistent and high quality cider throughout the
northeast. In order to compete in the hard cider business, they must also have an efficient
process. However, as a new brewery they are faced with several problems, such as Acetobacter
infections, flavor quality and consistency, nutrient deficient fermentation, and crossflow
filtration efficiency.
III. Objectives
Our objectives are the following:
1. Determine what species are infecting the cider during production and evaluate the
cost and feasibility of this process.
2. Develop a complete apple cider flavor profile by determining the volatile compounds
that exist in the apples.
3. Establish a yeast assimilable nitrogen (YAN) procedure for Ricker Hill Orchards and
determine the expenses for this procedure.
4. Optimize the cross-flow filter to ensure its longevity.
2 | P a g e

Bacterial Infection
I. Background
i. Acetobacter Overview
During production of Ricker Hill’s hard cider, they experienced frequent problems with
spoilage due to bacterial infections. The most common spoilage bacterium in fermented
beverages is Acetobacter. Acetobacter, a gram negative bacterium, produces acetic acid from
ethanol. These bacteria are not toxic, and have a long history of being used in the fermentation
industry, mostly in the production of vinegars.1 Acetobacter growth during hard cider
production is unfavorable, as the bacteria consumes ethanol and produces acetic acid. This
alters the alcohol content, as well as the taste of the hard cider. Currently, Ricker Hill does not
have a procedure to limit Acetobacter infections during production of its hard cider. Developing
an anti-bacterial procedure would allow Ricker Hill to subdue infections, which would improve
the quality of hard cider. In addition, having this procedure would reduce the risk of having to
dump a spoiled batch, which is a cost that can hurt Ricker Hill’s business.
The majority of studies done on Acetobacter infections have been in the beer
production industry. Beer is considered a microbial resistant beverage, as its microbiological
stability allows it to be resistant to spoiling. This resistance is mainly due to hops, which has
antimicrobial behavior. When infections do occur, brewers must either dump their batch or
filter out the bacteria. Having to dump or filter a batch is wasteful and inefficient for brewers
during production. Because of this, there has been a lot of attention in the brewing industry
historically on aerobic gram-negative bacteria such as Acetobacter. Since aerobic bacteria
1 (Acetobacter aceti Final Risk Assessment)
3 | P a g e
require oxygen to survive, processes have been designed that limit exposure to the
atmosphere. In modern breweries, aerobic bacterial infections are no longer an issue. These
types of infections are much more prevalent in small scale operations, which are usually less
advanced than large scale operations.2 Ricker Hill is a small scale operation, and does not have
the resources to invest in expensive equipment that limits oxygen exposure. Along with hard
cider production, Ricker Hill is interested in producing apple cider vinegars. The same bacteria,
Acetobacter, that is seen as an infection during hard cider production is the bacteria
responsible for producing acetic acid, the main ingredient of vinegar. However, vinegar
production is slow, making it not an economically feasible option.
The bacteria involved during hard cider and vinegar production are crucial to the
efficiency of each process. Regulating the activity of these bacteria is an efficient and cost-
effective method to improve hard cider and vinegar production. To devise a plan of bacterial
control, the first step is to identify the species of bacteria involved. For hundreds of years,
brewers have identified bacterial infections with a simple smell test. Although the bacterial
infection is likely Acetobacter, brewers cannot be certain because there are several other
bacteria that produce acetic acid, such as Gluconacetobacter and Gluconobacter.
A common practice utilized by biologists to identify the species of an unknown
bacterium is to amplify, sequence, and compare the 16S ribosomal DNA (rDNA). Bacterial
ribosomal genes are essential for survival and are therefore highly conserved. This genetic
2 (Sakamoto and Konings)
4 | P a g e

material is not as sensitive to environmental factors compared to morphology and metabolic
signatures, which help ensure success with bacterial taxonomy.3
ii. Polymerase Chain Reaction (PCR) and DNA Sequencing
Polymerase chain reaction (PCR) is the current industry standard when amplifying DNA. PCR
uses a thermal cycling process to produce thousands of a certain DNA sequence. For DNA
sequencing, several new, cost-effective methods have arisen such as Single-Molecule Real-Time
Sequencing, Ion Semiconductor, and Sequencing by Ligation4. However, for small projects, the
Sanger method of chain termination, which was developed in 1977, is still widely used. For PCR
and DNA sequencing, synthetic primers are used to indicate a particular region of DNA and are
typically around 20 nucleotides long. Designing primers for an unknown species can be difficult.
For both PCR and DNA sequencing, universal primers designed for the 16S rDNA gene are
frequently used because this gene is so highly conserved between bacterial genera.
iii. NCBI’s BLAST Search
Once the DNA sequence has been determined, comparison to known DNA sequences from
databases can determine the species. The National Center for Biotechnology Information (NCBI)
website has an extensive DNA sequence database. NCBI’s nucleotide Basic Local Alignment
Search Tool (BLAST) compares a sample DNA sequence to its database. Results from the BLAST
search give scores of how closely the sample DNA sequence matches DNA sequences from
specific bacterial strains in the database. Three programs with different speeds and sensitivities
are available for nucleotide versus nucleotide sequence comparison: megablast3, discontinuous
3 (Graciela, Eugenia and Alejandro) 4 (Hanlee and Shendure)
5 | P a g e

megablast5, and blastn6. These programs are based on algorithms designed for a certain task.
The megablast program works best for identifying the input query and searching with large
genomic query. Discontinuous megablast is best suited for finding related sequences from
other organisms. Blastn works better for shorter sequences and cross-species searches. Each
program ranks sequences from a database based on how well the input sequences match. The
database sequences are given a score for how well they match, and the sequence with the
highest score identifies the sample of interest.
II. Methodology
Two sources from Ricker Hill were sampled for their bacterial content. One source was
taken from a hard cider batch that had recently developed a bacterial infection. The other
source was taken from a vinegar batch that been sitting for several months. An inoculating loop
was used to streak these sources onto an agar medium. The composition of the agar medium
included 30 g glucose, 5 g yeast extract, 3 g peptone, 20 g peptone, 20 g agar, and 1000 ml of
distilled water. The incubation temperature was room temperature, or approximately 20˚C.
After about three days, significant bacterial growth was found. Five different colonies,
shown in Table 1, were isolated and placed on their own agar plate. Since colonies begin from
one bacterial cell, each colony represented one bacterial species.
5 (Zhang, Schwartz and Wagner) 6 (Altschul, Madden and Schaffer)
6 | P a g e

Table 1: Colonies of Bacteria Isolated
Following another three days for the five isolates to grow, the next step was to expose
the DNA contained in the bacterial cells. This was done using 106 μm glass beads to break open
the cells. Before their use, the glass beads had to be washed according to a procedure located
in Appendix A. For each isolate, 10 ml of deionized water, approximately 10 ml of glass beads,
and a colony from each isolate agar plate were put into an Eppendorf tube. The Eppendorf
tubes were then vortexed for five minutes, ensuring DNA exposure.
In order to be sequenced, the exposed DNA had to be amplified. This was done using
PCR and universal primers. Two primers were used with each PCR run. Primers 27F, the forward
primer, and 1492R, the reverse primer, were used together, while primers 8F and 1391R were
used in junction78. Table 2 shows the different primers and their base sequence.
Primer Base Sequence (5’-3’)
8F AGAGTTTGATCCTGGCTCAG
27F AGAGTTTGATCMTGGCTCAG
1391R GACGGGCGGTGTGTRCA
1492R ACCTTGTTACGACTT
Table 2: Primer Sequences
7 (Stackebrandt and Goodfellow) 8 (Turner, Pryer and Miao)
Colony Source Vin-1A Vinegar Blb-1C Infected Hard Cider Blb-1D Infected Hard Cider Blb-1E Infected Hard Cider Blb-1F Infected Hard Cider
7 | P a g e
Two universal primers, an isolate DNA sample, and PCR Master Mix were put into PCR specific
Eppendorf tubes. These tubes were designed with thin walls to efficiently allow the transfer of
heat during the PCR machine’s thermal cycling. With all these three inputs, the tubes were
placed into the PCR machine. The specific procedure for conducting PCR can be found in
Appendix B.
Product from the PCR was confirmed using gel electrophoresis. A sample from each PCR
tube was placed on a gel. Gel electrophoresis uses a current to pull DNA sequences down a gel.
Because DNA is negatively charged, the samples were placed on the negative terminal of the
gel. Once the current was turned on, the DNA sequences migrated down the gel towards the
positive terminal. After approximately 30-45 minutes, the gel was taken to be analyzed under a
UV-light. The procedure for gel electrophoresis can be found in Appendix C.
With a confirmed PCR result, the remaining PCR product and four universal primers
were sent to be sequenced at Eton Biosciences. Eton Biosciences was consulted because their
DNA sequencing services were time-effective and relatively cheap. The resulting DNA
sequences from Eton Biosciences were put into NCBI’s BLAST search, which compared each
sequence to a library of sequenced DNA. The megablast setting was used because the isolates
were unknown and this setting has a large genomic query. The best matched sequences were
given the highest score, and the species was determined.
8 | P a g e

III. Results and Discussion
i. Isolation of Bacterial Samples
Five distinctly different colonies were identified from the two cider sources; four colonies
were taken from the infected hard cider sample and one colony was taken from the vinegar
sample. These results and their characteristics are also shown in Table 3.
Name Source Characteristics
Vin-1A Vinegar Round, shiny, brown
Blb-1C Infected Cider Opaque, yellow center, round, smooth
Blb-1D Infected Cider Shiny, brown, small, round
Blb-1E Infected Cider Small, round, white, dull
Blb-1F Infected Cider Round, white surface, rough
Table 3: Colony Descriptions
Each colony was isolated onto its own agar plate. Figure 2 shows an example of one of these
plates.
Figure 2: Blb-1F Agar Plate
9 | P a g e

ii. PCR and Gel Electrophoresis
The DNA of the five isolates was amplified according to the PCR protocol. The PCR product was
The orange bars represent ethidium bromide that was bonded to a DNA fragment.
Figure 3: Gel under UV Light
10 | P a g e

Ethidium bromide luminesces when exposed to UV light. The DNA in the gel migrated in each
lane upward. The bottom lanes represented samples that had been amplified with the 27F and
1492R primers and the top lanes represented samples with the 8F and 1391R primers. Tables 4
and 5 show the lane designations for each isolate, with lane 1 representing the lane furthest to
the left.
Lane Isolate PCR Product Visible
1 Ladder N/A
2 Vin-1A Yes
3 Blb-1C No
4 Blb-1D No
5 Blb-1E Yes
6 Blb-1F Yes
Table 4: PCR Products from 27F and 1492R Primers
Lane Isolate PCR Product Visible
1 Ladder N/A
2 Vin-1A Yes
3 Blb-1C No
4 Blb-1D Yes
5 Blb-1E Yes
6 Blb-1F No
Table 5: PCR Products from 8F and 1391R Primers
11 | P a g e

iii. DNA Sequencing
The ten PCR products along with the four primers were sent to Eton Biosciences for sequencing.
The full sequencing results can be found in Appendix D. Tables 6, 7, 8, and 9 summarize the
results of each primer. The results for each primer were put into NCBI’s BLAST search. The top
result for each isolate is included in the corresponding tables.
Isolate BP Length BLAST Species Top Result
Vin-1A 1010 Acetobacter pasteurianus
Blb-1C 253 None
Blb-1D 535 None
Blb-1E 658 None
Blb-1F 441 None
Table 6: 27F Primer
Isolate BP Length BLAST Species Top Result
Vin-1A 1286 Acetobacter pasteurianus
Blb-1C 602 None
Blb-1D 567 None
Blb-1E 177 None
Blb-1F 218 None
Table 7: 8F Primer
12 | P a g e

Isolate BP Length BLAST Species Top Result
Vin-1A 237 None
Blb-1C 548 None
Blb-1D 753 Acetobacter malorum,
Acetobacter cerevisiae, &
Acetobacter orleanensis
Blb-1E 662 None
Blb-1F 690 None
Table 8: 1492R Primer
Isolate BP Length BLAST Species Top Result
Vin-1A 1071 Acetobacter pasteurianus
Blb-1C 354 None
Blb-1D 1260 Acetobacter cerevisiae
Blb-1E 1210 Acetobacter pasteurianus
Blb-1F 326 None
Table 9: 1391R Primer
Results of the BLAST search show that 1391R was the most effective primer used during
sequencing. Sequencing with 1391R produced three results that had significant matches in the
BLAST search, while the other three primers only produced one result each. Therefore, it can be
assumed that 1391R was the primer best designed out of the four for species identification
during this project.
Three isolates from the 1391R primer were identified in the Acetobacter genus. This was
predicted, as Acetobacter infections are common in fermentations. Isolates Vin-1A and Blb-1E
were both Acetobacter pasteurianus, while Blb-1D was Acetobacter cerevisiae. Sequencing of
isolates Blb-1C and Blb-1F did not produce significant matches with any of the four primers. A
13 | P a g e
different set of primers or additional tests are needed to identify what the species of these
isolates are. DNA sequences of the Acetobacter genus do not deviate significantly between
species, so it is possible that the primers were ineffective for isolates Blb-1C and Blb-1F because
they are of a different genus.
IV. Conclusion and Recommendations
Identifying the bacterial species involved during Ricker Hill’s hard cider and vinegar
production was a critical first step in understanding the bacterial environment. Future tests,
however, could still be conducted to produce more confident results, as two of the five isolates
were not identified. If possible, primers specific to the Acetobacter genus are recommended.
Several biotechnology companies such as Eton Biosciences offer a custom primer service where
a specific DNA sequence can be made. A simple test to identify acetic acid producing bacteria is
the addition of CaCO3 to the agar mixture used to grow the bacterial isolates.9 Acetic acid
production could be detected by the dissolution of CaCO3, which would produce a clear ring
around the bacterial colony. In Ricker Hill’s small laboratory, this test could be a quick and easy
way to identify acetic acid bacteria such as Acetobacter in a batch of hard cider.
The next step in understanding Ricker Hill’s bacterial environment is to categorize the
activity of the bacteria. To accomplish this, a proposed project is to track the concentrations of
ethanol and acetic acid over the length of fermentation. Separate fermentations with a single
bacterial isolate introduced could be conducted to determine each isolate’s activity. However,
taking several samples of the hard cider during fermentation could lead to contamination
9 (Asai, Iizuka and Komagata)
14 | P a g e

because of the frequent air exposure. It is recommended that an apparatus be made with a
hole just big enough for a pipette. The hole could have a rubber tube through it, both allowing
the pipette to reach the cider and to be pinned off when not in use. Specifically how to measure
the concentration of ethanol and acetic acid is unknown, as extraction methods in conjunction
with GC-MS were largely unreliable. If these technical restrictions are able to be resolved, the
concentration of ethanol and acetic acid during fermentation can be modeled. Modeling these
concentrations over time can be directly correlated to the activity of bacteria during
production, which is useful in understanding the bacterial environment.
Ricker Hill hopes to decrease bacterial growth during hard cider production, while
increasing bacterial activity in vinegar production. Controlling bacterial growth and processes
requires an understanding of the bacteria involved. This project took the first step in
understanding the bacterial environment by identifying the species of bacteria in Ricker Hill’s
hard cider and vinegar production. Out of the five bacterial isolates that were found, three
were able to be identified. As predicted, all three isolates belonged to the Acetobacter genus.
With this information, future projects to model the concentrations of ethanol and acetic acid
during fermentation are recommended. With a clear understanding on the bacterial activity,
Ricker Hill can begin to manipulate associated variables during production to have desirable
fermentations.
15 | P a g e
Cider and Juice Flavor Compounds
I. Background
i. Gas Chromatography
Gas Chromatography (GC) is a widely accepted analytical technique used for separation
of volatile compounds over time. The GC column is a hollow tube that is layered with a coating
of a stationary phase. The stationary phase is a solid that has chemical properties that affect
the mass transfer of sample analytes throughout the column. The column is heated by an oven
that separates the less volatile compounds as the temperature is increased to their boiling
points. The carrier gas is used to transport the injected sample throughout the column. A
common choice for a carrier gas is helium because it is inert with the injected sample and
stationary phase.
Chromatography separates components of a sample with physical or physico-chemical
methods. The compounds to be separated are distributed between two non-miscible phases;
one of the phases is usually stationary and the other phase travels over the stationary phase in
a nearly complete divided state. The moving phase transports the components for separation.
The three requirements for a gas chromatographic process are as follows:
1. An adsorbent in the liquid phase
2. Substances which are adsorbed or dissolved in the adsorbent
3. A gas current to carry the substances over the adsorbent 10
All of the components that are separated by chromatography travel in the same
direction as the moving current. In addition, all components travel at the same speed. The
10 (Kitson)
16 | P a g e

number and duration of rest periods that the compounds take in the stationary phase differs
between the compounds. Since each type of molecule has its own unique quality of adsorption
through the gas column, the components will reach the detector at different times. A detector
is used at the end of the gas column that determines the component and the quantity of the
component in the sample by recording the retention time and order of emergence in the other
side of the column.
Separation of desired analytes is affected by a variety of factors in the GC. The choice of
the stationary phase is necessary to attain different retention times for the desired analytes.
The stationary phase chosen should be able to handle temperatures of the boiling points of the
less volatile analytes without ‘bleeding’, or degrading. Typically non-polar coatings for the
column are chosen because they are less prone to bleed than more polar coatings. Another
factor affecting compound separation is rate of temperature increase.
ii. Mass Spectrometry
Mass spectrometry is an analytical tool that is used to identify compounds from
molecular masses. A model of a mass spectrometry is show below in Figure 4. This tool
measures the mass-to-charge ratio,𝑚𝑚𝑧𝑧
, of gas phase ions and provides a measure of the quantity
of each ionic species.
17 | P a g e
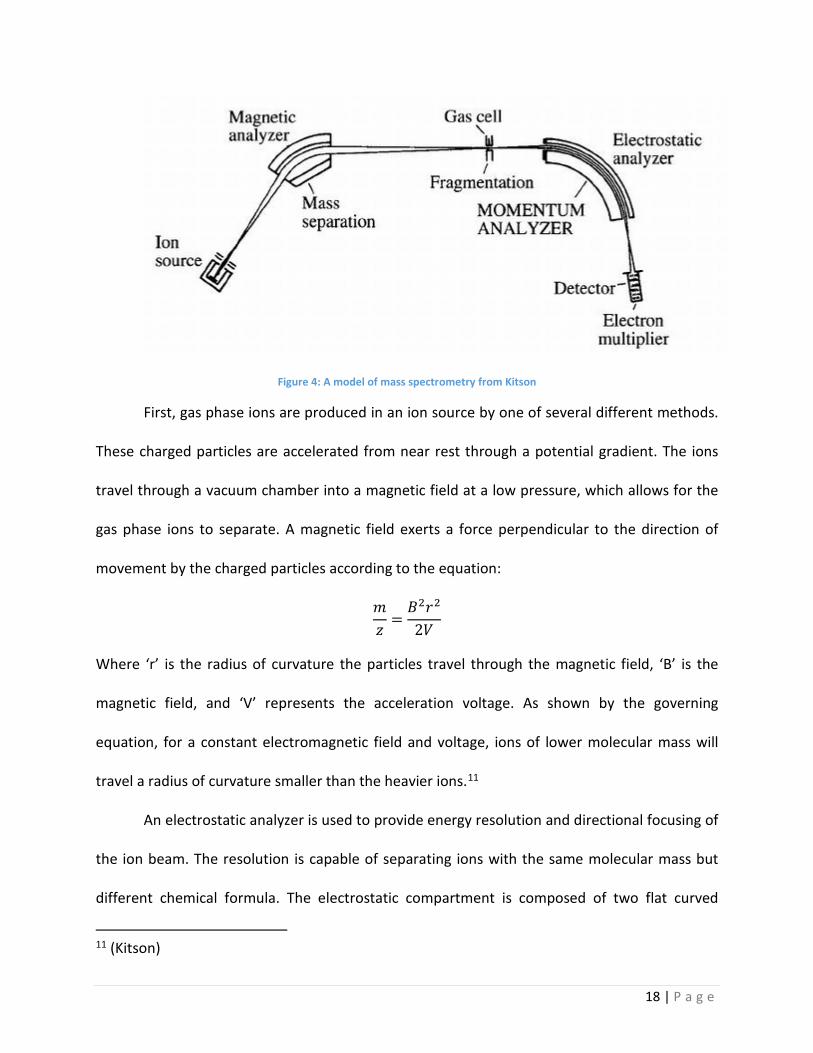
Figure 4: A model of mass spectrometry from Kitson
First, gas phase ions are produced in an ion source by one of several different methods.
These charged particles are accelerated from near rest through a potential gradient. The ions
travel through a vacuum chamber into a magnetic field at a low pressure, which allows for the
gas phase ions to separate. A magnetic field exerts a force perpendicular to the direction of
movement by the charged particles according to the equation:
𝑚𝑚𝑧𝑧
=𝐵𝐵2𝑟𝑟2
2𝑉𝑉
Where ‘r’ is the radius of curvature the particles travel through the magnetic field, ‘B’ is the
magnetic field, and ‘V’ represents the acceleration voltage. As shown by the governing
equation, for a constant electromagnetic field and voltage, ions of lower molecular mass will
travel a radius of curvature smaller than the heavier ions.11
An electrostatic analyzer is used to provide energy resolution and directional focusing of
the ion beam. The resolution is capable of separating ions with the same molecular mass but
different chemical formula. The electrostatic compartment is composed of two flat curved
11 (Kitson)
18 | P a g e

metal plates having opposite electrical potentials. The plates’ potential is adjusted so that ions
having translational energy will follow the curvature of the path.12
The ions are detected at the end of the path with use of an electron multiplier. Electrons
with sufficient kinetic energy will emit secondary electrons when they strike a metal surface. A
discrete electron multiplier has a series of dynodes that are connected by a resistor chain so
that the first dynode has a higher negative potential than the last. Each dynode after the first
has an increased voltage gradient to allow for continuous electron emission through the
following dynode. This increasing cascade of electrons will provide a sufficient signal to be
detected and the results are sent to a computer for processing.13
iii. Flavor Profiles of Apples
The flavor profiles that exist in apple juice to the finished hard cider are intricate. The
major volatile components of apple cider have been identified as alcohols, esters, fatty acids,
and carbonyls. The most aromatic active compounds have been identified alcohols, esters,
lactones, phenols, and short to medium chain fatty acids. It has been thought that two of the
most important contributing aromatic alcohols are phenethyl alcohol and 3-methyl butanol.14
Larger alcohols have been thought to contribute the sensory profile as well; however, these
have been known to exist in lower amounts and hold lower aroma intensities. These have a
honey rosy aroma and fruity nail polish-like odors, respectively. Known aromatic acids in cider
were acetic, butanoic, propanoic, hexanoic, octanoic, decanoic acid and 2-methyl-butanoic acid.
12 (Gross) 13 (Kitson) 14 (Wiley)
19 | P a g e

These have been known to produce rancid, cheesy, and sweat-like odors. On the basis of
aromatic intensity, esters have been known to be some of the most important contributors.
Esters such as ethyl 2-methyl propanoate, ethyl 2-methylbutanoate, ethyl butanoate, ethyl
octanoate, and ethyl decanoate contribute to fruity, sweet, apple, pineapple, and floral odors.
Several ketones, such as 3-hydroxy-4-phenyl-2-butanone, 1-octen-3-one, and 1-octen-3-one
have been thought to contribute a wide variety of aromas. Phenols have been thought to have
an interesting effect on aroma due to some of them having low sensory limits and high to
medium sensory intensities.15 Besides the production of ethanol during fermentation, other
flavor compounds are produced throughout fermentation.
Studies done on Fuji apples show that the sensory profiles change when Fuji apple juice was
compared with its fermented product. The wine and juice samples had the greatest difference
in the concentration of the organic acids, esters, and alcohols. Whereas the juice contained
shorter carbon chains of the above these components, the cider had longer carbon chains of
the organic components. A solid understanding of the volatile compounds in apple cider can
allow the cider maker to control the raw materials and fermentation conditions to produce a
finished product of a targeted specific flavor profile.16
For chemical analysis of the flavor compounds, gas chromatography coupled with mass
spectrometry (GC-MS) is typically used. The apple cider cannot be directly injected into the GC-
MS because of the large presence of water in the ciders. Water injections can cause a variety of
problems when injection without treatment. Back-flashes can occur from water injections
because of the large expansion of water when it is vaporized. In addition, damage to the
15 (Xu, Fan and Qian) 16 (Wang, Xu and Zhao)
20 | P a g e

stationary phase of GC can happen due to the polarity of water. This damage to the stationary
phase can alter the column’s selectivity and the retention times of these compounds. Thus, a
liquid-liquid extraction was chosen that would extract the flavor compounds from the apples
while greatly reducing the amount of water injected.17
II. Methodology
The Shimadzu GCMS-QP2010 SE with AOC-20i Auto Sampler was used for chemical analysis.
The proposed method was adapted from a previous wine analysis.18. The goal of this method
was to extract the flavor compounds from the juice and hard cider with dichloromethane. The
concentrations of these compounds were to be determined with the use of internal standard
solutions. The preparation of these internal solutions can be found in Appendix E. The phase of
interest was the dichloromethane phase on the bottom; this was extracted with a pipette and
placed into a syringe with a filter tip. The plunger, which was removed for the injection of the
dichloromethane, was forced down the syringe. The sample was pushed through the filter into
a sampling screw-top capsule and put into the GCMS for analysis. The full sample preparation
can also be seen in Appendix E with the input GC-MS parameters.
17 (Richardson) 18 (Ortega, Lopez and Chacho)
21 | P a g e

III. Results and Discussion
i. Internal Standard Calibration
The initial goal of determining the concentration of the flavor compounds of Ricker Hill’s
juice and hard cider with internal standards encountered setbacks. It was expected to observe
relatively constant values for the peak heights of the internal standards in the different
samples. Although all juice and wine samples were added with the same amount of internal
standard solution (.1 mL of 50µg/mL), the peak height observed for these chosen internal
standards did not represent any consistency. Thus, the concentration of the flavor compounds
could not be determined with confidence. There were different possible causes for this.
Thoroughly mixed internal standard solutions could have contributed. In addition, the accuracy
of the pipette when developing the internal standard solutions and placing the solution into the
juice and wine samples could have caused the difference in internal standard concentration.
However, calibration graphs of the internal standard solutions (without the liquid-liquid
extraction with dichloromethane) were developed, as shown in Figure 5.
22 | P a g e
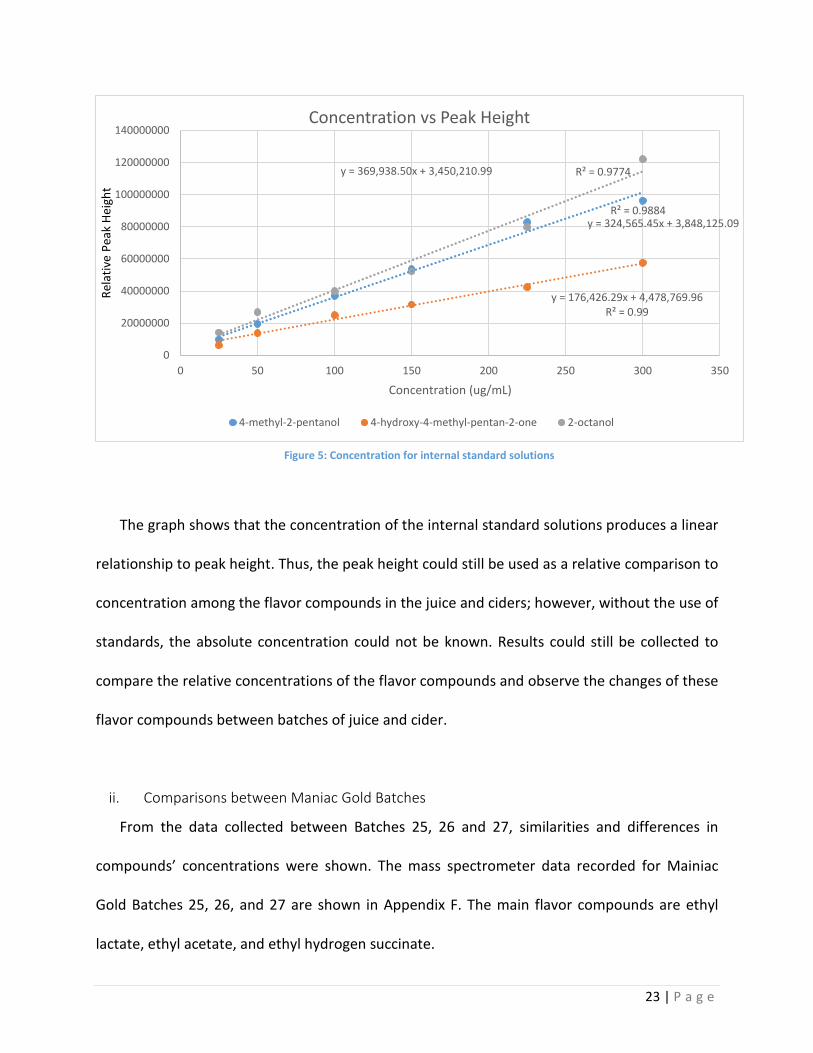
The graph shows that the concentration of the internal standard solutions produces a linear
relationship to peak height. Thus, the peak height could still be used as a relative comparison to
concentration among the flavor compounds in the juice and ciders; however, without the use of
standards, the absolute concentration could not be known. Results could still be collected to
compare the relative concentrations of the flavor compounds and observe the changes of these
flavor compounds between batches of juice and cider.
ii. Comparisons between Maniac Gold Batches
From the data collected between Batches 25, 26 and 27, similarities and differences in
compounds’ concentrations were shown. The mass spectrometer data recorded for Mainiac
Gold Batches 25, 26, and 27 are shown in Appendix F. The main flavor compounds are ethyl
lactate, ethyl acetate, and ethyl hydrogen succinate.
y = 324,565.45x + 3,848,125.09R² = 0.9884
y = 176,426.29x + 4,478,769.96R² = 0.99
y = 369,938.50x + 3,450,210.99 R² = 0.9774
0
20000000
40000000
60000000
80000000
100000000
120000000
140000000
0 50 100 150 200 250 300 350
Rela
tive
Peak
Hei
ght
Concentration (ug/mL)
Concentration vs Peak Height
4-methyl-2-pentanol 4-hydroxy-4-methyl-pentan-2-one 2-octanol
Figure 5: Concentration for internal standard solutions
23 | P a g e

Some of the large peaks and common medium high peaks shared for all the three
Mainiac Gold batches are shown below in Table 10.
Large Peaks Medium High Peaks
3-methyl-1-Butanol 2, 3 butandiol; 3-(methylthio)-
1-propanol
phenylethyl alcohol tetrahydro-2-methyl- thiopene
ethyl hydrogen succinate hexanoic acid
1, 3-octandiol tryptophol
4-hydroxy- benzeneethanol dibutyl phthalate
propanoic acid, 2-hydroxy-,
ethyl ester, (S)- (ethyl lactate)
7,9-Di-tert-butyl-1-
oxaspiro(4,5)deca-6,9-diene-
2,8-dione
formic acid, ester ethyl n-decanoic acid
Table 10: Large and medium high peaks shared by all 3 Mainiac Gold batches
One of the most interesting differences was observed in Batch 27, which had a strong
sulfur odor. The large peak shown by sulfuric acid was the most noticeable compound that was
present in Batch 27, but not in the other two. Butanedioic acid diethyl ester, better known as
succinic acid, 2-methylresorcinol diacetate, and hexadecanamide were only present in Batch 25,
and they existed in high quantities. In addition, Batch 25 had significantly higher
concentrations of tryptophol than the other two batches. N-nonadecanol-1 was found only in
Batch 26 and was present in high quantities. 9-Octadecenamide, (Z)- was not present in Batch
26, but was found in the other two in high quantities.
Because Mainiac Gold is made from Golden Delicious apples, a comparison of the
compounds found in the cider were compared to other studies done on Golden Delicious
apples. Straight chain esters, branched-chain esters, fewer alcohols and aldehydes were the
24 | P a g e

most important volatile components in Golden Delicious apples.19 Some of these compounds
were, but not limited to, 2-methylpropyl acetate, butyl acetate, 1-hexanal, 2-methylbutyl
acetate, butyl propanoate, butyl butanoate, hexyl acetate and 1-hexanol. Most of these
compounds were found in the Mainiac Gold batches, except 1-hexanol. In addition, malic acid
was one of the most important volatile organic acids, and it was found in medium amounts in
Batches 26 and 27, but was not detected in Batch 25. Furans, nitriles, phenols and benzene
rings were detected in some of the Mainiac Gold batches.20
iii. Analysis of Maniac Mac Hard Cider and Juice
Data was collected for the Mainiac Mac hard cider and juice, which are made
predominantly from McIntosh apples. The changes in the flavor profile are represented in
Appendix G.
Overall, the results were consistent of previous research because they show that
Mainiac Mac juice has more of the smaller volatile compounds, while the larger volatile
compounds were detected in the hard cider. It is most likely that the larger volatiles from the
cider came from the breakdown of even larger molecules during fermentation. The results also
show that the fermented product has very little overlap in volatile compounds as its juice, as
shown in the Table 11 below. The only detected compounds that had similar concentrations in
the juice and hard cider include: phenyl ethyl alcohol, nonadecanenitrile, abscorbic acid,
hexadecanal, n-tetraconsanol, and n-nonadecanol-1.
19 (Raffo) 20 (Raffo)
25 | P a g e

Common Compounds
Phenyl ethyl alcohol
Nonadecanenitrile
Abscorbic acid
Hexadecanal
Tetraconsonol
n-nonadecanol-1
Table 11: Compounds that overlap for juice and hard cider
Some of the results from the data presented some unexpected outcomes. Observing
similar concentration of phenyl ethyl alcohol was unusual because research done with Fuji
apples suggested that phenyl ethyl alcohol accumulates in large amounts as a result of the
yeast fermentation. Some compounds were found only in the juice but not detected in the hard
cider that were not expected such as acetic acid; 1-Butanol, 2-methyl-; 1-Butanol, 3-methyl.21
According to the research done by Wang, there should be high concentrations of both of these
compounds.
From previous studies on apple juice and cider, it was expected to detect some
compounds in the juice but not the hard cider. Some compounds that fit this expectation in the
Mainiac Mac juice and cider were 2- hexanal; cyclohexaneacetic acid; benzene, 1,3-bis(1,1-
dimethylethyl) and several more. Some compounds that were found in either Ricker Hill’s juice
or cider were unique when compared with other ciders and juices. The unique compounds that
had at least medium high peaks included 1,3-octanediol, 9-octadecenamide, (Z)-; ascorbic acid
2,6-dihexadecanoate; nonadecanenitrile; n-nonadecanol-1. Tables 12 and 13 below show both
21 (Wang, Xu and Zhao)
26 | P a g e

the compounds that were unique to Ricker Hill’s products as well the compounds that were
expected to be present in the cider and juice but were not detected.
Flavor Compounds Not Found in Juice Flavor Compounds Not Found in Cider
1-butanol, 2 methyl (isobutyl alcohol) acetic acid, butyl ester (n-butyl ester)
acetic acid acetic acid
cctanoic Acid heptanol
heptanol Hexyl acetate
hexyl acetate ethyl lactate
ethyl lactate hexanol
hexanol
2-hydroxypropanoic acid ethyl ester (ethyl
lactate)
2-hydroxypropanoic acid ethyl ester (ethyl
lactate) diethyl succinate
diethyl succinate
Table 12: Compounds that were expected to be found but were not found
27 | P a g e

Compounds Unique to Ricker Hill's McIntosh Products
2-hexen-1-ol * 2,3 Butanediol **
Benzene, 1, 3-bis (1,1-dimethylethyl)-* 1,3-Octanediol
1-dodecanol, 2-hexyl N-nonadecanol-1
Sulfurous acid, butyl decyl ester *
9-octadecenamide (oleamide) Hexadecanal
Glycerol 1-palmitate* Squalene*
n-Tetracosanol 1,5-Hexanediol
*Only found in Mainiac Mac Juice Blend ** Only found in Mainiac Mac Cider
Table 13: Compounds that were unique to Ricker Hill’s McIntosh products
iv. Comparisons between Cranberry- Golden Delicious Juice and Cranberry-Mainiac Gold
The data collected for the Cranberry-Golden Delicious juice and Cranberry-Mainiac Gold
are shown in Appendix H. Similar to the data collected from McIntosh apple juice blend and the
Mainiac Mac, there were larger volatiles present in the hard cider. From comparison of the
Mainiac- Cranberry juice and cider with the Mainiac Mac juice and cider, it was shown that the
overall changes in compounds were similar. The compounds that were found in the Cranberry
Mainiac Mac and not the Mainiac Gold can be attributed to the addition of cranberries.
28 | P a g e

v. Qualitative Sensory Analysis
The samples that were analyzed in the GC-MS were tasted to develop a qualitative
analysis. Table 14 below displays the sensory and tasting characteristics of the analyzed juices
and hard ciders.
Flavor Profiles of Samples Sensory Taste
McIntosh Blend Juice sweet, apple-like slight tartness, medium sweetness, strong apple flavor
Mainiac Gold Batch 22 sulfur-like, no fruit smell
dry, semi- harsh fermentation 'bite'
Mainiac Gold Batch 25 less sulfur smell, hint of sweetness
dry, no apple flavor, Keystone finish
Mainiac Gold Batch 26 rotten pineapple, slight sulfur
harsh sourness, not sweet
Mainiac Gold Batch 27 medium strong sulfur aroma
sulfur taste, not much fruity taste, dry
Mainiac Maple sweet maple sweet maple, pleasing soft fermented finish
Golden Delicious Blend with Cranberry
sweet flower medium sweetness, 2/3 apple, 1/3 cranberry taste
Mainiac Gold with Cranberry
mild apple aroma, hint of sulfur
mild cheese-like flavor, little sweet
Table 14: Qualitative sensory and taste profile of ciders and juice
Unfortunately, the overall harshness of the aroma and taste of the hard ciders
juxtaposed with the favorable analysis of the unfermented juices could not be ignored. This is
largely due to compounds that were present in the juice that existed below the sensory
threshold whereas the cider had large noticeable quantities of unfavorable compounds. From
comparisons between the qualitative analysis and the chemical analysis, a range of compounds
were detected in the hard ciders that are known to attribute less desirable aromas.
Batch 27 of Mainiac Gold and Cranberry-Mainiac Gold contained relatively large amounts of
sulfuric acid, which could have contributed to harsh aromas and sour tastes. In addition,
29 | P a g e

sulfurous acid derivatives were found in Batches 25 and 27. Another undesirable aroma found
was likely acetoin, which was found in all the Mainiac Gold ciders, including the Cranberry-
Mainiac Gold cider and juice. Acetoin is a compound that has a rancid smell and can largely be
attributed to a large presence of yeast or fast fermentations at high temperatures 22(Hui, 2012).
IV. Conclusion and Recommendations
The results GC-MS detected a variety of alcohols, esters, acids, furans, phenols, amines and
sulfuric compounds in the juices and ciders. Comparisons between Mainiac Gold Batches 25 to
27 show that most detected compounds that were found were similar. However, some of the
similar compounds were found in varying concentrations. Some compounds were not detected
in all batches, and some of these compounds were even detected in high concentrations.
Comparisons between the Mainiac Mac juice blend and hard cider show that there is little
overlap in flavor compounds. The detected compounds juice blend had a much smaller profile
than the hard cider. The cider profile suggests that most of larger esters, alcohols and organic
acids as well as other types of compounds are produced after fermentation.
The dichloromethane extraction could be used as a tool to compare the existent
compounds between batches. However, the setbacks to this method were exposed, especially
for accurately determining the concentration of flavor compounds. The most problematic
aspect of using dichloromethane as a solvent to extract all flavor compounds is the difference in
polarity of the flavor molecules. The efficacy of the method is greatly decreased for smaller
compounds because they are capable of migrating to the water phase during the extraction.
22 (Hui and Ozgul)
30 | P a g e

Found in many of the batches of juices and cider were alkanes and alkenes, both of which
seemed highly unlikely to exist in the analyzed liquids. In addition, the different functional
groups of the organic molecules affect the ability for the compounds to be extracted. Thus, it
would be more likely to trust the results obtained for larger non-polar molecules and determine
the concentration of those molecules. Another problem with the method was its ability to
extract flavor compounds from all cider and juice samples. The Maple Mainiac juice and hard
ciders were run through the GC-MS, but the results detected less than 15 compounds for both
samples. It is largely unlikely that so many flavor compounds were nonexistent in the cider
because the main difference is the addition of the maple.
For future hard cider analysis, it would be beneficial to pursue other extraction
methods. In order to analyze the shorter chain volatile compounds accurately, headspace solid-
phase microextractions (HS-SPME) could be used. It is a widely known technique that has been
used for analysis of wines and some ciders. Unfortunately, for a long period of time during the
academic year, the HS-SPME equipment had been under technical maintenance. In addition,
high-performance liquid chromatography (HPLC) is also a standard technique for cider analysis.
This method would be helpful to find larger non-volatile compounds that also contribute to the
overall flavor profile of the cider. We were unable to use this equipment because we were not
granted access to the machine.
31 | P a g e

Yeast Assimilable Nitrogen
I. Background
i. Yeast Assimilable Nitrogen Testing (YAN) Introduction
Several factors and conditions are involved in cider fermentation including temperature,
brix, and nutrients. Since there are many components involved, each fermentation batch has its
own unique challenges. To ease these challenges, it is crucial for cider makers to evaluate and
understand the cider before fermentation begins.
One element that is crucial for fermentation is nitrogen. Nitrogen is the primary growth-
limiting nutrient for yeast cell growth23. If there is not enough nitrogen for the yeast, a by-
product, hydrogen sulfide (H2S), will be produced. As a result of this nutrient deficiency, the H2S
will leave a sulfur odor in the cider24. Lack of nitrogen can also result in a sluggish and
unhealthy fermentation25. To avoid the lack of nitrogen, additional nutrients are added to the
cider to increase nitrogen levels. Yeast assimilable nitrogen, also known as YAN, is a test to
evaluate the nutrients that the cider needs to obtain a nourishing fermentation. The
concentrations of organic nitrogen known as primary amino nitrogen and an inorganic form
known as ammonia are obtained through chemical analysis using a UV spectrometer to
determine the total YAN. The total YAN number yields the amount of available nitrogen in juice
fermentation. Calculating YAN is essential to cider making because it will regulate nutrient
adjustments for the cider.
23 (Shantanu Kelkar) 24 (Winemakers) 25 (Alberti, Vieria and Drilleau)
32 | P a g e

ii. UV Spectroscopy
The Ammonia Nitrogen and Primary Amino Acid nitrogen enzymatic tests can be carried
out to determine YAN. The Ammonia Nitrogen test will produce an Ammonia Nitrogen (AN)
number and the Primary Amino Acid test will produce a Primary Amino Acid Nitrogen (PAAN)
number. For the Ammonia Nitrogen test, nicotinamide adenosine dinucleotide (NADH) and
glutamate dehydrogenase (GIDH) are added to the cider. A UV spectrometer at 340 nm is used
to detect the amount of NADH consumed since it is directly related to the ammonia that is
present, giving the AN level26.
For the Primary Amino Acid test, orthophthalialdehyde (OPA) and N-acetyl-L-cysteine
(NAC), in the presence of an alkaline buffer, bind with primary amino acids. The reaction forms
“coloured complexes”27 that are measured by a UV spectrometer at 335 nm.
The AN and PAAN can be determined mathematically given the absorbance in the UV
spectrometer. These two calculations are added together to obtain the YAN.
YAN tests can be carried out by a third party or done in house. In order to be able to test
for YAN in house, special equipment is needed for the lab. These items include a UV-
Spectrometer, quartz cuvette, and syringe filters. UV-Spectrometers are expensive pieces of
equipment. The HP-Agilent 8453 UV-Spectrometer sells within the range of $1,000 to $6,000
depending on its condition. A front view of the spectrometer is shown below in Figure 6.
Conveniently, some systems come with quartz cuvette, which saves around $100 per piece.
Target 2 Cellulose Acetate Syringe Filters are also used to filter juice sample before they are
mixed with chemicals and placed in the UV-Spectrometer. These filters sell for about $200 for a
26 (Laboratories, Enzymatic Analysis Kit for Determination of Ammonia in Grape Juice and Wine) 27 (Laboratories, Analysis Kit for Determination of Primary Amino Acid in Grape Juice and Wine)
33 | P a g e

pack of 100. Lastly, Ammonia and Primary Amino Acid test kits are required for YAN testing.
Vintessential sells these two kits together for $144. This kit comes with enough material for 30
YAN tests. Investing in lab equipment is expensive, however, sending juice samples to a third
party can be just as expensive at $45 to $65 per test.
Figure 6: A model of the HP-Agilent 8453 spectrometer
iii. YAN Test Analysis
The range of YAN in raw materials varies depending on crop variety, season, and age of
fruit. Despite these variables, the target YAN for a batch of raw cider is 150-200 mg/L28. If a
batch results in a lower YAN level, it is considered to be nitrogen or nutrient deficient. After
determining the YAN levels, there are several things that can be done to ensure a healthy
fermentation. More nutrients can be added through a nutrient strategy to increase the nitrogen
level of the cider. Table 15, from Scott Laboratories, shows the different nutrients that can be
added to the cider to increase YAN levels. Using this table and the desired YAN level, the right
amount of nutrients can be added to the cider to optimize fermentation.
28 (dekramer, Royer and Jones)
34 | P a g e
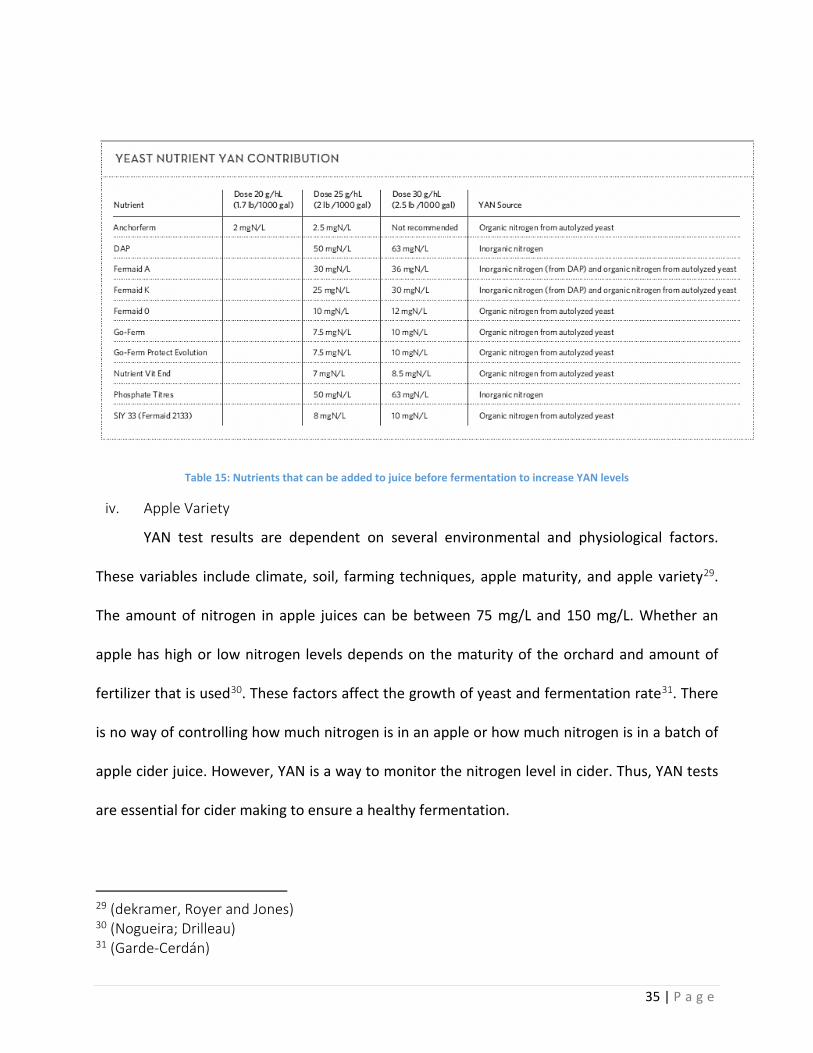
Table 15: Nutrients that can be added to juice before fermentation to increase YAN levels
iv. Apple Variety
YAN test results are dependent on several environmental and physiological factors.
These variables include climate, soil, farming techniques, apple maturity, and apple variety29.
The amount of nitrogen in apple juices can be between 75 mg/L and 150 mg/L. Whether an
apple has high or low nitrogen levels depends on the maturity of the orchard and amount of
fertilizer that is used30. These factors affect the growth of yeast and fermentation rate31. There
is no way of controlling how much nitrogen is in an apple or how much nitrogen is in a batch of
apple cider juice. However, YAN is a way to monitor the nitrogen level in cider. Thus, YAN tests
are essential for cider making to ensure a healthy fermentation.
29 (dekramer, Royer and Jones) 30 (Nogueira; Drilleau) 31 (Garde-Cerdán)
35 | P a g e

A study was performed in Brazil to observe the effect of apple variety on the growth of
yeast and fermentation rate. In their study, three apple varieties were used; Fuji, Gala and
Joaquina in order from highest total nitrogen to lowest. The apples were washed, pressed for
juice, and fermented. The average nitrogen content in 51 samples was 155.81 mg/L. They found
that differences in yeast development were due to the effect of the initial nitrogen levels. They
also noticed that consumption by the yeast was highest for Fuji apples followed by Gala, and
lowest for Joaquina. As a result, they concluded that nitrogen consumption by yeast was
directly related to the initial nitrogen available. The fermentation rate was also observed for
Fuji, Gala, and Joaquina apples. Complete fermentation for Fuji was fastest, finishing at 10.50
days, whereas Gala fermentation finished in 12 days, and Joaquina finished in 19 days.
Consequently, nitrogen content also effects fermentation rate32
II. Methodology
YAN is determined by adding the Ammonia Nitrogen (AN) level with Primary Amino Acid
Nitrogen (PAAN). These values were found by running Ammonia and Primary Amino Acid
Nitrogen Tests. The test procedures used in this project were adapted from Vintessentials. The
YAN test kit from Vintessentials contained an Ammonia Nitrogen test kit and Primary Amino
Acid Nitrogen test kit. For each test, there was a blank, a standard, and a juice sample
prototype. The blank model served as a reference for the standard and sample. The standard
prototype calibrated the analysis. Finally, the sample juice contained a sample of the filtered
apple cider which was filtered using a Target 2 Cellulose Acetate Syringe Filter. Juices were
filtered in order to obtain a better absorbance and to ensure that the concentration in the
32 (Alberti, Vieria and Drilleau)
36 | P a g e

assay solution was no more than 80 mg/L. Dilution may also be required if the sample net
absorbance, AN, is greater than 1 absorbance unit. For each of these prototypes, there were
two absorbance samples; absorbance 1 and absorbance 2. A HP Agilent 8453 UV-visible
Spectroscopy System was used to collect the absorbance of each prototype. The mixtures were
pipetted into a 1 cm quartz cuvette cell that was placed inside the UV Spectrometer to collect
the absorbance. The collected absorbance were used in a calculation spreadsheet to determine
the YAN value in mg/L.
To conserve the chemicals and obtain the most YAN samples, while consuming the least
amount of chemicals, the blank and standard models for both absorbance 1 and absorbance 2
were developed and reused for AN and PAAN tests. However, the juice samples were freshly
made for each test. Saving and reusing the absorbance 1 and absorbance 2 blank and standard
prototypes saved a lot of lab time. Figure 7 shows the total number of vials and models used to
create all of the prototypes for each absorbance. When the chemicals were not in use they
were stored in a refrigerator to extend its longevity. The procedure for the Ammonia Test and
Primary Amino Acid Nitrogen Test is provided in Appendices I and J. In addition, YAN level
calculations are provided in Appendix K.
Figure 7: The total number of vials and prototypes for absorbance 1 and 2 for YAN testing 37 | P a g e

III. Results and Discussion
PAAN, AN, and YAN results of cider samples from Ricker Hill are summarized in Table 16.
None of these samples reached the target YAN of 150 mg/L. The greatest YAN level that was
achieved was 139.21 mg/L and the lowest YAN was 85.84 mg/L. The average of these samples
was 107. 05 mg/L. Because the YAN levels for these samples did not achieve the recommended
range of 150 – 200 mg/L, according to Scott Laboratories, the samples were concluded to be
nutrient deficient.
Juice Type PAAN (mg/L) AN (mg/L) YAN (mg/L)
Press 2 156.00 -16.79 139.21
Press 1 150.72 -18.68 132.03
Juice 12/1 148.59 -17.09 131.50
Juice 1/5 112.81 -34.26 78.56
2-27(1) 105.85 -20.01 85.84
2-27(2) 108.91 -21.12 87.79
2-27(3) 116.79 -19.48 97.31
2-23(mac) 117.09 -21.43 95.66
2-17(mac) 115.51 -20.03 95.48
3-2-15 148.48 -19.04 129.44
2-9-15 115.46 -18.97 96.49
Table 16: YAN results for cider samples from Ricker Hill
38 | P a g e
A flavor and odor test was performed on Mainiac Gold; upon review a sulfur smell and
taste was noticed. Since the YAN results were relatively low, the sulfur smell and taste may be a
result of the lack of nitrogen for yeast to ferment healthily.
No tests were done to observe the fermentation rates of these samples. However, a
study in Brazil, as mentioned in the Background section, proved that nitrogen levels directly
affected fermentation rates. A greater level of nitrogen in the cider corresponds to a faster
fermentation rate. Low nitrogen levels in these samples may cause slow fermentation rates.
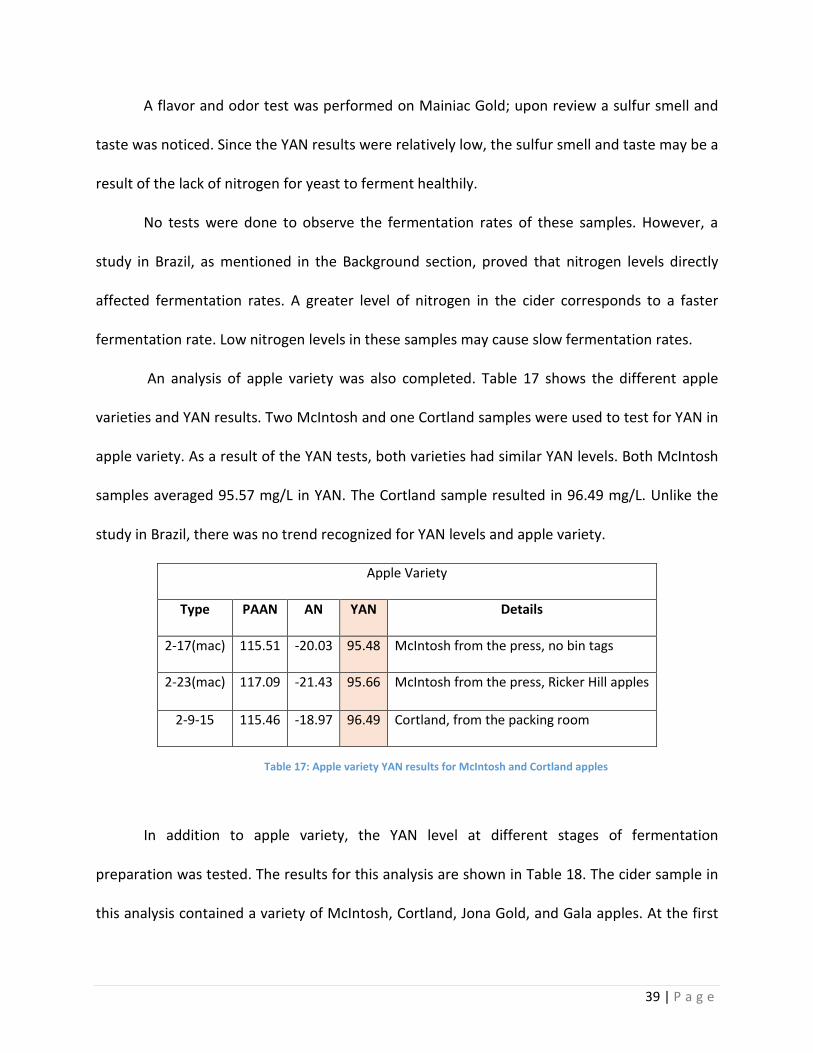
An analysis of apple variety was also completed. Table 17 shows the different apple
varieties and YAN results. Two McIntosh and one Cortland samples were used to test for YAN in
apple variety. As a result of the YAN tests, both varieties had similar YAN levels. Both McIntosh
samples averaged 95.57 mg/L in YAN. The Cortland sample resulted in 96.49 mg/L. Unlike the
study in Brazil, there was no trend recognized for YAN levels and apple variety.
Apple Variety
Type PAAN AN YAN Details
2-17(mac) 115.51 -20.03 95.48 McIntosh from the press, no bin tags
2-23(mac) 117.09 -21.43 95.66 McIntosh from the press, Ricker Hill apples
2-9-15 115.46 -18.97 96.49 Cortland, from the packing room
In addition to apple variety, the YAN level at different stages of fermentation
preparation was tested. The results for this analysis are shown in Table 18. The cider sample in
this analysis contained a variety of McIntosh, Cortland, Jona Gold, and Gala apples. At the first
Table 17: Apple variety YAN results for McIntosh and Cortland apples
39 | P a g e

stage when the cider was taken, the tank was halfway through pressing. At this stage, the YAN
was at its lowest at 85.84 mg/L. The YAN increased to 87.79 mg/L at stage 2 when the cider was
duplicated. At stage 3, the added Go-ferm enabled the YAN to reach 97.31 mg/L. Finally, at the
last stage, Fermaid-O was added and the YAN level increased to 129.44 mg/L.
Fermentation Preparation Stages
Stage PAAN AN YAN Details
1 105.85 -20.01 85.84 B37 half way through pressing 1500gal:
mac 330Bu, Cortland 21Bu, Jona Gold
42Bu, Gala 58Bu
2 108.91 -21.12 87.79 B37 full tank: mac 537Bu, Cortland 84Bu,
Jona Gold 63Bu, Gala 121Bu
3 116.79 -19.48 97.31 B37 after adding Go-ferm and yeast @
250ppm
4 148.48 -19.04 129.44 B37 after adding Fermaid-O @ 200 ppm
This analysis at different stages proved that as nutrients were added, YAN levels increased.
Figure 8 shows the increase in YAN as nutrients are added to the cider blend.
Table 18: YAN results for cider at different fermentation stages
40 | P a g e

Figure 8: A graph of YAN levels at different stages of fermentation
During YAN testing, there were several errors that may have occurred. YAN testing requires
the use of pipettes. The pipettes used in this particular study were old and used for a long time.
Therefore, the accuracy of the pipettes may have been off from the actual values needed for
YAN sample mixtures. Another source of error that may have contributed to the YAN results is
the UV-spectrometer. The spectrometer was an old and used piece of equipment that was
given to WPI from a company.
IV. Conclusion and Recommendations
Overall, the samples of juice that were tested were concluded to be nutrient deficient
because they did not have YAN levels within the 150-200 mg/L range. The lack of nitrogen in
the juice may have also caused a sulfur smell and after taste in Ricker Hill’s Mainiac Gold. In
addition to performing YAN tests to determine the YAN levels of the cider, an analysis on apple
variety and YAN level at different fermentation preparation stages was performed. Nothing was
concluded after the analyzing YAN levels for McIntosh and Cortland apples since both YANs
0.0020.0040.0060.0080.00
100.00120.00140.00
0 1 2 3 4 5
YAN
(mg/
L)
Stage
YAN Levels at Different Stages
41 | P a g e

were very similar to each other. However, for fermentation preparation stages, nitrogen levels
increased as nutrients were added to the cider.
i. YAN Testing at Ricker Hill As a result of the YAN tests performed on Ricker Hill’s cider, it is recommended to perform
YAN tests prior to fermentation. None of Ricker Hill’s samples accomplished the target range of
150-200 mg/L in YAN level. By performing YAN tests, the cider maker can measure how much
nutrients to add into the cider in order to achieve a healthier fermentation. YAN tests at
different stages proved that the addition of nutrients increased YAN values. Table 15 from the
Yeast Assimilable Nitrogen background section shows the different nutrients that can be added
to accomplish a desired YAN level. From this table, the dosage of nutrient is determined in
order to increase the yeast by a certain amount. For example, to increase YAN by 10 mg/L, 2
lbs. of Fermaid-O can be added per 1000 gal of cider. Increasing the yeast assimilable nitrogen
will also help eliminate sulfur production during cider fermentation. As a result, this will
enhance the aroma and flavor of the cider product.
ii. Apple Variety Study
There was no conclusion drawn on YAN levels and apple variety in this study. However, the
apple variety study in Brazil was able to observe the trend with apple varieties and YAN levels.
It would be interesting to further this study with a wider variety of apples. With successful
results, this data may help Ricker Hill with choosing the right apples for the healthiest cider
fermentation.
iii. Financial Analysis
A financial analysis was also done on investing in YAN testing equipment. Table 19 shows
the average cost for each piece of equipment necessary for 30 tests, 90 tests, and 120 tests. At
42 | P a g e

30 tests, the cost per test is $173. 47. This is greater than the average cost of $55 for sending a
juice sample to a third party. However, as the number of YAN test increases, the cost per test
decreases. At 120 tests, the average cost per test is $48.47, which is less than the average cost
of having a YAN test from a third party.
30 Tests 90 Tests 120 Tests
YAN Test Kit $144.00 $432.00 $576.00
Filters $60.00 $180.00 $240.00
Spectrometer $5,000.00 $5,000.00 $5,000.00
Total $5,204.00 $5,612.00 $5,816.00
Cost Per Test $173.47 $62.36 $48.47
Table 19: Average cost for YAN test materials
Another financial analysis was completed on sending samples out to third parties for
YAN laboratory testing. Table 20 shows 4 vendors and the price for YAN testing. Texas Wine
Lab’s YAN test was the most expensive followed by Virginia Tech, Vinmetrica, and
Vintessentials. The average YAN test cost was $55.00 per test. Throughout time, more and
more YAN tests are necessary. Therefore, the cost for 30, 90, and 120 tests were analyzed. For
YAN testing through a third party, the costs increases, as there are more tests.
43 | P a g e

As a result of the financial analyses, it is recommended to invest in YAN testing
equipment. After 120 YAN tests, investing in YAN testing lab will save the company $6.53 per
test which equates to $784 total for 120 tests. For testing in house, as the number of tests
increased, the cost per test decreased. Therefore, throughout time, the company would save
more by purchasing equipment and materials for YAN testing. In addition, having the materials
necessary to perform YAN in house will allow testing to be done immediately. Shipping samples
to vendors for YAN testing will take time depending on the vendor location. In this case,
investing in YAN testing equipment will save the company time and money in the long run.
Companies Price/Test 30 Tests 90 Tests 120 Tests
Vinmetrica $50.00 $1,500.00 $4,500.00 $6,000.00
Vintessentials $45.00 $1,350.00 $4,050.00 $5,400.00
Virginia Tech $60.00 $1,800.00 $5,400.00 $7,200.00
Texas Wine
Lab
$65.00 $1,950.00 $5,850.00 $7,800.00
Avg $55.00 $1,650.00 $4,950.00 $6,600.00
Table 20: Third party YAN test costs
44 | P a g e

Crossflow Filtration
I. Background
Crossflow filtration was first developed for wine clarification but the
high quality performance of filtration made other industries, like hard
cider production, begin to use it as well.33 Crossflow filtration uses
membranes that are either hollow-fiber, tubular, plate-and-frame or
spiral. A number of parallel cylindrical ceramic membranes that are
similar to the ones Ricker Hill Orchards uses are shown in Figure 9.34
The membranes are barriers that allow separation of particles in the
fluid by means of pores. Pore size can range from nanometers to micrometers. The Ricker Hill
crossflow filter uses a membrane with a pore size of 0.2 µm. If pore size is extremely small, a
specific fluid is required to drive the liquid through the pores.35 This system of filtration uses
tangential flow filtration, in which an incoming feed stream passes across the surface of a
membrane at high velocities; this decreases solid build-up instead of using a dead-end filter
operation. Dead-end filter operations filter by allowing the feed to flow directly perpendicular
to the membrane’s surface. The difference between crossflow and dead-end filters is
demonstrated in Figure 10.36 Specifically, this figure shows that the dead-end filter’s feed flows
parallel to the membrane surface while the crossflow’s feed flows perpendicular. After the flow
goes through the membrane, two exiting streams are generated. One of the streams, the
33 (Royer, Jones and Howard) 34 (Novasep ) 35 (Hammel and Young) 36 (KOCH Membrane Systems )
Figure 9: Ceramic Membranes for Crossflow Filtration
45 | P a g e

permeate stream, is the filtered product. The second stream, the outlet retentate stream
removes larger particles that cannot go through the membrane, and it also recycles back into
the filtration system to further filtrate before exiting as waste.37 Figure 11, shows the process of
the whole crossflow filtration system being used currently at Ricker Hill Orchards.
Figure 10: Crossflow vs Dead-end Filtration
Figure 11: Ricker Hill Orchards' Crossflow Filtration System
37 (Pall Corporation )
46 | P a g e

Crossflow filtration is becoming very popular to use because it has many advantages that
other filtration systems do not have. The concept behind crossflow filtration is “Set and Forget”
because the system is automated and does not require an operator during the entire filtration
cycle.38 Once the system is turned on, the crossflow can run on its own until the filtration is
completed. The crossflow virtually cleans itself; all that is needed is the connection of water to
the feed as well as adding NaOH (2.0 kgs powder NaOH) inside the buffer tank.39 The wheels
on the crossflow system, like most systems, enable it to be easily moved to different vessels
and tanks that are out of reach.
Another benefit of crossflow filtration is the use of tangential flow filtration, as mentioned
earlier. Tangential flow filtration produces a constant flow rate and minimizes the solid build-up
on the surface of the membranes. This reduces the need to clean or replace the membranes,
making it more affordable to maintain than other filtration systems.40
A disadvantage of crossflow filtration is that in order to optimize the filtration system, much
research must be done on the membrane to ensure that the correct membrane is used for the
intended purpose.41 If the correct membrane is not used for the specific task, the filtration time
and clarity will vary. Another disadvantage is fouling of the membrane, which causes the
system to stop the production line. When this occurs, cleaning must be done in order for the
filter to work properly again.
38 (Royer, Jones and Howard) 39 (Winetech) 40 (Hammel and Young) 41 (Hammel and Young)
47 | P a g e

II. Methodology
The goal of this project was to optimize the crossflow filtration system that Ricker Hill
Orchards is currently using. Currently, the time required for the crossflow filter to complete a
batch of hard cider is varying. A pressure drop versus flux analysis will show the time required
for each filtration run. This pressure drop versus flux analysis can be determined by collecting
current data from Ricker Hill’s crossflow filter. An ASPEN simulation will show the optimal inlet
pressure and flowrate for the crossflow filter.
i. Pressure Drop versus Flow Analysis
In order to determine when the filtration system was starting to not perform effectively
data was collected to pin point at what time the filtration cycle started to decline in
performance. The crossflow was fed with water to see what affects the filter had over several
runs of filtration and then runs were done with hard cider. The methods for this procedure are
in Appendix L.
ii. ASPEN simulation
With the data collected from previous filtrations completed at Ricker Hill, a simulation on
ASPEN PLUS V8.2 was completed. Figure 12 shows the ASPEN simulation of Ricker Hill’s
crossflow filter.
48 | P a g e

Figure 12: ASPEN crossflow filtration simulation
Feed and specifications of the Ricker Hill crossflow filter was entered into ASPEN before
starting to manipulate the variables to give the best optimization of the crossflow filtration
system. The pressures and flux collected from the crossflow filter were used as guidelines in
ASPEN, as shown in Appendix M. Pressures and flowrates were manipulated to find the most
efficient filtration. A trial and error method was used in order to determine the impact of one
variable on the flowrate and time of filtration.
III. Results & Discussion
i. Pressure Drop versus Flux Analysis
Due to lack of time, a pressure drop versus flux analysis could not be performed on the Ricker
Hill Cross flow filtration system. Not enough data was collected to establish a trend for the
pressure drop and flux of the crossflow. If enough data was collected, the trend would show the
time that the filtration system began to decline in performance. This experiment should be
performed in the future so that Ricker Hill can identify the approximate time the crossflow
needs to be cleaned, to ensure efficient filtration cycles.
49 | P a g e

ii. ASPEN Evaluation
An increase in inlet pressure and flowrate resulted in better filtration. Improved filtration was likely due
to a greater pressure drop, which caused minimal fouling in the membrane. A flowrate of 970 L/hr gave
the greatest allowable inlet pressure without exceeding equipment restrictions, which were 1.2 – 2 bar.
Table 21 gives a summary of the flowrate and pressure that the crossflow filter can efficiently run. All
ASPEN input files be found in Appendix N.
Flow Rate (L/hr) Inlet Pressure (bar) Filtration %
1 370 1.30 90
2 470 1.37 93.5
3 570 1.53 94.6
4 970 1.76 98
Table 21: Most efficient flowrates and pressure drops for crossflow filter
IV. Conclusion and Recommendations
Running the filter at 1.76 bar for the inlet stream pressure and 970 L/hr for the flowrate will
optimize the crossflow filtration system. This will ensure that the filter is performing
consistently. The new batch data sheet should be used in order to maintain consistency in each
batch. This will make it easier to analyze the data and improve organization.
Another recommendation is to collect pressure drop and flux data for the hard cider juice to
further optimize the crossflow filter. This will show how the pressure and cleaning time vary
with different blends of hard cider and if alterations need to be done. Knowing how long each
batch takes to filter will improve Ricker Hill’s organization.
50 | P a g e

Overall Conclusion
As a new brewery, Ricker Hill is encountering many challenges. The purpose of this
project was to improve the brewery’s efficiency and product quality. A big problem for Ricker
Hill during hard cider production is the organisms involved with fermentation. After conducting
YAN tests, it was concluded that YAN levels for the cider samples were low, meaning that the
juices were nutrient deficient. When the cider lacks nutrients for the yeast, it produces sulfur
byproduct. From the flavor compounds analysis in the cider, it was confirmed that this sulfur
byproduct existed in high levels. Increasing the nutrient levels in the juice will improve
fermentation and prevent sulfur byproduct production, thus enhancing the aroma and taste of
Ricker Hill’s product. Ricker Hill also wants to understand the activity of bacteria during hard
cider and vinegar production. The first step in furthering this study was to identify the species
of bacteria involved which were determined to be all in the Acetobacter genus. Finally, with an
increase in demand Ricker Hill must increase the efficiency of their production. Ricker Hill’s
crossflow filtration unit varies in performance due to cider type. An Aspen simulation was done
to mimic Ricker Hill’s crossflow filtration. The results of this simulation gave the optimal time
and pressure specification for the crossflow filter.
51 | P a g e
Works Cited
"Acetobacter aceti Final Risk Assessment." 27 September 2012. U.S. Environmental Protection
Agency.
Alberti, Aline, et al. Apple Wine Processing with Different Nitrogen Contents. 2011.
http://www.scielo.br/scielo.php?script=sci_arttext&pid=S1516-
89132011000300017&lng=en&tlng=en. 10.1590/S1516-89132011000300017.
Altschul, Stephen F, et al. "Gapped BLAST and PSI-BLAST: a new generation of protein database
search programs." Nucleic Acids Research (1997): 3389-3402.
Asai, Toshinobu, Hiroshi Iizuka and Kazuo Komagata. "The Flagellation and Taxonomy of Genera
Gluconobacter and Acetobacter with Reference to the Existence of Intermediate
Strains." Journal of General and Applied Microbiology (1964): 95-126.
dekramer, Rebekka Swanson, et al. "Cider Handbook." 2014-2015. Scott Laboratories.
http://www.scottlab.com/pdf/2014CiderHandbook.pdf. 2 Febuary 2015.
Drilleau, J F. "Cider Processing: nitrogen and fermentation; phenol compounds and oxydation."
Rev. Pomme a cidre (1993): 33, 24-25.
Garde-Cerdán, Teresa, and Carmen Ancín-Azpilicueta. "Effect of the addition of different
quantities of amino acids to nitrogen-deficient must on the formation of esters,
alcohols, and acids during wine alcoholic fermentation." LWT-Food Science and
Technology (2008): 501-510.
Graciela, M-G M, et al. "The identification of Bordetella bronchiseptica from canine isolates of
sequencing 16S ribosomal DNA." African Journal of Microbiology Research (2014): 1964-
1969.
52 | P a g e

Gross, Jurgen H. Mass Spectrometry: A Textbook. Berlin: Springer, 2004.
Hammel, Karen and Matthew Young. Validation of the Pall OenoFlow Filtration System in WIne
and Juice Applications at E&J Gallo Winery. MQP. Worcester, MA: Worcester
Polytechnic Institute , 2006.
Hanlee, Ji and Jay Shendure. "Next-generation DNA sequencing." Nature Biotechnology (2008):
1135.
Hui, Y H and Evranuz E Ozgul. Handbook of Plant-based Fermented Food and Beverage
Technology. Boca Raton, FL, 2012.
Kitson, Fulton G. Gas Chromatography and Mass Spectrometry: A Practical Guid. Academic
Press, 1996.
KOCH Membrane Systems . Application Bulletion:An Overview of Membrane Technology and
Theory . Wilmington,MA, 2012.
Laboratories, Vintessential. "Analysis Kit for Determination of Primary Amino Acid in Grape
Juice and Wine." 1 January 2012. Vintessential Laboratories.
http://www.vintessential.com.au/assets/datasheets/file/test-kit-
instructions/english/4a110-primary-amino-acid-nitrogen-30-210612.pdf. 31 March
2015.
"Enzymatic Analysis Kit for Determination of Ammonia in Grape Juice and Wine." 1 Jan 2012.
Vintessential Laboratories.
http://www.vintessential.com.au/assets/datasheets/file/test-kit-
instructions/english/4a120-ammonia-30-23112012.pdf. 31 March 2015.
53 | P a g e

Nogueira, A. "Tecnologia de processamento sidrícola: efeitos do oxigênio e do nitrogênio na
fermentação lenta da sidra." Doutorado em Processos Biotecnológicos Agroindustriais–
Universidade Federal do Paraná (2003).
Novasep . Industrial Cross-Flow Filtration Technology. Lyon,France, February 2015.
Ortega, Catalina, et al. "Fast Analysis of Important Wine Volatile Compounds: Development and
Validation of a New Methof Based on Gas Chromatography- Flame Ionisation Detection
Analysis of Dichloromethane Microextracts." Journal of Chromatography A (2001): 205-
214. Science Direct.
Pall Corporation . How CrossFlow Filtration Works. Port Washington, NY , 2015.
Raffo, A. "Effects of Different Organic and Conventional Fertilisers on Flavour Related Quality
Attributes of Golden Delicous Apples." Food Science and Technology (2014): 964-972.
Richardson, Susan D. Water Injections in GC- Does Water Cause Bleed? Agilent, 2001.
Royer, Monica, et al. Cider Handbook. Petaluma, CA: Scott Laboratories , 2014-2015.
Sakamoto, Kanta and Wil N Konings. "Beer Spoilage Bacteria and Hop Resistance." International
Journal of Food Microbiology (2003): 2-3.
Shantanu Kelkar, Kirk Dolan. Modeling the Effects of Initial Nitrogen Content and Temperature
on Fermentation Kinetics of Hard Cider. 1 April 2012.
http://www.sciencedirect.com/science/article/pii/S0206087741005590. 30 March 2015.
<http://www.sciencedirect.com/science/article/pii/S0260877411005590>.
Stackebrandt, Erko and Michael Goodfellow. Nucleic acid techniques in bacterial systemics. New
York: John Wiley and Sons, 1991.
54 | P a g e
Turner, S, et al. "Investigating deep phylogenetic relationships among cyanobacteria and
plastids by small subunit rRNA sequence analysis." Journal of Eukaryotic Microbiology
(1999): 327-338.
Wang, L., et al. "Rapid Analysis of Flavor Volatiles in Apple Wine Using Headspace Solid-Phase
Microextraction." Journal of the Institute of Brewing (2004).
Wiley, S K. "Changes in the Odors of Reconstituted Apple Juice during Thermal Processing."
Journal of Food Science (1998).
Winemakers, Nanaimo. Adding Nitrogen to Fermentations. 2007.
http://nanaimowinemakers.com/adding-nitrogen-fermentations/. 16 February 2015.
Winetech. Crossflow Filter Operating and Maintenance Manual . Napa, CA: WineTEch , n.d.
Xu, Yan, Wenlai Fan and Michael C Qian. "Characterization of Aroma Compounds in Apple Cider
Using Solvent-Assisted Flavor Evaporation and Solid-Phase Microextraction." Journal of
Agricultural and Food Chemistry (2007): 3051-3057.
Zhang, Z, et al. "A greedy algorithm for aligning DNA sequences." Journal of Computational
Biology (2000): 203-214.
55 | P a g e
Appendix
A. Acid Washed Glass Beads
1. Weigh 50 g of 0.5 mm glass beads into a 100 ml-orange cap Pyrex bottle. The volume of
glass beads should be no more than 1/5 of the bottle used for washes.
2. Add 5.8 M HCl to cover class beads. Alternatively, use concentrated nitric acid. To
prepare 5.8 M HCl, add 1 volume of concentrated HCl to 1 volume of dH2O with
moderate stirring. Dilute in a fume hood.
3. Incubate at room temperature for 1 hour.
4. Carefully pour 5.8 M HCl down drain. Some HCl will remain with beads. Rinse HCl down
drain with tap water.
5. Add dH2O to the 80 ml mark on the 100 ml bottle. Swirl bottle for 10 seconds to stir up
beads. The dH2O wash volume should be at least 5X the volume of the beads in the
bottle.
6. Pour off the dH2O wash in the sink. Rinse wash volume down the drain with tap water.
7. Repeat steps 5 and 6 for a total of 10 washes to reduce the HCl concentration below 10
mM.
8. Autoclave beads for 20 minutes.
9. Dry beads in oven at 50˚C overnight.
10. Store beads at room temperature. Spoon out beads with sterile “dipper” made with tip
cut from 1.5 ml tube glued to end of plastic transfer pipette. Use gloves that have been
washed and dried.
56 | P a g e

B. PCR Protocol
1. Centrifuge Eppendorf tubes with the DNA samples to get glass beads on the bottom.
2. Transfer 1 μl from DNA sample tube to a PCR specific Eppendorf tube. Make sure to take
from the top of the sample tube to limit the amount of glass beads taken up.
3. To each PCR tube, add 10 μl of Promega GoTaq® Green Master Mix.
4. Add 2 μl of primers, 1 μl each of forward and reverse, to each PCR tube. Use primers 27F
and 1492R together, or 8F and 1391R together.
5. Add 7 μl of ultra-pure water, bringing the volume of each tube to 20 μl.
6. Place PCR tubes in PCR machine.
7. Run PCR machine based of the following protocol:
8. Initial denaturation step for 3 min at 94˚C.
9. 30 additional cycles, each consisting of a denaturation for 1 min at 94˚C; an annealing
for 30 s at 55˚C; and an extension for 2 min at 72˚C.
10. One-step extension for 7 min at 72˚C.
11. Store products at 4˚C.
C. Gel Electrophoresis
1. Mix 0.45 g of agarose and 50 ml of 1X TAE together in an Erlenmeyer flask.
2. Swirl flask until agarose powder dissolves.
3. Microwave flask on high for 1 min.
4. Add 3 μl of ethidium bromide to flask.
5. Pour contents of flask into gel system.
6. Place lane template in gel.
57 | P a g e

7. Allow gel to fully cool.
8. Remove lane template and add 1X TAE until liquid covers gel.
9. Add 10 μl of each PCR product in separate lanes.
10. For the ladder, add 9 μl of water and 1 μl of 100 bp ladder to a lane.
11. Run gel at 80 V for approximately 45 min.
12. When finished, analyze gel under UV light to confirm PCR product.
D. Full Sequencing Results:
27F Primer
Vin-1A: NNNGTNCTATTACACATGCTAGTCGTACAGGTATACCACCTTAGTGGGGACGGGGAGTAACGCGAGGAATCTATCCATGGGTGGGGGATAACACTGGGAAACTGGTGCTAATACCGCATGACACCTGAGGGTCAAAGGCGCAAGTCGCCTGTGGAGGAGCCTGCGTTTGATTAGCTAGTTGGTGGGATAAAGGCCTACCAAGGCGATGATCAATAGCTGGTTTGAGAGGATGATCAGCCACACTGGGACTGAGACACGGCCCAGACTCCTACGGGAGGCAGCAGTGGGGAATATTGGACAATGGGGGCAACCCTGATCCAGCAATGCCGCGTGTGTGAAGAAGGTCTTCGGATTGTAAAGCACTTTCGACGGGGACGATGATGACGGTACCCGTAGAAGAAGCCCCGGCTAACTTCGTGCCAGCAGCCGCGGTAATACGAAGGGGGCTAGCGTTGCTCGGAATGACTGGGCGTAAAGGGCGTGTAGGCGGTTTGTACAGTCAGATGTGAAATCCCCGGGCTTAACCTGGGAGCTGCATTTGATACGTGCAGACTAGAGTGTGAGAGAGGGTTGTGGAATTCCCAGTGTAGAGGTGAAATTCGTAGATATTGGGAAGAACACCGGTGGCGAAGGCGGCAACCTGGCTCATTACTGACGCTGAGGCGCGAAAGCGGGGGGCAAACAGGATTAGATACCCTGGTAGTCCACGCTGTAAACGATGTGTGCTAAGATGTGGGTGACTTAGTCATTTCAGTGTCGCAGTAAACCGTAAGACACCGCCTGGGGAGTACGGGCCGCAGTTGGAACTCAGAGGAATTGACGGGGGCCCGCAGAGCGGGGACATGTGGTTAATTCTATCACGCTCAGACCTTACAGTCTTGATTTCAGCTGCAGCGAAATGTTGCTCCCGCAGCGCTCTACCAGTCTGCTGAAGCGTCACCGAGCGTTATTCAGGCTGAGTACGGACGAGCGACCCGTCTTGATGGCCCCGGTTGGCTGTATATCGCGAG Blb-1C: GGGGCCAATATCTCTTCTCTCATTTTGGCGTGAGTGAGAAAAAAAGATTGATAAAAAGCTATTTGCAACGTTGCCACCAGGCAGCGAGGAAGGGAAAGGTGCCGTAAAAGAAAATAATGAGGTGGGTCCTTCGGGAACGTCACCCAATATGTTTTAATTTGGATATTTTTTAGCCCCCAGTTTTTTTCTGAATATATTCTATTATACTGCATAAAATATGCACGGAATTGCCATGATACGGACGCCTAAATGG Blb-1D: ANNGCGCATCCTTGCCTTCATTATTCCCGCTCCTGAGTAGCACAAAATAATTTTTGTAATTATATTTCGCACTGGAAACACAAACAAATTAACAAAAACAACGGGACGGAAAAAATAATTATTTCTCTGGTTAGTTGCAGGCCTCCAACTATGGTTTAAAATGGACTATCATTTGCTCACCGTATCTCGATAGCAATTCTTT
58 | P a g e

ACCACGGCTTCATATAACCGCTGTAGTACTAAAACACTAACAGATCAGACTCCCCGACTGTCCTAGCTACCACCTTTGTTCAAAAATAGCTATCCTGTATTTTTTTTTATTTGTCTCGAGTCTGTGTTTTTTTTTCTTTAGTTAGAAACCACCCCCCATGATTAAGCTAGTCCGTTTTTATTGTTTCGGCATTCTGCAGACCATGGCTCTAGAAGAGGCCTCTTCTTATAAATTACAAAAGAGGCGTTTGCCTGACCCCCACTTTCCTCCCCTTGGCCTCATAATATTACGTAGGGAATTTCCTTGTTGCCTTGGCGGAGGAATTCTTTACCT Blb-1E: GGNGTACGTATGATTAATCTGCCATAACGGTTGCTACCGGTGGGTATTAAAAATAATAAATTTTTTGAAAAACATTATATCGCAACAGGTGTAAAACACCAAGGGAGAGAAAAAACACAGCAAACACCCCCGAACGTTATAAAAGAGAAATAAATTAACTCTGTTTTCAAATAAAGCAGACCCTACAATTATAAGCTTAAATGTGAGAATTATTTTCCTACCGTATTTCGTTTTTATTTTCCATTTCTATTGCGTCTATATACTCGCGGAAAGGAAAAAAACAGTTACAGCTCATCCACCCACTTCCTACCCCAATAATTATAATATATGGCTTTCCGTTATTTCTTTATAAATTGCCCCTCTTGCGTTTTTGTTCTAATAGTACAACAGCTAAAAAAGGTCTTCTTTTAATCGGGTCCTAATTTTCCCCAATGGTTTAAAAGGACCCTACCTTATAACGGAAATGGCCTTTTGTGTCCTCCAACACCCCCCCCCTTTACCTAATTTTAAAACCAAAGGGATTTTCCCTTATGTAGGGGGGGGATTTAAGGAATGGCCTTTGCATAATCACGGGTCCTTTCTATTTACCCCCCAAACCCCGGGTGAAAGGGCGGGGGAGGGTGGGGGGGAGGGAGTCAGGGGAAGCATACCACAATAT Blb-1F: NNNCATCTATTCGTCTATATCTCCACAGCGAGTGTAGAGAAAAAAAATTGAGAAAACTTATTCAGAGGAAAAACCAAGAGGGAAAAAGGAAAACGGCGACGAAGAAAAAAAAATATCGTGCCCTAAAAAGAACCTATAATTTATTTTTAATAGTGCAACCTTATGCTTCATTTTTCTTGTATATTTTATCTCTTGGTTCTCTATATATCGTGTTTAGGAGTATAAACTTGACTTCTAAGACTAGGCCGCGCCCGCGACTGCAAACCAAATAACATAAAAGGTTACGTGTTAATTTGTAGAAATTACAGACCTGAAGCTGTTTGTTTGTTAATAAAAAAGCACCCAAAAAAAGAGATATTTTTTTTATTGTTTTTTTTTCGTCATGATTTATATACGCCTTTTATTATTGTGATGTTCCTGTTTGGTGATTCTTACCATTTA 8F Primer: Vin-1A: TNGTCGGCAGCGCACTATGCTAGTCGCACGAAGGTTATACGGCCTTAGTGGCGGACGGGTGAGTAACGCGTAGGTATCTATCCATGGGTGGGGGATAACACTGGGAAACTGGTGCTAATACCGCATGACACCTGAGGGTCAAAGGCGCAAGTCGCCTGTGGAGGAGCCTGCGTTTGATTAGCTAGTTGGTGGGGTAAAGGCCTACCAAGGCGATGATCAATAGCTGGTTTGAGAGGATGATCAGCCACACTGGGACTGAGACACGGCCCAGACTCCTACGGGAGGCAGCAGTGGGGAATATTGGACAATGGGGGCAACCCTGATCCAGCAATGCCGCGTGTGTGAAGAAGGTCTTCGGATTGTAAAGCACTTTCGACGGGGACGATGATGACGGTACCCGTAGAAGAAGCCCCGGCTAACTTCGTGCCAGCAGCCGCGGTAATACGAAGGGGGCTAGCGTTGCTCGGAATGACTGGGCGTAAAGGGCGTGTAGGCGGTTTGTACAGTCAGATGTGAAATCCCCGGGCTTAACCTGGGAGCTGCATTTGATACGTGCAGACTAGAGTGTGAGAGAGGGTTGTGGAATTCCCAGTGTAGAGGTGAAATTCGTAGATATTGGGAATAAAAATCGGTGGCGAAGGCGGCAACCTGGCTCATTACTGACGCTGAGGCGCGAAAGCGTGGGGAGCAAACAGGATTAGATACCCTGGTAGTCCACGCTGTAAACGATGTGTGCTAGATGTTGGGTGACTTAGTCATTCAGTGTCGCAGTTAACGCGTTAAGCACACCGCCTGGGGAGTACGGCCGCAAGGTTGAAACTCAAAGGAATTGACGGGGGCCCGCACAAGCGGTGGAGCATGTGGTTTAATTCGAAGCAACGCGCAGAACCTTACCAGGGCTTGAATGTAGAGGCTGC
59 | P a g e

AAGCAGAGATGTTTGTTTCCCGCAAGGGACCTCTAACACAGGTGCTGCATGGCTGTCGTCAGCTCGTGTCGTGAGATGTTGGGTTAAGTCCCGCAACGAGCGCAACCCCTATCTTTAGTTGCCATCAGGGTTGGGCTGGGCACTCTAGAAGAAAACTGCCGGTGAAAAGGCCGGAGGAAAGGTGGGGGATGACGTCAAGTCCTCATGGGCCCTTTATGTCCCTGGGCTAACACACGTGCTAACAAATGGCGGGTGAACAGGTGGGAAGCTAAGGGTGGGGTGACCCCCATGGCTGATCTCTAAAAGCGNCTTCANNTTCGGAAATGGCAACTCTGGCAACCTCGGAGGTGTNCATNANAGGGTTGGGGA Blb-1C: CCCCACTAATCCTCACCTATCAATACGGAGTGGTTAGAAAAAAAATTTGGAAATTAATCTTGACGGGAAACACCACAAGGCGTAAAAATAAAAGCGACGTAGAAAAAAATTTTTTTTGGTTATTTCGGGCTTTTTATTATGTTTAAAAATGGACTATCATATGCCCCCGTTTATATAAAGTATTTCTCCTTTTTGGCTGTATATATCCCCCGTATAGAACAAGAAATTTTGGATATGAGGGCGCCGACCCCCCCCCCCACCAAATAAAGAAACAATAACGGTTGCCTTTTATTTTGTTAAAATTGGCCCGATTTACGGTTTTTGGTTTTTCTTAAACACCACCCGAATAGGGACCCTTTCTGCTGTGTTGACTTTACCCACAATGGGTCTAAGGTCACCTCATAACTTTTCGCCGCGGGTCCGTGGGTTGAGCTTCTCGCCATTGCCCTTTTACGTTAATTTAAATACCACACGGATATTTCTGACGCGCCGCGCGTGTTAACGTTAACTGCCCATTTGTAGTTGTCCAGCGTCCTTTTTTGTACCCCCCTCCCACGCCTGATGAAAGGGGGGGGGGGGGCGGGGGGGGGGGGGGGGGGACC Blb-1D: CCGAAAACCACCCCCTCTTCAAAAAAGGAGCGTTGAGAGAGATATTAGAAAAAAACTTGACTGGATACCCCACGAAAGACTAACTTAAACCGCGGGAAAAAAAAAATAATTTTGGGGCCTGTACCCCTCTAAATTATTTTTTTTTTAGACTGTTACACCCCTTTTCTTCCTTTTGTATCTTTACTCTTTTTCTAGAAACCCTGTGGAAAGGAGAAAAATAAGGTCTCATAGGCCCCCCTCCCCTCCCGCACAAAAATAAAAACATAAAAAGATATACCGCTATTTCTCTTAATTTGCGCCCCTGATGCTTGTTTATGTTTATTTAATATCCACCCACCAAGATAAAGTAAGGGATTTTCGTCGGGTGGCGTTGTGGCCTGATGGCCTAGAAGGGAACCCACTTAATTACATCCAAGGACTTTTCCTGTGCTTGCCTAACCCGTCTCTTCTCTTTTTATACATAGGGTAGTAATTGCCTCACGGGGGGGATGTATATTAAGGCCTTCGTGTAGCCCGCGATCTTGTTCTTTAGCCCCCCCTGCCCCGTGAGGGGGGCGCGGGGCTGGC Blb-1E: GCGNNNNNNCNNNCNNNNANNNNNNNNNNNAGGGTNACTCNNANNACTCNTCGAAGGAGANTATTAGGGGGGGAACACTGTTCTCCTACCTTATGGCTATCGTTCCGACCACAAAAGACCCCGAATTAAACAAATGGTAACAATCTCCCCTTTTATTTCCAGCAATCTCTCCACCAT Blb-1F: GGGGNNNNNNNNNNNANNANNNNANNATACGGNATAATTTCAATAGACCTCAGGAGCAGTTAGGGGGGGGGAAAGAGACTCCCCCCCCTTAGGAAGGGGTTTGTCCCCAAAGAGGCTTCCCCTGTACTTCAAATGTAAACTTGAATGCCCCACTGTTTCTTTTTTATATTTTATTTGTCCTCATCCACATTCACCTCATTTTCATAGAATCCCAAATG 1492R Primer: Vin-1A:
60 | P a g e

GGGANNNGCNANNNNNNTTAANANNNNNTACGGGGATTACTATCAGATACCTATGCAACGCGGGAGTTAGGGGGGGCAACAACTAACGGCCCACGACCATAGGGATAGGGGGCGCCCTCCAGAGGGGCCTCCCAATGTGTGCCAATTGTCGTACTTGAATGCCCCACTGATTGTTGGTTAATATTTTTCCGCGTCGATGCAACTTGCCACATGCTTTTCATAAAAGTATGCCAAATA Blb-1C: NATGCACGCACTTCGATGTTTGTGCGTATACGGGTATTGTCGTACTAGTACCATACGACGAGGCTACATGAGGGGGGTACCAAGGCCGGGCGTTTCTCCCTGAGTTCTGAGCCAAGATCAAACTCAGCCCCCGTGGATGCCGCCCTGGTGGCTGTCTGAAAGGTTACGAGGGGTGTATTGCGGTGGAGAAAATGGTTGAGGGTGGCGCTCCCGGGGAACCCGACTCCTGGGCTGTCCTGAGAGGTGGAAAATGGGGGATCGGGTATGTGTTGCCGTTTTGGCCCTGTGGTTGTTGTGAGATTTGGCGGAGGAGCCAGTGCCGCCGCATTAGATAGACGCTCGGCTGTCTCGGTGGAAGAATGAGGGGGCAGGGAACAGGTGGGCGGGCTGGGACAGCAGGCGACCAGGAGATGGTATACTTCTTGTGAGGTGGTCTTAGGCTTCGGCATATTTATTCCGCCGTATTTTTGTCTTGCGTGCATGTGGTGCACCGGAATGGAAAGCGTGATGGTGCGGAGATGTCCGGCGACAGGTTGTTTTCTTCATAG Blb-1D: NNNCATGGTTCGGTACAGCCTCCGTCTATGATGTATACTACGTAGTCATATAGGCAACAGCTCGAGGGGGACGGGCGGGGTGTACAAGGCCGGGACGTATTCACGGCGGCATCTGATCCGCGATAACTAGCGATTCCACCTTCGTGCACTCGAGGAGCAGAGTGCTATCCGCCTGAGACGACTTTTTGAGATCAGCACGATGTCGCCATCTAGCTTCCATTGTCATCGCCATTGTAGCACGGTGTAGCCCAGGACATAAGGGCCATGAGGACTTGACGTCATCCCCACCTGCCTCCGGCTTGTCACCGGCAGTCTCTCTAGAGTGCCCACCCAAACATGCTGACAACTAAGGATAGGGTTGCGCTCGTTGCGGACTTAACCAACATCTCACGACGCGAGGTGAGGACACCCATGGGCACCTGGGCGGTAGTGCCGTGCGGGAAATGCGCTTCTCTGGAACGGACTACCATAAAGCCTGGGAGGGTTCTGGGCGTGGGTCGAATAAAGCACGTGTTAACCGGTTTGCGGCGGGGTCATGTCTTTTGAGTTTCAATTTGGGGCCGGACTCGCAGGTGAGGGGGTATGGGGGTCGTCCGAACTGAGGAACAGGGTACCAAAAACCCAGCACACAGCGGTTAAGCGAGGACTTACCAGGGGATCTAATTCTTTGTTCTCCCCACGGTTTCGCGCGTCAGCTCAGGATTAACCAAGTGGCCGCTTGCCCCCCCGGGTGCCTTCCAAAAATTGAAAAAT Blb-1E: AAGATTGGTGGTGGTTCTTCTTGTTCCGTATGGGAAATTGTCCTCATGATTCCCTGTGCTGTCGCGGGGGGAAAAACGGTGGCTAATTAAGATCAGAGGCTAGAGAAGTGAAGACCACTCACTATAGGCTCGCCTGAGCACTTCTCTGCATCCCTAGTTGTTCTCCCCTTCTCTTCCACCACGTATAACTTGCAACAGCAATTGATCTGTCCCATCTGCCTAGATATGTCACGAAGCCTGTGCCCCCTCTCTCTTGTCAGAACTGGCCGTGCTGGAACTGTGCCAGCGACGTTTTCCCTGCCTCTAACCCGTCCTTACCCACAAAAGGAGGCACCGCCGCGGCATCAGGGTGGCGGTTTTGCTGTCCCCCCTGAAGACATGACTTGGTGGTCTACAGACAAGGCGGCTATGGTCTGCCAAGGAGCCTGCCCGTGGCACATTTTATTGATATCTACTATTATGATTCCACCATAACAGAAACAAAATCGCACCATCCCATGTGTGATTAGATGAATGGAACGCATCAACACTTCTGTCTGAACTGCGAACCGCCTCCTGCTCCTCGTGCACGGCTTTTGGCGCTCATGAGGGTGCTGGCGGCGCACTGAATTGGTGATCCGAGATAGAAGTCTCAGCTCATTGATGGCATTCCAGTATTGTGG Blb-1F:
61 | P a g e

TNNNGCCTCTGTGTCAGCTACTCTATCTCGAGTCATAGATTCTCAGAGCATATGAGCCATGATCGTCCTACTACCTTCTCGCACAATAATTAGAAAGAGGGATCTGAGCCATGATCAAACTCTAGGGGTTGGGGTGGGATTTATGCGTTGTTGTCTGCAGCGGCCCGAGTTGCTGACTAGAATCGGATGAGTATGACTTGGAAAGGATATTGTCATGACCCGTCTGCCCTCGATTAGGCGAAGCCGGGGGCAATGTCTCTGGATACAACCAACAGCGCCGGAACTGTGCCGCCGATTGCCCCCGGGCCTAAAGCTCGTCATTACCAGTCTGAGGAGGCACCCCCGCGGCATCAGGGGGACGGTTTGAATGTGGTTCTGGAAATGATGAGGGGGAGGGAAACGGACTGGGCGGCAGTGGAGCGGAAAGGAGCGAGGCCTTGGAAAATTTCACTGAAAGCTACCCTTCTGTTGCTTTCGGGATTTAAACAATCTTGGCCTCTGCCAGTGTGCCGAGTGGAAGAGGATTGCTCACCACCTTAGCCCTGCTGGGCAGCGCCTAATTCTTCTCGAGAAAAGTTTTGGGCGGATGGGAAGCGGGGGTGACTGGAGGGGGCCGGAGGCGGAAGCGACCTCGCGTGTCTACTGTATTGCGCAATGACGTACAAATTTTTGTTAACCCCACCTGTTTAC 1391R Primer: Vin-1A: CTCATCACGTAATGCTGATCAGCAATAACTACTAGATACCACCTTCATGCACTCGAGTTGCAGAGTGCAATCCGAACTGAGACGGCTTTTAGAGATCAGCATGGTGTCACCACCTAGCTTCCCACTGTCACCGCCATTGTAGCACGTGTGTAGCCCAGGACATAAGGGCCATGAGGACTTGACGTCATCCCCACCTTCCTCCGGCTTGTCACCGGCAGTCTCTCTAGAGTGCCCAGCCCAACCTGATGGCAACTAAAGATAGGGGTTGCGCTCGTTGCGGGACTTAACCCAACATCTCACGACACGAGCTGACGACAGCCATGCAGCACCTGTGTTAGAGGTCCCTTGCGGGAAACAAACATCTCTGCTTGCAGCCTCTACATTCAAGCCCTGGTAAGGT TCTGCGCGTTGCTTCGAATTAAACCACATGCTCCACCGCTTGTGCGGGCCCCCGTCAATTCCTTTGAGTTTCAACCTTGCGGCCGTACTCCCCAGGCGGTGTGCTTAACGCGTTAACTGCGACACTGAATGACTAAGTCACCCAACATCTAGCACACATCGTTTACAGCGTGGACTACCAGGGTATCTAATCCAGTTTGCTCCCCACGCTTTCGCGCCTCAGCGTCAGTAATGAGCCAGGTTGCCGCCTTCGCCACCGGTGTTCTTCCCAATATCTACGAATTTCACCTCTACACTGGGAATTCCACAACCCTCTCTCACACTCTAGTCTGCACGTATCAAATGCAGCTCCCAGTTAAGCCCGGGGATTTCACATCTGACTGTACAAACCGCTACACGCCCTTTACGCCAGTCATTCGGAGCAACGCTAGCCCCCTCGTATTACGCNGCTGCTGCACGAAGTAGCGGGCTTCTTCTACGGGTACGTCATCATCGTCNTCGAGTGCTTACATCGAGACCTTCTCCACAACCCGCATGCTGATCAGTGCCCAATGGCAATCCCACTGCTGCTCCGTGAGNTNNCGTTTCAAGTCCAGTGGCGTATCTTCTTCCAACACGATGAANNNNNTGAAGCTAACNCNATGCATACGGTCCTCCAGGACTTGCCTGACT Blb-1C: NNNCATTGCTTCTTCGTATGATTATACTCCTACAATTATGCGCTAAAGGACATAATTACATTCACTCACCTTCAGCACGACGGAGCTTGGGAGTATTACCTGACCTCCCGGCCAAGGTTATACTTGCTGGCTCCGTCAGTGTAGCGCGCGTGCGGCCCAGAACGTCTAAGGGCATCACCGACCTGTTGTTGCCTCAAACTTCCATCTGTTTGATACCGATAGTCCCTCTTAGAAGAGCAATCCAGCAGGCGCTAGCTGCTTTATTTAGGTGGTTAAGGGGGCGTCCGTTAAAGCAAATAAGCAAACTTTTTTTGGGAAAGAAAAGGGGGCGGGTAACCCCCCCCAAAAAAAAAA Blb-1D: TNNATCTTCGGTCTCTCTATCTGCGATACTAGCGATTCCACCTTCATGCACTCGAGTTGCAGAGTGCAAACCGAACTGAGACGACTTTTTGAGATCAGCACGATGTCGCCATCTAGCTTCCCATTGTCATCGCCATTGTAGCACGTGTGTAGCCCAGGACATAAGGGCCATGAGGACTTGACGTCATCCCCACCTTCCTCCGG
62 | P a g e
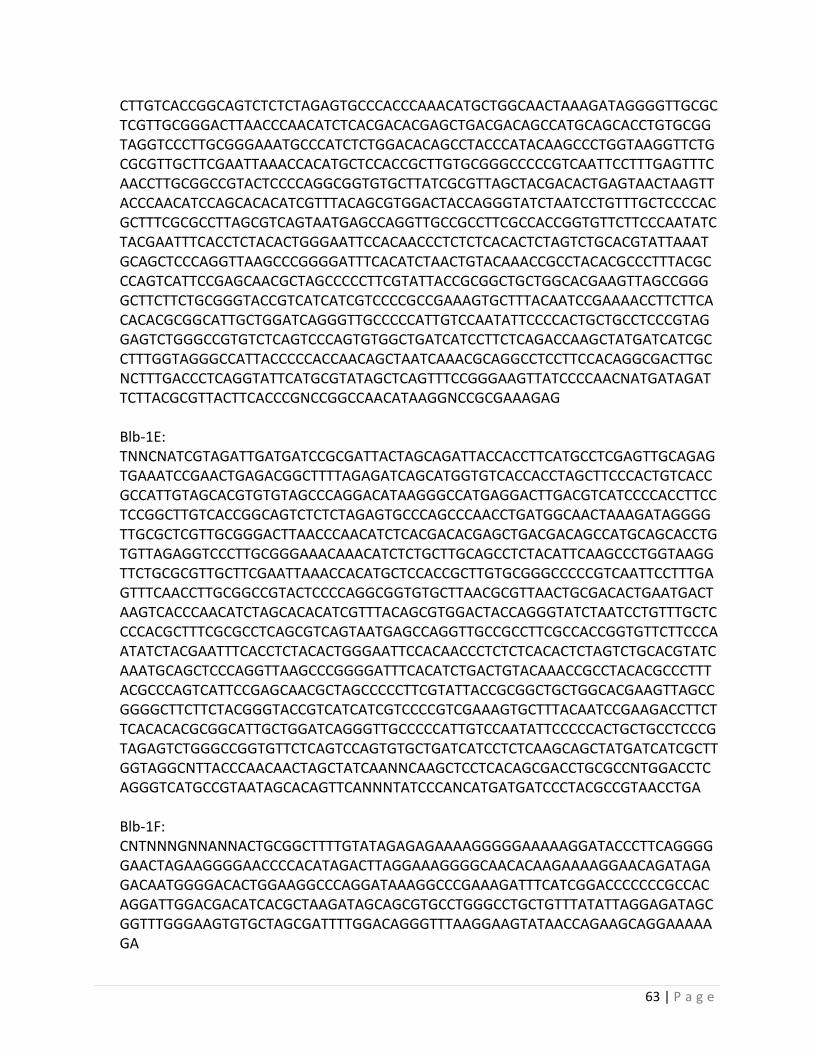
CTTGTCACCGGCAGTCTCTCTAGAGTGCCCACCCAAACATGCTGGCAACTAAAGATAGGGGTTGCGCTCGTTGCGGGACTTAACCCAACATCTCACGACACGAGCTGACGACAGCCATGCAGCACCTGTGCGGTAGGTCCCTTGCGGGAAATGCCCATCTCTGGACACAGCCTACCCATACAAGCCCTGGTAAGGTTCTGCGCGTTGCTTCGAATTAAACCACATGCTCCACCGCTTGTGCGGGCCCCCGTCAATTCCTTTGAGTTTCAACCTTGCGGCCGTACTCCCCAGGCGGTGTGCTTATCGCGTTAGCTACGACACTGAGTAACTAAGTTACCCAACATCCAGCACACATCGTTTACAGCGTGGACTACCAGGGTATCTAATCCTGTTTGCTCCCCACGCTTTCGCGCCTTAGCGTCAGTAATGAGCCAGGTTGCCGCCTTCGCCACCGGTGTTCTTCCCAATATCTACGAATTTCACCTCTACACTGGGAATTCCACAACCCTCTCTCACACTCTAGTCTGCACGTATTAAATGCAGCTCCCAGGTTAAGCCCGGGGATTTCACATCTAACTGTACAAACCGCCTACACGCCCTTTACGCCCAGTCATTCCGAGCAACGCTAGCCCCCTTCGTATTACCGCGGCTGCTGGCACGAAGTTAGCCGGGGCTTCTTCTGCGGGTACCGTCATCATCGTCCCCGCCGAAAGTGCTTTACAATCCGAAAACCTTCTTCACACACGCGGCATTGCTGGATCAGGGTTGCCCCCATTGTCCAATATTCCCCACTGCTGCCTCCCGTAGGAGTCTGGGCCGTGTCTCAGTCCCAGTGTGGCTGATCATCCTTCTCAGACCAAGCTATGATCATCGCCTTTGGTAGGGCCATTACCCCCACCAACAGCTAATCAAACGCAGGCCTCCTTCCACAGGCGACTTGCNCTTTGACCCTCAGGTATTCATGCGTATAGCTCAGTTTCCGGGAAGTTATCCCCAACNATGATAGATTCTTACGCGTTACTTCACCCGNCCGGCCAACATAAGGNCCGCGAAAGAG Blb-1E: TNNCNATCGTAGATTGATGATCCGCGATTACTAGCAGATTACCACCTTCATGCCTCGAGTTGCAGAGTGAAATCCGAACTGAGACGGCTTTTAGAGATCAGCATGGTGTCACCACCTAGCTTCCCACTGTCACCGCCATTGTAGCACGTGTGTAGCCCAGGACATAAGGGCCATGAGGACTTGACGTCATCCCCACCTTCCTCCGGCTTGTCACCGGCAGTCTCTCTAGAGTGCCCAGCCCAACCTGATGGCAACTAAAGATAGGGGTTGCGCTCGTTGCGGGACTTAACCCAACATCTCACGACACGAGCTGACGACAGCCATGCAGCACCTGTGTTAGAGGTCCCTTGCGGGAAACAAACATCTCTGCTTGCAGCCTCTACATTCAAGCCCTGGTAAGGTTCTGCGCGTTGCTTCGAATTAAACCACATGCTCCACCGCTTGTGCGGGCCCCCGTCAATTCCTTTGAGTTTCAACCTTGCGGCCGTACTCCCCAGGCGGTGTGCTTAACGCGTTAACTGCGACACTGAATGACTAAGTCACCCAACATCTAGCACACATCGTTTACAGCGTGGACTACCAGGGTATCTAATCCTGTTTGCTCCCCACGCTTTCGCGCCTCAGCGTCAGTAATGAGCCAGGTTGCCGCCTTCGCCACCGGTGTTCTTCCCAATATCTACGAATTTCACCTCTACACTGGGAATTCCACAACCCTCTCTCACACTCTAGTCTGCACGTATCAAATGCAGCTCCCAGGTTAAGCCCGGGGATTTCACATCTGACTGTACAAACCGCCTACACGCCCTTTACGCCCAGTCATTCCGAGCAACGCTAGCCCCCTTCGTATTACCGCGGCTGCTGGCACGAAGTTAGCCGGGGCTTCTTCTACGGGTACCGTCATCATCGTCCCCGTCGAAAGTGCTTTACAATCCGAAGACCTTCTTCACACACGCGGCATTGCTGGATCAGGGTTGCCCCCATTGTCCAATATTCCCCCACTGCTGCCTCCCGTAGAGTCTGGGCCGGTGTTCTCAGTCCAGTGTGCTGATCATCCTCTCAAGCAGCTATGATCATCGCTTGGTAGGCNTTACCCAACAACTAGCTATCAANNCAAGCTCCTCACAGCGACCTGCGCCNTGGACCTCAGGGTCATGCCGTAATAGCACAGTTCANNNTATCCCANCATGATGATCCCTACGCCGTAACCTGA Blb-1F: CNTNNNGNNANNACTGCGGCTTTTGTATAGAGAGAAAAGGGGGAAAAAGGATACCCTTCAGGGGGAACTAGAAGGGGAACCCCACATAGACTTAGGAAAGGGGCAACACAAGAAAAGGAACAGATAGAGACAATGGGGACACTGGAAGGCCCAGGATAAAGGCCCGAAAGATTTCATCGGACCCCCCCGCCACAGGATTGGACGACATCACGCTAAGATAGCAGCGTGCCTGGGCCTGCTGTTTATATTAGGAGATAGCGGTTTGGGAAGTGTGCTAGCGATTTTGGACAGGGTTTAAGGAAGTATAACCAGAAGCAGGAAAAAGA
63 | P a g e

E. Cider and Juice Flavor Compounds Procedure:
The sampler injected 1 µ𝐿𝐿 of analyte in split mode with the injection port at 230 ˚C. The
total flow was set at 9.5 mL/min and the carrier gas was set at 1.0 mL/min. The oven
temperature was set at 40 ˚C, held at 40 ˚C for 3 minutes, ramped at 12 ˚C/min until 250 ˚C, and
held at 250 degrees for 3 minutes. The detection window started at 3 minutes and ended at 21
minutes.
The prepared internal standards were made with 50 µ𝑔𝑔𝑚𝑚𝑚𝑚
of 4 hydroxy-pentan-2-one, 2-
octanol, and 4-methyl-2-pentanol. Calibration curves were made by recording the peak heights
of the internal standards in ethanol. Concentrations of 100, 75, 67.5, 50, 37.5, 25, and 12.5 µ𝑔𝑔𝑚𝑚𝑚𝑚
of standard were injected and the heights were recorded.
F. Mass Spectrometer Data Recorded for Mainiac Gold Batches 25, 26, and 27
Compound Relative Peak Height
Batch 25 Batch 26 Batch 27
1-Butanol 297735 225102 415447 Acetoin 176821 ND 20626
1-Butanol, 3-methyl- 46106248 27755754 27974916 Sulfuric acid dibutyl ester ND ND 4921633
2,3-Butanediol, [R-(R*,R*)]- 683195 291229 282323 2,3-Butanediol, [R-(R*,R*)]- 142037 108977 121313 Butanoic acid, ethyl ester 72833 32376 269383
Propanoic acid, 2-hydroxy-, ethyl ester, (S)- (Ethyl Lactate) 21603774 1432021 433718
Butanoic acid, 3-methyl- 172899 ND 146180 Pentanoic acid ND 105107 ND
Butanoic acid, 2-methyl- 135214 106131 128744 Butanoic acid, 4-hydroxy- 351318 68402 ND
1-Pentanol, 3-methyl- 71056 ND ND Formic acid, hexyl ester 1719164 679782 1144343
1-Butanol, 3-methyl-, acetate 98777 91903 288741 Butanoic acid, 3-hydroxy-, ethyl ester
(Ethyl Lactate) 51536 ND 50944 Ethyl Acetate ND 168652 111163
64 | P a g e
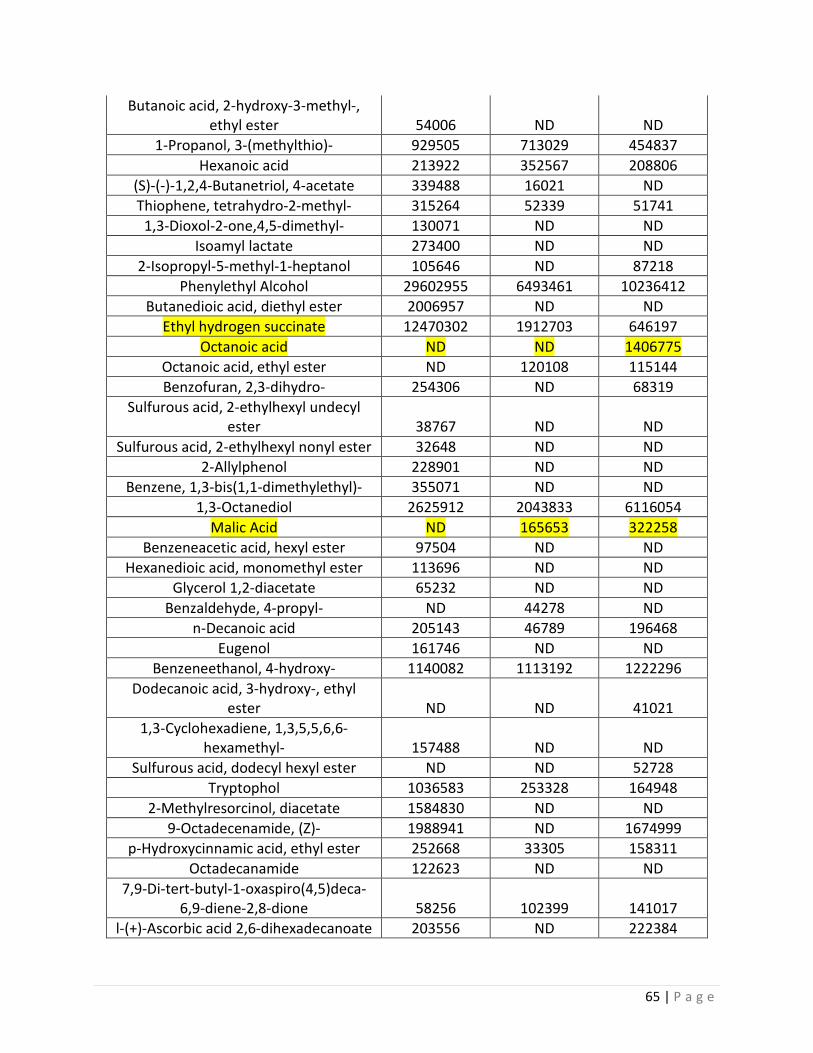
Butanoic acid, 2-hydroxy-3-methyl-, ethyl ester 54006 ND ND
1-Propanol, 3-(methylthio)- 929505 713029 454837 Hexanoic acid 213922 352567 208806
(S)-(-)-1,2,4-Butanetriol, 4-acetate 339488 16021 ND Thiophene, tetrahydro-2-methyl- 315264 52339 51741
1,3-Dioxol-2-one,4,5-dimethyl- 130071 ND ND Isoamyl lactate 273400 ND ND
2-Isopropyl-5-methyl-1-heptanol 105646 ND 87218 Phenylethyl Alcohol 29602955 6493461 10236412
Butanedioic acid, diethyl ester 2006957 ND ND Ethyl hydrogen succinate 12470302 1912703 646197
Octanoic acid ND ND 1406775 Octanoic acid, ethyl ester ND 120108 115144 Benzofuran, 2,3-dihydro- 254306 ND 68319
Sulfurous acid, 2-ethylhexyl undecyl ester 38767 ND ND
Sulfurous acid, 2-ethylhexyl nonyl ester 32648 ND ND 2-Allylphenol 228901 ND ND
Benzene, 1,3-bis(1,1-dimethylethyl)- 355071 ND ND 1,3-Octanediol 2625912 2043833 6116054
Malic Acid ND 165653 322258 Benzeneacetic acid, hexyl ester 97504 ND ND
Hexanedioic acid, monomethyl ester 113696 ND ND Glycerol 1,2-diacetate 65232 ND ND
Benzaldehyde, 4-propyl- ND 44278 ND n-Decanoic acid 205143 46789 196468
Eugenol 161746 ND ND Benzeneethanol, 4-hydroxy- 1140082 1113192 1222296
Dodecanoic acid, 3-hydroxy-, ethyl ester ND ND 41021
1,3-Cyclohexadiene, 1,3,5,5,6,6-hexamethyl- 157488 ND ND
Sulfurous acid, dodecyl hexyl ester ND ND 52728 Tryptophol 1036583 253328 164948
2-Methylresorcinol, diacetate 1584830 ND ND 9-Octadecenamide, (Z)- 1988941 ND 1674999
p-Hydroxycinnamic acid, ethyl ester 252668 33305 158311 Octadecanamide 122623 ND ND
7,9-Di-tert-butyl-1-oxaspiro(4,5)deca-6,9-diene-2,8-dione 58256 102399 141017
l-(+)-Ascorbic acid 2,6-dihexadecanoate 203556 ND 222384
65 | P a g e

Dibutyl phthalate 369237 195375 220541 Hexadecanamide 458409 ND ND
Benzaldehyde, 4-propyl- ND 44278 ND Phenol, 2-methoxy-3-(2-propenyl)- ND 49592 ND
3-Hydroxy-.beta.-damascone 63894 74110 ND n-Nonadecanol-1 ND 881269 ND
2,5-Diacetoxytoluene 153566 ND ND Nonadecanamide ND 232825 ND
Hexadecanal ND 110517 43568 Nonadecanenitrile ND 97628 ND
4-Cyanobenzoic acid, undecyl ester ND ND 186308 Tyramine, N-formyl- 63960 ND 175154
Butanoic acid, cyclopentyl ester ND ND 40117
G. Mainiac Mac Changes of the Flavor Profile
Compound Relative Peak Height
Man Mac Juice
Man Mac Hard Cider
1-Butanol, 3-methyl- 258415 ND 1-Butanol, 2-methyl- acetate 177524 ND
1-Butanol ND 195005 Acetoin ND 350548
1-Pentanol ND 23865019 Hexanal 28084 ND
Acetic acid, butyl ester 85697 ND 2-Hexenal, (E)- 163299 ND
2-Hexen-1-ol, (E)- 56690 ND Formic acid, hexyl ester (Hexyl
Acetate) 261876 746773 2,3-Butanediol, [R-(R*,R*)]- ND 398679
2,3-Butanediol ND 109392 Phenylethyl Alcohol 6241440 6006622
Sorbic Acid 25924284 351132 Benzene, 1,3-bis(1,1-dimethylethyl)- 1056500 ND
4-Ketopimelic 19928 ND 1,3-Octanediol 589511 3893463
Benzaldehyde, 4-propyl- 82577 ND Benzene, (1-butylhexadecyl)- 141733 ND
1-Dodecanol, 2-hexyl- 139482 185648 Dodecanoic acid, 1-methylethyl ester 32999 ND
66 | P a g e

(isoamyl laurate) 1-Dodecanol, 2-hexyl- 150484 84322
n-Nonadecanol-1 1759546 2140295 Sulfurous acid, butyl decyl ester 246429 ND
9-Octadecenamide, (Z)- 3626593 1425581 7,9-Di-tert-butyl-1-oxaspiro(4,5)deca-
6,9-diene-2,8-dione 197811 ND l-(+)-Ascorbic acid 2,6-
dihexadecanoate 722856 886111 Hexadecanal 349306 377392
Nonadecanenitrile 174628 242479 Sulfurous acid, octadecyl 2-propyl
ester 241586 ND Glycerol 1-palmitate 492926 ND
Squalane 334038 ND n-Tetracosanol-1 2066365 2923719 Dodecanoic acid ND 61749
Octanoic acid ND 917140 Octanoic acid, ethyl ester ND 51159
Hexanoic acid ND 327219 3-Hexenoic acid, (E)- ND 83995
Butanoic acid ND 55322 (S)-Isopropyl lactate ND 111905
Bis(tridecyl) phthalate ND 304774 1-Propanol, 3-(methylthio)-phen ND 402625
2,5-Cyclohexadiene-1,4-dione, 2,6-bis(1,1-dimethylethyl)- ND 100944
1-Butanol, 3-methyl-, acetate (isoamyl actetate) ND 98664
2-(2-Methoxyethoxy)ethyl acetate ND 25986 Ethyl Acetate ND 200499
Thiophene, tetrahydro-2-methyl- ND 75089 1,5-Hexanediol ND 372770
Malonic acid, 2-ethylbutyl octyl ester ND 38675 Malic Acid ND 526148
Benzaldehyde, 4-propyl- ND 102832 Oxalic acid, ethyl 2-phenylethyl ester ND 306441 Oxalic acid, 2-phenylethyl tetradecyl
ester ND 370297 p-Hydroxycinnamic acid, ethyl ester ND 148628
s-Triazine, 2-amino-4-(piperidinomethyl)-4-piperidino- ND 293759
67 | P a g e

E-2-Tetradecen-1-ol ND 273062 2-(1,1-Dimethylethyl)-5-oxohexanal ND 227103
68 | P a g e

H. Cranberry-Golden Delicious juice and Cranberry-Mainiac Gold
Compound Relative Peak Heights
Cran-MG
Juice
Cran-MG Hard Cider
1-Butanol, 2-methyl- 73790 ND Acetoin 776812 176821
1-Butanol ND 297735 1-Butanol, 3-methyl- ND 46106248
2,3-Butanediol, [R-(R*,R*)]- ND 683195 2,3-Butanediol, [R-(R*,R*)]- ND 142037
2-Hexenal, (E)- 153957 ND Propanoic acid, 2-hydroxy-, ethyl ester,
(S)- (Ethyl Lactate)
ND 21603774 Butanoic acid, ethyl ester 86717 72833 Butanoic acid, 3-methyl- ND 172899 Butanoic acid, 4-hydroxy- ND 351318
Butanoic acid, 3-hydroxy-, ethyl ester ND 51536 Butanoic acid, 2-hydroxy-3-methyl-,
ethyl ester
ND 54006 Formic acid, hexyl ester (hexyl acetate) 332524 1719164 1-Butanol, 3-methyl-, acetate (isoamyl
acetate)
ND 264439 1-Butanol, 2-methyl-, acetate 70392 ND
(S)-(-)-1,2,4-Butanetriol, 4-acetate ND 339488 Sorbic Acid 25324406 37729570
1-Propanol, 3-(methylthio)- ND 929505 Hexanoic acid ND 430534
4-Hexenoic acid ND 94003 Benzoic acid 1985448 ND
Thiophene, tetrahydro-2-methyl- ND 315264 1,3-Dioxol-2-one,4,5-dimethyl- ND 130071
2-Isopropyl-5-methyl-1-heptanol ND 30053 Phenylethyl Alcohol ND 29602955
Isoamyl lactate ND 273400 Thiophene, tetrahydro-2-methyl- ND 315264
Butanedioic acid, diethyl ester ND 2006957 Ethyl hydrogen succinate ND 12470302
Benzene, 1,3-bis(1,1-dimethylethyl)- 1175231 355071 1,3-Octanediol 2188913 2625912
Benzofuran, 2,3-dihydro- ND 254306
69 | P a g e

2-Allylphenol ND 228901 Benzaldehyde, 4-propyl- 96055 ND
Benzeneacetic acid, hexyl ester ND 97504 Hexanedioic acid, monomethyl ester ND 113696
Sulfuric acid dibutyl ester ND 5637635 1-Propanol, 2-methyl- ND 84329
Acetic acid, hydrazino-, ethyl ester ND 93615 Ethyl Acetate ND 88689
Formic acid, 2-methylpentyl ester ND 41421 Benzyl alcohol ND 44945
1-Dodecanol, 3,7,11-trimethyl- ND 364106 m-Toluic acid, phenyl ester ND 388889
Phenol, 4-ethyl- ND 179110 Dodecanoic acid, 1-methylethyl ester
(isoamyl laurate)
18202 37137 Malic Acid ND 269236
5-Isopropyl-3,3-dimethyl-2-methylene-2,3-dihydrofuran
ND 122883
2-Isopropyl-5-methyl-1-heptanol ND 190009 1-Decanol, 2-hexyl- ND 195297
1,4-Diacetyl-3-acetoxymethyl-2,5-methylene-l-rhamnitol
ND 85599
n-Decanoic acid ND 196759 Benzene, [(methoxymethoxy)methyl]- ND 57473
n-Nonadecanol-1 1842111 ND 9-Octadecenamide, (Z)- 1001088 683134
Tryptophol ND 200119 11-Methyldodecanol ND 118455
Hexadecanal 320694 ND Squalane 266966 ND
n-Heptadecanol-1 402387 ND Nonadecanenitrile 167493 ND
Sulfurous acid, pentadecyl 2-propyl ester
243495 ND
n-Tetracosanol-1 2123439 ND n-Decanoic acid ND 196759
Decanoic acid, ethyl ester ND 15978 Benzeneethanol, 4-hydroxy- ND 256049
Carbonic acid, ethyl cyclohexyl ester ND 74971 Phenol, 2,4-bis(1,1-dimethylethyl)- ND 177482
11-Methyldodecanol ND 99661 1-Dodecanol, 2-hexyl- ND 155158
70 | P a g e

Tyramine, N-formyl- ND 70077 4-Methyl-2,5-dimethoxybenzaldehyde ND 49179 Dodecanoic acid, 1-methylethyl ester
(isoamyl laurate)
ND 37137 3-Hydroxy-.beta.-damascone ND 64070
Sulfurous acid, octadecyl 2-propyl ester ND 42139 1-Ethyl-7-methyl-4-oxo-1,4-
dihydro[1,8]naphthyridine-3-carboxylic acid, methyl ester
ND 72145 Tryptophol ND 200119
11-Methyldodecanol ND 118455 p-Hydroxycinnamic acid, ethyl ester ND 75870 Decanoic acid, 9-oxo-, methyl ester ND 77278
l-(+)-Ascorbic acid 2,6-dihexadecanoate ND 415698 Dibutyl phthalate ND 304533
1-Dodecanol, 2-octyl- ND 110124 Disulfide, di-tert-dodecyl ND 241283
Ditetradecyl ether ND 109055 Formamide, N-{4-[2-(1,1-
dimethylethyl)-5-oxo-1,3-dioxolan-4-yl]butyl}
ND 147633 Tricyclo[4.3.1.1(2,5)]undec-3-en-10-
one, 3-methyl-, (1.alpha.,2.beta.,5.beta.,6.alpha.)-
ND 242268 Octadecanamide ND 405216
71 | P a g e

I. Ammonia Nitrogen (AN) Test Procedure
Materials: • UV Spectrometer - HP Agilent 8453 UV-visible Spectroscopy System • Yeast Assimilable Nitrogen Test Kit from Vintessentials (30 tests) • Ammonia Test • Primary Amino Acid Nitrogen • 1 cm cuvette (quartz cell) • Juice samples • Target 2 Cellulose Acetate Syringe Filter • 5-dram vials
Ammonia Test Kit • Buffer • Nicotinamide adenosine dinucleotide (NADH) • Glutamate dehydrogenase (GIDH) • Standard
Operation Parameters:
Samples for ammonia are tested under a wavelength of 340 nm in the UV spectrometer. The tests are conducted at room temperature (20-25C).
Safety Precautions:
Wear Safety goggles Do not ingest buffer or standard (contains sodium azide as a stabilizer)
Procedure: 1. Filter cider juice with Target 2 Cellulose Acetate Syringe Filter 2. To prepare for absorbance 1 prototypes pipette the following volumes of reagents into
the vials: Reagent Blank Standard Juice Sample Buffer 1 mL (1000 μl) 1 mL (1000 μl) 1 mL (1000 μl) NADH 0.10 mL (100 μl) 0.10 mL (100 μl) 0.10 mL (100 μl) Distilled Water 2 mL (2000 μl) 1.90 mL (1900 μl) 1.90 mL (1900 μl) Juice None None 0.10 mL (100 μl) Standard None 0.10 mL (100 μl) None
3. Mix well and wait about 5 minutes 4. Pipette blank mixture into 1 cm cuvette and place into spectrometer 5. Set wavelength to 340 nm in spectrometer and click on “blank” in Chem Station
software 6. The absorbance is not given when you click blank therefore click on “sample” to obtain
the absorbance 1 value (A1) of the blank sample 7. Place blank mixture back into its vial 8. Clean cuvette with Kim wipes and distilled water 9. Pipette standard mixture into cuvette and place into spectrometer
72 | P a g e

10. Click on “sample” and collect standard absorbance value (A1) 11. Repeat with sample juice mixture 12. To prepare absorbance 2 samples, recreate the blank and standard prototypes from the
table above (absorbance 1). 13. Add GIDH amounts (from table below) into appropriate recreated blank and standard
vials– these are made in separate vials to be reused 14. Prepare juice sample model absorbance 2 by adding 0.02 mL of GIDH to the vial with
mixture from absorbance 1 Reagent Blank Standard Juice Sample
GIDH 0.02 mL (20 μl) 0.02 mL (20 μl) 0.02 mL (20 μl)
15. Mix well and wait for about 20 minutes before recording absorbance 2, A2 16. Pipette mixtures into cuvette and place cuvette into uv spectrometer to record the
absorbance, A2
73 | P a g e

J. Primary Amino Acid Nitrogen (PAAN) Test Procedure:
Materials: • UV Spectrometer - HP Agilent 8453 UV-visible Spectroscopy System • Yeast Assimilable Nitrogen Test Kit from Vintessentials (30 tests) • Ammonia Test • Primary Amino Acid Nitrogen • 1 cm cuvette (quartz cell) • Juice samples • Target 2 Cellulose Acetate Syringe Filter • 5-dram vials
Primary Amino Acid Nitrogen • Buffer • N-acetyl-L-cysteine (NAC) • Ortho- phthaldialdehyde (OPA)
Operating Parameters:
Samples for primary amino acid nitrogen are tested under a wavelength of 335 nm in the UV spectrometer. The tests are conducted at room temperature (20-25C).
Safety Precautions:
Wear safety glasses Be careful handling the buffer because it is alkaline Reagent 4, ethanol, is flammable Do no ingest the standard (contains sodium azide as a stabilizer)
Procedure:
1. Pipette the following volumes of reagents into cuvettes: Reagent Blank Standard Sample Buffer 2 mL (2000 μl) 2 mL (2000 μl) 2 mL (2000 μl) NAC 0.90 mL (900 μl) 0.90 mL (900 μl) 0.90 mL (900 μl) Distilled Water 0.05 mL (50 μl) None None Juice Sample None None (50 μl) 0.05 mL (50 μl) Standard None 0.05 mL None
2. Pipette blank mixture into 1 cm cuvette and place into spectrometer 3. Set wavelength to 335 nm in spectrometer and click on “blank” in Chem Station
software 4. The absorbance is not given when you click blank therefore click on “sample” to obtain
the absorbance 1 value (A1) of the blank sample 5. Place blank mixture back into its vial 6. Clean cuvette with Kim wipes and distilled water 7. Pipette standard mixture into cuvette and place into spectrometer 8. Click on “sample” and collect standard absorbance value (A1)
74 | P a g e

9. Repeat with sample juice mixture 10. Add bottle No.4 (Ethanol) to OPA and mix this to dissolve the solution 11. To prepare absorbance 2 samples, recreate the blank and standard prototypes from the
table above (absorbance 1). 12. Add OPA amounts (from table below) into appropriate recreated blank and standard
vials– these are made in separate vials to be reused
13. Prepare juice sample model absorbance 2 by adding 0.10 mL of OPA to the vial with mixture from absorbance 1
14. Mix well and wait for about 10 minutes before recording absorbance 2, A2 15. Pipette mixtures into cuvette and place cuvette into uv spectrometer to record the
absorbance, A2
Reagent Blank Standard Sample OPA 0.10 mL (100 μl) 0.10 mL (100 μl) 0.10 mL (100 μl)
75 | P a g e

K. YAN Value Calculations
Ammonia Test:
Net Absorbance, AN = A1 – A2 (calculate this for blank, standard, and sample)
Sample Corrected Absorbance, AC1 = Sample AN – Blank AN
Standard Corrected Absorbance, AC2 = Standard AN – Blank AN
Add: AC1 + AC2 = Ac
Ammonia concentration:
Ammonia (mg/L) = AC x 84.3 x Dilution Factor [1]
Ammonia Nitrogen (AN):
AN (mg/L) = Ammonia (mg/L) x 0.82
Primary Amino Acid Nitrogen Test:
Net Absorbance, AN = A1 – A2 (calculate this for blank, standard, and sample)
Sample Corrected Absorbance, AC1 = Sample AN – Blank AN
Standard Corrected Absorbance, AC2 = Standard AN – Blank AN
Add: AC1 + AC2 = Ac
Primary Amino Acid Nitrogen (PAAN):
PAAN (mg N/L) = AC x 130 x Dilution Factor [1]
YAN: YAN = PAAN + AN
76 | P a g e

L. Pressure Drop versus Flux Analysis
1. Record the inlet pressure (P1) and outlet filtrate pressure gauge (P2) readings and
the time the pressure readings were taken at.
2. In order to calculate the flux, Hagen-Poiseuille equation was used, since the
membrane has a number of parallel cylindrical pores. Hagen-Poiseuille equation is
defined as:
The membrane thickness was 0.7 meters and the surface porosity was 0.2 microns.
3. A data sheet on Excel was used to collect the pressures, flux, and time as seen in the
table below. In the Excel file the Hagen-Poisuille equation was inserted to calculate
the flux at a certain pressure drop and time.
77 | P a g e

A data graph of pressure drop versus flux was constructed to better analyze the data. First,
water was used in the crossflow filter to obtain a better understanding of the filter’s
performance. After using water, hard cider was fed into the system. This was used to determine
when the filtration performance declined while running hard cider. The only variable that
changed between the water and hard cider was liquid viscosity.
78 | P a g e

M. Aspen Crossflow Filter Model Procedure
1. A crossflow filter was specified in ASPEN V.8.2.
2. Information on the inlet pressure and flowrate were specified. Inlet pressure ranged
1.2 - 2.0 bar.
3. Specifications of the Ricker Hill crossflow were entered into ASPEN.
4. Pressures and flowrates were the variables manipulated to see what was the most
efficient and rapid filtration.
5. Simulation was run in order to obtain results on how the crossflow filter performed.
79 | P a g e

N. Aspen Crossflow Input Files
This is only for one simulation but every other simulation is basically the same all that was
changed was the flowrate and pressure to see how efficient the filter could be.
O. ;
P. ;Input Summary created by Aspen Plus Rel. 28.0 at 14:35:43 Mon Apr 27, 2015
Q. ;Directory R:\CrossfloFilter_1 Filename
C:\Users\DGONZA~1\AppData\Local\Temp\48\~ap4cde.txt
R. ;
S.
T.
U. PROP
V.
W.
X. IN-UNITS MET PRESSURE=bar TEMPERATURE=C DELTA-T=C PDROP=bar &
Y. INVERSE-PRES='1/bar'
Z.
AA. SIM-OPTIONS MASS-BAL-CHE=YES
BB.
CC. DATABANKS 'APV82 PURE28' / 'APV82 AQUEOUS' / 'APV82 SOLIDS' / &
DD. 'APV82 INORGANIC' / 'APV82 ASPENPCD' / 'APV82 BIODIESEL' &
EE. / 'APV82 COMBUST' / 'APV82 ELECPURE' / 'APV82 EOS-LIT' &
FF. / 'APV82 ETHYLENE' / 'APV82 HYSYS' / 'APV82 INITIATO' &
80 | P a g e
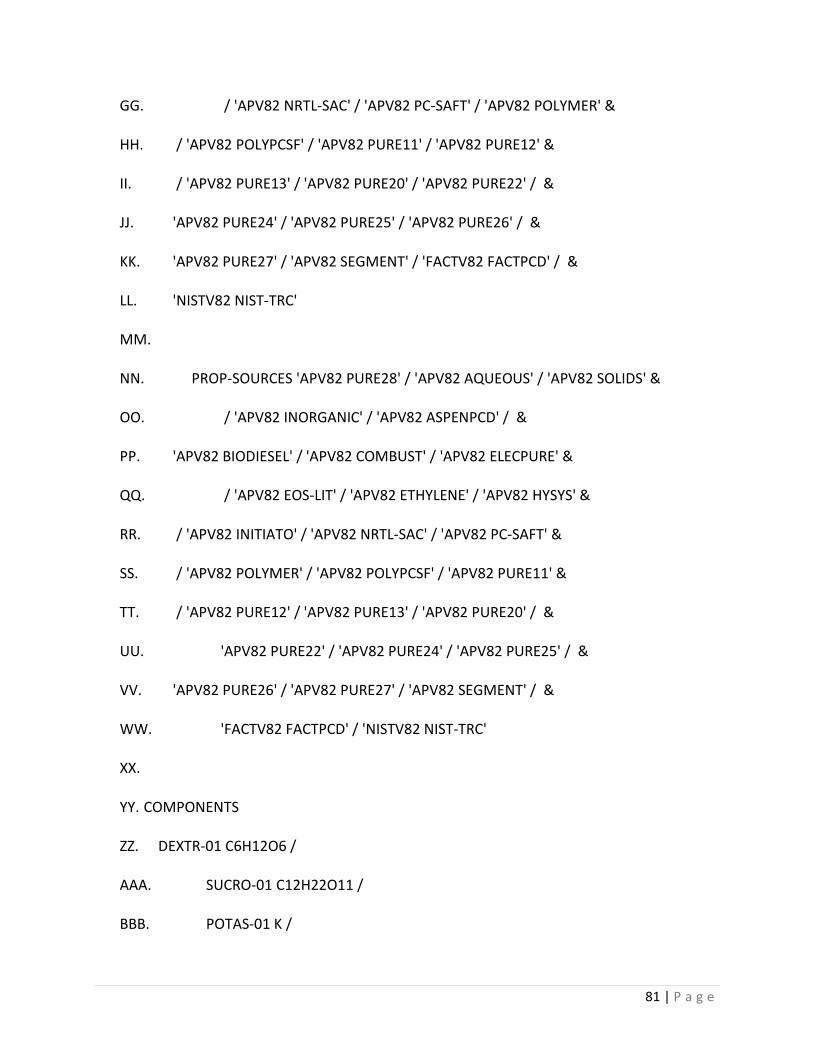
GG. / 'APV82 NRTL-SAC' / 'APV82 PC-SAFT' / 'APV82 POLYMER' &
HH. / 'APV82 POLYPCSF' / 'APV82 PURE11' / 'APV82 PURE12' &
II. / 'APV82 PURE13' / 'APV82 PURE20' / 'APV82 PURE22' / &
JJ. 'APV82 PURE24' / 'APV82 PURE25' / 'APV82 PURE26' / &
KK. 'APV82 PURE27' / 'APV82 SEGMENT' / 'FACTV82 FACTPCD' / &
LL. 'NISTV82 NIST-TRC'
MM.
NN. PROP-SOURCES 'APV82 PURE28' / 'APV82 AQUEOUS' / 'APV82 SOLIDS' &
OO. / 'APV82 INORGANIC' / 'APV82 ASPENPCD' / &
PP. 'APV82 BIODIESEL' / 'APV82 COMBUST' / 'APV82 ELECPURE' &
QQ. / 'APV82 EOS-LIT' / 'APV82 ETHYLENE' / 'APV82 HYSYS' &
RR. / 'APV82 INITIATO' / 'APV82 NRTL-SAC' / 'APV82 PC-SAFT' &
SS. / 'APV82 POLYMER' / 'APV82 POLYPCSF' / 'APV82 PURE11' &
TT. / 'APV82 PURE12' / 'APV82 PURE13' / 'APV82 PURE20' / &
UU. 'APV82 PURE22' / 'APV82 PURE24' / 'APV82 PURE25' / &
VV. 'APV82 PURE26' / 'APV82 PURE27' / 'APV82 SEGMENT' / &
WW. 'FACTV82 FACTPCD' / 'NISTV82 NIST-TRC'
XX.
YY. COMPONENTS
ZZ. DEXTR-01 C6H12O6 /
AAA. SUCRO-01 C12H22O11 /
BBB. POTAS-01 K /
81 | P a g e

CCC. MALIC-01 C4H6O5-D1 /
DDD. WATER H2O /
EEE. ETHAN-01 C2H6O-2
FFF.
GGG. PROPERTIES UNIFAC
HHH. PROPERTIES UNIQUAC
III.
JJJ. PROP-DATA UNIQ-1
KKK. IN-UNITS MET PRESSURE=bar TEMPERATURE=C DELTA-T=C PDROP=bar &
LLL. INVERSE-PRES='1/bar'
MMM. PROP-LIST UNIQ
NNN. BPVAL WATER ETHAN-01 -2.493600000 756.9477000 0.0 0.0 &
OOO. 24.99000000 100.0000000 0.0
PPP. BPVAL ETHAN-01 WATER 2.004600000 -728.9705000 0.0 0.0 &
QQQ. 24.99000000 100.0000000 0.0
RRR. ;
SSS. ;
TTT. ;
UUU. ;
VVV. ;
82 | P a g e