improving feed management for profit - nsw department … · differences in dm yield between...
TRANSCRIPT


DairyCHECK – Improving Feed Management for Profits
1
Foreword 5
WHAT is DairyCHECK? 6
Feed Management Booklet 7
Introduction 8
Feed Management Checklist and KPI’s 9
SECTION 1: PASTURE PRODUCTION AND UTILISATION 10
Background 10Challenges 10Pasture grown 10
• Soil moisture 10• Drainage 10• Soil fertility 11• Pasture species 11• Grazing Management – or pasture utilisation 11
Pasture Utilisation 11• Stocking rate (calvers/milking area) 11• Milk from pasture (litres/ha) 12• Pasture costs 12
“Making a Difference” 12• Seasonal or batch calving 12• Realistic production/cow 13• Increase stocking rates 13• Grow more pasture 13• Better grazing management 14• Daily feed allocation 14
Planning Change 15Form 1a 15, 16Form 1b 17Form 1c 18Form 1d 19
Table of Contents
DairyCHECK – Improving Feed Management for Profits
2
SECTION 2: SUPPLEMENTING PASTURES FOR PROFIT 20
Background 20
Challenges 20
Balancing Pasture 20• Pasture Quality 20• Correcting imbalances 22• Stock intake 23• Strategic use of supplements 23
“Making a Difference” 23
Responses to Supplements 24• Milk responses 24• Substitution 24
Whole lactation performance 25• Nutrition and fertility 25• Transition feeding 25• Heat stress 26• Milk composition 28
“Making a Difference” 28
Planning Change 30Form 2a 30Form 2b 31Form 2c 32Form 2d 33, 34

DairyCHECK – Improving Feed Management for Profits
3
SECTION 3: PROFITABLE PASTURE SYSTEMS 35
Background 35
Challenges 35
Cost Effective Technology 35• Seasonal and batch Calving 35• Identify the Economics of Feeding 36• Cost Effective Supplements 40
Productivity and Profitability 40• Reduced Pasture Costs 40• Grain versus Fertiliser 41
Partial Budgets for different scenarios 42• Using Partial budgets 42• Importance of pasture and feed management 44
“Making a Difference” 45
Planning Change 47Form 3a 47Form 3b 48Form 3c 49Form 3d 50
DairyCHECK – Improving Feed Management for Profits
4
TERMS USED IN THIS BOOKLET
After grazing residue [post-grazing residue]. The amount (kgDM/ha) or heightof stubble (cm) remaining after stock have finished grazing. It is an indication ofgrazing intensity.
Batch calving. As for seasonal calving but at 2 or 3 times of the year.
Concentrates. Usually grain or proprietary pellets.
Daily feed allocation. Amount of feed allocated each day and its components.
Dry matter. All feeds are usually expressed on a DM basis, ie all moisture wasremoved. This allows valid comparisons between feeds unconfounded by %moisture.
Flat rate feeding. Cows are fed at the same rate of concentrate or supplementirrespective of pasture available but the amount may vary in relation to stage oflactation of cows.
Grazing duration [occupation time] (days). Period over which stock arepermitted to graze the same pasture.
Grazing rotation [grazing interval] (days). Period between the commencementof one grazing and the next.
Irrigation application rate (mm). Amount of water applied at each irrigationevent.
Irrigation frequency [irrigation interval] (days). Time between one irrigationevent and the next.
Pasture utilisation (kgDM/ha) Amount of pasture used either by grazing stockor conserved as silage or hay.
Seasonal calving. When cows calve over a restricted period (4-12 weeks) in aparticular season in an attempt to match feed requirements with pasture growth.
Stocking rate (stock units/ha). The number of animals on a given area, usuallyinferred to be per annum.
Strategic feeding. Supplement/concentrate are fed in relation to pastureavailability and stage of lactation.
Supplements. Includes concentrates, conserved fodder (silage or hay) and by-products.
Temperate pastures (C3 pastures). Includes ryegrass, prairie grass, fescue,white clover and other clovers, oats and lucerne.
Tropical pastures (C4 pastures). Includes kikuyu, setaria, paspalum,rhodes grass.

DairyCHECK – Improving Feed Management for Profits
5
ForewordChange is occurring at a rapid rate in the NSW dairy industry due to the cost-price squeeze associated with reduced milk prices and increasing costs ofproduction.
Many farmers, wishing to stay in the industry are at the crossroads, having tomake major decisions on ways to improve farm productivity and profitability.
It is difficult to speculate on future milk prices but the cost of production andliving expenses suggest that we will need to continually challenge existing herdsizes and profit margins per hectare and per farm.
Lower milk prices suggest that gradual change will not be the complete answerand productivity gains will have to be made at even faster rates and greateramounts than in the past.
It has been estimated that we will have a shrinking industry when it comes to thenumber of farms, however, in terms of the production per farm and the adoptionof new technology, dairying in NSW will continue to be a growth industry.
A common factor will be the need to increase the effectiveness of existingoperations to reduce costs then consider ways to graze and milk larger herds toimprove total farm income. This will involve close examination of the key driversof profit ie herd, shed, feed, labour and farm management.
Alex AshwoodDairyCHECK Coordinator.
Acknowledgements:The DairyCHECK Planning Team and Regional Extension Teams appreciatethe support of Dairy Industry Development Corporation (DIDCo), the Sub TropicalDairy Program (SDP) and NSW Dairy Farmers Association and the fundsprovided by NSW Agriculture and the Farmgate Deregulation AssistanceCommittee.
We also thank the various resource people, including Bird Cameron (RuralManagement Services) who have assisted in providing technical information andwillingly provided advice.
Most importantly, appreciation is shown for the typing provided by Wendy Dingle,NSW Agriculture, Wollongbar.

DairyCHECK – Improving Feed Management for Profits
6
WHAT IS DAIRYCHECK?
DairyCHECK is about farmers selecting the most appropriate technology and farmmanagement to improve the overall profitability of their farm.
The project comprises of three stages:
Stage 1 – Farm Management Audit - using a “Checklist” todetermine management opportunities for your farm by:
• Calculating the impact of deregulation on farm income• Knowing the strengths and opportunities of your farm• Identifying financial and physical key performance indicators• Examining ways to improve profits
Stage 2 – Farm Business Management - using various tools andpackages to determine the best ways to optimise the use ofresources by:
• Understanding the financial and physical performance of your farm• Identifying your goals and needs• Considering ways to be profitable• Analysing farm profits and performance
Stage 3 – Profitable Production System - using the most up-to-date knowledge and skills to develop and introduce newtechnology and different production systems by:
• Examining different production scenarios• Identifying and analysing cost effective technology• Planning the implementation of different systems• Analysing future options and alternatives to improve profits.

DairyCHECK – Improving Feed Management for Profits
7
FEED MANAGEMENT BOOKLET
This booklet looks at feed management to improve farm profitability.
Key pasture management areas to improve profits
• How important is increased pasture production• The importance of converting grass to milk• What are the opportunities to improve pasture management• What do you need to change?
Key feed management areas to improve profits.
• Balancing pasture imbalances• Improving response to supplements• Whole lactation management• What do you need to change?
Key factors to profitable pasture systems
• Cost effective systems• Farm profitability and productivity• Partial budgets for different scenarios• What do you need to change?
This DairyCHECK Feed Management Booklet provides some key managementareas and key performance indicators to help you achieve higher levels of profitfrom pasture based systems.
The booklet will hopefully be an introduction to other feed management packages,and decision support systems available through your participation in DairyCHECK.
This self-help booklet on Feed Management to improve profits was compiled by:
Bill Fulkerson – NSW Agriculture, WollongbarRobin Dobos – NSW Agriculture, ArmidaleBrad Granzin – NSW Agriculture, WollongbarKerry Moore – NSW Agriculture, KyogleAndrew Alford – NSW Agriculture, BerryAlex Ashwood – NSW Agriculture, Wollongbar
STEP ONE
STEP TWO
STEP THREE
DairyCHECK – Improving Feed Management for Profits
8
INTRODUCTION
Profitable pasture-based systems require better pasture production, forage utilisationand feed management.
Suitable production systems and larger herds are seen as an opportunity to reducethe costs of production and increase productivity and profits.
The key feed management areas that will make a “real difference” to the viabilityand competitiveness of your farm include:
• Improved pasture availability and utilisation through: -• Better use of resources to produce pasture• Improved pasture and grazing management
• Increased milk production per farm and per hectare through: -• Improved feed allocation• Strategic feeding of supplements
• Profit focussed dairying: -• Management goals based on the best economic information available• Adoption of appropriate cost effective technology
Feed is the major variable cost of production and the efficiency of feedmanagement has a major influence on profits.
This booklet examines ways to improve profits through high pasture production andstrategic use of supplements to cost effectively convert pastures into profitable milkproduction.

DairyCHECK – Improving Feed Management for Profits
9
FEED MANAGEMENT CHECKLIST
The following checklist allows you to examine your performance compared to KeyPerformance Indicators (KPI) achievable on commercial farms.
Checklist KPI My farm Action Things to consider
Range OK ( ) Check(?)
Stocking rate • Agistment of drys &replacements
(cows/ha) • Level of pasture protectionIrrigated 2.5–5.0 • Farm layout
• Grazing management• Pasture monitoring
Non-irrigated 1.0–1.5 • Feed allocation
Milk from pasture • Grazing management(litres/ha) • Fodder conservation
• Fertiliser program• Soil fertility &pH
Irrigated 10000– • Irrigation scheduling13500 • Pasture management
Non-irrigated 4000– • Pasture production8000 • Stocking rate
• Pasture utilisation
Conserved feed • Type of conserved feed(tDM/cow/year) • Pasture production
• Grazing managementIrrigated 0.3–0.5 • Feed planning
• Nutritional deficienciesNon-irrigated 1.0–1.5
Concentrates fed • Types of concentrate(t/cow/year) • Animal requirements
• Pasture availabilityIrrigated 0.7–1.2 • Balanced rationsNon-irrigated 1.0–1.5
Total feed costs <10 • All the above facts(cents/litre)
Note 1: An irrigated farm is where full use of irrigation is made on at least 1/3 of the farm. Non irrigated may use irrigationon small areas or intermittently. Consideration should be given to number of calvers, rather than milkers, and total area,not milking areas to obtain a better picture of potential to improve performance.

DairyCHECK – Improving Feed Management for Profits
10
SECTION 1
Pasture Production andUtilisation
BACKGROUND
Many dairy farms utilise less that 4t dry matter (DM)/ha on the farm as a whole withryegrass pastures growing over 8 t DM/ha and kikuyu pastures producing 10t DM/ha. However, well managed irrigated temperate pastures can produce 15t DM/ha,and kikuyu pastures can produce at least 16t DM/ha of quality pasture depending onmoisture and fertiliser management.
High pastures costs are not necessarily due to input costs (irrigation, fertiliser) butlow levels of pasture utilisation.
CHALLENGES
The major issue to address on most farms is to improve pasture production andutilisation.
PASTURE GROWN
A combination of management components influences the amount of pasture grown.There is little point in improving one area of management eg irrigation, if other areassuch as grazing management are limiting utilisation.
Soil moisture
• Irrigation.The application rate and timing of irrigation should be related to root depthwith ryegrass roots limited to using moisture in the top 15-20mm of soil.This means an interval of 4 to 7 days in late spring to 14 days in mid-winter. Differences in DM yield between average and well managedirrigation can be more than double.
Drainage
This involves 3 issues:• Feed out area (feed pad) to keep stock off wet areas of pasture• Conserved fodder to feed out when stock need to be deferred from grazing• Drainage to get stock back onto pastures as soon as possible
Research has shown that moderate waterlogging of ryegrass pastures will reduceyields by 20% but even moderate pugging of such pastures by stock will reduceyields to 30-35%.

DairyCHECK – Improving Feed Management for Profits
11
Soil fertility
Use soils tests to look at trends in soil nutrients over time to examine the effectivenessof your fertiliser program. The fertiliser program should be based on an estimate ofnutrients removed off the paddock. This will be primarily determined by stocking rate,supplements brought in and grazing management practices.
Pasture species
The mix of annual and perennial ryegrass, prairie grass, kikuyu, brassicas, maize andother pastures and crops depends on water availability and feed requirements.Variation between the best varieties within species are small, with most gains to bemade by improved management.
Grazing management – or pasture utilisation
Every pasture species has a management system which optimises its growth andutilisation. Pasture and grazing management influences the level of supplementationrequired, the intake by milking cows and the overall productivity and profitability ofyour farm (ie milk/ha and margin/ha).
PASTURE UTILISATION
Good indicators of pasture utilisation are stocking rate, milk from pasture, supplementsfed and the cost of pastures.
Stocking rate (calvers/milking area)
With an average stocking rate of 1 cow/ha for the milking area and 4500-5000 litresmilk/ha, there is tremendous potential to improve the milk produced from pastures.
The effect of increases in pasture grown and utilised on farm production is shown inTable 1.
Table 1: Improving milk production/ha and reducing pasture costs
Feed grown Feed used Feed Stocking rate Pasture costs Extra milk Extra milk(kg/DM/ha) (%) consumed (cows/ha) (litres/ha) ($ha)
(kg DM/ha) ($ha) (c/kgDM)
7000 50 3500 1 600 17.1 – –
7000 70 4900 1.4 600 12.2 2800 700
10000 70 7000 2 700 10.0 7000 1750
12000 70 8400 2.4 800 9.5 9800 2450
Note:1. Pasture costs have risen slightly to allow for increased pasture production.2. At high levels of utilisation (70% plus) supplements can be used to further increase milk production.3. The assumption is a milk price of 25c/L milk4. 1 cow/ha equivalence = 3500 kgDM/ha pasture for a 550 kg Friesian cow producing 5500 L milk/lactation and fed
1 t concentrate/lactation.

DairyCHECK – Improving Feed Management for Profits
12
Milk from pasture (litres/ha)
High levels of pasture growth and consumption are essential if feed costs are to bereduced. Every additional kg of pasture converted to milk reduces the unit cost ofproduction (cents/litre)
Converting improved levels of pasture production to milk reduces costs, despite higherinputs/ha. That is, cost are spread over more litres of milk (Table 1). Higher pastureproduction will mean the need for higher inputs of fertilisers.
Pasture costs
The costs of producing a kg of pasture is between 6–12 cents/kg DM. The actualcost of harvested pasture is 8–30 cents/kg DM. If pasture systems are to be profitable,pasture must be used efficiently.
The major determinant of pasture costs is not the level of inputs but the amountconsumed and converted to milk by high producing cows (Table 1).
“Making a difference”The key management areas that have the potential to substantially increase farmproductivity and profitability are changes in the feed management and feedavailability.
Change feed requirements• Seasonal or batch calving• Realistic milk production/cow• Increased stocking rate
Change feed availability• Growing more pasture• Better grazing management• Daily allocation of feed.
Seasonal, or batch calving
Calving seasonally or at least in 2 or 3 batches each year can substantially improvefeed use and labour efficiency.
Batch calving ensures feed requirements more closely parallel availability of pasturegrowth. For example, in the most of coastal NSW there are 2 peaks in pasturegrowth-in August to October (ryegrass) and January to March (kikuyu, paspalum).Calving in April/May and October/November allows a better match of pastureavailability and stock requirement than calving all-year-round. The proportion in eachbatch will depend on proportion of area of irrigated ryegrass. Other benefits ofbatch calving include:• having 1 or 2 groups at the same stage of lactation allows more effective feed
management,• less labour and more efficient management of labour over the shortened periods
of calving, calf rearing and mating.
DairyCHECK – Improving Feed Management for Profits
13
There is scope to increase stocking rate by 20-25% simply by capturing the efficienciesof batch calving.
Realistic production/cow
With adequate levels of temperate pastures, Friesian cows can produce 5000-5500L milk/cow/lactation without supplements and 6000-6500 L milk/cow/lactation isachievable if cows are supplemented with 1 t grain/cow/year. Comparable figuresfor kikuyu are 3500-4000 L milk/cow/lactation and 4700-5200 L milk/cow/lactationwhen supplemented with 1 t grain/cow.
High genetic merit cows (Australian Breeding Value of more than 30 kg fat plusprotein) need to be fed to produce at least 6500 L milk/cow/lactation otherwise theywill draw too greatly on body reserves to satisfy feed deficits and consequentlyreproductive performance will be lowered.
Increase stocking rates
The benefits from management to increase milk production/cow are small comparedto increased milk production/ha.
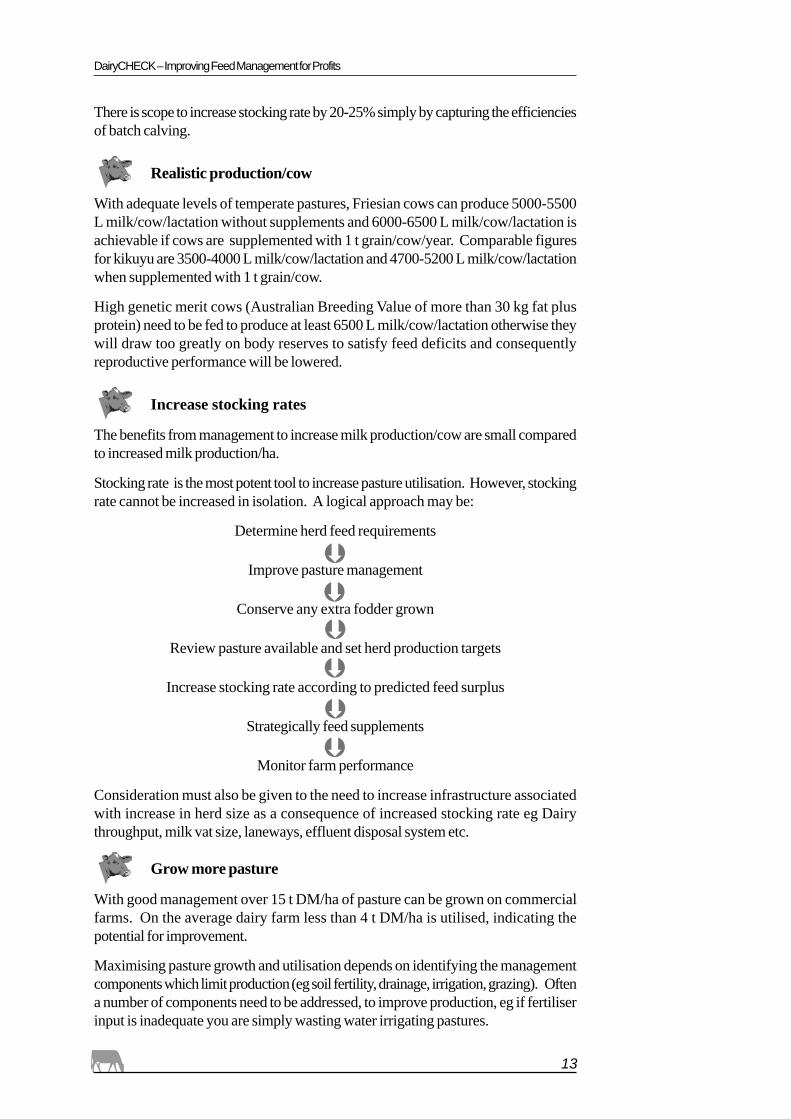
Stocking rate is the most potent tool to increase pasture utilisation. However, stockingrate cannot be increased in isolation. A logical approach may be:
Determine herd feed requirements
Improve pasture management
Conserve any extra fodder grown
Review pasture available and set herd production targets
Increase stocking rate according to predicted feed surplus
Strategically feed supplements
Monitor farm performance
Consideration must also be given to the need to increase infrastructure associatedwith increase in herd size as a consequence of increased stocking rate eg Dairythroughput, milk vat size, laneways, effluent disposal system etc.
Grow more pasture
With good management over 15 t DM/ha of pasture can be grown on commercialfarms. On the average dairy farm less than 4 t DM/ha is utilised, indicating thepotential for improvement.
Maximising pasture growth and utilisation depends on identifying the managementcomponents which limit production (eg soil fertility, drainage, irrigation, grazing). Oftena number of components need to be addressed, to improve production, eg if fertiliserinput is inadequate you are simply wasting water irrigating pastures.

DairyCHECK – Improving Feed Management for Profits
14
Better grazing management
The principles of good pasture management are well known for temperate and kikuyupastures. These principles should also be used in planning the layout of your farm.(See DAIRYLINK – Managing Pastures.)
For temperate pastures there are 3 components of grazing management over whichyou have substantial control:
1 Grazing interval. Adhering to a grazing interval between 2-3 leaves/tiller regrowth,and before 2500 kgDM/ha is reached, will substantially increase growth andutilisation of pasture, pasture quality and persistence.
2 Duration of grazing. This should be less than 2 days if possible otherwise regrowthwill be suppressed.
3 After grazing residues. These should be between 5-7 cm. Grazing residues of 10cm stubble height reduce pasture availability by ½ t DM/ha/grazing.
Daily feed allocation
Dairy cows are markedly over and under fed from one day to the next under normalgrazing management systems due to inaccurate assessment of daily pasture available.In a recent study, where the aim was to allocate a block of pasture uniformly by eye,the amount of pasture available varied from 6 to 20 kgDM/cow/day when 11 kg/cow/day was actually required. At 6 kgDM/cow the cows would be severely underfedwhilst at 20 kgDM/cow, the responses to concentrates would be very low and pasturewould be wasted.
Accurate measurement of pasture on offer and supplementing accordingly wouldremove this daily variation in feed intake. It would also provide consistant feedquality of the ration.
DairyCHECK – Improving Feed Management for Profits
15
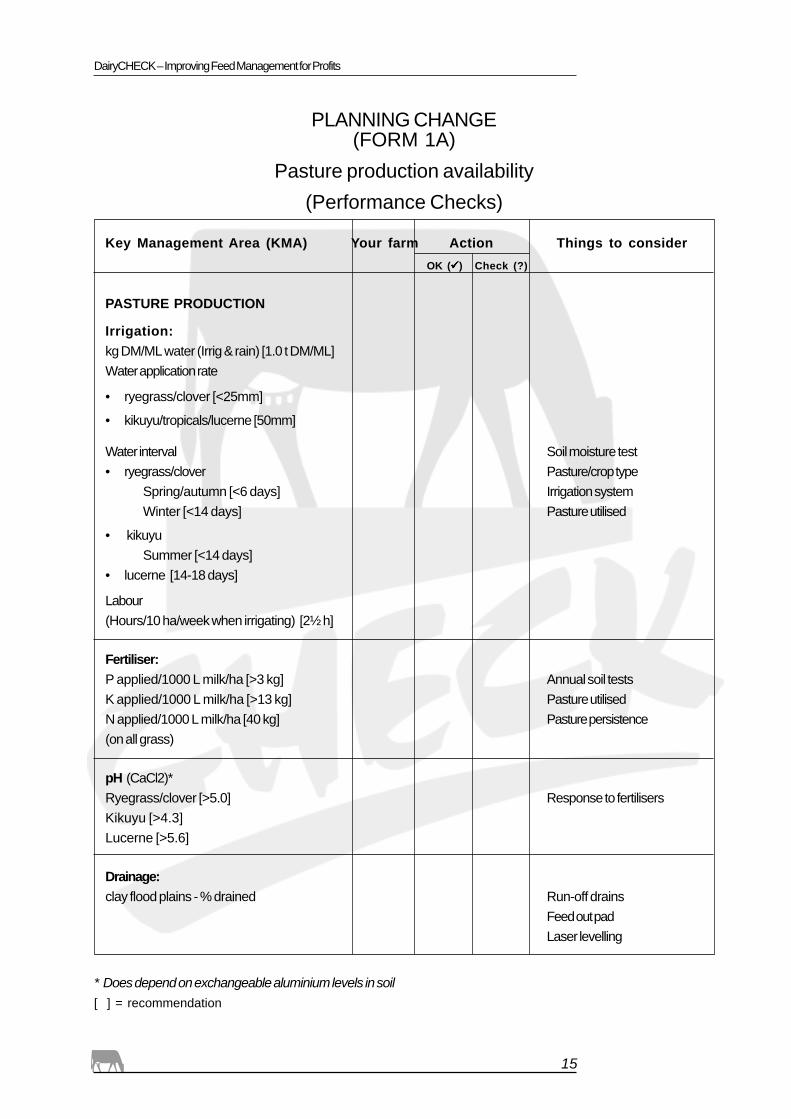
PLANNING CHANGE(FORM 1A)
Pasture production availability(Performance Checks)
Key Management Area (KMA) Your farm Action Things to considerOK ( ) Check (?)
PASTURE PRODUCTION
Irrigation:kg DM/ML water (Irrig & rain) [1.0 t DM/ML]Water application rate
• ryegrass/clover [<25mm]
• kikuyu/tropicals/lucerne [50mm]
Water interval Soil moisture test• ryegrass/clover Pasture/crop type
Spring/autumn [<6 days] Irrigation systemWinter [<14 days] Pasture utilised
• kikuyuSummer [<14 days]
• lucerne [14-18 days]
Labour(Hours/10 ha/week when irrigating) [2½ h]
Fertiliser:P applied/1000 L milk/ha [>3 kg] Annual soil testsK applied/1000 L milk/ha [>13 kg] Pasture utilisedN applied/1000 L milk/ha [40 kg] Pasture persistence(on all grass)
pH (CaCl2)*Ryegrass/clover [>5.0] Response to fertilisersKikuyu [>4.3]Lucerne [>5.6]
Drainage:clay flood plains - % drained Run-off drains
Feed out padLaser levelling
* Does depend on exchangeable aluminium levels in soil[ ] = recommendation

DairyCHECK – Improving Feed Management for Profits
16
PLANNING CHANGE(FORM 1A)
Pasture production availability(Performance Checks)
Key Management Area (KMA) Your farm Action Things to Consider
OK ( ) Check (?)
PASTURE UTILISATION
[>10t DM/ha from lucerne, kikuyu/ryegrass All other KMA’s
or ryegrass/clover]
[>75% of that achieved experimentally]
Grazing:
Interval
• Ryegrass [from 2-3 leaves/tiller
and < 2500 kgDM/ha]
• Kikuyu [<4½ leaves/tiller]
• Lucerne [10% bloom, bud initiation]
– all species
Intensity [5-7cm]
– all species
Duration [< 2 days] Back fence
Poor regrowth
Silage (or hay): Use 1/2 as roll over reserve
Store [0.9 t DM/cow/year] Use to manage pasture
Concentrate:
Flat rate feeding response to concentrate kgDM
Strategic [range 1-6 kg concentrate kg/cow/day] consumed/ha from pasture
feeding
Calving pattern
All-year-round Dates and duration
Batch calve % calved in 20 days
Seasonal [50% calved in 20 days]
Persistence (>3 years for
perennials)
Pasture utilised
Milk fat test
Metabolic diseases
No of paddocks
Stocking rate
Pasture management
Pasture utilised

DairyCHECK – Improving Feed Management for Profits
17
PLANNING CHANGE(FORM 1B)
Pasture production and Utilisation
Using your knowledge and key performance indicators please consider the following questions:
• What are your strengths in pasture management?
• What are your pasture management opportunities?
• What do you need to change?
• What do you need to change first?
• How will you make the changes?
• What will you achieve by changing?

DairyCHECK – Improving Feed Management for Profits
18
PLANNING CHANGE(FORM 1C)
Pasture production and availability
a) Examples of ways to improve pasture production and consumption on your farm.
Key management areas
Pasture production eg Pasture utilisation eg
1 Phosphorus & Potassium fertiliser use 1 Silage or hay making
2 N Fertiliser use 3 Grazing managementgrazing intervalgrazing durationgrazing intensity
3 Irrigation frequencyapplication
3 Farm layout - paddock number
4 pH of Soil 4 Laneway
5 Drainage 5 Water points for stock
6 Pasture Species 6 Stocking rate
7 Weed Control 7 Daily feed allocation
8 Suitable Stocking Rates 8 Ability to feed supplements strategically
b) Now you consider ways to improve the conversion of pasture to milk using the following steps:-
1. Identify what things you will need to change?2. What steps are necessary to make the change?3. How will you know what has changed?
KMA 1 (What) 2 (Steps) 3 (Change)
Pasture production
1
2
Pasture utilisation
1
2

DairyCHECK – Improving Feed Management for Profits
19
PLANNING CHANGE(FORM 1D)
Key Pasture Management Tools and Packages
Package Purpose
Feed allocation The package uses an estimate of pasture available(Manual and DSS) (visually or by pasture meter) to allocate pasture and
then fill any feed deficit with supplements, with changesin feed quality and cost of the ration beingautomatically calculated.
There are default values for quality and costs of allpastures and feeds used but there is provision toenter your own values.
The weekly estimates of pasture growth and pasturecover on the farm are graphed over a 12 month periodand these values can also be obtained for individualpaddocks.
There is also a small spreadsheet program whichallows pasture costs to be calculated.
Feed Planning (see later)(Manual and DSS)
DairyLink (see later)(Manuals and Tutorials)
Water wise This is a water management project to improveirrigation efficiency and improve milk production permegalitre of water.
Keys areas discussed include:
Irrigation scheduling, soil texturing, the evaluation ofexisting irrigation requirements for forages.
The feed allocationpackage is on an Excelspreadsheet format,(requires Version 5 orabove) and will need acomputer with 16MB RAMand at least Windows 95.

DairyCHECK – Improving Feed Management for Profits
20
BACKGROUND
Feed costs are the largest single variable cost of producing milk and growingreplacements. Feed costs range from 9–20c/litre and supplements are often themajor component of high feed costs (ie up to 70% of feed costs).
Producing the majority of milk from pastures and strategically feeding low costsupplements will improve profitability and productivity on most farms.
CHALLENGES
On pasture based farms the goal is to improve farm productivity and profitability byconverting high quality pastures to milk. There is also a need to strategically feedsupplements to optimise the genetic potential of good quality cows.
For intensive use of pastures and making the best use of supplements it is necessaryto identify:-
• The nutritional limitations of pastures and how to correct imbalances• Ways to cost effectively feed supplements• Major factors that affect whole lactation management and milk production
BALANCING PASTURE
Feed supplements are necessary to meet pasture quantity and quality shortfalls.
Good quality pastures allow a cow to consume 3% of her body weight. For a 600 kgcow this is an intake of 18kg of dry matter/day which provides enough energy tosupport 20–23 kg of milk/day. An additional 6–8 litres/cow/day is produced frombody weight loss in early lactation.
Moderate supplementation (eg 1 tonne grain/cow/lactation) should increase cowproduction (6–7000 litres/cow) and permit higher stocking rates (2–3 cows/ha) toallow higher milk production/ha (12–15000 L/ha).
Pasture Quality
Cows require high intakes of high quality forages to avoid an over reliance on supplements.
Pastures may limit cow production because of the following reasons:
• High moisture levels which reduces dry matter intake.• High levels of digestible crude protein which can reduce milk production
(by 1.5 litres of milk/day) and reproduction.
SECTION 2
Supplementing Pastures for Profit

DairyCHECK – Improving Feed Management for Profits
21
• Low levels of digestible fibre which reduces milk fat composition.• Low levels of some minerals (eg Ca, P, Mg, Na).• The low energy content of some pastures (eg tropicals).• Insufficient pasture available or time to graze pasture.
Table 1: The nutrient content of pastures commonly fed to cows in NSW.
MJ/kg DM g per kg DM
ME DM CP NDF Ca P Mg Na K S Fat
Kikuyu• early 9.0 180 200 580 3.5 2.8 2.9 0.1 30.0 2.0 40• late 8.0 250 140 630 3.5 2.5 2.9 0.1 30.0 2.0 30• stemmy 7.0 260 100 720 3.5 2.4 3.5 0.1 30.0 2.0 20
Rhodes grass• early 8.7 200 160 580 3.7 2.7 1.4 0.6 30.0 2.9 40• late 7.2 250 120 640 3.3 2.6 1.5 0.6 30.0 2.8 30• stemmy 6.5 280 90 730 2.2 2.0 1.5 0.6 25.0 2.7 20
Setaria• early 8.7 180 160 560 2.1 2.7 1.6 3.0 30.0 2.0 40• late 6.5 250 100 630 2.1 2.7 1.6 3.0 30.0 1.5 30• flowering 6.0 280 80 730 2.9 2.7 1.6 3.0 30.0 1.0 20
Rye grass• early 12.0 170 220 420 4.0 3.0 2.6 4.0 30.0 2.0 33• late 10.0 230 160 460 4.0 3.0 2.2 4.0 30.0 2.0 26• flowering 9.0 250 120 480 4.0 3.0 2.2 4.0 30.0 2.0 26
Clover• early 11.5 180 230 350 17.0 4.0 2.5 1.1 26.0 2.1 30• late 11.0 220 180 370 16.0 3.0 2.2 1.1 26.0 2.1 28• flowering 9.2 230 170 390 15.0 2.5 1.8 1.1 24.0 1.7 26
Lucerne• early veg 11.0 220 220 380 16.0 3.5 2.6 2.2 22.0 3.3 27• late veg 10.0 250 210 400 13.0 2.9 2.4 1.5 25.0 3.1 21• flowering 9.0 260 170 420 13.0 2.2 3.3 1.4 25.0 2.8 21
Oats• early veg 11.3 200 200 580 2.7 1.8 1.9 2.1 20.0 2.0 26• late veg 10.2 250 170 620 3.0 2.0 1.9 2.1 20.0 2.0 27• flowering 9.0 270 130 620 3.1 2.4 3.0 2.1 16.0 2.0 27
Rye grass/cover• veg 11.3 180 220 350 7.0 3.0 3.1 4.0 30.0 2.0 27• late 10.0 250 170 440 6.0 2.8 1.8 2.2 25.0 2.5 25
Brassicas 12.0 150 250 260 16.0 4.8 3.6 5.0 24.0 – –
Prairie grass• veg 11.5 200 220 420 6.0 3.6 1.7 1.6 4.0 – 40
Source – Camdairy

DairyCHECK – Improving Feed Management for Profits
22
Correcting Imbalances
The following section discusses how some nutrient imbalances can limit production.
• EnergyEnergy intake is a major limitation to milk production per cow in a pasturebased system.With the exception of high quality temperate pastures the energy content of pasturesare lower than cow requirements. This is especially the case for tropical grassessuch as kikuyu,setaria and rhodes grass.
At low pasture availability and quality, feeding high levels of supplements increasesthe costs of producing milk.
• ProteinThe protein content of well managed pastures is often high (20-25% DM), and ishighly degradable (70-80 per cent).
For most dairy farms in NSW, the protein intake of cows is adequate except when:
• Cows are fed high levels of grain and/or silage in the cows diet (egmore than 6 kg DM/day of either corn silage or grain.)
• The cows milk production is very high (eg greater than 30 litres percow per day.)
• Cows graze mature grasses or poorly fertilised pastures.
• MineralsMineral requirements change with the cows production levels. Most cows requirecalcium, phosphorus and sodium supplements (Table 2).
Table 2: Mineral content of dairy pastures compared to the requirements of a 600 kg cows producing 20 L milk/day.
Mineral Requirements of a cow Perennial ryegrass Biennial Kikuyuproducing 20L milk/day white clover ryegrass
Magnesium (%) 0.25 0.31 0.27 0.29
Sodium (%) 0.18 0.47 0.37 0.10
Potassium (%) 1.0 3.0 3.43 2.89
Calcium (%) 0.6 0.7 0.59 0.42
Phosphorus (%) 0.35 0.3 0.31 0.28
Note:1. The availability of Ca in tropical pastures is low.2. The Ca & P levels in pastures vary with soil type, fertiliser rates and season.3. The addition of grain and forage supplements can increase the need for certain minerals.

DairyCHECK – Improving Feed Management for Profits
23
• FibreLow levels of dietary fibre intake (eg lush pastures and grain diets) can result in lowmilk fat percentages requiring a roughage supplement (ie 1 to 2 kg per cow/day). Theseinclude good quality silage and hay. Feeding sodium bicarbonate (100 – 150 g percow per day) will also help.
• AdditivesThere are a vast number of additives for grazing cows. It is important that there isgood evidence for their use or you could be wasting your money!
Stock Intake
To make sure your cows are receiving the correct amount of feed it is necessary toaccurately formulate their rations. The five steps to ration formulation outlined inRealistic Rations (DAIRYLINK) are:
• Understand your cows’ dietary needs• Select pastures and supplements• Calculate nutrient intake• Balance your ration• Monitor and correct shortfalls and imbalances
Strategic use of Supplements
Moving from 6000 – 15000 litres milk/ha and maintaining acceptable levels of milkproduction per cow can be achieved by strategic feeding of supplements and increasingstocking rates.
Feeding of supplements in relation to pasture quantity and quality shortfalls and animalrequirements maximises milk responses to supplements (litres milk/kg supplement).Supplements can also be used as a pasture management tool to improve grazing andpasture management.
“Making a difference”• The goal of dairy producers is to manage pastures to obtain high intakes of high
quality pasture – the lowest cost feed.
• Flat rate feeding of supplements throughout the year, irrespective of pastureavailability, is wasteful in terms of pasture utilised and response to supplements.
• Introducing supplements to complement good grazing systems requires• Monitoring of pasture availability and quality regularly.• Knowledge of stock requirements.• Adjusting supplements based on pasture availability and quality.• Cows in early and lactation are differentially fed.• Forward planning of purchases and storage.• Monitoring milk production and body condition scores on a regular basis.

DairyCHECK – Improving Feed Management for Profits
24
• Observing cows and manure and making the necessary adjustments egwhole grain in faeces indicates better processing is required.
• Monitoring milk prices and feed costs.
• At greater than 1—1.5 t/grain/cow/lactation it is important to examine the needfor additional proteins and minerals.
RESPONSES TO SUPPLEMENTS
Economic milk responses to supplements can vary considerably. Responses dependon a number of interrelated factors. For example:
• Cow factors – genetic merit, body condition, stage of lactation.• Supplement factors – type and level of supplement and nutrient balance.• Feed factors – quality of pastures, substitution and plane of nutrition.• Price factors – the cost of supplements, the price of milk and milk quality penalties
(see Section 3).
Milk responses
Long term responses to hay and silage is approximately 0.70– 0.80 litres milk/kg DMsupplement. Long term responses to concentrates can vary from 1.0– 1.8 L milk/kgDM supplement. Long term responses include milk, body weight gain and reproductionresponses. Short term responses are mainly milk responses which range between0.2 - 0.8 L milk/kg DM supplement.
Responses to supplement decline as the level of supplement increases (Table 3. Tomaintain high milk responses to supplements, pastures need to be adequately utilised.
Table 3: Expected long term milk yield response of high producing cows to increased levels ofgrain supplements
Grain (kg/cow/day) Litres milk/kg grain fed
0–2 1.4–1.82–4 1.0–1.44–6 0.8–1.06–8 0.6–0.8> 8 0.4–0.6
Note: Milk responses in mid-late lactation are only approximately half of early-mid lactatingcows.
Substitution
Cows generally eat less pasture when supplements are fed. Substitution rate ismeasured as the reduction in pasture intake per kg of supplement fed. The majorfactors influencing substitution rate is the availability of pasture and the type ofsupplement. Substitution rates can vary from 0—1 kg DM pasture /kg DMsupplement fed. Substitution is lowest at low pasture allowances and highest withhigh pasture allowances.

DairyCHECK – Improving Feed Management for Profits
25
“Making a difference”• Cost effective supplements can optimise the milk production of high production
cows. Well managed farms can produce 6500-7000 litres/cow with 5000-5500litres from pastures and 1500 litres from 1½ tonnes of grain.
• Grain and forage supplements provide the confidence to use high stocking rates(2—3 cows/ha) and high levels of milk production/ha (12000-15000 L/ha).
• Best responses to supplements occur at high levels of pasture utilisation.• Supplements should complement and not be a substitute pasture.
WHOLE LACTATION PERFORMANCE
High production per cow and per hectare can be achieved in well managed pasturebased systems. Some management factors, however that can reduce profitabilityinclude fertility, heat stress, milk composition and transition feeding.
Nutrition and fertility
Reproductive efficiency has a significant effect on profitability and is particularlyimportant with seasonal calving herds. Milk solids per cow/year, calves born/year,the number of replacements and the costs of forced culling have a major impact onfarm income. Studies show that maximum milk income and income over reproductioncosts is achieved when cows calve every 12-13 months.
Nutrition has a direct influence on reproduction. It is generally agreed that highproducing cows and herds are under nutritional stress which leads to decreasedreproductive performance. Studies support the farmers’ belief that the best cowsare generally hardest to get in calf.
Since heritability of fertility is low it is essential that farmer’s concentrate on nutritionand other management factors that affect reproduction performance. It is also essentialthat farmers closely examine the level of genetics most appropriate to their productionsystem and management.
Transition feeding
To achieve suitable levels of production, cows need to be properly fed from onelactation to the next. Reduced intake before calving causes cows to mobilise bodyreserves and is closely linked to a poor start to the lactation.
On average, feed intake may decrease 25—35 per cent before calving with a fullappetite not reached until after peak lactation (Diag. 1)

DairyCHECK – Improving Feed Management for Profits
26
Diagram 1: Dry matter intake, milk yield and body weight changes andrelationships to whole lactation performance
• Body condition scoreSince feed intake is usually 1.8—2.0% of the cows body weight during the dryperiod, cows should reach a suitable body condition score (BCS 5.5 - 6.5) in latelactation.
Different breeds require different amounts of weight gain to gain 1 BCS (Table 4).
Table 4: Weight gain requirements to change body condition score (BCS)
Breed BCS
Friesian 42
Friesian Jersey 34
Jersey 26
Particular attention to body condition should occur at 150 days into the lactation toensure cows are properly fed in the second half of the lactation. Cows in low BCS(3-4) at drying off require extra feed in the dry period to gain sufficient weight priorto the transition period (ie 3 week prior to calving).
Heat Stress
Heat stress affects higher producing cows more than lower producing cows becausehigh producers consume more feed and produce more metabolic heat. Environmentalmodifications (shade, sprinklers, and fans) to minimise heat stress coupled with agood nutritional program are necessary to maintain dry matter intake (DMI) andmilk yield during periods of heat stress.

DairyCHECK – Improving Feed Management for Profits
27
• Effects on intakeThe production of a 600kg Holstein Friesian can decline from 25-27 litres at 20oC to16.5 litres at 35oC. Maintenance costs increase 20% during extended periods ofheat stress. At 40oC, maintenance increases by 32% and dry matter intake falls by56% compared to 20oC (Table 5).
Energy intake is directly related to dry matter intake (DMI) and practical approachesto increase intake include more frequent feeding, improved forage quality, the use ofpalatable feeds, good nutrient balance and greater nutrient density of rations.
• Physical movementDuring hot weather, walking 1 kilometre can increase a cows body temperature by1oC for 6 - 10 hours. The effect of exercise on body temperature can be reduced bylimiting the amount of walking to paddocks, providing sufficient pastures, by grazingcows during the cooler hours, providing shade and supplementing forages.
• Water is criticalWater is closely linked to performance with cows consuming 1 litre/kg DMI and 4–5 litres each litre of milk produced. In hot weather, water consumption can increaseby 30% for low producers and 50% for high producers (Table 5).
Practical considerations include the supply of unlimited quantities of clean waterunder shade within easy walking distance for stock.
Table 5: Effect of temperature on intake, milk production and water intake
Concentrates and pastures
Reducing pasture intake and increasing concentrates (ie less bulk and more energydensity) often results in digestive upsets and reduced milk yield, higher costs andhence reduced profits. It is preferable to provide good quality forage supplementswith quality pasture available for grazing in the cooler hours.
• Mineral supplementationExtra minerals need to be fed during hot weather. Suggested levels of these mineralsin hot weather are:
• Potassium (K) : 1.6% of DMI• Sodium (Na) : 0.45% of DMI• Magnesium (Mg) : 0.35% of DMI
Temp °C % of MR* DMI Expected Water intakeneeded kg/day DMI (kg/day) milk (L/day) L/day
25 104 18.6 17.7 25 86
30 111 18.9 16.9 23 92
35 120 19.4 16.7 18 140
40 132 20.2 10.2 12 123
(*) MR = Maintenance requirements

DairyCHECK – Improving Feed Management for Profits
28
Milk composition
Payment schemes based on volume have encouraged lower components in milk.Increasingly, payment schemes for milk will be based on milk compositional value.Penalties will apply to high volume - low test milk. This emphasis on milk constituentshas major implications to feed management.
• Changing milk fat contentFat percentage of milk is the most variable constituent of milk. Dietary changeswhich decrease fibre intake and increased intakes of grain are often associated withlower milk fat levels.
Feeding highly unsaturated fats or fatty acids also reduces milk fat per-cent.
• Changes in milk protein contentNutritional factors that affect percentages of milk protein include:
• Energy (soluble carbohydrates) has been clearly shown to be the primarynutritional factor that affects milk protein per cent.
• Underfeeding results in a drop in protein and feeding above cow requirementstends to increase milk protein content.
• Feeding high proportions of concentrates relative to forage can result in aslightly higher milk protein levels.
• Added dietary fat usually depresses milk protein per cent.
• Where dietary protein levels are acceptable, moderate increases in proteincontent of the diet has minimal effect on milk protein percent.

DairyCHECK – Improving Feed Management for Profits
29
“Making a difference”
Whole lactation performance
• High producing cows must be properly fed from one lactation to thenext lactation.
• Rations for cows need to be adjusted at different stages of the lactation (ieearly, mid. late) and levels of milk production.
• Proper feeding of cows before and after calving improves feed intake andmilk production in early lactation.
• Do not over-condition dry cows. Over conditioned cow at calving (BCS6+) have poor appetites, low peak and lactation yields more metabolicproblems and poor reproduction performance. Aim for a BSC of 5.5 - 6.0at calving.
• Each additional BCS between 4 - 6 provides an additional 250-300 litresof milk/lactation (ie 2 BCS = 600 litres per lactation).
• Reduced feed intake and excessive weight loss of high producing cows inearly lactation is closely linked to poor reproduction.
Heat stress
• During hot weather some form of cooling is necessary to maintain feed intake,milk production and fertility.
• Abundant good quality drinking water essential.
• Diets that minimise “heat loads” and optimise milk production include high qualityroughages and pastures and moderate levels of grain.
• Balanced rations are essential to prevent digestive problems during heat stress.• Additional K, Na and Mg should be fed during summer.
Milk composition
• Genetic potential and stage of lactation have major effects on milk compositionand responses to feed supplements.
• Proper feeding of lactating cows and dry cows allows them to meet their geneticpotential for milk production and composition.
• Don’t buy on $ tonne basis. Buy on a cost per unit of energy and/or protein basis.
• Strategic feeding of supplements in well managed grazing systems appears to bethe most economic method to achieve high levels of profitable production (ie yieldand composition).
• Feeding supplements provide variable short term changes in milk composition.
• Long term changes require giving full consideration to both herd and feedmanagement.

DairyCHECK – Improving Feed Management for Profits
30
PLANNING CHANGE(FORM 2A)
Supplementing Pastures for Profit(Performance Checks)
Key Management Area (KMA) Your farm Action Things to ConsiderOK ( ) Check (?)
Pasture Imbalances
• >3.4% butter fat and 3.0% milk protein • Level of feedingmilk composition • Quality of pastures
• Dry cow preparation• Ration balancing• Loss of condition• Level of energy intake• Type of supplements
Responses to supplements
• Regular diet checks (3 x’s/year) • Quality of concentrates• Quality of roughages• Level of feeding• Cost of supplements• Pasture intake• Pasture utilisation• Level of supplements• Type of supplements• >1:1 milk:grain price ratio• Unit cost of energy and
protein
Whole lactation management• BCS at drying off 5.0-5.5 • Feed planning• < 1½ BCS loss in first 100 days (1-8 scale) • Feed budgeting• BCS at mid lactation 4.0-4.5 • Feed allocation• BCS at calving 5.5-6.0 • Feed allocation• Target growth rates of heifers • Ration balancing
• Ration balancing• Monitoring weight change
(ie BCS)
Possible opportunities to improve profits:

DairyCHECK – Improving Feed Management for Profits
31
PLANNING CHANGE(FORM 2B)
Supplementing Pastures for Profit
Using your knowledge and key performance indicators please consider the following questions:
• What are your strengths in feed management?
• What are your feed management opportunities?
• What do you need to change?
• What do you need to change first?
• How will you make the changes?
• What will you achieve by changing?

DairyCHECK – Improving Feed Management for Profits
32
PLANNING CHANGE(FORM 2C)
Supplementing Pastures for Profit
a) Examples of ways to increase the responses to feeding supplements, balancing nutrient intake from pasturesand improve whole lactation performance.
Key management areas (KMA)
Pasture imbalances eg Responses to supplements eg Whole lactation performance eg
1. pasture management Type of supplement Feed budgeting
2. grazing management Nutrient analyses BCS monitoring
3. feed planning Ration formulation Shade and water
4. Knowledge of cows requirements Balanced rations
b) Now you consider ways to improve profits from feeding supplements using the following steps:
1. Identify what things you will need to change
2. What steps are necessary to make these changes?
3. How will you know what has changed?
KMA 1 (What) 2 Steps 3 (Change)
Pasture Imbalances
1
2
Responses to supplements
1
2
Whole lactation performance
1
2
DairyCHECK – Improving Feed Management for Profits
33
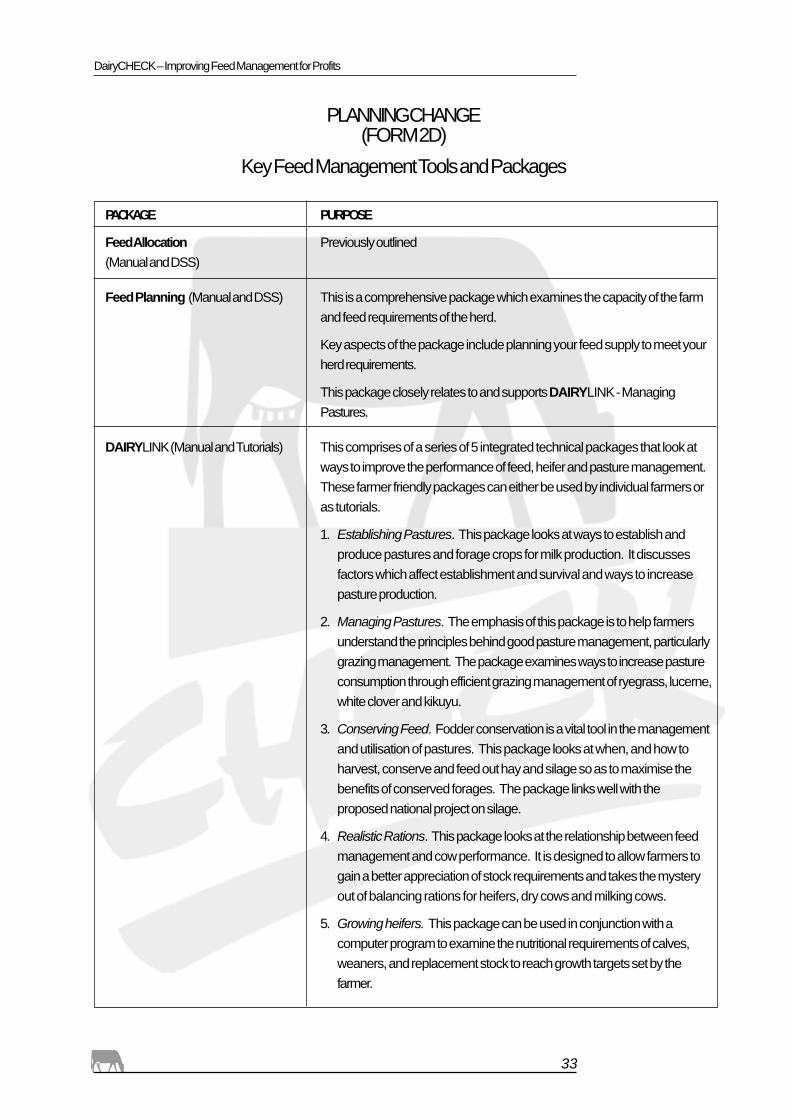
PLANNING CHANGE(FORM 2D)
Key Feed Management Tools and Packages
PACKAGE PURPOSE
Feed Allocation Previously outlined(Manual and DSS)
Feed Planning (Manual and DSS) This is a comprehensive package which examines the capacity of the farmand feed requirements of the herd.
Key aspects of the package include planning your feed supply to meet yourherd requirements.
This package closely relates to and supports DAIRYLINK - ManagingPastures.
DAIRYLINK (Manual and Tutorials) This comprises of a series of 5 integrated technical packages that look atways to improve the performance of feed, heifer and pasture management.These farmer friendly packages can either be used by individual farmers oras tutorials.
1. Establishing Pastures. This package looks at ways to establish andproduce pastures and forage crops for milk production. It discussesfactors which affect establishment and survival and ways to increasepasture production.
2. Managing Pastures. The emphasis of this package is to help farmersunderstand the principles behind good pasture management, particularlygrazing management. The package examines ways to increase pastureconsumption through efficient grazing management of ryegrass, lucerne,white clover and kikuyu.
3. Conserving Feed. Fodder conservation is a vital tool in the managementand utilisation of pastures. This package looks at when, and how toharvest, conserve and feed out hay and silage so as to maximise thebenefits of conserved forages. The package links well with theproposed national project on silage.
4. Realistic Rations. This package looks at the relationship between feedmanagement and cow performance. It is designed to allow farmers togain a better appreciation of stock requirements and takes the mysteryout of balancing rations for heifers, dry cows and milking cows.
5. Growing heifers. This package can be used in conjunction with acomputer program to examine the nutritional requirements of calves,weaners, and replacement stock to reach growth targets set by thefarmer.

DairyCHECK – Improving Feed Management for Profits
34
CamDairy This computer program has been developed by Sydney University and(Realistic Rations and DSS) NSW Agriculture.
The program is designed to help farmers formulate least cost rations andpredict milk performance.
The program considers cow, herd and feed factors and milk prices tooptimise or maximise margins above feed costs. It allows farmers tocompare different types of feeds to minimise feed costs (cents/litre).
CamDairy allows farmers to acquire skills in ration formulation andcomplements the nutritional principles discussed in: DAIRYLINK RealisticRations.
PLANNING CHANGE(FORM 2D)
Key Feed Management Tools and Packages(continued)

DairyCHECK – Improving Feed Management for Profits
35
BACKGROUND
Feed related costs are typically 60% to 70% of variable costs and 30% to 40% oftotal farm costs. It is therefore possible to make a significant impact upon farmprofitability by altering feed management strategies.
Higher levels of pasture utilisation, strategic use of supplements and the nutritionalbalancing of the cow’s diet can help achieve savings in feed related costs on a centsper litre basis.
CHALLENGES
Feed management represents a significant challenge to farm managers, withits direct influence on production and farm profitability.
The keys to improving profits from pasture based systems include:
• Identifying cost effective technology and management systems• Maximising the use of the capital base• Evaluating management practices
Selecting the appropriate production system and matching the herd feed needs to thegrazing system needs to be planned, monitored and evaluated.
Management of profitable pasture based systems requires the analysis of cost effectivesystems, monitoring productivity and profitability and scrutinising the partial budgetsof different production options.
COST EFFECTIVE TECHNOLOGIES
Seasonal and Batch Calving
Changes to the milk market mean that farmers will need to examine various productionstrategies to improve profitability. A potential strategy is to more closely match feeddemands with pasture growth.
Batch calving or seasonal calving strategies have the benefit of allowing farmers tomatch the herd’s peak feed demand with peak pasture production. The opportunityto shift calving patterns will obviously depend on supply arrangements with theprocessor and the seasonal changes in the price of milk paid by the processor.
Seasonal production has a number of advantages compared to year-round production,
SECTION 3
Profitable Pasture Systems

DairyCHECK – Improving Feed Management for Profits
36
including:
• matches herd feed demand with pasture growth,• reduction in the amount of fodder conservation required,• higher utilisation and higher stocking rate,• simpler to feed according to stage of lactation,• possibly reduced supplementation,• several weeks break from milking,• breeding and calf rearing tasks are restricted to a short period of the year, this can
improve the productivity of staff carrying out these tasks.
Disadvantages of seasonal production include:
• necessitates tight calving interval,• variable income,• milk shed and vat must be matched to peak production period.
Batch calving allows farmers to obtain most of the benefits of seasonal productionsystems while still maintaining production and income for the entire year. The numberof batches can vary from two or more and match pasture peaks or milk price peaks.
Identifying the Economics of Feeding
Determining the economic benefit from a feeding strategy is complex. Several simpleratios can be used as ‘rules of thumb’ to identify the possible cost benefit from afeeding strategy. The immediate response to feeding is measured in milk productionhowever benefits also accrue through improving cow condition score for breedingand health and in improving milk components.
• Grain : Milk ratio and Milk : Feed price ratios
With a substitution of 0.5 and an average milk response of 1kg milk/kg DM supplement,an early lactation cow to produce approximately 30 litres of milk when fed highquality pasture and 8 kg of supplements. This is grain : milk ratio of 1.3 : 5.
A milk : feed (M:F) price ratio is the comparison between milk and supplement priceeg at 18 cents milk price and grain $180/tonne DM the M:F ratio is 1:1. At 26 cents/litre of milk and grain at $176/tonne DM the M:F ratio is approximately 1.5:1. Thisratio allows you to quickly determine whether the feed price is likely to be economicin relation to the milk price.
Table 1 presents a summary of milk and economic responses using fairly typical feedcosts and milk prices.

DairyCHECK – Improving Feed Management for Profits
37
Table 1: Expected responses of early lactation 600 kg cows fed grain
Pasture Grain Total Milk INC/FC
DM/kg Cost $ DM/kg Cost $ DM/kg Cost $ Litres $ $
18 1.19 0 0 18 1.19 21 5.48 4.27
17 1.12 2 0.35 19 1.47 23 5.98 4.51
16 1.06 4 0.70 20 1.76 25 6.50 4.74
15 0.99 6 1.05 21 2.04 27 7.02 4.98
14 0.92 8 1.40 22 2.32 30 7.80 5.48
Note 1: - considers:-a. Pasture cost 6.6c kg DMb. Grain cost 17.6c/kg DMc. Substituion rate of 0.5d. Milk price 26c/litree. INC/FC - income minus feed cost
Note 2: - does not consider:-a. The costs of unused pastureb. Possible benefits of increased stocking ratesc. Weight change and reproductiond. The lower price of extra milke. Reduced pasture costs due to increased pasture
utilisation

DairyCHECK – Improving Feed Management for Profits
38
Table 2 is a summary of expected profit responses with changing milk : feed ratioprices
Table 2: Milk and profit responses to grain supplements
Early-mid lactation Mid-late lactation
Expected milk response (L/milk/kg grain) 1.0 - 1.2 0.4 - 0.6
Milk : Feed price ratio
>1.5 : 1 Profit Profit
1.25 : 1 Profit Very marginal
1.0 : 1 Marginal Loss
Note
1: Does not consider long term benefits on body condition and reproduction.
2: Ratios above 1:1 indicate that the milk responses are high and/or the price ofmilk is greater than the price of grain.
Cost effective supplements
The suitability of supplementing feeds depends on three key factors:
• Nutritional – knowledge of its ingredients and capacity to meet animal requirementsand balance pastures
• Economic – to provide a diet of least possible cost and help to meet productionand profitable milk responses.
• Practical – rations with minimum health problems, labour input and readily available.
To determine the least expensive source of energy, protein on fibre they must beexamined and a cost per unit dry matter basis. For example, the unit cost of energy(cent/MJ) is as follows:
Calculation ExampleInvolves a 3 step process WHEAT (ME = 13 MJ/kg DM, DM = 90%, $180/tonne)
Step 1 Step 1
= $kg (as fed) = $0.18/kg
Step 2 Step 2
= c/kg DM = 20c/kg DM
Step 3 Step 3
= c/MJ DM = 1.53c/kg DM
$/tonne
1000
$/kgx100
1000
c/kgDM
1000
180
1000
0.18x100
0.90
20
13
DairyCHECK – Improving Feed Management for Profits
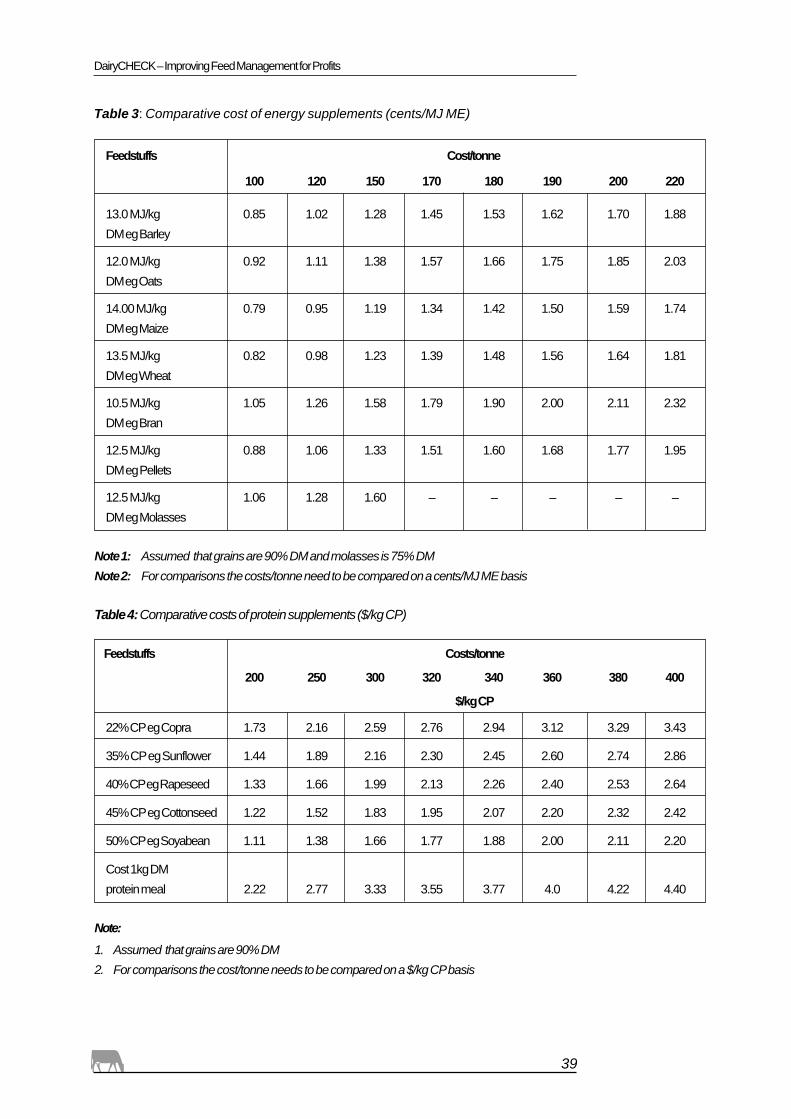
39
Table 3: Comparative cost of energy supplements (cents/MJ ME)
Feedstuffs Cost/tonne
100 120 150 170 180 190 200 220
13.0 MJ/kg 0.85 1.02 1.28 1.45 1.53 1.62 1.70 1.88DM eg Barley
12.0 MJ/kg 0.92 1.11 1.38 1.57 1.66 1.75 1.85 2.03DM eg Oats
14.00 MJ/kg 0.79 0.95 1.19 1.34 1.42 1.50 1.59 1.74DM eg Maize
13.5 MJ/kg 0.82 0.98 1.23 1.39 1.48 1.56 1.64 1.81DM eg Wheat
10.5 MJ/kg 1.05 1.26 1.58 1.79 1.90 2.00 2.11 2.32DM eg Bran
12.5 MJ/kg 0.88 1.06 1.33 1.51 1.60 1.68 1.77 1.95DM eg Pellets
12.5 MJ/kg 1.06 1.28 1.60 – – – – –DM eg Molasses
Note 1: Assumed that grains are 90% DM and molasses is 75% DMNote 2: For comparisons the costs/tonne need to be compared on a cents/MJ ME basis
Table 4: Comparative costs of protein supplements ($/kg CP)
Feedstuffs Costs/tonne
200 250 300 320 340 360 380 400
$/kg CP
22% CP eg Copra 1.73 2.16 2.59 2.76 2.94 3.12 3.29 3.43
35% CP eg Sunflower 1.44 1.89 2.16 2.30 2.45 2.60 2.74 2.86
40% CP eg Rapeseed 1.33 1.66 1.99 2.13 2.26 2.40 2.53 2.64
45% CP eg Cottonseed 1.22 1.52 1.83 1.95 2.07 2.20 2.32 2.42
50% CP eg Soyabean 1.11 1.38 1.66 1.77 1.88 2.00 2.11 2.20
Cost 1kg DMprotein meal 2.22 2.77 3.33 3.55 3.77 4.0 4.22 4.40
Note:
1. Assumed that grains are 90% DM2. For comparisons the cost/tonne needs to be compared on a $/kg CP basis

DairyCHECK – Improving Feed Management for Profits
40
• Fodder PurchasesThe cost of purchasing hay should also consider freight and storage costs. Hayshould be purchased on a $/tonne basis rather than $/bale (Table 5).
Table 5: Effect of bale weight on price tonne
Bale Price $/bale Bale weight kg No of bales/tonne Actual price $/tonne
5 20 50 250
5 25 40 200
5 30 33 167
Note:
1. If homegrown conserved feed is not available hay purchases can be expensiveand disappointing due to the variable quality of hay
2. Nutritional values of conserved feeds vary considerably compared to grains
3. Purchased roughages are generally expensive sources of energy and protein
4. Roughages purchased as a fibre source should be fed in low quantities (ie 2-3kg/animal/day)
5. Strategic buying in terms of surplus supply may be a suitable alternative tohomegrown stored forages.
6. Partial budgets can be used to determine the economic feasibility of providingsufficient storage to purchase low cost hay.
The choice of a feed should also consider the following:
• Time involved in handling and transporting• Processed versus unprocessed costs• Milling and storage facilities• Safety feeds to avoid ‘off feed’ problems• Regular and reliable source of quality feeds• The values and possible spoilage factors.
PRODUCTIVITY AND PROFITABILITY
Reduced Pasture Costs
Pasture utilisation is a critical indicator of pasture and feed management. Pastureutilisation is influenced by a number of management factors including stocking rate,grazing management and pasture quality and level of supplements fed. Improvingthe level of pasture utilisation dilutes the cost of pasture on a kg of DM basis.

DairyCHECK – Improving Feed Management for Profits
41
The diluting effect of utilisation on the cost of pasture consumed is illustrated inTable 6.
Table 6: Improving pasture utilised reduces effective cost of pasture fed
Feed Grown Feed Used Feed Consumed Pasture costs Effective cost of
(kg DM/ha) (%) (kg DM/ha) ($/ha) pasture consumed
($/kg DM)
7000 50 3500 600 0.17
7000 70 4900 600 0.12
10000 70 7000 700 0.10
12000 70 8400 800 0.095
Note:1. Pasture costs have risen slightly to allow for increase pasture production.
2. At high levels of utilisation (70% plus) supplements can be used to furtherincrease milk production.
Grain versus Fertiliser
On farms where pasture growth is low there is significant capacity to decrease feedcosts by increasing milk from pasture or replacing grain with grass. This can beachieved through the strategic use of fertiliser, particularly nitrogen which providesquick pasture growth responses.
Table 7 shows a possible comparison of fertiliser inputs compared to grain.
Table 7: Comparison of cost of feed energy provided by nitrogen fertiliseror grain.
Ryegrass response to Energy Costs of Grain
provided1 N2 ($/kg) equivalent
(MJ ME) cost3
18 kg pasture (Autumn & Spring) 151 $0.99 $1.89
7 kg pasture (mid-Winter)4 59 $0.99 $0.74
Note:1. Assumes 70% of pasture grown is utilised.2. N fertilzer is Urea at $455/t (46% N).3. Assuming grain is 12 MJ ME/kg DM at $150/t.4. N fertilizer during winter increases tillering and plant vigour assisting insubsequent spring production.

DairyCHECK – Improving Feed Management for Profits
42
PARTIAL BUDGETS FOR DIFFERENT SCENARIOS
Using Partial Budgets
Partial budgets can be used to determine the viability of proposed changes such as:
• Modifying a current activity eg contract rearing heifers,• Expanding an activity eg increasing herd size,• Introducing a new activity eg conserved feed vs grain.
STEP 1 Calculate LOSSES due to the proposed change – this includes extracosts and revenue foregone.
STEP 2 Calculate GAINS due to the proposed change – this includes costsavings and additional revenue.
STEP 3 Calculate “NETT GAIN” – GAINS minus LOSSES
STEP 4 List “NON-DOLLAR” factors due to the proposed change –increased management skills, time, risk
STEP 5 Calculate CAPITAL COSTS due to the proposed change –
Total new-capital outlay (A)Total of capital items sold (B)Net capital cost (ie A-B) = C
% rate of return on extra capital =D ÷ C100

DairyCHECK – Improving Feed Management for Profits
43
Example Partial BudgetIncreasing the number of milkers by rearing heifers off-farm.
Removing heifers off-farm will free 15 ha for 25 additional milkers. Capitalrequirements include pastures renovation ($3000)
Capital requirementsExtra 25cows on area that heifers are run $ 25 000Pasture renovation @ $300/ha $ 4 500Vat (2nd hand vat to increase capacity) $ 6 000
Total Capital $ 35 500
LOSSESExtra CostsHeifer rearing 50 heifers @ $5/hd/wk $ 13 000Cow feed costs @ 7 c/L $ 10 500Other variable costs @ 2 c/L $ 3 000Extra labour costs @ 3 c/L $ 4 500Depreciation of vat @ 10% $ 600
Loss of Income 0
LOSSES $ 31 300
GAINSExtra IncomeMilk 150 000 L @ 25 c/L (net) $ 37 500Cattle salesCull cows 6@ $500/hd $ 3 000Heifers 5 @ $250/hd $ 1 250Bull calves 12 @ $60/hd $ 720Costs SavedHeifer supplementary feed costs 50 @ $200/hd $10 000
GAINS $ 42 470
NET GAIN = $42 470 - $31 300 = $ 11 170
Return on Extra Capital = 11 170/ 35 500 x 100= 31%
Non monetary factors:
* Additional management effort
* Impact on pasture utilisation

DairyCHECK – Improving Feed Management for Profits
44
Importance of pastures and feed management
Benchmarking programs (eg., Dairy Best Business) demonstrate the importancethat should be placed on feed management in terms of farm productivity and farmreturns. Graphs 1 and 2 demonstrate the relationship between margin over feedcosts and production per milking hectare on NSW farms. The effect of differingquotas has been removed by using a single milk price of 26c/L.
The following graphs show that there is a large variation between individual farmperformances, which would be due to numerous management factors. To make useof comparative analysis information it is important to investigate these managementfactors to determine why some farms’ returns are better than others.
However it is important to remember that gross margins (including margins overfeed costs) provide only a partial picture of the farm business and do not account forfixed costs on farms which are a major factor in overall farm profitability.
Graph 1 shows that increasing pasture utilisation (t Dm per milking hectare) isassociated with an increase in Margin over Feed Costs on a per hectare basis. Fromthis data an increase in pasture utilisation from 6 to 8 tonnes DM per ha (33%increase) is associated with an increase in Margin over Feed Costs from $1600/ha to$2050/ha (28% increase). Factors such as stocking rate, fertiliser, irrigation and themanagement of pasture substitution with supplements would all influence this result.
Graph 1: Increasing dairy margins are achieved with increasing levels of pastureutilisation per hectare.

DairyCHECK – Improving Feed Management for Profits
45
In Graph 2 Margin Over Feed Costs ($/ha) improve with increasing milk productionper hectare. This may be due to increasing pasture production and utilisation as wellas other factors such as stocking rate and well managed use of supplements.
Graph 2: Higher margins are associated with higher levels of milk productionproduced per hectare.
“Making a difference”
Feed related costs have a major influence on farm profitability
Feed related costs are the biggest and most important variable cost (typically 60% to70% of total variable costs).
High levels of pasture utilisation and production per ha can increase the margin overfeed costs and decreases unit costs of production.
Maximising paddock feed is a most important way to produce low cost milk
Despite the use of supplements low cost farms produce the greatest proportion ofmilk from pastures.
Most profitable farms produce more milk from pasture and optimise the use ofsupplements.
There is a need to control the use of supplements to make the best use of the cheapestfeed–pasture.

DairyCHECK – Improving Feed Management for Profits
46
High production per cow or per hectare
Increasing the feed costs/cow does not necessarily increase the unit costs of milkproduction (c/L) with cows that are predominantly fed pastures and strategically fedsupplements.
High margins are achieved through a combination of high production per cow andhigh stocking rates.
Optimising farm production will increase margins over feed costs
By increasing the production and utilisation of pastures more milk production dilutesthe costs of production, ie, reduces the unit costs of production (c/L), particularlyfixed costs.
Low cost farms have a combination of many management factors
a) Pasture Production and Utilisation• strategic fertiliser use and irrigation where available• knowledge of the principles of good grazing management of temperate
and tropical pastures• good farm layout• monitoring pasture growth and intake• feed planning and fodder budgeting
b) Feeding supplements• knowledge of stock requirements• balancing pasture shortfalls with the appropriate supplements• balancing rations on a seasonal basis• purchasing feed on a unit cost basis

DairyCHECK – Improving Feed Management for Profits
47
PLANNING CHANGE(FORM 3A)
Profitable Pasture Systems
Using your knowledge and key performance indicators please consider the following questions:
• What are your strengths in farm management?
• What are your farm management opportunities?
• What do you need to change?
• What do you need to change first?
• How will you make the changes?
• What will you achieve by changing?

DairyCHECK – Improving Feed Management for Profits
48
PLANNING CHANGE(FORM 3B)
Profitable Pasture Systems(Performance Checks)
Key Management Area (KMA) Your farm Action Things to considerOK ( ) Check (?)
Cost Effective Technology See Section 1 & 2
Unit cost of Metabolisable Energy
Unit cost of Protein
Grain:Feed cost ratio ( >1.5:1)
Grain:Milk ratio
Pasture Production See Section 1 & 2
Pasture utilisation ( >10t DM/ha from pasture– kikuyu and/or irrigated ryegrass)
Milk from pasture
Profitable Systems
• Knowledge of production costs Stage 1 Farm audit
• Farm analysis skills Stage 2 Farm analysis
• Monitoring system Technology options
Sources of finance
Business plans
Possible opportunities to improve profit:

DairyCHECK – Improving Feed Management for Profits
49
PLANNING CHANGE(FORM 3C)
Farm Management – Profitable Pastures
a) List the opportunities to improve pasture production and consumption on your farm.
Key management areas (KMA)
Cost Effective Technology Productivity and Profitability Partial budgets for different scenarios
1.
2.
3.
4.
b) Now you consider ways to improve profits from feeding supplements using the following steps:
1. Identify what things you will need to change
2. What steps are necessary to make these changes?
3. How will you know what has changed?
KMA 1 (What) 2 Steps 3 (Change)
Cost effective technology
1
2
Productivity and profitability
1
2
Partial budgets/scenarios
1
2

DairyCHECK – Improving Feed Management for Profits
50
PLANNING CHANGE(FORM 3D)
Key Farm Management Tools and Packages
PACKAGE PURPOSE
Benchmarking programs Various benchmarking programs exist throughout NSW. These are
provided by dairy processors and private consultants. these programs
benchmark physical and financial resources of the dairy farm business.
They involve various levels of personal consultations with dairy advisers
and group based workshops providing interpretation of the benchmarking
information as it relates to the individual farm business. The major
benchmarking programs include.
• Bega Dairy Benchmarking
• Dairy Best business
• Norco - Farming for Profit
Farming for the Future (FFF) The FFF “Planning Your Future’ is a whole farm management and planning
program based upon a flexible workshop series. The program is designed
to assist in the development of personal business plans and to plan for a
viable future.
Workshops include:
• Introduction to planning for your business
• Family and employees
• Business resource assessment
• Physical and land resource assessment
• Enterprise assessment
• Enterprise options
• business planning
DairyCheck Stage 1 Farm Audit Manual provides a picture of your:
• Dairy enterprise
• Management strengths and opportunities
• Technical options and alternatives

DairyCHECK – Improving Feed Management for Profits
51
