improving local bus services in england outside london
TRANSCRIPT

Reportby the Comptroller and Auditor General
Department for Transport
Improving local bus services in England outside London
HC 577 SESSION 2019–2021 2 OCTOBER 2020
A picture of the National Audit Office logo

We are the UK’s independent public spending watchdog.We support Parliament in holding government to account and we help improve public services through our high-quality audits.
The National Audit Office (NAO) scrutinises public spending for Parliament and is independent of government and the civil service. We help Parliament hold government to account and we use our insights to help people who manage and govern public bodies improve public services. The Comptroller and Auditor General (C&AG), Gareth Davies, is an Officer of the House of Commons and leads the NAO. We audit the financial accounts of departments and other public bodies. We also examine and report on the value for money of how public money has been spent. In 2019, the NAO’s work led to a positive financial impact through reduced costs, improved service delivery, or other benefits to citizens, of £1.1 billion.

Report by the Comptroller and Auditor General
Ordered by the House of Commons to be printed on 30 September 2020
This report has been prepared under Section 6 of the National Audit Act 1983 for presentation to the House of Commons in accordance with Section 9 of the Act
Gareth Davies Comptroller and Auditor General National Audit Office
29 September 2020
HC 577 | £10.00
Department for Transport
Improving local bus services in England outside London
This study examined value for money in the local bus service system overseen by the Department for Transport (the Department). We examined the effectiveness of government’s current support for local bus services and the extent to which the enablers to improve local bus services are in place.
© National Audit Office 2020
The material featured in this document is subject to National Audit Office (NAO) copyright. The material may be copied or reproduced for non-commercial purposes only, namely reproduction for research, private study or for limited internal circulation within an organisation for the purpose of review.
Copying for non-commercial purposes is subject to the material being accompanied by a sufficient acknowledgement, reproduced accurately, and not being used in a misleading context. To reproduce NAO copyright material for any other use, you must contact [email protected]. Please tell us who you are, the organisation you represent (if any) and how and why you wish to use our material. Please include your full contact details: name, address, telephone number and email.
Please note that the material featured in this document may not be reproduced for commercial gain without the NAO’s express and direct permission and that the NAO reserves its right to pursue copyright infringement proceedings against individuals or companies who reproduce material for commercial gain without our permission.
Links to external websites were valid at the time of publication of this report. The National Audit Office is not responsible for the future validity of the links.
006467 10/20 NAO

The National Audit Office study team consisted of: Antonia Gracie, David Molony, Helen Roberts and Matt Paramor, under the direction of Lee-Anne Murray.
This report can be found on the National Audit Office website at www.nao.org.uk
For further information about the National Audit Office please contact:
National Audit Office Press Office 157–197 Buckingham Palace Road Victoria London SW1W 9SP
Tel: 020 7798 7400
Enquiries: www.nao.org.uk/contact-us
Website: www.nao.org.uk
Twitter: @NAOorguk
ContentsKey facts 4
SummaryIntroduction 5
Part OneIntroduction to local bus services 14
Part TwoRevenue funding for bus services 29
Part ThreeThe Department’s approach to improving bus services 40
Part FourWhat government needs to get right 48
Appendix OneOur audit approach 57
Appendix TwoOur evidence base 59
Appendix ThreeCase study visits 64
Appendix FourThe Department for Transport’s Better deal for bus users funding package 70
If you are reading this document with a screen reader you may wish to use the bookmarks option to navigate through the parts. If you require any of the graphics in another format, we can provide this on request. Please email us at www.nao.org.uk/contact-us
4 Key facts Improving local bus services in England outside London
Key facts
£512m annual government revenue funding (2018-19) for buses in England outside London excluding cost of free travel primarily for older and disabled people
5.8m bus passenger journeys per day on average in England outside London in 2018-19
£5bn new fi ve-year government funding package announced for buses, walking and cycling in England outside London over current Parliament
10% overall decline in bus use between 2010-11 and 2018-19
38% reduction in local authorities’ fi nancial support for bus services between 2010-11 and 2018-19
112 million vehicle miles travelled on local authority supported service routes in 2018-19, down from 243 million in 2010-11
18% fare increase in real terms between 2010-11 and 2018-19
24% of bus operators’ revenue income in 2018-19 from the provision of bus services, net of concessions, comes from government subsidy and support, though the exact percentage will vary by operator
£1.80 to £5.10 average benefi ts (per programme evaluated) for every £1 spent on supporting local bus services – assessed by the Department for Transport in 2016
£220 million new funding announced to support bus services in 2020-21, some of which was repurposed to support existing services during the COVID-19 crisis
Improving local bus services in England outside London Summary 5
Summary
Introduction
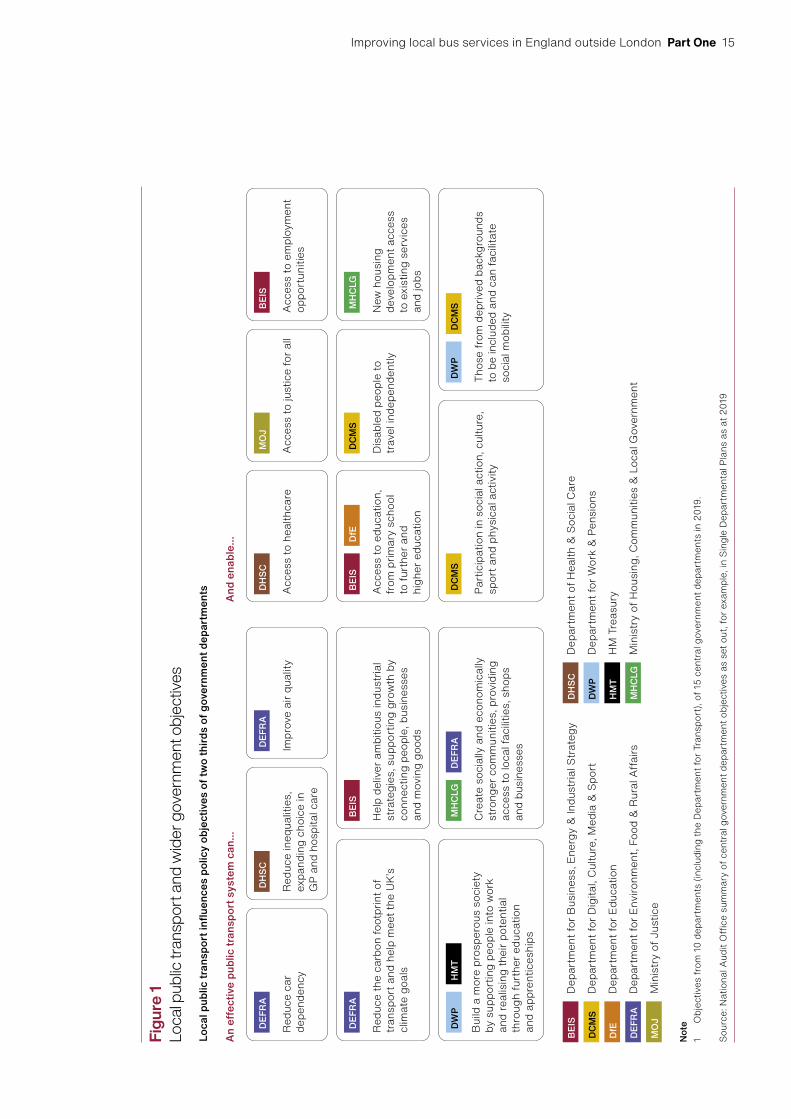
1 In 2019, buses accounted for 56% of public transport journeys by those living in England outside London, or an average 5.8 million passenger journeys each day. Despite a long-term shift to private car use, buses still support millions of essential daily trips, and for many people provide the only practical, frequently used method of transport, other than walking. Bus use is particularly common for people aged from 17 to 20 and over 70, and for women and girls, most ethnic minority groups, and people on lower incomes. Reliable, affordable bus services contribute to achieving the policy objectives of two thirds of government departments, from reducing health inequalities to access to justice.
2 Since government deregulated the local bus market in 1986, the majority of local bus journeys (87% by mileage in 2018-19) are on commercial services. Private sector operators decide bus routes and frequencies and invest in new vehicles and routes according to commercial considerations. However, public money has always supported bus services:
• Local authorities may choose to tender for additional supported services, which are those they consider necessary but are not otherwise commercially viable; they support these services from their general revenue funding from the Ministry of Housing, Communities & Local Government (MHCLG).
• At national level, the Department for Transport (the Department) pays a subsidy to help operators provide affordable services where they might not otherwise be viable.
From 1997-98 to 2010-11 the net total of national subsidy and local revenue support for bus increased in real terms, but fell thereafter, in line with spending on other local services. Around 24% of bus operators’ income from bus services currently comes from public subsidy and support (£512 million in 2018-19). The exact percentage will vary by operator.
3 The Department is responsible for the bus policy framework, ad hoc capital funding to local authorities and operators, and legislation. It provides information to support MHCLG, in determining the overall funding for local government. Over more than 30 years, the Department has stated an aim to increase bus use and halt the decline that has continued since the 1950s. In some periods this has been expressed as a formal Departmental objective, although not currently.

6 Summary Improving local bus services in England outside London
4 The Department considers that good quality bus services are vital for local economies, can help ease congestion, and support better connected communities. It also sees an important role for buses in addressing air quality issues and reducing greenhouse gas emissions. In September 2019 the Department announced that it would develop the first national strategy for bus services across England and a long-term funding commitment.1 In February 2020, it announced a £5 billion new funding package for buses, cycling and walking over this Parliament.
Scope of this report
5 The National Audit Office (NAO) and the House of Commons’ Committee of Public Accounts (the Committee) last examined bus services in 2005 and 2006 respectively. This report examines the effectiveness of government’s support for buses, and the extent to which the enablers are in place for local authorities and operators to realise the long-term, sustained improvement that the Department now intends. The report:
• explains what the data show on bus use, provision and performance over time and across local authorities in England. It also sets out roles, responsibilities and accountabilities for delivering and improving bus services (Part One);
• examines the effectiveness of the revenue funding framework for buses (Part Two);
• examines the effectiveness of government’s current approach to improving bus services (Part Three); and
• assesses the issues government needs to address to achieve its aims for the future of buses in England (Part Four).
6 During fieldwork for this study, the COVID-19 crisis led to drastic reductions in bus travel across the country; potential serious health and financial consequences for passengers, staff, operators and local authorities; and rapid financial and regulatory intervention by the Department. Also, progress has been delayed on the strategy, long-term funding package and initial pilot schemes. We do not examine the value for money of the Department’s emergency interventions during the crisis. Although the issues we highlight pre-date the pandemic, we consider they remain and have been brought into sharper relief by its effects.
1 Department for Transport, A better deal for bus users, first published 30 September 2019, updated 6 February 2020.

Improving local bus services in England outside London Summary 7
7 This report does not examine voluntary and community transport providers. Our examination excludes bus services in London, where the delivery model is different from the rest of England, although we draw on comparisons with London where useful. With a focus on funding arrangements and service delivery, we have not examined specific capital funding and improvements to infrastructure or vehicles. Most of our analysis uses data between 2010-11 and 2018-19 because the Department collected data on a different basis prior to 2010-11, but we have used longer-term data to reflect longer-term trends. Our evaluative criteria and methods are at Appendices One and Two.
Key findings
Bus use, provision and performance, 2010-11 to 2018-19
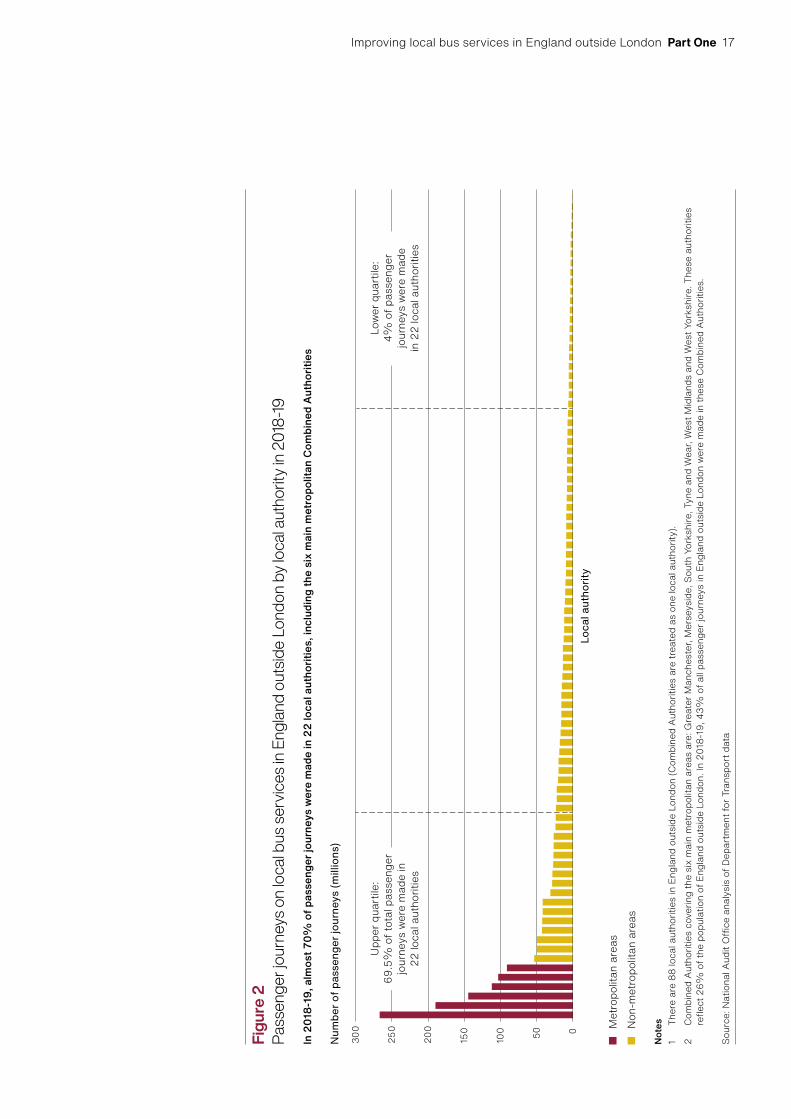
8 Despite the Department’s aim to increase bus use, over this period passenger journeys fell in 65 of 88 English local transport authorities outside London, and by almost 10% overall.2 This continued the gradual decline since before deregulation. By comparison, since deregulation London experienced an 89% increase, following the introduction of additional services and the congestion charge, although this has declined more recently. Average bus journeys per person per year outside London vary widely: from less than 10 in some counties and more rural areas, to around 150 in some more densely populated areas including Nottingham, and Brighton and Hove. The local authorities which include large metropolitan areas account for more than 40% of all passenger journeys outside London, but they have also seen the greatest percentage falls in average journeys per person (paragraphs 1.4, 1.11 and 1.12, and Figures 7 and 8).3
9 The decline in bus routes and bus travel disproportionately impacted supported routes, which are important for more rural or disadvantaged users. During this time, travel on supported services fell faster than on commercial services, with the total distance travelled on supported services falling by more than half. The Campaign for Better Transport estimated that since 2010-11 some 3,000 bus routes have been reduced, altered or withdrawn and these routes are more likely to have been supported services. The Department’s analysis shows that supported services can deliver high levels of socio-economic benefit, but it does not have information to understand how many people and who are being affected by route closures (paragraphs 1.10, 2.10 and 2.12).
2 There are 88 local transport authorities, excluding London, as metropolitan combined authorities are treated as one local authority.
3 The six metropolitan combined authorities are: Greater Manchester; Merseyside; South Yorkshire; Tyne & Wear; West Midlands; and West Yorkshire. Tees Valley combined authority is not classified as a metropolitan authority but includes five large towns and has also seen one of the largest falls in bus journeys per person.

8 Summary Improving local bus services in England outside London
10 Some local authorities, where there is long-term local support for prioritising bus services and tackling congestion, have improved and sustained bus use. There is good evidence on what works in improving and increasing commercially viable bus services: long-term locally led interventions with wide support, particularly those which target congestion, improving bus speed and reliability. This reduces the need for local authority support, freeing up funding for further improvements or other purposes. Urban areas including Nottingham City and the West Midlands have made progress with bus priority lanes. In Bristol, following partnership working between local operators, local authorities and the Department, passenger journeys increased by 36%, to 92 journeys per person per year. In rural areas, sustaining commercial routes is more difficult. On-demand services have had some success in a limited number of areas, for example Lincolnshire (paragraphs 1.13, 3.2 to 3.4, Figures 13 and 14 and Appendix Three).
Revenue subsidy and support for bus services, 2010-11 to 2018-19
11 The Department’s subsidy keeps routes financially viable and is important to operators but needs reforming to provide greater incentives for improvement. Increasing congestion means operators need to put on more buses to maintain frequency, which, when combined with falls in paying passengers, puts pressure on operator profit. The Department’s most recent estimate of median operator profitability is 8.5% (2017-18), at the lower end of what the Competition Commission estimated was desirable. Between 2010-11 and 2018-19, as fare-paying passenger journeys fell almost 6% (net of concessions journeys), total estimated operator revenue fell by 11%, while average bus fares increased by 18% in real terms. The Department’s subsidy (Bus Service Operators Grant) aims to keep services affordable and allow operators to run services that might otherwise be cancelled. However, the Department recognises that it is outdated and could be reformed to incentivise improvements more effectively and has committed to do so. In 2018-19, the subsidy was £248 million, 31% less than in 2010-11, mainly because the Department had reduced the rate of payments and miles travelled were lower (paragraphs 2.2 to 2.9, and Figures 9 to 11).
12 Local authorities’ have significantly reduced support for bus services, while the cost of statutory concessions has fallen more slowly. Of 85 local authorities operational over the whole period we examined, 72 have reduced spending on supported services. Of these, 42 reduced funding by more than 50%. The total real-terms fall from £425 million in 2010-11 to £264 million in 2018-19 (38%) is similar to reductions in local government spending on other non-statutory services. While not part of bus subsidy and support, the statutory duty to reimburse operators for free travel by eligible older and disabled people cost local authorities more than £650 million in 2018-19 and now forms a larger proportion of the total that local authorities spend in relation to bus travel. Authorities report that this duty, which is akin to a locally delivered national benefit, adds to pressure on non-ringfenced funding (paragraphs 2.10 to 2.11, 2.16 to 2.17 and Figures 11 and 12).
Improving local bus services in England outside London Summary 9
Effectiveness of government’s interventions
13 New powers for local authorities to take greater control over bus services have made little difference against a background of wider funding pressures. Deregulation shifted control over bus routes and passenger fares from local authorities to bus operators running commercial routes. Over time, the Department has tried to give a degree of control back to local authorities, by allowing various types of formal local partnerships with operators. The 2017 Bus Services Act allowed new models of partnership working and gave certain larger authorities the power to take control of services under a franchising arrangement. However, local authorities’ reduced spend on local transport, down by around 40% in real terms since 2010-11, is likely to have led to reductions in experienced transport planning staff to work in partnership with local operators. There are some long-standing, effective partnerships, but it took until April 2020 for the first, and so far only, new-style partnership to be agreed. No franchising proposals have progressed beyond consultation (paragraphs 1.9, 2.10, 3.5 to 3.9, 4.3 and Figures 6, 7 and 15).
14 The Department uses capital funding to support bus improvement, but is concerned that not all local authorities are able to access it. The Department provides a range of capital funding pots for which local authorities and operators can bid which can be useful in kick-starting bus improvement. The Department’s evaluations of bus improvement schemes it funded suggest positive benefit-cost ratios, ranging from £1.80 to more than £5.10 on average (per programme evaluated) for each £1 of investment, not including wider impacts. In the longer term, these capital projects can address congestion or reduce emissions, alongside contributing to reducing operators’ costs. The funds have ranged in size from £7 million to £2.5 billion and include the Local Sustainable Transport Fund and Transforming Cities Fund. However, the Department is concerned that local authorities with potentially viable projects are not accessing capital funding, because they lack the capability or revenue funding to bid (paragraphs 3.12 to 3.16).
15 It is too early to say whether new regulations requiring transparent data on fares and routes will increase demand. From December 2020, the Department has introduced regulations requiring operators to improve public data on fares and routes – outside London, many timetables and fares are still only available at bus stops or on the bus. Research, including from statutory consumer watchdog Transport Focus, suggests that better passenger information could encourage non-users to try the bus, especially younger people (paragraphs 1.6, 3.10 and 3.11, Figure 17).
10 Summary Improving local bus services in England outside London
Accountability for improving bus services
16 By choosing to deliver bus services through a deregulated model, the Department has limited its ability to influence improvement. This model involves local operator markets and few contractual relationships. Operators are not accountable to the Department or local authorities for delivering commercial services. However, their incentive to invest in improving services and adding routes may be influenced by the level of support from the local authority and its approach to managing congestion. Local authorities are accountable to local people for ensuring that bus services meet their needs, often setting out goals in a Local Plan, although there are no related statutory duties and weak incentives to prioritise bus services given the context of wider funding pressures. When we reported in December 2018, only 44% of wider Local Plans were up to date, and 14% of authorities had no Plan at all.4 In line with the principles of localism, the Department does not directly influence how local authorities fund local transport (paragraphs 1.8 to 1.11, 2.13 to 2.15, 3.3, 3.10, 4.4 and Figures 6 and 9).
17 While the Department collects data on buses, it could do more to bring together data and a set of indicators to support its future strategy. The Department told us that, in line with wider Government policy, it has been mindful of the need to reduce reporting burdens on local authorities and has therefore taken a light-touch approach to gathering information on the financial sustainability of local bus services, given this is an area of devolved spending. During our work, which primarily took place before the COVID-19 crisis, we observed that while the Department collected a lot of data on buses, it did not routinely bring data together to monitor how government interventions impacted sustainability across the bus system. We do note some gaps in government’s knowledge, for example on impact of reduced services on communities, particularly supported services. During the pandemic, the Department told us it has worked more closely with local authorities and operators to develop and use new and existing information to understand areas of critical need and target support. However, without clear objectives, it is difficult for the Department to know exactly what data it should collect. Also, if it does not identify a coherent, transparent set of indicators, it may find it difficult to monitor progress against its forthcoming strategy and make the decisions needed to stay on track (paragraphs 1.7 to 1.8, 2.12 to 2.14, 2.17 to 2.18, 3.9, 4.6 and Figures 6 and 17).
4 Comptroller and Auditor General, Planning for new homes, Session 2017–2019, HC 1923, National Audit Office, February 2019.

Improving local bus services in England outside London Summary 11
Opportunities and risks
18 Lack of coordination across government may limit the scale and pace of change. The Secretary of State for Transport has set out a long-term vision of shifting more journeys to public transport, as part of decarbonising transport. However, wider government decisions will affect people’s willingness to shift to public transport. We have previously reported on how government’s understanding of local service delivery and the interactions between service areas across different departments is weak. For example, planning guidance for new homes and public services does not need to consider and integrate bus services (paragraph 4.5, and Figure 16).
19 The COVID-19 pandemic, which has delayed the Department’s strategy, presents both additional challenges and learning opportunities. Given the pandemic, the timetable for the strategy was extended and the Department now plans to publish it by the end of 2020. Also, the Department paused or redirected £70 million of the £220 million funding announced for buses in 2020-21 to emergency support, and allowed local authorities to use a further £30 million to ensure existing services could be safeguarded. The government has also needed to shift temporarily from its aim of increasing bus use, to advising people not to use the bus, except for essential travel. However, both local government and operators told us that rapidly coming together to identify and address emergency need had improved the effectiveness of working relationships (paragraphs 2.18, 4.1 and 4.2, and Figure 17).
Conclusion on value for money
20 Bus services have been declining across England for 70 years and the decline continued following deregulation, with only a few local authorities managing to buck the trend. However, government recognises that affordable bus services have public value, and funds around 24% of bus operators’ revenue income. Government has chosen to deliver public bus services via a deregulated market model, and sensibly devolves decisions about supporting services to local authorities, who understand local needs.

12 Summary Improving local bus services in England outside London
21 The Department is not accountable for delivering bus services, but it has national policy responsibility. It is now preparing to commit significant new funding to bus services and to lead a national strategy for improvement against a background of considerable uncertainty. The Department collects data on buses and can show it has funded valuable improvements, but to date it has not sought to demonstrate how its actions have contributed to supporting optimal value for money across the bus system. If it is to work with and through others at central and local level, make informed choices about funding, and be able to adjust its plans to ensure it meets its objectives, it will need greater clarity on what it wants to achieve and how it will know when it has done so. During the COVID-19 pandemic, the Department has come together with local authorities and operators, intervening rapidly to target the weakest areas and keep buses running, which offers learning for the future.
Recommendations
22 Our experience of improvement strategies in other devolved, deregulated sectors shows that success requires whole-government commitment to long-term outcomes and locally led sustainable solutions. Of a number of issues this report highlights, we consider it most important that the Department should set out:
a a clear, consistent vision of the future of bus travel, that encourages and supports local authorities to make long-term plans for their own local needs. The Department should articulate clearly what success would look like for bus travel in urban and non-urban areas and how it expects new and existing models of delivery to feature. This vision should be consistent with its policy statements on future urban mobility and decarbonisation, and emerging long-term trends in travel;
b a detailed, transparent delivery plan with clear objectives, responsibilities and accountabilities for the Department and others. The Department’s forthcoming National Bus Strategy and accompanying delivery plan should incorporate details of what it will do to lead and support change, what others in central government will do and what it expects local authorities and operators to do, alongside how they will be incentivised and made accountable for doing it;
c good quality data and measures of success. The Department should look widely at all its sources of performance information to develop a basket of measures granular enough to understand outcomes for users, local authorities and operators, so that it can baseline and monitor the system’s progress, and adjust as necessary. This could build on the closer working with MHCLG, local authorities and operators during the pandemic, and include using the information created through the Bus Open Data programme;
Improving local bus services in England outside London Summary 13
d an active role in supporting local authorities to access evidence and experience to support improvement. The Department should work with MHCLG, local government, transport planning professional groups and operators to make it easy for local transport planners to share experience, resources, evidence and advice, and where necessary build local capacity to influence and improve bus services; and
e the amount and form of funding, for both local authorities and operators, that is necessary to achieve the objectives of the bus strategy. The Department has already committed to providing a long-term funding model. It should work with MHCLG, HM Treasury and local government as part of wider local government funding discussions, to ensure that the various elements of bus funding available combine effectively to support the objectives set out in the strategy. This should include: reform of the Bus Service Operators Grant to ensure incentives are aligned with government’s objectives; and work to understand the actual costs to local authorities of funding statutory concessions and the effect on budgets for bus improvement. The overall revenue funding model should also be transparent enough to contribute to enhanced accountability for improving buses.

14 Part One Improving local bus services in England outside London
Part One
Introduction to local bus services
1.1 This part sets out what the data show on bus use, provision, and performance, over time and across local authorities in England outside London. Our analysis is based primarily on data from the Department for Transport’s (the Department’s) surveys of bus operators and local authorities and its National Travel Survey. This part also sets out roles, responsibilities and accountabilities for delivering and improving bus services and the Department’s current aims for bus services.
Why buses are important, and to whom
1.2 Bus services, and wider local transport, influence the policy objectives of two thirds of government departments (Figure 1). They:
• provide everyday mobility and reduce social exclusion, connecting people to: work; education; shops; sport, leisure and entertainment; and friends and family;
• can protect the environment – a full bus emits less air pollution and greenhouse gases than the same number of people travelling separately in cars. By taking up a fraction of the road space, it also helps tackle congestion; and
• deliver high value for money. The Department estimates that every £1 spent on local bus improvement measures has delivered up to £5 in benefits, including to health and employment.
1.3 Bus remains the most common form of public transport, comprising 56% of all public transport journeys by those living in England outside London in 2018-19, or an average 5.8 million passenger journeys per day. Together with cycling and walking, bus travel is particularly suited to short journeys. In 2018-19, the average bus journey was 2.7 miles in London, 3.5 miles in other English metropolitan areas and 4.7 miles in more rural areas. However, the car is by far the most common mode everywhere.
Improving local bus services in England outside London Part One 15
Figu
re 1
Loca
l pub
lic tr
ansp
ort a
nd w
ider
gov
ernm
ent o
bjec
tives
Not
e1
Obj
ectiv
es fr
om 1
0 de
part
men
ts (i
nclu
ding
the
Dep
artm
ent f
or T
rans
port
), of
15
cent
ral g
over
nmen
t dep
artm
ents
in 2
019.
Sour
ce: N
atio
nal A
udit
Offi
ce s
umm
ary
of c
entra
l gov
ernm
ent d
epar
tmen
t obj
ectiv
es a
s se
t out
, for
exa
mpl
e, in
Sin
gle
Dep
artm
enta
l Pla
ns a
s at
201
9
Loca
l pub
lic tr
ansp
ort i
nflu
ence
s po
licy
obje
ctiv
es o
f tw
o th
irds
of g
over
nmen
t dep
artm
ents
An
effe
ctiv
e pu
blic
tran
spor
t sys
tem
can
…A
nd e
nabl
e…
DEFR
A
Redu
ce c
ar
depe
nden
cy
DHSC
Acc
ess
to h
ealth
care
DEFR
A
Redu
ce th
e ca
rbon
foot
prin
t of
trans
port
and
hel
p m
eet t
he U
K’s
clim
ate
goal
s
BEIS
DfE
Acc
ess
to e
duca
tion,
fro
m p
rimar
y sc
hool
to
furt
her a
nd
high
er e
duca
tion
DWP
HM
T
Bui
ld a
mor
e pr
ospe
rous
soc
iety
by
sup
port
ing
peop
le in
to w
ork
and
real
isin
g th
eir p
oten
tial
thro
ugh
furt
her e
duca
tion
and
appr
entic
eshi
ps
DCM
S
Part
icip
atio
n in
soc
ial a
ctio
n, c
ultu
re,
spor
t and
phy
sica
l act
ivity
MH
CLG
DEFR
A
Cre
ate
soci
ally
and
eco
nom
ical
ly
stro
nger
com
mun
ities
, pro
vidi
ng
acce
ss to
loca
l fac
ilitie
s, s
hops
an
d bu
sine
sses
DWP
DCM
S
Thos
e fro
m d
epriv
ed b
ackg
roun
ds
to b
e in
clud
ed a
nd c
an fa
cilit
ate
soci
al m
obilit
y
BEIS
Hel
p de
liver
am
bitio
us in
dust
rial
stra
tegi
es, s
uppo
rtin
g gr
owth
by
conn
ectin
g pe
ople
, bus
ines
ses
and
mov
ing
good
s
DCM
S
Dis
able
d pe
ople
to
trave
l ind
epen
dent
ly
MH
CLG
New
hou
sing
de
velo
pmen
t acc
ess
to e
xist
ing
serv
ices
an
d jo
bs
DHSC
Redu
ce in
equa
litie
s,
expa
ndin
g ch
oice
in
GP
and
hosp
ital c
are
MO
J
Acc
ess
to ju
stic
e fo
r all
DEFR
A
Impr
ove
air q
ualit
y
BEIS
Acc
ess
to e
mpl
oym
ent
oppo
rtun
ities
BEIS
Dep
artm
ent f
or B
usin
ess,
Ene
rgy
& In
dust
rial S
trate
gy
DCM
SD
epar
tmen
t for
Dig
ital,
Cul
ture
, Med
ia &
Spo
rt
DfE
Dep
artm
ent f
or E
duca
tion
DEFR
AD
epar
tmen
t for
Env
ironm
ent,
Food
& R
ural
Affa
irs
MO
JM
inis
try
of J
ustic
e
DHSC
Dep
artm
ent o
f Hea
lth &
Soc
ial C
are
DWP
Dep
artm
ent f
or W
ork
& P
ensi
ons
HM
TH
M T
reas
ury
MH
CLG
Min
istr
y of
Hou
sing
, Com
mun
ities
& L
ocal
Gov
ernm
ent

16 Part One Improving local bus services in England outside London
1.4 Bus use is heavily concentrated in more built-up areas. In 2018-19, the average number of bus journeys per person per year ranged from less than 10 in some counties and more rural areas, to around 150 in some more densely populated areas including Nottingham and Brighton and Hove. Almost 70% of all passenger journeys on local bus services were made in a quarter of the local authorities, with more than 40% of bus journeys taken in the six combined authorities that cover mainly metropolitan areas (Figure 2).
1.5 Some groups in society use buses more than others:
• Annual bus trips per person are highest for people aged from 17 to 20 and those over 70.
• Women make more bus trips than men.
• Between 2014 and 2018, trips by local bus accounted for a higher proportion of total trips made by people from ethnic groups other than white or Asian people.5
• Those on the lowest household incomes take the highest number of bus trips (Figure 3 on page 18). People who depend more on the bus to travel for work tend to be lower paid, live in more deprived areas and are more likely to turn down jobs because of transport issues than those on higher incomes, who tend to use cars and trains more often.6
Passenger experience of bus services
1.6 Around 38% of people use a bus at least once a month and more than half do so at least once a year. However, a substantial minority never do. In 2019, a study by the RAC found that 35% of motorists said that they were more dependent on car than in 2018 (14% – less dependent).7 The RAC found that more than half (57%) of motorists surveyed agreed with the statement, “I would use my car less if public transport were better” and of this group the most common reason for not using public transport was that fares were too high (Figure 4 on page 19). In 2018 Transport Focus, the independent watchdog representing passenger interests funded by the Department, identified cheap, easy-to-understand fare deals and using technology to provide smart ticketing and journey planning, as ways to improve user satisfaction and encourage bus use among young people.
5 Department for Transport, Travel by distance, trips, type of transport and purpose, January 2020.6 NatCen Social Research, Transport and inequality: An evidence review for the Department for Transport,
July 2019.7 RAC, Report on Motoring 2019, October 2019.
Improving local bus services in England outside London Part One 17
Figu
re 2
Pass
enge
r jou
rney
s on
loca
l bus
ser
vice
s in
Eng
land
out
side
Lond
on b
y lo
cal a
utho
rity
in 2
018-
19
Num
ber o
f pas
seng
er jo
urne
ys (m
illio
ns)
In 2
018-
19, a
lmos
t 70%
of p
asse
nger
jour
neys
wer
e m
ade
in 2
2 lo
cal a
utho
ritie
s, in
clud
ing
the
six
mai
n m
etro
polit
an C
ombi
ned
Aut
horit
ies
Not
es1
Ther
e ar
e 88
loca
l aut
horit
ies
in E
ngla
nd o
utsi
de L
ondo
n (C
ombi
ned
Aut
horit
ies
are
treat
ed a
s on
e lo
cal a
utho
rity)
.2
Com
bine
d A
utho
ritie
s co
verin
g th
e si
x m
ain
met
ropo
litan
are
as a
re: G
reat
er M
anch
este
r, M
erse
ysid
e, S
outh
Yor
kshi
re, T
yne
and
Wea
r, W
est M
idla
nds
and
Wes
t Yor
kshi
re. T
hese
aut
horit
ies
refle
ct 2
6% o
f the
pop
ulat
ion
of E
ngla
nd o
utsi
de L
ondo
n. In
201
8-19
, 43%
of a
ll pa
ssen
ger j
ourn
eys
in E
ngla
nd o
utsi
de L
ondo
n w
ere
mad
e in
thes
e C
ombi
ned
Aut
horit
ies.
Sour
ce: N
atio
nal A
udit
Offi
ce a
naly
sis
of D
epar
tmen
t for
Tra
nspo
rt d
ata
Loca
l aut
horit
y
Met
ropo
litan
are
asN
on-m
etro
polit
an a
reas
050100
150
200
250
300
Upp
er q
uart
ile:
69.5
% o
f tot
al p
asse
nger
jo
urne
ys w
ere
mad
e in
22
loca
l aut
horit
ies
Low
er q
uart
ile:
4% o
f pas
seng
er
jour
neys
wer
e m
ade
in 2
2 lo
cal a
utho
ritie
s

18 Part One Improving local bus services in England outside London
Figure 3Local bus use in England by household income in 2019
Average number of trips (per person per year)
In 2019, those with lowest household incomes made the most trips by local bus. Bus use among this group has remained the highest since at least 2002 when records began
Notes1 The Department for Transport defines a trip as a one-way course of travel with a single main purpose.2 Number of trips is based on responses to the 2019 National Travel Survey, a household survey designed to
monitor trends in personal travel. Approximately 16,000 individuals in 7,000 households in England participate in the survey each year.
Source: National Audit Office analysis of Department for Transport data based on the National Travel Survey
Other local busBus in London
23 2013
18 16
53
39
2725
15
0
10
20
30
40
50
60
70
80
Lowest real income level
Second level Third level Fourth level Highest real income level
Real household income quintile
Improving local bus services in England outside London Part One 19
1.7 Survey data collected by Transport Focus shows wide variation in satisfaction with bus services, particularly on value for money, journey time and punctuality (Figure 5 overleaf).8 Since national records began in 2007-08 bus punctuality has never met the 95% target set by the Traffic Commissioners, who licence and regulate bus operators. Data are also incomplete. For frequent services (that is to say those intended to arrive at least every 15 minutes and more than five times an hour), the Department has 2018-19 data for only 25 of 88 local authorities, including three of the six metropolitan combined authorities.9 For non-frequent services, the data are more complete, showing that the punctuality target was achieved in only four of 67 local authorities where data were available (Figure 5).
8 Transport Focus, Bus passenger survey – Autumn 2019 report, March 2020.9 Some local authorities may not have services falling into the “frequent” definition.
49.6
41.3
41.1
38.4
35.9
27.2
25.0
19.2
9.6
0 10 20 30 40 50
Fares are too high
Doesn’t run often enough
Doesn’t run when I need it to
Isn’t close enough to where I live or need to go
Doesn’t run on time
Services are too crowded
Services are too slow
Too many cancellations
My personal safety is at risk
Figure 4Reasons for car-dependency, 2019Reasons potential bus users gave for not getting out their cars
Note1 Fifty-seven per cent of motorists said they would be willing to use their cars less if public transport were better
and cited the above improvements.
Source: National Audit Office analysis of RAC Report on Motoring 2019 data
Respondents (%)

20 Part One Improving local bus services in England outside London
Figure 5Bus passenger satisfaction and bus punctuality, in England in 2019 Bus passenger satisfaction and punctuality showed significant variation across England
Notes1 Transport Focus conducted its annual 2019 bus passenger survey in 31 local authority areas outside London.
The data covers all metropolitan areas and some non-metropolitan areas. Data are collected on a rotation basis with a higher level of surveying in areas where local authorities and operators provide additional funding to support a larger sample size. Transport for London collects data for London.
2 Frequent services are routes with more than 5 services an hour and no longer than a 15 minute waiting time. The remaining non frequent services must leave a stop not more than one minute early and less than six minutes late.
Source: National Audit Offi ce based on Department for Transport and Transport Focus data
Bus punctuality of non-frequent services
95% to 100% (Target met)
90% to 94.9%
85% to 89.9%
80% to 84.9%
Less than 80%
No data
Fairly/very satisfied with: Lowest performing local area
(%)
Highest performing local area
(%)
London
(%)
Overall journey 76 95 85
Value for money (fare paying passengers)
50 77 80
Journey time 73 90 –
Punctuality 53 84 –

Improving local bus services in England outside London Part One 21
How bus services are delivered
1.8 The Department and other parts of central government provide the policy, legal and funding framework within which bus services are delivered. Operators and local authorities determine where and when to run services and whether to provide public funding for routes. Figure 6 on pages 22 and 23 summarises roles, funding, objectives and measures of performance for the provision of bus services.
Bus operators
1.9 Under the deregulated bus market in England outside London, bus operators decide when and where to run commercial bus services and set fares (other than national and local concessionary schemes and participation in local ticketing schemes). Of 885 million bus miles operated in 2019, 87% were on commercial services, which derive revenue from passenger fares (including publicly funded concessions). More than 500 companies operate bus routes, from small, family-run businesses to multi-nationals, and five local authority-owned municipal companies.10 The five largest operators by market share of bus journeys are also current or former rail franchise holders, and between them operate 80% of the market.11 In 2015-16, 65 of 88 local authorities had one main local operator that delivered 50% or more of all journeys.
Local authorities
1.10 Local authorities determine local transport policies and objectives and in 2018-19 decided how to spend £3.2 billion revenue and £4.6 billion capital funding for local transport, across both roads and public transport. Where a route is not commercially viable but the local authority considers it socially necessary, it can choose to part-fund the service and tender for an operator – these are supported bus services. Support may cover: all services on a route; services at quiet times (for example weekend service); or part of a route (for example to ensure service for a deprived area). Authorities may develop formal or informal partnership agreements with bus operators, but only in London does the local authority currently have powers in place to determine routes and fares. Under the principles of devolution, local authorities are accountable to local people for their choices about spending on local transport including buses, not to central government.
10 Blackpool, Ipswich, Nottingham City, Reading and Warrington11 The five main bus operators are Stagecoach, Go Ahead, First, Arriva and National Express.
22 Part One Improving local bus services in England outside London
Figure 6Roles and responsibilities for supporting and providing local bus services
Central government
Localauthorities
Bus operators
Bus services are delivered through a collection of local markets, within a policy and funding framework determined by central government
Organisation Relevant roles Bus service delivery/funding responsibilities Bus objectives Bus performance measures
Department for Transport (DfT) • Legislative and regulatory framework, national policy and direction.
• Provide ad hoc capital funding for improvements.
• Publish statistical data.
Pay Bus Service Operators Grant to operators based on rates set at fiscal events and records submitted by operators.
Under “our performance”, DfT publishes % of non-frequent bus services running on timein England.
Ministry of Housing, Communities & Local Government (MHCLG)
• Oversee financial sustainability of local authorities.
• Administer broader funding pots e.g. Transforming Cities Fund.Provide funding to local authorities for concessionary travel schemes and supported services.
HM Treasury • Set overall funding envelope for transport.
• Approve major capital funding decisions.
• Agree periodic local government funding settlement.
• Make fiscal decisions on fuel duty and national concessions.
Other departments • Administer some bus-related capital funding pots on behalf of DfT(e.g. the clean bus technology fund).
Driver and Vehicle Standards Agency • Provide punctuality guidance and operator compliance checks.
• Investigate complaints about the running of local services.
• Refer any failings discovered to Traffic Commissioners.
Transport Focus • Measure user satisfaction through the bus passenger survey.
• Represent passenger perspectives in partnerships.
Bus Users • Act as an appeal body for complaints regarding accessibility.
Senior Traffic Commissioner • Licence and regulate bus operators and register bus services.
• Set operator bus punctuality targets.
• Take enforcement action against operators in the form of fines or removal of licences.
Local authorities (including the six main metropolitan Combined Authorities)
• Prepare local transport plans.
• Allocate funding to local transport including bus improvement measures.
• Put out supported services for competitive tender.
• Set local non-statutory concessions policy.
• Duty to identify and consider funding socially necessary bus services.
• Duty to consider the needs of elderly and disabled individuals.
• No statutory duty to fund services.
• Maintain the safety and usability of local roads (including those on which buses operate).
Locally determined.For example, in the West Midlands, the PTE sets itself an objective that the maximum walking distance to a bus service in a continuously built-up residential area should be 400m at most times.
• Required to provide data to support DfT’s bus statistical data tables.
• Measures may be agreed at local level as part of operator – authority partnerships.
Passenger transport executives (PTE) or Combined Authorities where relevant
• Provide, plan and promote public transport in metropolitan areas.
Traffic concession authorities (TCAs) • Administer statutory and non-statutory travel concessions. • Statutory duty to reimburse operators for bus travel by older or disabled people.
• May provide discretionary concessions (e.g. to those on apprenticeships).
• Collect bus punctuality data from operators and provide to DfT.
Commercial operators running commercial and supported services
• Decide where to operate bus services and set fares accordingly.
• Invest in infrastructure such as vehicles and garages.
• Employ and train staff including engineers and drivers.
• Ensure bus services they provide meet accessibility standards.
• Provide concessionary journey details to TCAs.
May agree local objectives as part of operator-local authority partnerships.
• Asked to complete DfT’s annual bus survey.
• Monitored against traffic commissioner punctuality targets and pay penalties for poor service.
• New open passenger data requirements comeinto force over three years from January 2020.Voluntary and community transport providers • Register, change or cancel bus services with traffic commissioners
and local authorities.
DfT objectives
For most of the period since deregulation, DfT has publicly stated an aim to increase bus use. DfT’s 2019 high-level objectives include: • support the creation of a
stronger, cleaner, more productive economy;
• help to connect people and places, balancing investment across the country;
• make journeys easier, modern and reliable; and
• make sure transport is safe, secure and sustainable.
Source: National Audit Offi ce analysis

Improving local bus services in England outside London Part One 23
Figure 6Roles and responsibilities for supporting and providing local bus services
Central government
Localauthorities
Bus operators
Bus services are delivered through a collection of local markets, within a policy and funding framework determined by central government
Organisation Relevant roles Bus service delivery/funding responsibilities Bus objectives Bus performance measures
Department for Transport (DfT) • Legislative and regulatory framework, national policy and direction.
• Provide ad hoc capital funding for improvements.
• Publish statistical data.
Pay Bus Service Operators Grant to operators based on rates set at fiscal events and records submitted by operators.
Under “our performance”, DfT publishes % of non-frequent bus services running on timein England.
Ministry of Housing, Communities & Local Government (MHCLG)
• Oversee financial sustainability of local authorities.
• Administer broader funding pots e.g. Transforming Cities Fund.Provide funding to local authorities for concessionary travel schemes and supported services.
HM Treasury • Set overall funding envelope for transport.
• Approve major capital funding decisions.
• Agree periodic local government funding settlement.
• Make fiscal decisions on fuel duty and national concessions.
Other departments • Administer some bus-related capital funding pots on behalf of DfT(e.g. the clean bus technology fund).
Driver and Vehicle Standards Agency • Provide punctuality guidance and operator compliance checks.
• Investigate complaints about the running of local services.
• Refer any failings discovered to Traffic Commissioners.
Transport Focus • Measure user satisfaction through the bus passenger survey.
• Represent passenger perspectives in partnerships.
Bus Users • Act as an appeal body for complaints regarding accessibility.
Senior Traffic Commissioner • Licence and regulate bus operators and register bus services.
• Set operator bus punctuality targets.
• Take enforcement action against operators in the form of fines or removal of licences.
Local authorities (including the six main metropolitan Combined Authorities)
• Prepare local transport plans.
• Allocate funding to local transport including bus improvement measures.
• Put out supported services for competitive tender.
• Set local non-statutory concessions policy.
• Duty to identify and consider funding socially necessary bus services.
• Duty to consider the needs of elderly and disabled individuals.
• No statutory duty to fund services.
• Maintain the safety and usability of local roads (including those on which buses operate).
Locally determined.For example, in the West Midlands, the PTE sets itself an objective that the maximum walking distance to a bus service in a continuously built-up residential area should be 400m at most times.
• Required to provide data to support DfT’s bus statistical data tables.
• Measures may be agreed at local level as part of operator – authority partnerships.
Passenger transport executives (PTE) or Combined Authorities where relevant
• Provide, plan and promote public transport in metropolitan areas.
Traffic concession authorities (TCAs) • Administer statutory and non-statutory travel concessions. • Statutory duty to reimburse operators for bus travel by older or disabled people.
• May provide discretionary concessions (e.g. to those on apprenticeships).
• Collect bus punctuality data from operators and provide to DfT.
Commercial operators running commercial and supported services
• Decide where to operate bus services and set fares accordingly.
• Invest in infrastructure such as vehicles and garages.
• Employ and train staff including engineers and drivers.
• Ensure bus services they provide meet accessibility standards.
• Provide concessionary journey details to TCAs.
May agree local objectives as part of operator-local authority partnerships.
• Asked to complete DfT’s annual bus survey.
• Monitored against traffic commissioner punctuality targets and pay penalties for poor service.
• New open passenger data requirements comeinto force over three years from January 2020.Voluntary and community transport providers • Register, change or cancel bus services with traffic commissioners
and local authorities.
DfT objectives
For most of the period since deregulation, DfT has publicly stated an aim to increase bus use. DfT’s 2019 high-level objectives include: • support the creation of a
stronger, cleaner, more productive economy;
• help to connect people and places, balancing investment across the country;
• make journeys easier, modern and reliable; and
• make sure transport is safe, secure and sustainable.
Source: National Audit Offi ce analysis
24 Part One Improving local bus services in England outside London
Performance against the Department’s objectives for bus use
1.11 Despite its lack of direct levers for change, the Department has stated an aim, since before deregulation, to increase bus use and address the decline that has continued since the 1950s. In some periods this has been expressed as a formal Departmental objective, although this is currently not the case.12 In 2005 we concluded that government was unlikely to achieve bus growth in every region, and was therefore unlikely to meet its underlying wider objectives to tackle social exclusion, congestion and vehicle emissions. At that time the Committee of Public Accounts recommended the Department provide stronger leadership and do more to stimulate demand.13
1.12 At the time of deregulation in England almost three bus journeys took place outside London for each one in London. By 2019, less than one bus journey took place in England outside London for each one in London. Since deregulation London has experienced an 89% increase in bus use, following the introduction of additional services and the congestion charge, although it saw a decline more recently. In total, between 2010-11 and 2018-19, passenger journeys in England outside London fell in 65 of 88 local authorities. This fall represents 288 million journeys (10%) compared with a 71 million fall in London (3%) (Figure 7 on pages 26 and 27). Over the same period, 70 of the 88 local authorities saw bus use per person decrease and combined authorities saw the greatest falls per person, ranging from 7% in Merseyside to 19% in South Yorkshire. As well as a shift to cars, in some metropolitan areas, the introduction of light rail has had an impact on bus use.
1.13 However, in Bristol, passenger journeys increased 36% to 92 journeys per person per year from 2010-11 to 2018-19. Here, partnership working between local operators, local authorities and the Department led to a network of urban and inter-urban corridors. Other areas seeing increases included Brighton and Hove, and Oxfordshire (Figure 8 on page 28).
12 Including the cross-government Public Service Agreement target between 2000 and 2011, originally announced in Transport 2010: The 10-year plan.
13 HC Committee of Public Accounts, Delivery Chain analysis of bus services, Forty-third Report of Session 2005-06, HC 851, May 2006.
Improving local bus services in England outside London Part One 25
1.14 In May 2019, the Transport Select Committee reported on bus services, and recommended a national bus strategy and a long-term funding package.14 In September 2019, the Department committed to produce a national bus strategy and announced an interim bus funding package for 2020-21 (Appendix Four). In February 2020, the Prime Minister further announced £5 billion over five years to “level up local transport connections throughout the country, making everyday journeys easier, greener and more convenient”, by improving bus services and cycle lanes in England outside London.15 The announcement included a range of initiatives on bus services including a commitment to 4,000 new zero emission buses.
1.15 The remaining parts of this report examine:
• the effectiveness of the revenue funding framework for buses;
• the effectiveness of government’s current approaches to improving bus services; and
• the issues government needs to address to ensure it achieves its aims for the future of buses in England.
14 HC Transport Committee, Bus services in England outside London, Ninth Report of Session 2017–2019, HC 1425, May 2019.
15 Prime Minister’s Office, Major boost for bus services as PM outlines new vision for local transport, Press release, February 2020.

26 Part One Improving local bus services in England outside London
Non-metropolitan Metropolitan London
0
500
1,000
1,500
2,000
2,500
3,000
3,500
1986
-87
1987
-88
1988
-89
1989
-90
1990
-91
1991
-92
1992
-93
1993
-94
1994
-95
1995
-96
1996
-97
1997
-98
1998
-99
1999
-00
Financial year
2002
-03
2000
-01
2001
-02
2003
-04
2004
-05
2005
-06
2006
-07
2007
-08
2008
-09
2009
-10
2010
-11
2011
-12
2012
-13
2013
-14
2014
-15
2015
-16
2016
-17
2017
-18
2018
-19
Financial year
Number of passenger journeys (millions)
Figure 7Passenger journeys on local bus services in England, since deregulation in 1986 to 2019
Oct 1986
The Transport Act 1985 aimed “to halt the decline that has afflicted the bus industry for more than 20 years”
Nicholas Ridley then Transport Minister
Mar 1999
”For too long the bus has been seen as a workhorse; familiar, even friendly, but rather dull and unexciting. I want to see it become a thoroughbred”
John Prescott then Deputy Prime Minister
Mar 2012
“Our aim now is to see these nascent partnerships [between local transport authorities and bus companies] take root, improving services and boosting passenger numbers”
Norman Baker then Transport Minister
Jul 2019
“I will begin as a matter of urgency the transformation of local bus services. I want higher frequency, low-emission buses, more bus priority corridors, a network that’s easier to understand and use. I want local partnerships between the private sector, which operates the buses, and the public body, which coordinates them”
Boris Johnson Prime Minister
Notes1 From 1986-87 to 2018-19 annual bus passenger journeys in England fell by 5% from 4,500 million to 4,300 million.2 Since the formation of Transport for London in 2000, passenger journeys in London increased by more than 75% from 1,300 million in
2000-01 to 2,400 millionin 2013-14. Since then they declined slightly to 2,200 million in 2018-19. 3 The six metropolitan areas in England are: Greater Manchester, Merseyside, South Yorkshire, Tyne and Wear, West Midlands and West Yorkshire.4 The methodology for estimating bus journeys changed in 2004-05.5 In English regions outside London actual bus passenger journey numbers increased from 1986-87 to 2018-19 in the South East (7%)
and South West (5%). In every other region bus passenger journey numbers fell with the heaviest falls in the North East (58%), North West (46%), and Yorkshire and Humber (55%).
Source: National Audit Offi ce analysis of Department for Transport data
Passenger journeys by bus continued their long-term decline following deregulation, including a ten per cent fall since 2010-11Mar 2019
“Britain is on the verge of a transport revolution … radical new technologies are emerging that will within a generation transform every day journeys … mass transit must remain fundamental to an efficient transport system”
Jesse Norman then Minister for Transport
Jan 1996
Measures announced to lead to “more stable services, high quality accessible vehicles, convenient waiting areas, ticketing schemes, good passenger information and traffic measures designed to improve bus performance“
Steven Norris then Transport Minister
May 2018
“The Bus Services Act 2017 introduced new powers for local authorities and operators to work together to improve local bus services and increase passenger numbers”
Nusrat Ghani then Transport Minister
BusStop

Improving local bus services in England outside London Part One 27
Non-metropolitan Metropolitan London
0
500
1,000
1,500
2,000
2,500
3,000
3,500
1986
-87
1987
-88
1988
-89
1989
-90
1990
-91
1991
-92
1992
-93
1993
-94
1994
-95
1995
-96
1996
-97
1997
-98
1998
-99
1999
-00
Financial year
2002
-03
2000
-01
2001
-02
2003
-04
2004
-05
2005
-06
2006
-07
2007
-08
2008
-09
2009
-10
2010
-11
2011
-12
2012
-13
2013
-14
2014
-15
2015
-16
2016
-17
2017
-18
2018
-19
Financial year
Number of passenger journeys (millions)
Figure 7Passenger journeys on local bus services in England, since deregulation in 1986 to 2019
Oct 1986
The Transport Act 1985 aimed “to halt the decline that has afflicted the bus industry for more than 20 years”
Nicholas Ridley then Transport Minister
Mar 1999
”For too long the bus has been seen as a workhorse; familiar, even friendly, but rather dull and unexciting. I want to see it become a thoroughbred”
John Prescott then Deputy Prime Minister
Mar 2012
“Our aim now is to see these nascent partnerships [between local transport authorities and bus companies] take root, improving services and boosting passenger numbers”
Norman Baker then Transport Minister
Jul 2019
“I will begin as a matter of urgency the transformation of local bus services. I want higher frequency, low-emission buses, more bus priority corridors, a network that’s easier to understand and use. I want local partnerships between the private sector, which operates the buses, and the public body, which coordinates them”
Boris Johnson Prime Minister
Notes1 From 1986-87 to 2018-19 annual bus passenger journeys in England fell by 5% from 4,500 million to 4,300 million.2 Since the formation of Transport for London in 2000, passenger journeys in London increased by more than 75% from 1,300 million in
2000-01 to 2,400 millionin 2013-14. Since then they declined slightly to 2,200 million in 2018-19. 3 The six metropolitan areas in England are: Greater Manchester, Merseyside, South Yorkshire, Tyne and Wear, West Midlands and West Yorkshire.4 The methodology for estimating bus journeys changed in 2004-05.5 In English regions outside London actual bus passenger journey numbers increased from 1986-87 to 2018-19 in the South East (7%)
and South West (5%). In every other region bus passenger journey numbers fell with the heaviest falls in the North East (58%), North West (46%), and Yorkshire and Humber (55%).
Source: National Audit Offi ce analysis of Department for Transport data
Passenger journeys by bus continued their long-term decline following deregulation, including a ten per cent fall since 2010-11Mar 2019
“Britain is on the verge of a transport revolution … radical new technologies are emerging that will within a generation transform every day journeys … mass transit must remain fundamental to an efficient transport system”
Jesse Norman then Minister for Transport
Jan 1996
Measures announced to lead to “more stable services, high quality accessible vehicles, convenient waiting areas, ticketing schemes, good passenger information and traffic measures designed to improve bus performance“
Steven Norris then Transport Minister
May 2018
“The Bus Services Act 2017 introduced new powers for local authorities and operators to work together to improve local bus services and increase passenger numbers”
Nusrat Ghani then Transport Minister
BusStop

28 Part One Improving local bus services in England outside London
Figure 8Change in the number of passenger journeys per person, per year on local bus services between 2010-11 and 2018-19, by local authority, in England outside LondonBetween 2010-11 and 2018-19, passenger journeys per person per year fell in 70 out of 88 local authorities, of which 24 saw a decrease of more than 10 journeys per person per year
Notes1 Bus journey fi gures are provided to the Department for Transport by bus operators.2 There are 88 local authorities in England outside London (Combined Authorities in the six main metropolitan
areas are each treated as one local authority).3 During the period local light rail services expanded in some areas, including Nottingham and Greater Manchester.
Source: National Audit Offi ce analysis of Department for Transport data
Change in the number of bus journeys per person
Decrease between 20.1 and 30
Decrease between 10.1 and 20
Decrease between 0.1 and 10
Increase between 0.1 and 10
Increase between 10.1 and 20
Increase between 20.1 and 30
Increase between 30.1 and 40
Data not included
Improving local bus services in England outside London Part Two 29
Part Two
Revenue funding for bus services
2.1 Deregulation means that government relies on the market to provide the majority of bus services. Public money has always supported the system, reflecting government’s acceptance that the market alone cannot provide affordable bus services at all times and in all places. This part examines the effectiveness of the revenue funding model for local bus services, including:
• the elements that make up the revenue funding model to operators;
• central government subsidy – the Bus Service Operators Grant; and
• local authority support for bus services.
It also summarises recent funding changes resulting from the COVID-19 pandemic.
The elements of revenue funding for bus service operators
2.2 In 2018-19, bus operators received £3.4 billion in revenue from bus services across England outside London. Of this, fare-paying passengers generated 59% (53% in 2010-11). The remaining 41% was public money including:
• the Bus Service Operators Grant, a subsidy paid by the Department for Transport (the Department) to operators (Figure 9 overleaf);
• local authority funding for supported services; and
• reimbursement for statutory and discretionary concessionary travel.
The Department estimates that the bus sector as a whole made a median profitability of 8.5%, before the cost of investment in buses, in 2017-18, the most recent year it has assessed. In December 2011, the Competition Commission concluded that industry profitability should be 8.5% to 11%.

30 Part Two Improving local bus services in England outside London
Figure 9Net government revenue spending on local bus services in England outside London, 2018-19Bus services are delivered by operators who receive their operating cashflow from a range of different sources
Gross operating revenue Of which, net government support
London £2.02 billion £0.8 billion
England outside London £3.44 billion* £1.27 billion
Total (Whole of England) £5.46 billion £2.07 billion
* Includes £2.04 billion of revenue generated through fare paying passengers and excludes £129 million of revenue retained by local authorities on tendered services.
Central government Local government Bus operators
1 Total value of the Bus Service Operators Grant (BSOG) paid from HM Treasury to the Department for Transport.
2 Principally composed of local government DEL.
3 This is funding for all local services provided by a local authority. Local transport is not ringfenced meaning no specifi c funding is allocated and it is up to individual local authorities to decide how much support to provide for bus services.
4 BSOG paid directly to operators from the Department for Transport.
5 Locally raised funds, or bids into grant funding for specifi c initiatives to support bus services, for example developer contributions or parking levies.
6 BSOG paid to operators via local authorities.
7 Funding from local authorities for supported bus services.
8 Concessions reimbursement for operators.
9 Includes taxes on fuel duty, employer payroll taxes and corporation tax.
Notes1 Figures may not sum due to rounding.2 Locally raised funds are generated primarily through local council taxes and business rates that are not sent to HM Treasury.3 The Department for Transport also provides ad hoc capital funding for local bus services (not shown in fi gure above). These funds are usually
allocated through bidding processes (see paragraphs 3.12 to 3.16). 4 The funding fl ows do not refl ect how funding works in London where bus services are franchised.
Source: National Audit Offi ce analysis of Department for Transport data
Department for Transport Ministry of Housing, Communities & Local Government
88 local authorities Travel concession authorities
Bus operators
HM Treasury
£205m4
Locally raised or other funds5
Annual funding to support local government2
Local government settlement3
£248m1
£43m6
£264m7£43m6 £762m8
£762m7
Duties, taxes and other charges9

Improving local bus services in England outside London Part Two 31
2.3 Congestion means operators need to put on more buses to maintain frequency. Combined with falling bus use, this puts pressure on operator profit, which in turn leads to fare increases, contributing to falling bus use in a vicious cycle. Other pressures can include increases in fuel and wage costs and investing in new vehicles to meet modern emission and accessibility standards. Between 2010-11 and 2018-19, as fare-paying passenger journeys fell 6%, total estimated operator revenue fell by 11% (net of concessions and concessionary journeys) and fares increased by an average 18% in real terms.
2.4 Bus fares rose faster than regional rail fares, and fastest in English metropolitan areas – a 94% real increase since 1995 (Figure 10 overleaf). The relative cost of fares and motoring fuel is one factor affecting bus use, for those who have the choice to drive. The Department has also noted that new regulatory costs, such as charges when entering Clean Air Zones, are further increasing pressure on the large number of small-medium sized operators that make up 20% of the bus market. Because these operators lack economies of scale they typically operate at lower profit margins resulting in them running older less fuel-efficient vehicles, which are costly to retrofit.
2.5 At the same time, net government revenue spending on bus travel in England outside London fell 26% from £1.7 billion in 2010-11 to £1.3 billion (Figure 11 on page 33). Excluding the cost of concessions, the overall fall was largest in non-metropolitan areas (41%) compared with metropolitan areas (23%). Across England outside London, some 24% of bus operators’ income now comes from government subsidy and support, compared with 31% in 2010-11.16 The following sections examine the elements of that funding.
Central government subsidy – Bus Service Operators Grant
2.6 In contrast to rail and aviation operators, bus operators pay duty on fuel.17 The Bus Service Operators Grant (BSOG) is a subsidy paid in advance by the Department to operators of eligible bus services and community transport organisations to recover part of that duty. Its aim is to benefit passengers by helping operators keep fares down and run services that might otherwise be unprofitable.18 In 2018-19, the Department spent £248 million on BSOG, 31% less than in 2010-11. The fall was mainly caused by the Department reducing the rate of subsidy and the reduction in mileage travelled.19
16 This percentage will vary by individual operator.17 HC Transport Committee, Bus services in England outside London, Ninth Report of Session 2017–2019,
HC 1425, May 2019.18 Department for Transport, Bus Service Operators Grant: guidance for commercial transport operators,
September 2019.19 A small proportion of BSOG goes directly to local authorities for supported services.

32 Part Two Improving local bus services in England outside London
Figure 10Local bus fare index (in constant prices) in England, by metropolitan area status, from 1995 to 2019
March 1995 = 100
Notes1 Department for Transport data on fares are available from 1995 only.2 Figures are rebased to 1995.3 No index is available for motor vehicle running costs in 2019. The motoring index includes purchase of a vehicle, maintenance,
petrol and oil and insurance.4 Regional rail fares index increased from 100 to 121 from 1995 to 2018 – no index is available for 2019. 5 The six metropolitan areas in England are: Greater Manchester, Merseyside, South Yorkshire, Tyne and Wear, West Midlands and
West Yorkshire.6 London includes Greater London consisting 32 boroughs surrounding the city of London.
Source: National Audit Office analysis of Department for Transport data
Since records began in 1995, bus fares increased at a rate higher than inflation, and motor vehicle running costs
0
20
40
60
80
100
120
140
160
180
200
1995 1997 1999 2001 2003 2005 2007 2009 2011 2013 2015 2017 2019
English metropolitan areasEngland outside LondonEnglish non-metropolitan areasLondon
Benchmark – Motoring vehicle running costs
194
169
152
107
160
147
140
113
180
152
171
End of financial year
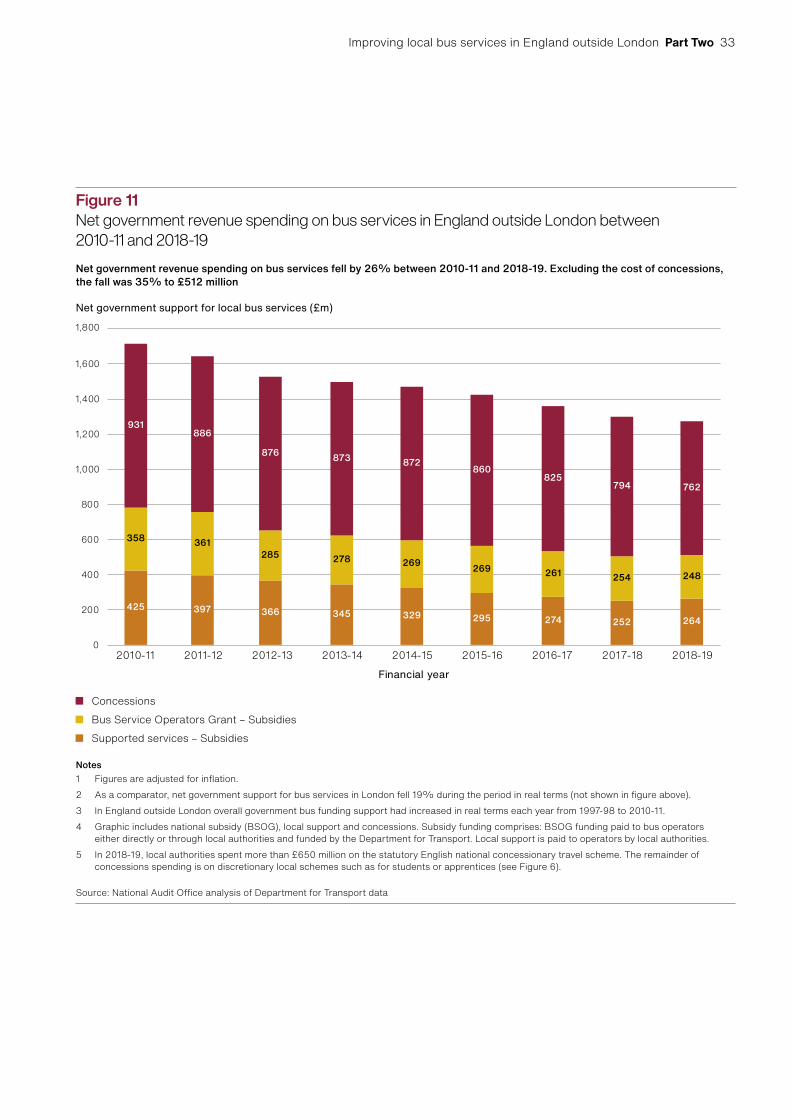
Improving local bus services in England outside London Part Two 33
Figure 11Net government revenue spending on bus services in England outside London between 2010-11 and 2018-19
Net government support for local bus services (£m)
Net government revenue spending on bus services fell by 26% between 2010-11 and 2018-19. Excluding the cost of concessions, the fall was 35% to £512 million
Notes1 Figures are adjusted for inflation.2 As a comparator, net government support for bus services in London fell 19% during the period in real terms (not shown in figure above). 3 In England outside London overall government bus funding support had increased in real terms each year from 1997-98 to 2010-11.4 Graphic includes national subsidy (BSOG), local support and concessions. Subsidy funding comprises: BSOG funding paid to bus operators
either directly or through local authorities and funded by the Department for Transport. Local support is paid to operators by local authorities.5 In 2018-19, local authorities spent more than £650 million on the statutory English national concessionary travel scheme. The remainder of
concessions spending is on discretionary local schemes such as for students or apprentices (see Figure 6).
Source: National Audit Office analysis of Department for Transport data
ConcessionsBus Service Operators Grant – SubsidiesSupported services – Subsidies
0
200
400
600
800
1,000
1,200
1,400
1,600
1,800
425
358
931
2010-11
397
361
2011-12
366
285
2012-13
345
278
2013-14
329
269
2014-15
295
269
2015-16
274
261
825
2016-17
252
254
794
2017-18
264
248
2018-19
Financial year
886
876 873 872860
762

34 Part Two Improving local bus services in England outside London
2.7 Operators told us that with their margins at risk of becoming unsustainable, BSOG is important for them to remain in business – this view is supported by industry experts. However, BSOG is not linked to the level of need, number of passengers, or performance of services and could act as a disincentive for operators to switch to electric buses.20 Payment in advance means the Department carries a risk should a large provider go into liquidation.
2.8 BSOG was last reformed in 2013 by:21
• creating a new local government fund – Better bus areas;
• tightening rules on which bus services can claim BSOG; and
• devolving to Transport for London (TfL) and the Greater London Authority BSOG paid to bus operators under contract to TfL in London.22
2.9 The Department recognises the risks and limitations of the existing BSOG system and agrees with stakeholders that in its current form the subsidy is outdated. It has already tried including within the BSOG model incentives for operators to move to lower emission vehicles and improve ticketing and vehicle location technology. Its approach to encouraging a shift to electric buses is based on capital grants rather than subsidy. The Department has been discussing reforming BSOG for several years, and in September 2019 committed again to do so.23
Local authority revenue support for buses, 2010-11 to 2018-19
2.10 In 2018-19, the Department estimated local authorities spent £264 million to support bus services, resulting in around 170 million journeys on routes which would otherwise not run. However, this compares with a spend of £425 million in 2010-11, a real terms fall of 38%. This is in line with a wider reduction of around 40% in total local transport spending and is similar to reductions in local government spending on other non-statutory services. Supported local services are essential to those who rely on them but are expensive to tender and often generate little revenue to offset against the costs. In 2016, the Department concluded that tendered bus services provide between £2 and £2.50 of benefits for every £1 of local authority spend.24
20 Operators of vehicles that hold a low carbon emission certificate may be eligible for an additional incentive payment of 6p/km.
21 Department for Transport, Bus Service Operators Grant (BSOG) reforms, Written statement to Parliament, July 2013.
22 In 2018-19, the administration of BSOG for commercial services operated within the Transport for Greater Manchester boundary was also devolved.
23 Department for Transport, A better deal for bus users, September 2019.24 Department for Transport, Value for Money of Tendered Bus Services, Moving Britain Ahead, February 2016.
Improving local bus services in England outside London Part Two 35
2.11 Of 85 local authorities that were operational in both years, 72 reduced spending on supported bus services in real-terms.25 In 2018-19, 14 local authorities provided no funding for supported services, compared to four in 2010-11. On average, funding fell most in non-metropolitan areas, such as rural shire counties (Figure 12 on pages 36 and 37).
2.12 The reduction in funding for supported services has led to the loss and curtailment of routes, but the Department does not collect data on how many, or the impact on passengers. The Campaign for Better Transport has estimated that, since 2010-11, 3,000 bus routes have been reduced, altered or withdrawn.26 Total miles travelled on supported services fell more than 50% from 243 million miles in 2010-11 to 112 million miles in 2018-19, faster than on commercial services, with the biggest reduction in non-metropolitan areas. The Department reported passenger journeys on supported services fell by 31% between 2011-12 and 2017-18, but has since stopped collecting the data as it was unreliable. In some areas, for example Oxfordshire, we saw examples of community transport stepping in to replace lost services. The Department does not collect data on all community transport.
Local authority funding context
2.13 The Department told us that, in line with wider Government policy, it has been mindful of the need to reduce reporting burdens on local authorities and has therefore taken a light-touch approach to gathering information on the financial sustainability of local bus services, given this is an area of devolved spending. During our work, which primarily took place before the COVID-19 crisis, we observed that while the Department collected a lot of data on buses, it did not routinely bring data together to monitor how government interventions impacted sustainability across the bus system. As we have previously reported localism gives local authorities greater control over spending decisions, but consequently means those departments with responsibility for local services may have less oversight.27
25 The number of operational local authorities reduced from 96 to 85 between 2010-11 and 2018-19. This was due to local government reorganisation where previously separate local authorities were merged or joined with combined authorities.
26 Campaign for Better Transport, Future of the bus: future funding arrangements, October 2019. 27 Comptroller and Auditor General, Local government funding: Assurance to Parliament, Session 2014-15,
HC 174, National Audit Office, June 2014.
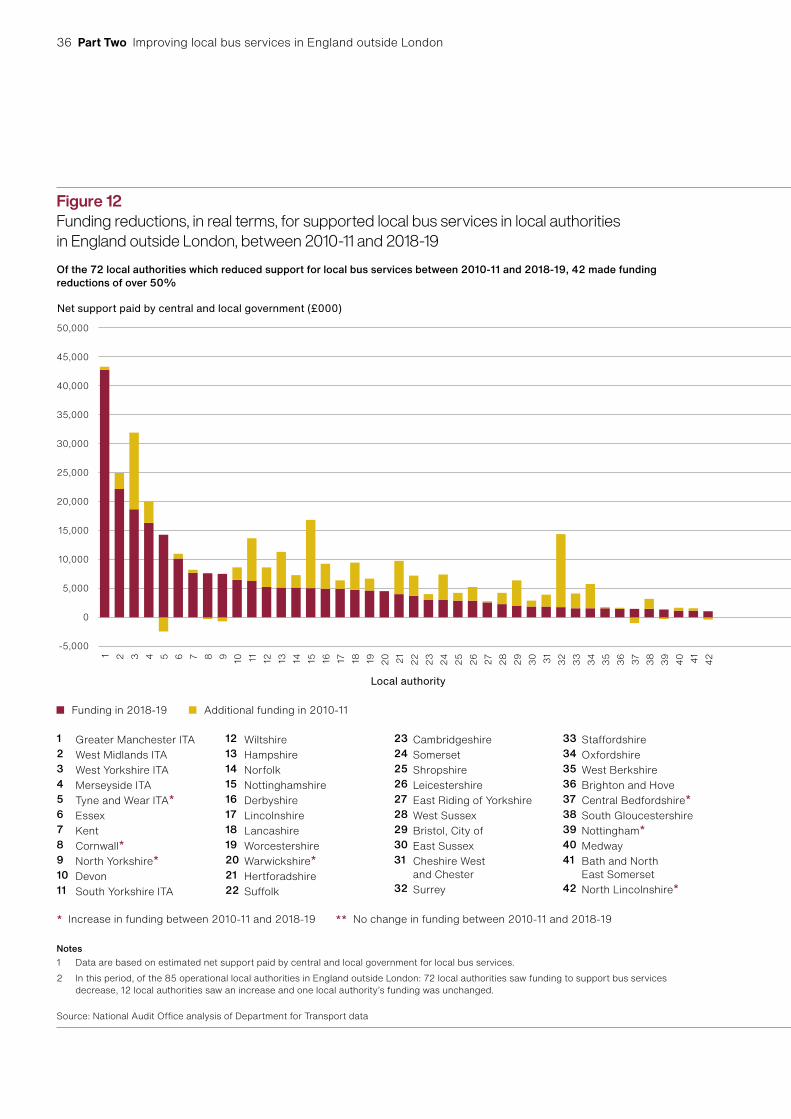
36 Part Two Improving local bus services in England outside London
Figure 12Funding reductions, in real terms, for supported local bus services in local authorities in England outside London, between 2010-11 and 2018-19Of the 72 local authorities which reduced support for local bus services between 2010-11 and 2018-19, 42 made funding reductions of over 50%
Net support paid by central and local government (£000)
-5,000
5,000
10,000
15,000
20,000
25,000
30,000
35,000
1 2 3 4 5 6 7 8 9 10 11 12 13 14 15 16 17 18 19 20 21 22 23 24 25 26 27 28 29 30 31 32 33 34 35 36 37 38 39 4140 42 43 44 45 46 47 48 49 50 51 52 53 54 55 56 57 58 59 60 61 62 63 64 65 66 67 68 69 70 71 72 73 74 75 76 77 78 79 80 81 8382 84
40,000
45,000
50,000
85
Local authority Local authority
0
Funding in 2018-19
* Increase in funding between 2010-11 and 2018-19
Additional funding in 2010-11
** No change in funding between 2010-11 and 2018-19
1 Greater Manchester ITA2 West Midlands ITA3 West Yorkshire ITA4 Merseyside ITA5 Tyne and Wear ITA*6 Essex7 Kent8 Cornwall*9 North Yorkshire*10 Devon11 South Yorkshire ITA
12 Wiltshire13 Hampshire14 Norfolk15 Nottinghamshire16 Derbyshire17 Lincolnshire18 Lancashire19 Worcestershire20 Warwickshire*21 Hertforadshire22 Suffolk
23 Cambridgeshire24 Somerset25 Shropshire26 Leicestershire27 East Riding of Yorkshire28 West Sussex29 Bristol, City of30 East Sussex31 Cheshire West
and Chester32 Surrey
33 Staffordshire34 Oxfordshire35 West Berkshire36 Brighton and Hove37 Central Bedfordshire*38 South Gloucestershire39 Nottingham*40 Medway41 Bath and North
East Somerset42 North Lincolnshire*
43 Bedford44 York45 Windsor and Maidenhead46 Warrington47 Bracknell Forest*48 Northamptonshire49 Rutland*50 Peterborough51 Wokingham52 Thurrock*53 Poole
54 Leicester55 Telford and Wrekin56 Plymouth57 Bournemouth*58 Kingston upon Hull, City of59 Southampton60 Cumbria61 Redcar and Cleveland62 Middlesbrough63 Stockton-on-Tees64 Portsmouth
65 Stoke-on-Trent66 Darlington67 Isle of Wight68 Gloucestershire69 Torbay70 Milton Keynes71 Dorset72 Herefordshire, County of73 Blackburn with Darwen74 North Somerset75 Reading
76 Swindon77 Hartlepool78 Derby79 Slough80 Southend-on-Sea81 Buckinghamshire82 Luton**83 North East Lincolnshire*84 Cheshire East85 Blackpool
Notes1 Data are based on estimated net support paid by central and local government for local bus services.2 In this period, of the 85 operational local authorities in England outside London: 72 local authorities saw funding to support bus services
decrease, 12 local authorities saw an increase and one local authority’s funding was unchanged.
Source: National Audit Offi ce analysis of Department for Transport data
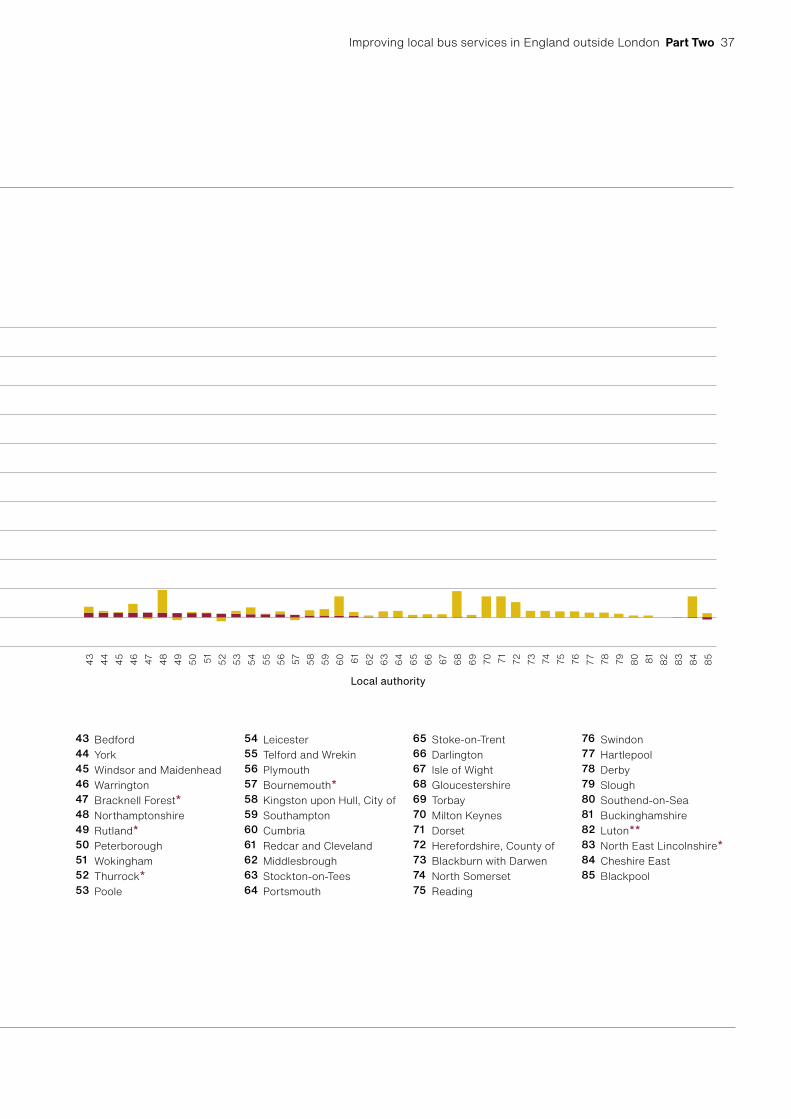
Improving local bus services in England outside London Part Two 37
Figure 12Funding reductions, in real terms, for supported local bus services in local authorities in England outside London, between 2010-11 and 2018-19Of the 72 local authorities which reduced support for local bus services between 2010-11 and 2018-19, 42 made funding reductions of over 50%
Net support paid by central and local government (£000)
-5,000
5,000
10,000
15,000
20,000
25,000
30,000
35,000
1 2 3 4 5 6 7 8 9 10 11 12 13 14 15 16 17 18 19 20 21 22 23 24 25 26 27 28 29 30 31 32 33 34 35 36 37 38 39 4140 42 43 44 45 46 47 48 49 50 51 52 53 54 55 56 57 58 59 60 61 62 63 64 65 66 67 68 69 70 71 72 73 74 75 76 77 78 79 80 81 8382 84
40,000
45,000
50,000
85
Local authority Local authority
0
Funding in 2018-19
* Increase in funding between 2010-11 and 2018-19
Additional funding in 2010-11
** No change in funding between 2010-11 and 2018-19
1 Greater Manchester ITA2 West Midlands ITA3 West Yorkshire ITA4 Merseyside ITA5 Tyne and Wear ITA*6 Essex7 Kent8 Cornwall*9 North Yorkshire*10 Devon11 South Yorkshire ITA
12 Wiltshire13 Hampshire14 Norfolk15 Nottinghamshire16 Derbyshire17 Lincolnshire18 Lancashire19 Worcestershire20 Warwickshire*21 Hertforadshire22 Suffolk
23 Cambridgeshire24 Somerset25 Shropshire26 Leicestershire27 East Riding of Yorkshire28 West Sussex29 Bristol, City of30 East Sussex31 Cheshire West
and Chester32 Surrey
33 Staffordshire34 Oxfordshire35 West Berkshire36 Brighton and Hove37 Central Bedfordshire*38 South Gloucestershire39 Nottingham*40 Medway41 Bath and North
East Somerset42 North Lincolnshire*
43 Bedford44 York45 Windsor and Maidenhead46 Warrington47 Bracknell Forest*48 Northamptonshire49 Rutland*50 Peterborough51 Wokingham52 Thurrock*53 Poole
54 Leicester55 Telford and Wrekin56 Plymouth57 Bournemouth*58 Kingston upon Hull, City of59 Southampton60 Cumbria61 Redcar and Cleveland62 Middlesbrough63 Stockton-on-Tees64 Portsmouth
65 Stoke-on-Trent66 Darlington67 Isle of Wight68 Gloucestershire69 Torbay70 Milton Keynes71 Dorset72 Herefordshire, County of73 Blackburn with Darwen74 North Somerset75 Reading
76 Swindon77 Hartlepool78 Derby79 Slough80 Southend-on-Sea81 Buckinghamshire82 Luton**83 North East Lincolnshire*84 Cheshire East85 Blackpool
Notes1 Data are based on estimated net support paid by central and local government for local bus services.2 In this period, of the 85 operational local authorities in England outside London: 72 local authorities saw funding to support bus services
decrease, 12 local authorities saw an increase and one local authority’s funding was unchanged.
Source: National Audit Offi ce analysis of Department for Transport data
38 Part Two Improving local bus services in England outside London
2.14 The Department relies on the Ministry of Housing, Communities and Local Government (MHCLG) for assurance on the overall financial health and accountability of local authorities. However, we have previously reported that MHCLG has focused its attention on its priority areas such as social care, rather than on understanding the impact of funding reductions across local authority services as a whole, including transport. The Committee of Public Accounts reported in July 2018 that while there had been improvements in its oversight, MHCLG had insufficient data to assess the impact of local authority funding reductions on service users in areas such as transport.28 MHCLG had originally planned to announce a new local government funding formula in 2020-21, but has since announced that this will not go ahead and it will consider the way forward in the Spending Review.
2.15 In addition to their central government grant funding, local authorities can generate funds to support and improve bus services from local taxes and duties. In the City of Nottingham, a workplace parking levy helps fund public transport (Appendix Three). Approaches such as this rely on local political support. Authorities may also leverage funds from developers of new housing, but we found their capability in securing and using developer contributions was highly variable.29
2.16 Local authorities across England report an additional funding pressure within their transport budgets caused by the statutory duty to reimburse operators for free travel by older and disabled people. These statutory concessions, which cost local authorities more than £650 million in 2018-19, are akin to a locally delivered national benefit, which local authorities must pay for from their non-ringfenced funding.
2.17 In 2018-19 more than 28% of bus journeys in England outside London were on statutory concessions,30 and when combined with a smaller element of non-statutory free travel, this accounted for 22% of operator revenue. Concessions spending now forms a larger proportion of the total that local authorities spend in relation to bus travel (Figure 11). However, the Department does not know how this impacts on the choices local authorities make about spending on supported services or working with operators on improvements. In March 2019, the Transport Select Committee recommended the government review how concessionary bus travel is financed. The government disagreed, taking the view that this should be looked at in the round as part of MHCLG’s wider review of local government needs and resources.31
28 HC Committee of Public Accounts, Financial sustainability of local authorities, Fiftieth report of Session 2017–2019, HC 970, July 2018.
29 Comptroller and Auditor General, Ministry of Housing, Communities & Local Government, Planning for new homes, Session 2017–2019, HC 1923, National Audit Office, February 2019.
30 Department for Transport published data set BUS0105.31 HC Transport Committee, Bus services in England outside London, Ninth Report of Session 2017–2019,
HC 1425, May 2019. HM Government, Bus services in England outside London: Government’s response to the Committee’s Ninth Report of Session 2017-19, October 2019.

Improving local bus services in England outside London Part Two 39
COVID-19 and bus funding
2.18 The government provided urgent support for the bus sector in response to the COVID-19 pandemic. The Department paused or redirected £70 million of the £220 million funding announced for buses in 2020-21 to emergency support, and allowed local authorities to use a further £30 million to ensure existing services could be safeguarded. In April 2020, government agreed a rescue package to keep buses in England outside London running during the pandemic for those who needed them, such as key workers. It included a 12-week ‘Covid-19 Bus Services Support Grant’ totalling £167 million paid to operators. The Department required operators to “maintain necessary services” at a level sufficient to meet the reduced demand and allow space between passengers on board. The Department subsequently announced two further support grant packages encouraging operators to run up to 100% of scheduled commercial mileage. The second package, which totalled £254million, ran from 12 May to 3 August. The third, running on a rolling basis from 4 August, provided £27.3 million per week in support. The Department also agreed to continue paying existing BSOG to operators as normal, even though fuel consumption was reduced.

40 Part Three Improving local bus services in England outside London
Part Three
The Department’s approach to improving bus services
3.1 This part examines the effectiveness of central government’s current approach to improving bus services. It covers:
• what evidence the Department for Transport (the Department) has about how best to improve bus services;
• support for partnership working between local authorities and operators;
• capital funding for improvements; and
• improving bus information for passengers.
What works in improving bus services
3.2 There is good evidence on what works in improving and increasing commercially viable bus services: long-term locally led interventions with wide support, particularly those which target congestion, improve speed and reliability, and hence make more routes profitable to run. This reduces the need for local authority support, freeing up funding for further improvements or other purposes. Work commissioned by the Urban Transport Group in 2019 identified six conditions for ‘good bus territory’ and used these to estimate the potential for improvement in specific parts of the country, with a view to targeting government support.32 The key challenges are different in urban areas and more rural or town-fringe areas.
32 Urban Transport Group, What scope for boosting bus use? An analysis of the intrinsic bus potential of local authority areas in England, October 2019.

Improving local bus services in England outside London Part Three 41
3.3 Tackling congestion is key to the success of urban bus services (Figure 13 overleaf). In November 2009, the Cabinet Office estimated the cost of congestion to the urban economy at £11 billion per year, before including the costs of poor air quality, ill-health and road accidents.33 A 2016 report for Greener Journeys concluded that “the potential benefit of the bus is stifled by traffic congestion” and that each 10% decrease in bus speed reduces patronage by at least 10%.34 Some urban areas (for example Nottingham City and the West Midlands) have made progress with bus priority lanes. Another example which also demonstrates the importance of long-term local leadership is from outside England – Belfast’s ‘Glider’ bus service (Appendix Three). In September 2019, the Department announced it will provide capital funding only for road improvements where bus prioritisation measures are included, unless local authorities can explain why their inclusion is not necessary or appropriate.35
3.4 In rural areas and at the fringes of towns and cities, sustaining commercial bus routes is more difficult, and local authorities have historically supported services (Figure 14 on page 43). ‘Demand-responsive’ services, where passengers request a pick-up and drop-off by minibus via phone or app, although not a new concept, are now being trialled as a more cost-effective means of maintaining a service for people where there is low demand. Lincolnshire has seen success with this approach (Appendix Three).
The Department’s interventions to improve bus services
3.5 In 2018, the Department set out two actions in support of improving bus services: to implement the Bus Services Act 2017 (the 2017 Act), and to “open up data from the bus sector”. It also continues to provide a range of capital funding pots for local government. The following paragraphs examine these approaches.
33 Cabinet Office Strategy Unit, An analysis of urban transport, November 2009.34 Greener Journeys, The impact of congestion on bus passengers, June 2016.35 Department for Transport, A better deal for bus users, September 2019.

42 Part Three Improving local bus services in England outside London
Figure 13Challenges in improving local bus services – high frequency urban services
In built-up areas, congestion is a key barrier to success for bus
Source: National Audit Office analysis of TAS Partnership Ltd information
Demand falls
Costs rise to maintain frequency
More car journeys
Morecongestion
Slower bus speeds
Demand falls
Fares increase
Vicious cycle of bus decline (high frequency service areas)
BusStop

Improving local bus services in England outside London Part Three 43
Figure 14Challenges in improving local bus services – low frequency rural and sub-urban services
In rural areas and town fringes, sustaining commercial bus routes can be difficult
Source: National Audit Office
Demandfalls
More support needed
Reduced service
provision(routes/
frequency)
Bus less attractive
Fundingcuts
Reduced fare
income
Vicious cycle of bus decline(low frequency service areas)
BusStop

44 Part Three Improving local bus services in England outside London
Encouraging local authority–operator partnerships
3.6 Relationships between authorities and operators vary and there are some well-established informal, voluntary partnerships, for example in the West Midlands (Appendix Three). To improve partnership working across the country, the Department introduced the 2017 Act which aimed to:
• strengthen arrangements for local authority–operator partnership working, introducing new Advanced Quality and Enhanced Partnership Schemes;
• introduce bus franchising powers to replace Quality Contract Schemes. Franchising powers, similar to those in London, are only available automatically to mayoral combined authorities.36 Other authorities can request franchising powers, but need the consent of the Secretary of State and secondary legislation to obtain them and must demonstrate their capability to deliver (Figure 15).37
Quality Contract Schemes had been introduced under the 2000 Transport Act and provided legal powers to decide on prices and routes. However, local authorities found it difficult to meet the scheme requirements and it took 15 years for the first and only application to be made, which did not proceed. The Quality Contracts Scheme Board formed the opinion that it had not been demonstrated that the proposal met the criteria of affordability, value for money and other requirements.
3.7 The Department’s guidance to local authorities emphasises that it is for authorities to work with operators to decide which arrangements will best improve local services, and underlines the importance of: good local authority-operator relationships; consensus on what needs to be done; and trust that partners will deliver “their part of the bargain”.
3.8 It was not until April 2020 that the first Enhanced Bus Partnership using the 2017 Act was agreed between Hertfordshire County Council and more than 20 local bus operators. Under the Partnership they will work more closely together aiming to improve services and infrastructure in the county. Transport for West Midlands has developed plans for an Enhanced Partnership as part of its strategic vision for bus, and began a consultation in June 2020. Franchising is a more ambitious approach, involving local authorities taking on some of the financial risks and rewards of running local bus services and allowing them to set route frequencies and running hours of bus services, subject to conditions. Currently, Greater Manchester Combined Authority has made the most progress in considering whether to introduce franchising and following the requirements of the 2017 Act. It recently consulted on a proposed franchising scheme for the entire Greater Manchester area. In June 2020 the combined authority noted the findings of the consultation and it is awaiting a report on the potential impact of the COVID-19 pandemic.
36 Greater Manchester; Liverpool city region; Sheffield city region; West Midlands; North of Tyne; West of England; and Tees Valley.
37 Except North of Tyne region combined authority which is not responsible for local transport.

Improving local bus services in England outside London Part Three 45
3.9 The Department acknowledges that progress implementing the 2017 Act is slower to date than expected and has been working to understand the reasons. The Department believes the 2017 Act has encouraged informal partnerships, although their informal nature has meant it is unable to obtain reliable data on their extent, including on any local service improvements being achieved. However, at the same time, previous partnership working arrangements are likely to have declined as local authorities have reprioritised spending and reduced the size of transport planning teams. For example, in Oxfordshire a Quality Partnership led to service improvements in 2011. The local authority told us that subsequent funding cuts prevented it building on these, and the partnership lost impetus. In 2020, it set up a Strategic Bus Board with experienced members from across the council and is actively engaged with local operators to reinvigorate partnership working.
Figure 15Aspects of different local authority-operator partnership arrangements under the Bus Services Act 2017
The 2017 Act introduced two new types of partnership as well as the option of franchising
Can a requirement be put on bus operators to:
Ticketing schemes
Advanced Quality
Partnership
Enhanced Partnership
Franchising
Sell and accept a multi-operator or multi-modal ticket (including in a specific format, such as on a smart card)?
Market particular tickets in a certain way (including promoting multi-operator tickets not just their own tickets)?
Set all their tickets and fares on a standard set of ‘zones’ that apply to all operators?
Follow common ticket rules for their own tickets (such as a standard length of ‘period’ tickets or age to qualify for a youth concession if offered)?
Sell or accept any ticket on a particular technology (such as a smart card)?
Charge a set price for a multi-operator ticket?
Charge a set price for their own, single-operator tickets?
Source: Bus Services Act 2017, Department for Transport

46 Part Three Improving local bus services in England outside London
Open bus data – improving passenger information
3.10 In 2005 we reported that since operators are not formally accountable for the reliability and punctuality of bus services to local people, there was scope to make the market more effective by making performance information more readily available and transparent to local communities.38 The Department has recognised for some time that improved passenger information is an important mechanism to encourage bus use, as outside London many timetables or fares are only available at bus stops or on buses.
3.11 Under the 2017 Act, the Department has created a prototype Bus Open Data Service which aims to provide national fare and journey times.39 By 31 December 2020, operators should have provided bus timetable data; by 7 January 2021 they should provide vehicle location, basic fares and tickets data; and by 7 January 2023, all fares and ticket data. The Department has recognised concerns we heard from smaller operators about potential costs of complying with the open data requirements. It has provided free data creation tools and data hosting and plans further support; it is too early to assess the level of compliance or quality of data or whether these measures will stimulate demand and increase the beneficial effects of competition for users.
Capital funding for bus improvements3.12 One of the Department’s main levers for influence at local level is its provision of short-term capital funding pots to fund specific improvements, usually on the basis of competitive bidding by local authorities. In the longer term, capital projects to address congestion or reduce emissions can also contribute to reducing operators’ costs. Some funds are bus-specific, for example to enable local authorities and operators to invest in zero emission vehicles, or infrastructure such as bus shelters, bus lanes and digital information. The largest funding pots have been aimed at integrated local transport improvement schemes, not just buses, and include the £2.5 billion Transforming Cities Fund. Relevant capital funding announcements since 2010-11 include £586 million (the Department’s contribution) for bus rapid transit and other local transport schemes and a number of funding pots ranging from £7 million40 to £600 million for greener buses and other sustainable transport. However, the Department does not keep a central record of the total capital funding it allocated to or actually spent on buses.
3.13 The Department aims to carry out evaluations on all the bus capital schemes it funds. The available evaluations suggest the schemes have achieved positive benefit-cost ratios, from £1.80 to £5.10 on average for each £1 invested, depending on the programme, not including wider benefits. We have not examined specific capital funding pots and specific improvements to infrastructure or vehicles in detail in this report, as our focus was on the arrangements for funding and delivery of services.
38 Comptroller and Auditor General, Delivery Chain Analysis for Bus Services in England, Session 2005-06, HC 677, National Audit Office and Audit Commission, December 2005.
39 Department for Transport, Bus Open Data Service Collection, January 2020.40 Local Sustainable Transport Fund.
Improving local bus services in England outside London Part Three 47
3.14 Targeted, competitive funding pots give local authorities access to additional funding to pilot riskier projects or innovations. The Department works actively with local authorities to develop initial bids and monitor project delivery in complex or risky projects, but as we reported in 2011, it is not clear to us whether the Department has a systematic process for selecting projects for more careful monitoring.41
3.15 Despite this funding, pressures on local authorities’ general un-ringfenced capital funding have seen the amount they spend on public transport capital improvements fall by 87% between 2010-11 and 2018-19. The Department is concerned about local authority transport planning capability to access funding where there is need. Local authorities report that time-limited central government funding pots for specific projects are not always helpful, for several reasons:
• The cost and time investment in preparing bids. While the Department may have a specific policy objective at a certain time, high-quality proposals to improve local bus services are not always ready to present ‘off the shelf’. They often need long-term planning to succeed and sustain because they depend on other parts of an integrated local transport policy, such as congestion measures and town planning, and on investment by the bus operator. The resources required to bid for, report on and account for competitive funding can be too great for smaller authorities.
• Reduced flexibility. The use of competitive capital pots gives the Department a higher degree of assurance over how the funding is used. But it can restrict local authorities’ flexibility in terms of when they use it or how they combine it with other sources of funding such as developer contributions.
• Disconnect from revenue funding. The Department’s provision of ad hoc capital funding pots comes against a background of wider pressure on local authorities’ non-ringfenced revenue funding. There is a risk that authorities are unable to allocate revenue funding to maintain the capital improvements, and hence sustain the benefits.
3.16 In 2018 we cautioned that the whole local authority funding landscape was increasingly characterised by one-off and short-term initiatives – which undermines strategic planning and creates risks to value for money.42 The Department does not have cumulative data on which authorities have bid for and obtained bus capital funding, but it recognises their concerns. It is seeking to learn from experience in working with the Ministry of Housing, Communities and Local Government on that department’s Housing Infrastructure Fund.
41 National Audit Office, Department for Transport: Local Authority Major Capital Schemes, May 2011.42 Comptroller and Auditor General, Financial sustainability of local authorities 2018, Session 2017–2019, HC 834,
National Audit Office, March 2018.

48 Part Four Improving local bus services in England outside London
Part Four
What government needs to get right
4.1 The Department for Transport’s (the Department’s) bus strategy has been delayed by the COVID-19 pandemic and the need to switch attention and resources to urgent response measures. The response to the pandemic also meant that government needed to shift from an objective of increasing bus use, to advising people in the short-term not to use the bus, except for essential travel. Anecdotal evidence suggests that some people may consider a more permanent switch to other modes of transport, such as car or bike, or travel less. However, bus travel will remain the primary and essential mode of daily transport for many others, especially the most disadvantaged.
4.2 The Department plans to publish its bus strategy by the end of 2020. This part sets out our analysis of weaknesses government needs to address to succeed in the long-term, including: supporting local authorities to deliver; working across government; and lessons from our previous work on the factors that departments need to address when attempting to drive strategic change in a complex devolved sector.
Supporting local government capability
4.3 The Department believes a key reason for the slow pace of improvement in bus services is diminished capability and capacity in local authorities’ transport planning teams. Our case study visits supported this view. Reductions in capability have been greatest in county councils. One council told us that a reduced transport planning team had contributed to the loss of previously strong relationships with the local operators, which it was working to recover. The Association of Transport Co-ordinating Officers, which brings together specialist transport officers at working level from across local authorities, it told us it has seen a gradual erosion in membership and sponsorship, including from local authorities, reducing opportunities for local transport planning officials to share knowledge, provide support and build skills.

Improving local bus services in England outside London Part Four 49
4.4 At the same time the Department’s oversight and support for local transport planning has reduced. In 2005, we said the Department had strengthened its review of Local Transport Plans,43 and was challenging local authorities to set their own targets for growth in bus use. However, in 2012, we reported that the Department had stopped reviewing Local Transport Plans and no longer linked its funding formulae to the quality of these plans.44 In December 2018, we found only 44% of wider Local Plans (of which Local Transport Plans would be part) were up to date, and 14% of authorities had no plan at all.45 The Department is concerned about local transport planning capability. It has a network of contacts in cities, engaging regularly with the Urban Transport Group. However, despite links with the Association of Directors of Environment, Economy, Planning and Transport, it has less contact with towns and rural areas where transport planning capability is weakest.
Working across government
4.5 The Department has signalled a significant policy change to prioritise buses over cars, and shift more journeys to public transport.46 Achieving this outcome will involve influencing people’s travel choices in multiple ways, through joined-up working across government. HM Treasury has committed to making a stronger link between funding and outcomes in the Spending Review, including a Shared Outcomes Fund to encourage departments to work together where resources applied by one department can lead to benefits in another policy area.47 There are opportunities for the Department to expand its work, for example, with:
• the Department for Environment, Food & Rural Affairs (Defra) and local authorities on prioritising the bus to improve air quality, building on the work of the Joint Air Quality Unit. We note that some local authorities are setting ambitious targets to tackle illegal levels of air pollution contributing to 40,000 premature UK deaths each year, but different solutions are being developed according to local circumstances, rather than as part of a national effort to prioritise buses. This could cause uncertainty and increase costs for operators and bus manufacturers operating across the country;
• HM Treasury on legal and fiscal incentives for greener buses; and
• The Ministry of Housing, Communities and Local Government (MHCLG) on integrating and incentivising bus travel into new home building, where there is clear evidence of failure to meet good practice (Figure 16 on pages 50 and 51).
43 Local Transport Plans set out local objectives for transport in the context of government guidance.44 Comptroller and Auditor General, Funding for local transport: an overview, Session 2012-13, HC 629,
National Audit Office, October 2012.45 Comptroller and Auditor General, Planning for new homes, Session 2017–2019, HC 1923, National Audit Office,
February 2019.46 Department for Transport, Decarbonising Transport – Setting the Challenge, March 2020.47 Comptroller and Auditor General, Improving government’s planning and spending framework, Session 2017–2019,
HC 1679, National Audit Office, November 2018.

50 Part Four Improving local bus services in England outside London
We found local planning officials struggle to realise government’s planning aims
Figure 16New housing and busesThe current system does not support mode shift to bus and locks people into travelling by car
Government’s national planning policy framework6 What local planning officials told us7
• Transport issues should be considered from the earliest-stages of plan making and development proposals.
• “ Section 106 agreements are nailed down at the start of the development, before planners have time to create a comprehensive plan for transport infrastructure and landscape”.
• “ Planning team understaffed with one person dealing with 50 new developments”.
• Opportunities to promote walking, cycling and public transport use are identified and pursued.
• “ Developers do not have to input transport services through section 106 until the 200th house is built. Services need to be in place from day one to encourage bus use”.
• Patterns of movement, streets, parking and other transport considerations are integral to the design of schemes, and contribute to making high quality places.
• “ New developments often do not provide enough road space for buses to provide services”.
Notes1 Ministry of Housing, Communities & Local Government, Single Departmental Plan, June 2019.2 HC Committee of Public Accounts, Planning and the broken housing market, HC 1744, June 2019.3 Comptroller and Auditor General, Planning for new homes, National Audit Offi ce, HC 1923, February 2019.4 Homes England, Garden communities, June 2019.5 Transport for new homes and Foundation for integrated transport, Transport for new homes, July 2018.6 Ministry of Housing, Communities & Local government – National planning policy framework, February 2019.7 Local authority offi cials interviewed during case study visits to Oxfordshire, Lincolnshire and Nottingham.8 Section 106 are legal agreements between local authorities and developers which can provide seed funding for bus services
as well as other local needs such as developing public open space. The government has proposed reforming the Section 106 approach in its August 2020 White Paper, Planning for the Future.
9 Stagecoach guidance, Bus services and new residential developments, July 2017.10 Chartered Institution of Highways and Transportation, Buses in urban developments, 2018.
Source: National Audit Offi ce analysis based on sources above
Government’s housing ambition involves risks around supporting infrastructure
• Government aims to build 300,000 net additional homes per year from mid-2020.1
• “To create new homes and places for people to live, the supporting infrastructure such as public and private transport, healthcare and schools must be in place.”2
• “The way infrastructure is funded is complex, involves several government departments and private developers and lacks cohesion and certainty.”3
Example – Garden communities
Vision
• Large scale developments that will create well-planned, sustainable places for people to live.4
Reality
• “New garden home villages risk becoming car-dependent commuter estates.”5
• “Building in the wrong locations and around the wrong type of transport.”5
Opportunities for progress
Place based approaches (for example the Department’s and MHCLG’s Transforming Cities Fund (paragraph 3.12) aim to develop a package of schemes to meet wider objectives including unlocking housing.
In addition, stakeholders have identified how clearer planning regulations could support a bus culture:
• Bus operator Stagecoach developed guidance for housing developers. It includes details of width of carriageway (1.8 metres) needed to provide bus access.
• The Chartered Institution of Highways & Transportation highlighted a need to include direct and pleasant walking routes to bus stops to encourage use.
BusStop

Improving local bus services in England outside London Part Four 51
We found local planning officials struggle to realise government’s planning aims
Figure 16New housing and busesThe current system does not support mode shift to bus and locks people into travelling by car
Government’s national planning policy framework6 What local planning officials told us7
• Transport issues should be considered from the earliest-stages of plan making and development proposals.
• “ Section 106 agreements are nailed down at the start of the development, before planners have time to create a comprehensive plan for transport infrastructure and landscape”.
• “ Planning team understaffed with one person dealing with 50 new developments”.
• Opportunities to promote walking, cycling and public transport use are identified and pursued.
• “ Developers do not have to input transport services through section 106 until the 200th house is built. Services need to be in place from day one to encourage bus use”.
• Patterns of movement, streets, parking and other transport considerations are integral to the design of schemes, and contribute to making high quality places.
• “ New developments often do not provide enough road space for buses to provide services”.
Notes1 Ministry of Housing, Communities & Local Government, Single Departmental Plan, June 2019.2 HC Committee of Public Accounts, Planning and the broken housing market, HC 1744, June 2019.3 Comptroller and Auditor General, Planning for new homes, National Audit Offi ce, HC 1923, February 2019.4 Homes England, Garden communities, June 2019.5 Transport for new homes and Foundation for integrated transport, Transport for new homes, July 2018.6 Ministry of Housing, Communities & Local government – National planning policy framework, February 2019.7 Local authority offi cials interviewed during case study visits to Oxfordshire, Lincolnshire and Nottingham.8 Section 106 are legal agreements between local authorities and developers which can provide seed funding for bus services
as well as other local needs such as developing public open space. The government has proposed reforming the Section 106 approach in its August 2020 White Paper, Planning for the Future.
9 Stagecoach guidance, Bus services and new residential developments, July 2017.10 Chartered Institution of Highways and Transportation, Buses in urban developments, 2018.
Source: National Audit Offi ce analysis based on sources above
Government’s housing ambition involves risks around supporting infrastructure
• Government aims to build 300,000 net additional homes per year from mid-2020.1
• “To create new homes and places for people to live, the supporting infrastructure such as public and private transport, healthcare and schools must be in place.”2
• “The way infrastructure is funded is complex, involves several government departments and private developers and lacks cohesion and certainty.”3
Example – Garden communities
Vision
• Large scale developments that will create well-planned, sustainable places for people to live.4
Reality
• “New garden home villages risk becoming car-dependent commuter estates.”5
• “Building in the wrong locations and around the wrong type of transport.”5
Opportunities for progress
Place based approaches (for example the Department’s and MHCLG’s Transforming Cities Fund (paragraph 3.12) aim to develop a package of schemes to meet wider objectives including unlocking housing.
In addition, stakeholders have identified how clearer planning regulations could support a bus culture:
• Bus operator Stagecoach developed guidance for housing developers. It includes details of width of carriageway (1.8 metres) needed to provide bus access.
• The Chartered Institution of Highways & Transportation highlighted a need to include direct and pleasant walking routes to bus stops to encourage use.
BusStop

52 Part Four Improving local bus services in England outside London
Leading strategic change – the role of the Department
4.6 The Department has an experienced but small bus policy team. It began discussions with both HM Treasury and MHCLG about future bus funding, and wider stakeholder engagement, in late 2019. The COVID-19 pandemic meant the Department extending the timetable for the Strategy and limited the opportunity for stakeholder engagement in spring 2020. However, the Department told us that during the pandemic it has been able to work more closely with local authorities and operators to develop and use new information to understand areas of critical need and target support. Our observations and previous work across government highlight lessons the Department can learn from in leading change (Figure 17 on pages 52 to 56).
Figure 17Success factors to support the Department’s bus strategyOur previous work provides lessons on delivering a successful strategic approach in a complex, devolved system
Why important Where observed previously in government
What we observe so far
A shared vision for the system to work towards
To give local authorities and operators a basis to plan and work together.
As a basis for joint-working with other departments on interventions to help people switch to bus.
In Water supply and demand management we concluded that Defra needed to provide a much clearer sense of direction to water companies, regulators and consumers.1
Department has published a high-level vision for future urban mobility.2
There is no planned date for a similar vision document for non-urban places.
The COVID-19 pandemic limited the opportunity for consultation work that would have helped test the vision and develop buy-in.
Consistent decision-making in line with vision
To give local authorities and operators confidence that government is fully behind them as they commit resources to long term improvement.
To stay focused on overall goals when trade-offs or choices are required.
In Vulnerable consumers in regulated industries we pointed out that there could be conflict between protecting vulnerable consumers and benefiting consumers in general and regulators needed to work together more closely.3
Government has committed to prioritise mass transit but there remain inconsistencies:
Department committed to fund only new roads with bus prioritisation. But recent consultation on allowing electric cars to drive in bus lanes could undermine this.4
Transport Focus and others have pointed to higher priority given to the needs of car drivers compared with bus passengers in decision-making about roads.5

Improving local bus services in England outside London Part Four 53
Figure 17 continuedSuccess factors to support the Department’s bus strategy
Why important Where observed previously in government
What we observe so far
Long-term funding certainty
To give authorities and operators confidence to embark on long-term investment in improvement, knowing that revenue streams will be maintained.
In NHS financial management and sustainability we found in the absence of a multi-year settlement, trusts continued to struggle to make the capital investments needed to maintain the estate and support transformation, storing up problems for the future.6
Department has committed to provide stable long-term funding for buses in the next Spending Review.
Funding will need to be integrated with the local government Fair Funding Review which has been heavily delayed.
The Prime Minister announced £5 billion new funding for bus, cycling and walking schemes in February 2020. The Department told us the Comprehensive Spending Review and national bus strategy will provide transparency on the amount allocated to bus, the revenue-capital split, and timings of funding over the five years.
A detailed, transparent delivery plan
To demonstrate how actions will lead to outcomes and guide activity, prioritisation and decisions.
To ensure all parties know who needs to do what to achieve goals, and how success depends on collective actions.
Transparency creates confidence in and between organisations, and facilitates external scrutiny and accountability.
In our 2005 Delivery Chain Analysis for Bus Services in England, we found that the Department’s delivery plan contained much material that would have been useful to share with stakeholders but it did not publish it.7
In Developing new care models through NHS vanguards we identified a lack of an overall plan can make it harder for organisations involved to strike a balance between a long-term vision and tackling immediate priorities.8
Department’s published strategy expected in late 2020. Not yet clear whether this will be a high-level set of spending commitments, whether it will baseline and target expected outcomes, and whether it will be accompanied by a delivery plan with national objectives and milestones.
Department made some early spending commitments to certain projects and places, described as pilots, and some remedial support spending. The Department’s short term focus has been on COVID-19 response but the projects have continued, with the exception of Superbus (where only Cornwall has progressed). In the absence of a complete strategy and delivery plan, it is not yet possible to see how these fit with the whole.
Clear responsibilities and accountabilities
To clarify which parties are expected to deliver which actions, that they have the funding and powers to do so, and how their performance will be judged.
In Accountability to Parliament for taxpayers’ money, we highlighted that devolution of powers and funding to the local level has often not been accompanied by clarity over who is accountable for what, and how value for money is to be secured.9
In Health and social care integration we found that poor governance and oversight across the range of integration initiatives was leading to uncoordinated effort across central bodies.10
Department sets out how it gains assurance that individual projects and grants represent good value for money. But it is unclear about how it discharges responsibility for overseeing the bus delivery system, and overall value for money.11
Local Authority-operator partnerships or franchising agreements have potential to bring clarity and increase local accountability but have yet to be adopted.

54 Part Four Improving local bus services in England outside London
Why important Where observed previously in government
What we observe so far
Good quality data and measures of success
To set a baseline of current performance/outcomes and short, medium and longer-term targets to improve.
To understand and track the key indicators that will show whether progress is on track, when it is too early to see top-line results.
To enable all parties to see that each is delivering on its commitments.
To adjust promptly to stay on track.
In Cross-government funding of research and development, we found the absence of consolidated data made it difficult for funders to evaluate collective impact.12
In Digital transformation in the NHS we found consistent monitoring allows better oversight and earlier identification of problems and reduces the risk of adding to the scope of the strategy without due consideration.13
Department collects a range of data from local authorities and an annual survey of operators. Its statisticians collate and publish the data “used in monitoring trends, developing policy and providing accountability for the subsidy provided to the industry at a high level”.14
The data has limitations as the Department has no contractual relationships with operators (Approximately 80% of operators respond to the survey). Some data is estimated or based on partial paper returns.
In its Single Departmental Plan and Annual Report the Department publishes punctuality data, which are a useful proxy measure for the attractiveness of bus travel, but data are limited and do not measure the performance of the Department itself in any meaningful way.
The Senior Traffic Commissioner has committed to review and modernise the approach to bus performance measurement to meet modern passenger expectations.15
The Department does not measure the outcomes of bus provision. A requirement for local authorities to report public transport travel times to key local destinations was dropped in 2011.
Community transport, school and hospital transport services interact with local bus services and fill unmet need. The Department told us that data on these services, beyond those claiming BSOG, is not readily available and would be burdensome on organisations to collect.
Department lacks fully accurate, granular data on the costs in the commercial system.”
Figure 17 continuedSuccess factors to support the Department’s bus strategy

Improving local bus services in England outside London Part Four 55
Figure 17 continuedSuccess factors to support the Department’s bus strategy
Why important Where observed previously in government
What we observe so far
Sustained support from the centre of government
To provide drive and momentum, unlock conflicts, and reinforce consistent decision-making between departments.
In Improving government’s planning and spending framework our survey showed that senior officials wanted the centre of government to help them ensure that performance measures are aligned and do not encourage ‘problem shifting’.16
In Tackling serious and organised crime the Home Office found it difficult to mobilise action from some [other] government bodies.17
Clear support from the Prime Minister for improving buses.
HM Treasury made local transport a priority in the Budget 2020.
Effective understanding and management of risks at all levels
To ensure that risks are understood and tracked at the level where they can be effectively managed.
To ensure that wider threats to delivery of the goals are surfaced and dealt with before they damage progress.
In our Principles paper: managing provider failure, we noted that government’s appetite for failure may change as policy priorities or a delivery area evolves.18
In Managing PFI assets and services as contracts end we found the public sector’s preparedness and understanding of PFI risks varied across the delivery landscape.19
The multiplicity of operators and the lack of formal relationship between them and the Department hampers its understanding of risk.
At local level, weaknesses in transport planning capability add to this lack of oversight.
The Department acted quickly to keep buses running during the pandemic and will have increased its understanding of the risks of operator or service failure and of its own appetite for failure.
The financial impact of the pandemic will also change the appetite for risk of local authorities and operators and their attitudes to partnerships or franchising.
Lasting behaviour change related to the pandemic may threaten bus patronage and the bus funding model. For example: home-working becoming more commonplace leading to reduced commuting; increased reliance on online shopping and entertainment services; reduction in statutory concessions travel if older people do not fully regain confidence in bus services.

56 Part Four Improving local bus services in England outside London
Notes1 Comptroller and Auditor General, Department for Environment, Food & Rural Affairs, Water supply and demand management,
Session 2019–2021, HC 107, National Audit Offi ce, June 2020.2 Department for Transport, Future of mobility: urban strategy, March 2019.3 Comptroller and Auditor General, Ofwat, Ofgem, Ofcom and the Financial Conduct Authority, Vulnerable consumers in regulated industries,
Session 2016-17, HC 1061, National Audit Offi ce, March 2017. 4 Department for Transport, Z3RO EM15510N future: government to introduce green number plates, News story, October 2019.5 Transport Focus, Buses on Highways, England’s roads: meeting the needs of passengers and bus companies, December 2019.6 Comptroller and Auditor General, Department of Health & Social Care, NHS fi nancial management and sustainability, Session 2019-20, HC 44,
National Audit Offi ce, February 2020.7 Comptroller and Auditor General, Delivery Chain Analysis for Bus Services in England, Session 2005-06, HC 677, National Audit Offi ce and
Audit Commission, December 2005.8 Comptroller and Auditor General, Developing new care models through NHS vanguards, Session 2017–2019, HC 1129, National Audit Offi ce,
June 2018. 9 Comptroller and Auditor General, Cross-government, Accountability to Parliament for taxpayers’ money, Session 2015-16, HC 849,
National Audit Offi ce, February 2016.10 Comptroller and Auditor General, Department of Health, Department for Communities & Local Government and NHS England, Health and social
care integration, Session 2016-17, HC 1011, National Audit Offi ce, February 2017. 11 Department for Transport, Accountability system statement, Guidance, October 2017. 12 Comptroller and Auditor General, Department for Business, Energy & Industrial Strategy, Cross-government funding of research and development,
Session 2017–2019, HC 564, National Audit Offi ce, November 2017.13 Comptroller and Auditor General, Department of Health & Social Care, NHS England & NHS Improvement, NHS Digital, Digital transformation in
the NHS, Session 2019–2021, HC 317, National Audit Offi ce, May 2020.14 The Department for Transport, Annual bus statistics: 2010/11 – notes and defi nitions, Transparency data, September 2013.15 Traffi c Commissioners for Great Britain, Annual report to the Secretary of State 2018-19, October 2019.16 Comptroller and Auditor General, HM Treasury and Cabinet Offi ce, Improving government’s planning and spending framework,
Session 2017–2019, HC 1679, National Audit Offi ce, November 2018.17 Comptroller and Auditor General, Home Offi ce, National Crime Agency, Tackling serious and organised crime, Session 2017–2019, HC 2219,
National Audit Offi ce, June 2019.18 Comptroller and Auditor General, Principles paper: managing provider failure, Session 2015-16, HC 89, National Audit Offi ce, July 2015.19 Comptroller and Auditor General, Managing PFI assets and services as contracts end, Session 2019–2021, HC 369, National Audit Offi ce,
June 2020.
Source: National Audit Offi ce
Figure 17 continuedSuccess factors to support the Department’s bus strategy
Improving local bus services in England outside London Appendix One 57
Appendix One
Our audit approach
1 This study examined value for money in the local bus service system overseen by the Department for Transport (the Department). We examined the effectiveness of government’s current support for local bus services and the extent to which the enablers to improve local bus services are in place. Specifically, we examined:
• what the data show on bus use, provision and performance over time and across local authorities in England; and roles, responsibilities and accountabilities for delivering and improving bus services (Part One);
• the effectiveness of the revenue funding framework for buses (Part Two);
• the effectiveness of government’s current approach to improving bus services (Part Three); and
• the issues government needs to address to achieve its aims for the future of buses in England (Part Four).
2 We did not examine the merits of government’s policy objectives in this area, only the extent to which the system supports these objectives. We also did not include voluntary and community transport providers nor audit local government delivery of bus services, although we have considered the extent to which they are supported to deliver these services in their local contexts. Our examination excludes bus services in London, where the delivery model is different from the rest of England, although we draw on comparisons with London where useful.
3 Our audit approach is summarised in Figure 18 overleaf. Our evidence base is described in Appendix Two.

58 Appendix One Improving local bus services in England outside London
Figure 18Our audit approach
Our evaluative criteria Why bus services are important
and how they are provided.What government needs to address to achieve its aims for buses in England.
The effectiveness of the Department’s support to bus services.
Our evidence(see Appendix Two for details)
We reviewed why bus services are important and how they are provided. We:
• Analysed data, on bus use, passenger experience and trends over time.
• Interviewed staff from the Department, MHCLG and HM Treasury.
• Reviewed published and internal departmental documentation.
We assessed what government needs to do to improve bus services in a sustainable way. We:
• Reviewed published documentation to understand the challenge and the Department’s plans.
• Interviewed stakeholders for their views.
• Visited local authorities to understand delivery of services in local contexts.
• Drew on our previous work across government.
We assessed the effectiveness of the Department’s support for bus services. We:
• Analysed data on bus journeys and funding.
• Interviewed staff from the Department, MHCLG and HM Treasury
• Drew on previous work on the local authority funding landscape.
• Interviewed stakeholders for their views.
• Reviewed government commitments, objectives and future plans for buses.
The objective of government Since deregulation in 1986, government has relied on private sector operators to provide most bus services
on a commercial basis. But public money has always supported the system. The Department for Transport is responsible for supporting bus services through funding and legislation and has consistently stated an aim to increase bus use and halt the decline that has continued since the 1950s.
How this will be achieved In September 2019 the Department announced that it would develop the first national strategy for bus
services across England and a long-term funding commitment. In February 2020, it announced a £5 billion new funding package for buses, cycling and walking over this Parliament.
Our studyThe study examines the effectiveness of government’s support for buses, and the extent to which the enablers are in place for local authorities and operators to realise the long-term, sustained improvement that the Department now intends.
Our conclusionsBus services have been declining across England for 70 years and the decline continued following deregulation, with only a few local authorities managing to buck the trend. However, government recognises that affordable bus services have public value, and funds around 24% of bus operators’ revenue income. Government has chosen to deliver public bus services via a deregulated market model, and sensibly devolves decisions about supporting services to local authorities, who understand local needs.
The Department is not accountable for delivering bus services, but it has national policy responsibility. It is now preparing to commit significant new funding to bus services and to lead a national strategy for improvement against a background of considerable uncertainty. The Department collects data on buses and can show it has funded valuable improvements, but to date it has not sought to demonstrate how its actions have contributed to supporting optimal value for money across the bus system. If it is to work with and through others at central and local level, make informed choices about funding, and be able to adjust its plans to ensure it meets its objectives, it will need greater clarity on what it wants to achieve and how it will know when it has done so. During the COVID-19 pandemic, the Department has come together with local authorities and operators, intervening rapidly to target the weakest areas and keep buses running, which offers learning for the future.

Improving local bus services in England outside London Appendix Two 59
Appendix Two
Our evidence base
1 We reached our independent conclusions of the value for money in the bus service system in England outside London following analysis of evidence collected between May 2019 and June 2020.
2 We reviewed who uses bus services, how bus use has changed over time, the Department’s objectives and performance measures for bus services, how bus services in England outside London are delivered, the roles and responsibilities of delivery bodies, and government’s aims for bus services (Part One).
• We analysed data published by the Department, obtained from the National Travel Survey (Figure 19 on pages 62 and 63) (including mode of travel for short distances, frequency of use of different modes of travel, gender, age and income quintile of bus users) to understand who uses bus services.
• We interviewed a range of senior staff from the Department for Transport (the Department) involved in oversight of bus service delivery. We also met with staff in HM Treasury and the Ministry of Housing, Communities & Local Government (MHCLG).
• We reviewed internal and published documentation from the Department to understand the roles and responsibilities in the complex and devolved delivery landscape, the performance indicators used to monitor delivery of local bus services and the Department’s plans to decarbonise transport and related infrastructure.
• We analysed data published by the Department, obtained from the Bus Fares Panel Survey (Figure 19) (including the local bus fares index) to understand passenger experience of fares over time.

60 Appendix Two Improving local bus services in England outside London
3 We examined the funding mechanisms and revenue streams for operators who deliver local bus services in England outside London and significant recent interventions aimed at improving bus services in England outside London (Parts Two and Three).
• We reviewed published material from stakeholders to understand trends in bus use over time, including the Transport Select Committee, the Committee of Public Accounts, the Campaign for Better Transport, the Urban Transport Group, the RAC, Greener Journeys, the Senior Traffic Commissioner, and Transport Focus.
• We analysed data published by the Department, obtained from the Public Service Vehicle Survey (Figure 19) (including the average number of passenger journeys, the average number of passenger journeys per head of the population and the average number of concessionary journeys) to understand change in bus use over time.
• We analysed data published by the Department on concessionary passenger journeys, bus subsidies for operators and the vehicle miles, and passenger miles travelled by local bus services. These data are obtained by the Department from the Public Service Vehicle Survey.
• We reviewed published material from stakeholders to understand the benefits associated with concessionary travel. This included Greener Journeys and the Transport Select Committee.
• We analysed data published by the Department on gross revenue and net government support for local bus services (Figure 19) to understand the nature of the various revenue funding streams available to operators. These data are obtained by the Department from: MHCLG Revenue Outturn forms, Bus Service Operators Grant returns, Local Authority returns and adjusted using the HM Treasury GDP Deflator.
• We analysed data and documentation relating to capital funding to support bus services. We also met with staff from the Department to discuss capital funding processes. We also reviewed the Department’s evaluations of benefit cost ratios for capital funding for major bus related schemes.
• We interviewed staff in the Department’s finance team to understand changes to revenue funding. We also met with staff in MHCLG and HM Treasury finance teams responsible for overseeing revenue funding allocations and processes for local bus services.
• We drew on previous National Audit Office work on the local authority funding landscape.
• We reviewed government objectives, commitments, legislation and guidance relating to bus services since deregulation in 1986, including the Bus Services Act 2017.
Improving local bus services in England outside London Appendix Two 61
• We interviewed staff in the Department’s policy teams to understand changes made to support the Department’s objectives.
• We reviewed published documentation from the Department on its future plans to improve local bus services and achieve integration in a deregulated bus market. We also assessed the performance measures in place to understand how the Department tracks whether funding and interventions are successful.
4 We examined the challenges facing the Department in delivering a successful bus strategy and lessons that can be learned from previous experience in government (Part Four).
• We reviewed financial information to understand the urgent support provided to bus operators in response to the COVID-19 pandemic.
• We reviewed published documentation from a range of sources to understand the challenges faced and opportunities for better delivery of local bus services. This included the Cabinet Office, HM Treasury, the Urban Transport Group and Campaign for Better Transport.
• We visited four local authorities (Lincolnshire County Council, Nottingham City Council, Oxfordshire County Council, West Midlands Combined Authority) and the Northern Ireland Department for Infrastructure. These were selected on a judgement basis to understand bus service delivery and the challenges faced in their respective local contexts and to gather information on best practice, but not intended to form a representative sample (see Appendix Three).
• We consulted with major stakeholders within the bus sector to ascertain their views on the processes, responsibilities, oversight and delivery of local bus services. This included the Association of Transport Co-ordinating Officers; Association of Directors or Environment, Economy, Planning & Transport; Local Government Association, Campaign for Better Transport, Confederation of Passenger Transport, and the Urban Transport Group to ensure we collected a wide range of opinions from those involved.
• We drew on previous National Audit Office work to identify the factors that are important to delivering a successful strategic approach in a complex, devolved system and to understand how bus services influence and support policy objectives across government.
• We reviewed internal and published documentation from the Department on its plans for delivering bus services in response to the COVID-19 pandemic.
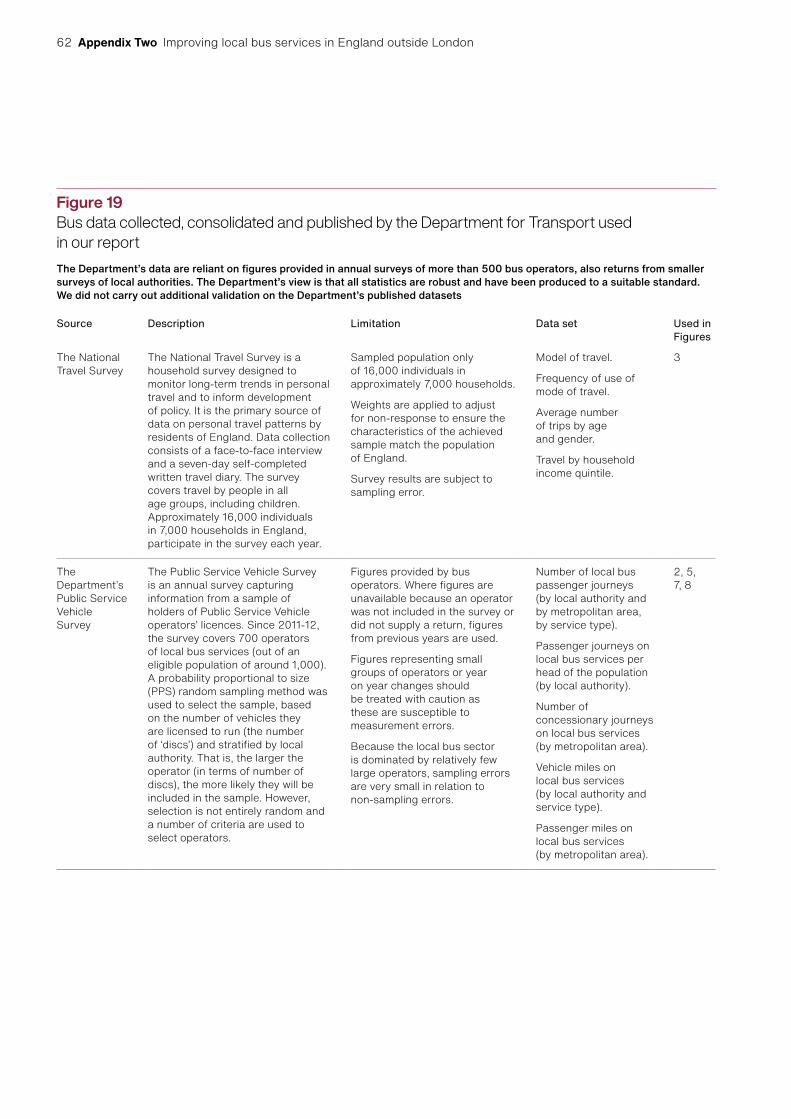
62 Appendix Two Improving local bus services in England outside London
Figure 19Bus data collected, consolidated and published by the Department for Transport used in our reportThe Department’s data are reliant on figures provided in annual surveys of more than 500 bus operators, also returns from smaller surveys of local authorities. The Department’s view is that all statistics are robust and have been produced to a suitable standard. We did not carry out additional validation on the Department’s published datasets
Source Description Limitation Data set Used in Figures
The National Travel Survey
The National Travel Survey is a household survey designed to monitor long-term trends in personal travel and to inform development of policy. It is the primary source of data on personal travel patterns by residents of England. Data collection consists of a face-to-face interview and a seven-day self-completed written travel diary. The survey covers travel by people in all age groups, including children. Approximately 16,000 individuals in 7,000 households in England, participate in the survey each year.
Sampled population only of 16,000 individuals in approximately 7,000 households.
Weights are applied to adjust for non-response to ensure the characteristics of the achieved sample match the population of England.
Survey results are subject to sampling error.
Model of travel.
Frequency of use of mode of travel.
Average number of trips by age and gender.
Travel by household income quintile.
3
The Department’s Public Service Vehicle Survey
The Public Service Vehicle Survey is an annual survey capturing information from a sample of holders of Public Service Vehicle operators’ licences. Since 2011-12, the survey covers 700 operators of local bus services (out of an eligible population of around 1,000). A probability proportional to size (PPS) random sampling method was used to select the sample, based on the number of vehicles they are licensed to run (the number of ‘discs’) and stratified by local authority. That is, the larger the operator (in terms of number of discs), the more likely they will be included in the sample. However, selection is not entirely random and a number of criteria are used to select operators.
Figures provided by bus operators. Where figures are unavailable because an operator was not included in the survey or did not supply a return, figures from previous years are used.
Figures representing small groups of operators or year on year changes should be treated with caution as these are susceptible to measurement errors.
Because the local bus sector is dominated by relatively few large operators, sampling errors are very small in relation to non-sampling errors.
Number of local bus passenger journeys (by local authority and by metropolitan area, by service type).
Passenger journeys on local bus services per head of the population (by local authority).
Number of concessionary journeys on local bus services (by metropolitan area).
Vehicle miles on local bus services (by local authority and service type).
Passenger miles on local bus services (by metropolitan area).
2, 5, 7, 8

Improving local bus services in England outside London Appendix Two 63
Figure 19 continuedBus data collected, consolidated and published by the Department for Transport used in our reportSource Description Limitation Data set Used in
Figures
The Department’s Bus Fares Panel Survey
The Bus Fares Panel Survey is an annual survey sent to around 100 operators to gain information on gross yield from passenger receipts.
Figures are based on a sample survey of around 100 operators. In total the operators selected cover around 85% of passenger receipts in Great Britain.
The index has been complied on a consistent basis and should measure trends consistently, however, no data on actual fares is collected. Index assumes no change in passenger behaviour and may not reflect changes in the average fare actually paid.
Local bus fares index (by metropolitan area).
10
Other departmental data
This includes data required to make estimations of the net government support paid to local bus services. Data comes from the Department’s BSOG returns, Transport for London, London Councils, MHCLS Revenue Outturn forms and HM Treasury’s GDP Deflator.
Figures include administration costs meaning a small proportion of the figures shown will not reach bus operators.
At local authority level, this level of disaggregation can show considerable fluctuation from one year to the next, which may present changes in recording practices so trends should be interpreted with caution.
Net government support paid to operators to support local bus services.
9, 11, 12
Source: National Audit Offi ce

64 Appendix Three Improving local bus services in England outside London
Appendix Three
Case study visits
1 During our 2019 fieldwork, we visited local authorities to understand local bus service delivery in different places, and to discuss the challenges and approaches to improvement.
2 In England we visited:
• three local authorities (Lincolnshire County Council, Nottingham City Council and Oxfordshire County Council); and
• one combined authority (West Midlands).
3 We also visited Belfast, Northern Ireland for a national comparison.
4 The key findings from these five visits are summarised in this appendix.

Improving local bus services in England outside London Appendix Three 65
Case study 1Innovative use of funding in the City of NottinghamA workplace parking levy provides extra funding for local bus and other public transport
Key facts
150 Average bus journeys per person per year, compared to 43 nationally outside of London (2018-19)
11 Bus operators in the City
25km of bus lane in the city in 2019, up from 400 metres in 2001
Primary operator: Nottingham City Transport, a former municipal bus company privatised during deregulation. Nottingham City Council is the principal shareholder.
Nottingham’s bus passenger journeys have remained stable and increased from 48 million to 50 million journeys between 2017-18 and 2018-19.
Car ownership is relatively low. Only 56% of households have access to a car, partly due to the large student population. As a result, a strong focus is placed on local transport, including investment in sustainable travel and innovative ways to fund investment.
Notable practices
• Workplace parking levy: Introduced in 2012 for workplaces with over 10 parking spaces. For each space offered to employees, the levy costs the employer roughly the same as an annual bus ticket. Proceeds reinvested in public transport, including the Link Bus network and tram services which provides routes across Nottingham that would otherwise not be available. This policy remains unique to Nottingham, but is under consideration by other authorities.
• Investment in sustainable buses: Nottingham City Transport received funding through the Low Emission and Ultra Low Emission funds (£4.4 million and £1.1 million respectively). The City invested in biogas buses, and built a biogas refuelling plant enabling rollout across its whole fleet. Biogas has reduced emissions, while maintaining similar coverage and mileage in services. Contributes to Nottingham’s 2028 carbon neutral target.
Source: National Audit Offi ce

66 Appendix Three Improving local bus services in England outside London
Case study 2 Solutions to a lack of rural commercial provision in LincolnshireLincolnshire County Council has innovated to provide local bus services in a challenging environment
Key facts
17 Average bus journeys per person per year (2018-19)
32 Bus operators in the City
30% of the population is 60 or older, compared to 24% nationally
Primary operator: Stagecoach, one of the big five bus operators in England.
Lincolnshire faces a number of challenges in delivering sustainable, affordable and reliable bus services for residents.
• The county contains the city of Lincoln, extensive rural areas with sparse populations and the seasonally popular coastline, providing a variety of environments for services to operate in.
• The lack of commercially viable routes led to a failing bus market for operators.
• Bus passenger journeys declined from 17 million to 13 million (24%) between 2010-11 and 2018-19.
• The county lacks funding to deliver supporting infrastructure, such as street lighting and kerb sides, which are important to increase safety for people using buses.
Notable practices
• Demand responsive travel (DRT): Established in 2001, the CallConnect service now has 36 vehicles and 32,000 passengers a year. The service involves passengers requesting a pick-up and drop-off by minibus over the phone or online and enables local transport provision in rural areas where bus services are not commercially viable. It connects passengers to interurban bus networks and train stations and reports a 98% satisfaction rate compared to 45% on fixed route services.
• Arm’s-length local authority operator: Lincolnshire operates Transport Connect Limited as the only local authority controlled arm’s-length operator in England to provide statutory services to schools, special educational needs and adult social care locations. It was established as a way to reduce delivery costs for these services, following the loss of a significant operator which led to a lack of bids and increased prices. This enables the local authority to fulfil its statutory duties, and fill gaps in its rural bus network.
Source: National Audit Offi ce

Improving local bus services in England outside London Appendix Three 67
Case study 3Encouraging bus travel in Oxfordshire Oxfordshire County Council has focused on prioritising bus over car and improving passenger information, while removing supported services
Key facts
61 Average bus journeys per person per year (2018-19)
29 Bus operators in the City (Two operators provide most services)
Primary operator: Oxford Bus Company. Prior to deregulation, the Oxford Bus Company was part of the government owned National Bus Company (NBC). Following deregulation, the NBC was split into smaller, privatised components, and the Oxford Bus Company was purchased as a subsidiary by the Go Ahead Group.
Between 2010-11 and 2018-19, bus passenger journeys increased from 36 million to 42 million.
A Quality Partnership led to service improvements in 2011. The local authority told us subsequent funding cuts prevented building on these, and the partnership lost impetus. In 2020, it set up a Strategic Bus Board with experienced members from across the council and is actively engaged with local operators to reinvigorate partnership working.
Congestion is a significant issue in Oxfordshire. There is a strong focus on cycling and cycling infrastructure across the city and county, with a dedicated cycling champion to promote it.
Notable practices and challenges
• Prioritising bus services: To reduce the effects of congestion on the bus, traffic management approaches have been used, including bus-only gates. Congestion charges and workplace parking levies are being considered.
• Use of data: The local authority and operators share automatic vehicle location data through a Punctuality Improvement Partnership (PIP). This partnership develops strategies to address bus delays. The real-time information is shared publicly through street displays (at bus stops etc), and the ‘Oxon time’ website.
• Park-and-Ride: Oxford opened the first park-and-ride service in 1973 and has five sites. However, city expansion means these sites are now too close to the city, adding to congestion as people travel to reach them. The council is now looking to improve its park-and-ride through a more flexible approach.
• Supported services: In 2016, the local authority stopped funding supported services as part of wider funding reprioritisation. In some cases, community providers have stepped in to operate routes that lost funding. They rely on volunteers to maintain the service.
Source: National Audit Offi ce
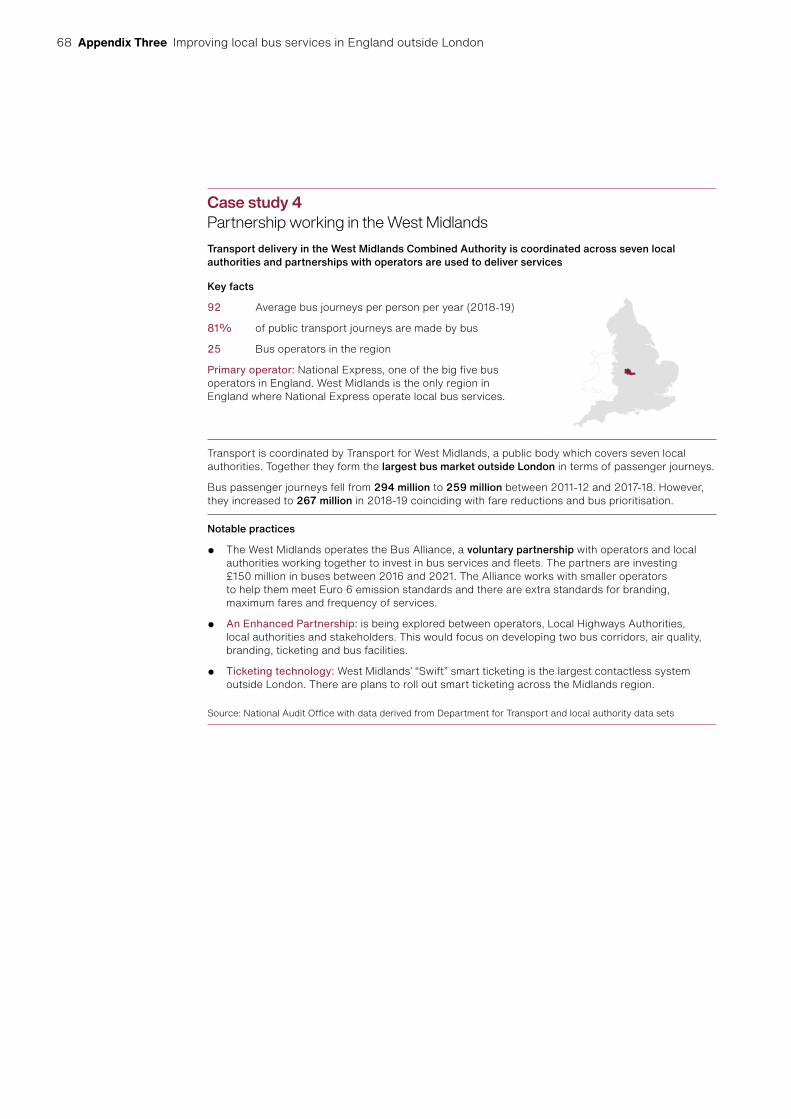
68 Appendix Three Improving local bus services in England outside London
Case study 4Partnership working in the West MidlandsTransport delivery in the West Midlands Combined Authority is coordinated across seven local authorities and partnerships with operators are used to deliver services
Key facts
92 Average bus journeys per person per year (2018-19)
81% of public transport journeys are made by bus
25 Bus operators in the region
Primary operator: National Express, one of the big five bus operators in England. West Midlands is the only region in England where National Express operate local bus services.
Transport is coordinated by Transport for West Midlands, a public body which covers seven local authorities. Together they form the largest bus market outside London in terms of passenger journeys.
Bus passenger journeys fell from 294 million to 259 million between 2011-12 and 2017-18. However, they increased to 267 million in 2018-19 coinciding with fare reductions and bus prioritisation.
Notable practices
• The West Midlands operates the Bus Alliance, a voluntary partnership with operators and local authorities working together to invest in bus services and fleets. The partners are investing £150 million in buses between 2016 and 2021. The Alliance works with smaller operators to help them meet Euro 6 emission standards and there are extra standards for branding, maximum fares and frequency of services.
• An Enhanced Partnership: is being explored between operators, Local Highways Authorities, local authorities and stakeholders. This would focus on developing two bus corridors, air quality, branding, ticketing and bus facilities.
• Ticketing technology: West Midlands’ “Swift” smart ticketing is the largest contactless system outside London. There are plans to roll out smart ticketing across the Midlands region.
Source: National Audit Offi ce with data derived from Department for Transport and local authority data sets
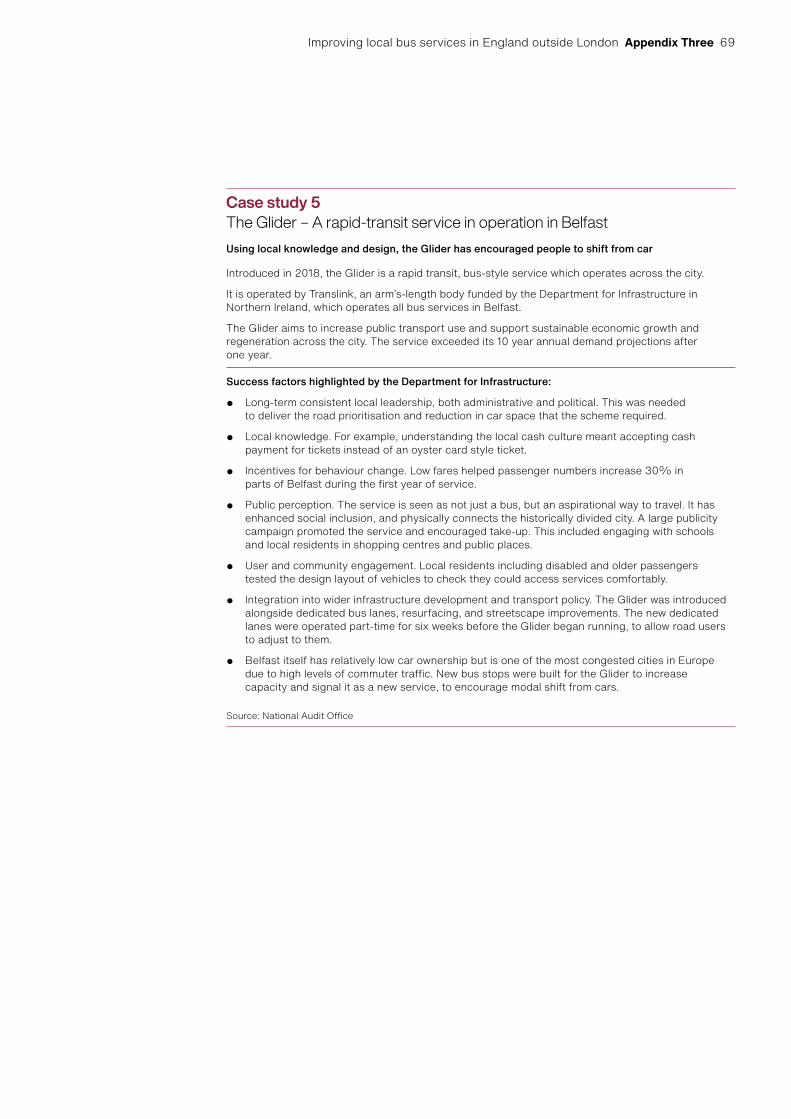
Improving local bus services in England outside London Appendix Three 69
Case study 5The Glider – A rapid-transit service in operation in BelfastUsing local knowledge and design, the Glider has encouraged people to shift from car
Introduced in 2018, the Glider is a rapid transit, bus-style service which operates across the city.
It is operated by Translink, an arm’s-length body funded by the Department for Infrastructure in Northern Ireland, which operates all bus services in Belfast.
The Glider aims to increase public transport use and support sustainable economic growth and regeneration across the city. The service exceeded its 10 year annual demand projections after one year.
Success factors highlighted by the Department for Infrastructure:
• Long-term consistent local leadership, both administrative and political. This was needed to deliver the road prioritisation and reduction in car space that the scheme required.
• Local knowledge. For example, understanding the local cash culture meant accepting cash payment for tickets instead of an oyster card style ticket.
• Incentives for behaviour change. Low fares helped passenger numbers increase 30% in parts of Belfast during the first year of service.
• Public perception. The service is seen as not just a bus, but an aspirational way to travel. It has enhanced social inclusion, and physically connects the historically divided city. A large publicity campaign promoted the service and encouraged take-up. This included engaging with schools and local residents in shopping centres and public places.
• User and community engagement. Local residents including disabled and older passengers tested the design layout of vehicles to check they could access services comfortably.
• Integration into wider infrastructure development and transport policy. The Glider was introduced alongside dedicated bus lanes, resurfacing, and streetscape improvements. The new dedicated lanes were operated part-time for six weeks before the Glider began running, to allow road users to adjust to them.
• Belfast itself has relatively low car ownership but is one of the most congested cities in Europe due to high levels of commuter traffic. New bus stops were built for the Glider to increase capacity and signal it as a new service, to encourage modal shift from cars.
Source: National Audit Offi ce
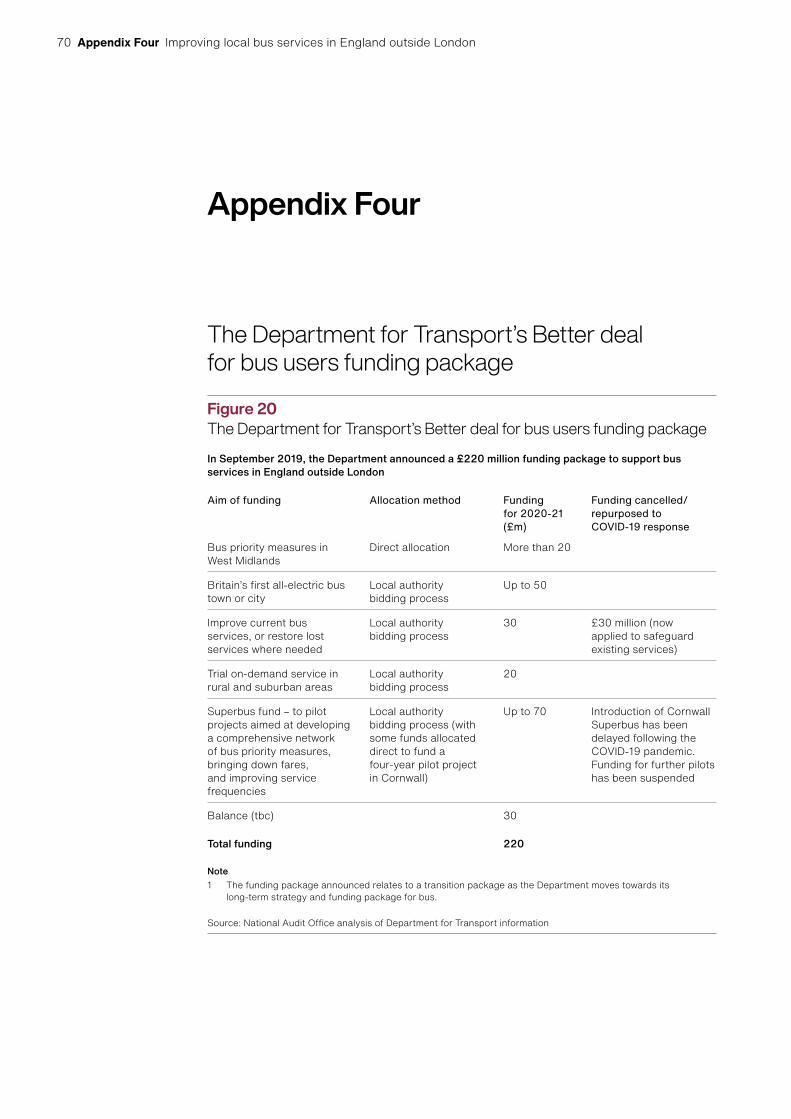
70 Appendix Four Improving local bus services in England outside London
Appendix Four
The Department for Transport’s Better deal for bus users funding package
Figure 20The Department for Transport’s Better deal for bus users funding package
In September 2019, the Department announced a £220 million funding package to support bus services in England outside London
Aim of funding Allocation method Funding for 2020-21 (£m)
Funding cancelled/repurposed to COVID-19 response
Bus priority measures in West Midlands
Direct allocation More than 20
Britain’s first all-electric bus town or city
Local authority bidding process
Up to 50
Improve current bus services, or restore lost services where needed
Local authority bidding process
30 £30 million (now applied to safeguard existing services)
Trial on-demand service in rural and suburban areas
Local authority bidding process
20
Superbus fund – to pilot projects aimed at developing a comprehensive network of bus priority measures, bringing down fares, and improving service frequencies
Local authority bidding process (with some funds allocated direct to fund a four-year pilot project in Cornwall)
Up to 70 Introduction of Cornwall Superbus has been delayed following the COVID-19 pandemic. Funding for further pilots has been suspended
Balance (tbc) 30
Total funding 220
Note1 The funding package announced relates to a transition package as the Department moves towards its
long-term strategy and funding package for bus.
Source: National Audit Offi ce analysis of Department for Transport information

This report has been printed on Pro Digital Silk and contains material sourced from responsibly managed and sustainable forests certified in accordance with the FSC (Forest Stewardship Council).
The wood pulp is totally recyclable and acid-free. Our printers also have full ISO 14001 environmental accreditation, which ensures that they have effective procedures in place to manage waste and practices that may affect the environment.

£10.00
9 781786 043368
ISBN 978-1-78604-336-8
Design and Production by NAO External Relations DP Ref: 006467-001
You have reached the end of this document