annual bus statistics: england 2016/17 · 14 bus punctuality: 16 passenger satisfaction: 17 bus...
TRANSCRIPT

Annual bus statistics:England 2016/17
About this release This statistical release presents the latest annual statistics on the local bus sector. Local bus services use public service vehicles (PSVs) to carry passengers paying separate fares over short distances. Most of the data are derived from the Department for Transport’s (DfT) annual survey of local bus operators. Figures are presented for England, in line with coverage of DfT bus policy. Statistics for Scotland and Wales are available online.
The number of local bus passenger journeys in England fell by 70 million or 1.5% to 4.44 billion in the year ending March 2017.
Passenger journeys in England outside London declined by 0.8% over the same period, continuing the decline since 2008/09, and is now 1.2% lower than in the year ending March 2005. In London, bus use decreased by 2.3% in the latest year but remains 12.4% higher than in the year ending March 2007.
Bus mileage in England decreased by 1.1% when compared with 2015/16, largely due to a 13.8% decrease in mileage on local authority supported services in England outside London.
Responsible statistician: David Mais: 020 7944 6857 Email: [email protected]
Further information: Media: 020 7944 3066 Public: 020 7944 3094
Statistical Release 14 December 2017
in England in 2016/17
4.44 billion journeys 1.5%
since 2015/16
Local bus passenger journeys
We want your feedback We welcome any feedback on any aspect of these statistics which can be provided by email to [email protected].
in England in 2016/17
1.24 billion vehicle miles
1.1%since 2015/16
Vehicle miles on local bus services
In this publicationSummary 2Things you need to know 2Passenger journeys 3Explanation of trends 7Bus mileage 9Vehicles and staff 11Bus partnership 13Financial outlook 14Bus punctuality 16Passenger satisfaction 17Bus passengers 19Bus and coach drivers 22Background information 24

Annual bus statistics: England 2016/17 - Page 2
Table 1 summarises the annual figures for bus passenger journeys and mileage for the 2016/17 financial year. Figures for England are broken down into England outside London (metropolitan areas and non-metropolitan areas) and London.
Table 1: Local bus passenger journeys and mileage by area type: England, 2015/16 to 2016/17 (tables BUS0103 and BUS0203)
The statistics presented here on the local bus sector in England provide information for monitoring trends in usage and provision for a mode of transport used for about 60% of public transport journeys.
Most figures in this release relate to local bus services. These are timetabled services using public service vehicles to carry passengers over relatively short distances, and usually eligible for Bus Services Operators Grant. Long distance coach services, private hire work and closed contracts are excluded but school services accessible to the general public are included.
The majority of bus services in England are provided by private companies since deregulation of the industry in 1986 in England outside London. Services can be operated on a purely commercial basis or with financial support from local authorities (supported services). London services are operated by private companies but regulated by Transport for London (TfL). There are two broad passenger types: concessionary and non-concessionary passengers.
Concessionary passengers are either older or disabled people (free to travel anywhere in England since April 2008) or young people in local authorities where such discretionary travel schemes exist. More detailed statistics on concessionary travel are published separately by DfT and available online.
Why the distinction between London and England outside London? Buses in London, through Transport for London, operate under a different regulatory framework to the rest of England. The size of the bus market in London and differing trends in bus use also makes it sensible to disaggregate these two area types. Different disaggregations are available online including local authority level and for
urban and rural areas.
Things you need to know
Summary
2016/17 figures in billion / billion miles and change compared with 2015/16
London 2.24 2.3% 0.30 0.4%English metropolitan areas 0.94 1.2% 0.31 3.9%English non-metropolitan areas 1.26 0.4% 0.62 0.4%
England outside London 2.20 0.8% 0.93 1.6%England 4.44 1.5% 1.24 1.1%
Passenger journeys Vehicle mileage
4

Annual bus statistics: England 2016/17 - Page 3
England
In 2016/17, 4.44 billion passenger journeys were made by local bus in England, down 70 million journeys or 1.5% when compared with 2015/16. Chart 1 shows the trend in local bus journeys in England between 1985/86 (year before deregulation of the bus market) and 2016/17. Bus use fell in the early 1990s before starting to increase but has remained relatively stable since 2007/08 at over 4.4 billion passenger journeys.
Passenger journeys in London accounted for around a half of the 4.44 billion passenger journeys made by local bus in England in 2016/17.
Chart 1: Local bus passenger journeys in England, 1985/86 to 2016/17 (table BUS0103)
What is a bus passenger journey? Each boarding of a bus is counted as one journey. The number of passenger journeys are an important measure of bus demand. These statistics relate to passengers on local bus services. The main source of information on non-local bus use (e.g. long distance coach services) is the National Travel Survey.
Quarterly bus statistics Local bus passenger journeys and local bus fares are updated every quarter. The latest quarterly statistics are available for April to June 2017.
Passenger journeys
Concessionary travel Total concessionary journeys (elderly or disabled, and youth concessions) made up 34% (1.51 billion passenger journeys) of all local bus passenger journeys in England. In England outside London, 30% of journeys were elderly or disabled concessionary journeys, twice the share as in London. DfT’s Concessionary Travel Survey collects more detailed information for Travel Concession Authorities on concessionary passholder numbers, total expenditure on concessionary travel and concessionary discretions offered.
0
1
2
3
4
5
1985/86 1992/93 2000/01 2008/09 2016/17
Passenger journeys on local bus services (billion)
4.44bnjourneysin 2016/17
1.5%since 2015/16
7.6%since 1985/86
2.20bnjourneys in England
outside London
2.24bnjourneys in London
of journeys occurred in London50%

Annual bus statistics: England 2016/17 - Page 4
England outside London
In 2016/17, 2.20 billion passenger journeys were made by local bus in England outside London, down 0.8% when compared with 2015/16. Bus use in England outside London has been on a downward trend since the recent peak of 2.41 billion passenger journeys in 2008/09 (see chart 2).
London
There were 2.24 billion passenger journeys made by local bus in London in 2016/17, a decrease of 2.3% compared with 2015/16. This is the third consecutive year in which passenger journeys in London have fallen (see chart 2). Transport for London attribute increased congestion and road works as likely factors that have affected bus performance including bus speeds. Before 2012/13, bus use in London increased every year since 1998/99. Bus use in London in 2016/17, however, was 12.4% higher than in 2006/07 and accounted for around a half of all local bus journeys in England.
Chart 2: Local bus passenger journeys in England outside London and London, 2006/07 to 2016/17 (table BUS0103)
1.7
1.8
1.9
2.0
2.1
2.2
2.3
2.4
2.5
2006/07 2008/09 2010/11 2012/13 2014/15 2016/17
London
England excluding London
Passenger journeys on local bus services (billion)
2.24bnjourneys in 2016/17
2.20bnjourneys in 2016/17
2.3%since 15/16
0.8%since 15/16

Annual bus statistics: England 2016/17 - Page 5
Metropolitan and non-metropolitan areas
Local bus passenger journeys decreased in both metropolitan and non-metropolitan areas in 2016/17. In metropolitan areas, there were 0.94 billion passenger journeys, a decrease of 1.2% compared with 2015/16. In non-metropolitan areas, there were 1.26 billion passenger journeys, a decrease of 0.4%.
In both metropolitan and non-metropolitan areas, the introduction of free concessionary travel in local authority areas from 1 April 2006 and nationally from 1 April 2008 led to annual increases in local bus passenger journeys (see chart 3). After 2008/09, bus use in England outside London has decreased at a faster rate in metropolitan areas. In 2016/17, passenger journeys in metropolitan areas were 12.7% lower than in 2008/09 and 5.5% lower in non-metropolitan areas.
Bus use in urban and rural areas
Table BUS0111 shows passenger journeys on local bus services by urban and rural classification. As you move from urban to rural areas the number of bus journeys declines. The National Travel Survey shows that household car ownership and the number of trips by car is highest in rural areas. As the proportion of the household car ownership increases, the level of bus use decreases. Metropolitan areas have amongst the highest levels of bus use and proportion of households
England outside London
Figures for England outside London can be disaggregated further into metropolitan and non-metropolitan areas. Metropolitan areas are the six former metropolitan counties: Greater Manchester, Merseyside, South Yorkshire, Tyne and Wear, West Midlands and West Yorkshire. Non-metropolitan areas cover the remaining county councils and unitary authorities in England outside London.
Chart 3: Local bus passenger journeys in England outside London by area type, 2006/07 to 2016/17 (table BUS0103)
0.7
0.8
0.9
1.0
1.1
1.2
1.3
1.4
2006/07 2008/09 2010/11 2012/13 2014/15 2016/17
Metropolitan areas
Non-metropolitan areas
Passenger journeys on local bus services (billion)
0.94bnjourneys in 2016/17
1.26bnjourneys in 2016/17
0.4%since 15/16
1.2%since 15/16

Annual bus statistics: England 2016/17 - Page 6
without a car. Other factors that could affect bus use in a local authority are population density, income and quality and cost of bus services.
Bus use by local authority
Chart 4: Local bus passenger journeys per head by local authority: England outside London, 2016/17 (table BUS0110a)
About the data The bus passenger journeys per head figures presented here are estimates based on returns provided by bus operators. Mid-year population estimates from Office for National Statistics are used but do not account for bus passengers using the bus outside the local authority in which they reside. Users should be aware that figures for small areas can be affected by recording differences and so individual figures should be interpreted carefully.
Brighton and HoveÝ 8.3% since 11/12
NottinghamÞ 8.5% since 11/12
ReadingÝ 27.8% since 11/12
Tyne and Wear ITAÞ 12.4% since 11/12
West Midlands ITAÞ 9.9% since 11/12
Top 5 local authorities
Bottom 5 local authorities
92
101
131
149
172Brighton and Hove
Nottingham
Reading
Tyne and Wear ITA
West Midlands ITA
Passenger journeys per head
1
11
12
13
13 Herefordshire
Somerset
Cheshire East
Windsor and Maidenhead
Rutland
Passenger journeys per head

Annual bus statistics: England 2016/17 - Page 7
This map of bus passenger journeys per head in 2016/17 in England outside London shows the difference in bus use across local authorities. In general, more urban local authorities have above average levels of bus use when compared with rural areas.
The average number of bus passenger journeys per head in England outside London was 47 in 2016/17, down from 52 in 2011/12. Out of 88 local authorities in England outside London, 71 had a decrease in bus use per head from 2011/12 to 2016/17.
In 2016/17, local bus accounted for 59% of all public transport journeys in Great Britain. This has fallen from 74% in 1991/92. This change has been driven by large increases in patronage on the National Rail network, London Underground and light rail and modern tram systems.
Chart 5: Percentage of public transport journeys by local bus and National Rail network: Great Britain: 1950 to 2016/17 (TSGB0102)
There are a number of factors that may explain the fall in bus patronage on local bus services seen in recent years. These include:
Congestion: It is likely that congestion in urban areas and city centres has affected bus performance leading to a fall in bus patronage. Transport for London attribute the fall in bus patronage seen in London in the last three consecutive years to increased congestion and road works which has affected bus performance by reducing average bus speeds. Transport Focus data shows that congestion and road works are among the top factors which passengers think
Factors affecting bus patronage
Related data sourcesA chapter on data relating to public transport was recently published as part of the Transport Statistics Great Britain 2017 publication.
Public transport
Includes journeys on National Rail, underground systems (London and Glasgow), local bus and light rail and tram systems.
0
10
20
30
40
50
60
70
80
90
100
1950
1955
1960
1965
1970
1975
1980
1985
/86
1990
/91
1995
/96
2000
/01
2005
/06
2010
/11
2016
/17
% of public transport journeys
59%of journeysin 2016/17
21%of journeysin 2016/17
Local bus
National Rail Network

Annual bus statistics: England 2016/17 - Page 8
impact on the length of bus passenger journeys (see passenger satisfaction section).
Car ownership: Household car ownership remains high and is likely to have contributed to falling bus patronage. Data from the National Travel Survey (NTS) shows that 77% of households in England owned at least one car or van in 2016. In 2016, 56% of households in England in the lowest real income quintile owned at least one car or van, up from 52% in 2015. This group makes the most trips per person per year by local bus of any of the real income quintiles (see the NTS data section for more information on bus use and income).
Online shopping: There has been a growth in online shopping in recent years. This may have led to a fall in people using the bus for shopping trips. Data from the NTS shows that there were 13 shopping trips per person per year on local bus in England in 2016, down from 19 per person per year in 2010.
Modal shift: Due to the impacts of congestion and road works on bus performance in urban areas and city centres people may be switching to using other modes of transport such as light rail. An example of this can be seen for Blackpool Tramway who saw an increase in passenger journeys from 4.9m in 2015/16 to 5.1m in 2016/17. This was attributed to people switching from using buses to the tram, as one of the main bridges into Blackpool for road traffic (Crossley’s Bridge) had been closed for the winter period in 2016/17. The increasing passenger journeys on London underground (up 8.9% between 2013/14 and 2016/17) may also be the result of passengers switching from using the bus to using the tube.
Reductions in local authority supported services: Vehicle mileage on local authority supported services in England outside London has decreased each year since peaking in 2009/10. This fall is likely to have been driven by a reduction in the number of local authority supported services in operation. Fewer of these supported services will have contributed to the decline in bus patronage on local services. Please see the section on bus mileage for more information.
Related data sourcesThe Department for Transport also publish statistics on road congestion and travel times.
A research paper undertaken by Professor David Begg looking at the impact of congestion on bus passengers can be found here.
The National Travel Survey Factsheet on shopping, published in March 2017, used NTS and other data to describe shopping trends.
ONS Retail sales statistics provide information on the growth in online shopping which may be associated with trends in shopping trips.
Internet Access statistics, published by the ONS, show that in 2016, 77% of adults in Great Britain had bought goods or services online in the past 12 months, this compares to 53% of adults in 2008. These statistics also highlighted differences between age groups when looking at the types of goods and services bought online.
The Department for Transport also publish statistics on passenger journeys on light rail and tram systems. The latest figures for 2016/17 can be found here.
Bus patronage in ScotlandA research report commissioned by CPT (Confederation of Passenger Transport) looking at drivers of the decline in bus patronage in Scotland was published in November 2017. The report can be found here.
Annual bus statistics: England 2016/17 - Page 9
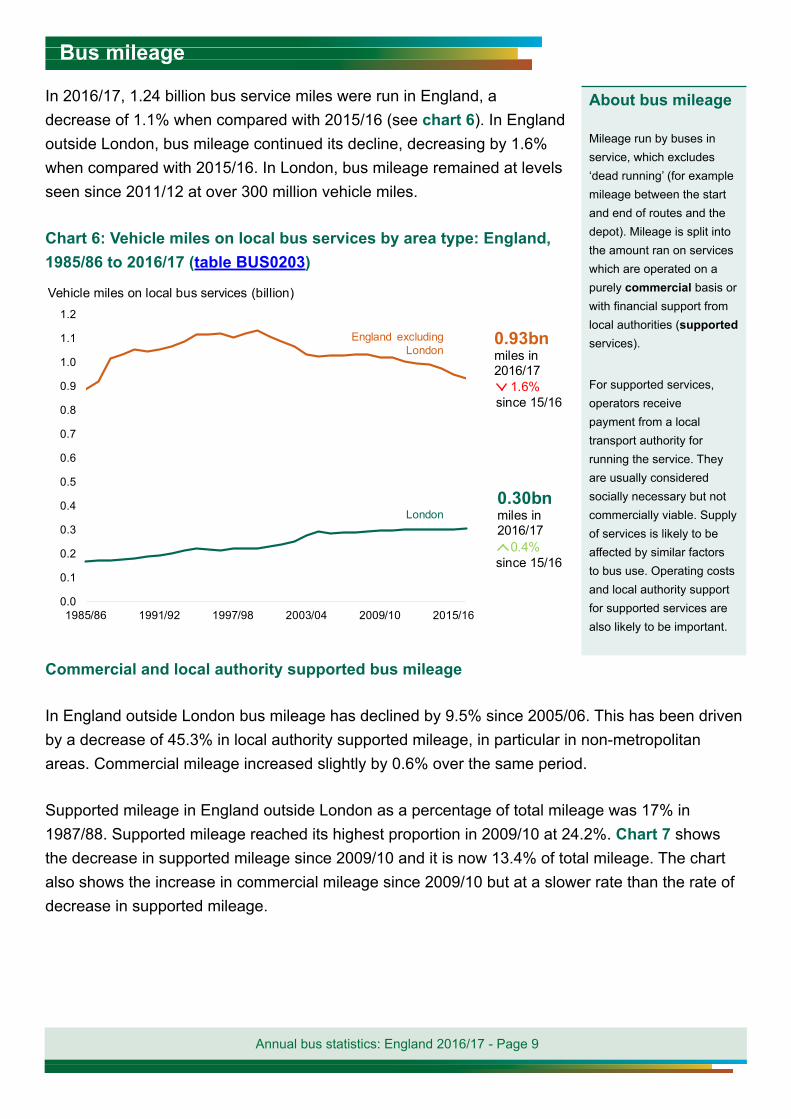
In 2016/17, 1.24 billion bus service miles were run in England, a decrease of 1.1% when compared with 2015/16 (see chart 6). In England outside London, bus mileage continued its decline, decreasing by 1.6% when compared with 2015/16. In London, bus mileage remained at levels seen since 2011/12 at over 300 million vehicle miles.
Chart 6: Vehicle miles on local bus services by area type: England, 1985/86 to 2016/17 (table BUS0203)
Commercial and local authority supported bus mileage
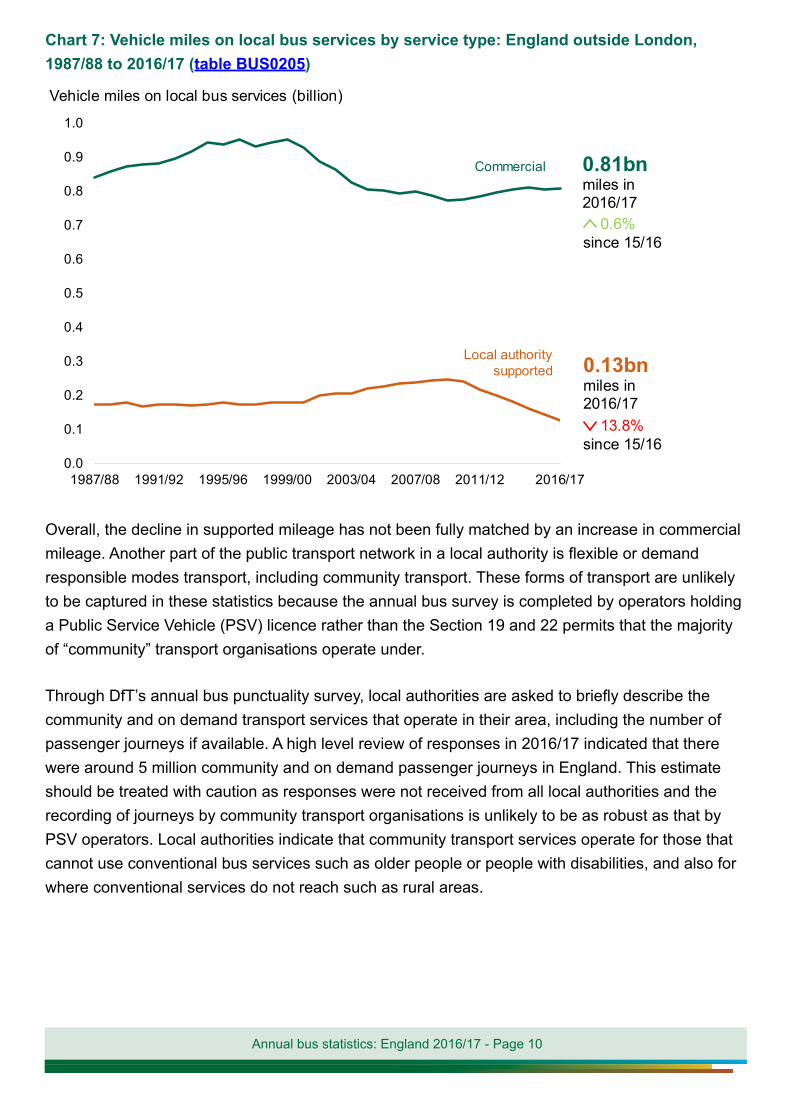
In England outside London bus mileage has declined by 9.5% since 2005/06. This has been driven by a decrease of 45.3% in local authority supported mileage, in particular in non-metropolitan areas. Commercial mileage increased slightly by 0.6% over the same period.
Supported mileage in England outside London as a percentage of total mileage was 17% in 1987/88. Supported mileage reached its highest proportion in 2009/10 at 24.2%. Chart 7 shows the decrease in supported mileage since 2009/10 and it is now 13.4% of total mileage. The chart also shows the increase in commercial mileage since 2009/10 but at a slower rate than the rate of decrease in supported mileage.
Bus mileage
About bus mileage
Mileage run by buses in service, which excludes ‘dead running’ (for example mileage between the start and end of routes and the depot). Mileage is split into the amount ran on services which are operated on a purely commercial basis or with financial support from local authorities (supported services).
For supported services, operators receive payment from a local transport authority for running the service. They are usually considered socially necessary but not commercially viable. Supply of services is likely to be affected by similar factors to bus use. Operating costs and local authority support for supported services are also likely to be important.
0.0
0.1
0.2
0.3
0.4
0.5
0.6
0.7
0.8
0.9
1.0
1.1
1.2
1985/86 1991/92 1997/98 2003/04 2009/10 2015/16
London
England excluding London
0.30bnmiles in 2016/17
0.93bnmiles in 2016/17
Vehicle miles on local bus services (billion)
1.6%since 15/16
0.4%since 15/16
Annual bus statistics: England 2016/17 - Page 10
Chart 7: Vehicle miles on local bus services by service type: England outside London, 1987/88 to 2016/17 (table BUS0205)
Overall, the decline in supported mileage has not been fully matched by an increase in commercial mileage. Another part of the public transport network in a local authority is flexible or demand responsible modes transport, including community transport. These forms of transport are unlikely to be captured in these statistics because the annual bus survey is completed by operators holding a Public Service Vehicle (PSV) licence rather than the Section 19 and 22 permits that the majority of “community” transport organisations operate under.
Through DfT’s annual bus punctuality survey, local authorities are asked to briefly describe the community and on demand transport services that operate in their area, including the number of passenger journeys if available. A high level review of responses in 2016/17 indicated that there were around 5 million community and on demand passenger journeys in England. This estimate should be treated with caution as responses were not received from all local authorities and the recording of journeys by community transport organisations is unlikely to be as robust as that by PSV operators. Local authorities indicate that community transport services operate for those that cannot use conventional bus services such as older people or people with disabilities, and also for where conventional services do not reach such as rural areas.
0.0
0.1
0.2
0.3
0.4
0.5
0.6
0.7
0.8
0.9
1.0
1987/88 1991/92 1995/96 1999/00 2003/04 2007/08 2011/12 2016/17
Commercial
Local authority supported 0.13bn
miles in 2016/17
0.81bnmiles in 2016/17
Vehicle miles on local bus services (billion)
0.6%since 15/16
13.8%since 15/16

Annual bus statistics: England 2016/17 - Page 11
The below graphic summarises the annual figures for the number of buses used by local operators in England in 2016/17.
Bus fleet
The number of buses used by local bus operators in England has remained at similar levels since 2004/05 at around 35,000 buses. Over a quarter of buses were in London (see chart 8). The average age of a bus in England in 2016/17 was 7.6 years.
Equipment on buses
In 2016/17, 91% of buses used by local operators in England were equipped with CCTV, up from 44% in 2005/06. The majority of buses were also fitted with an Automatic Vehicle Location (AVL) device (97% of buses in England, compared with 35% in 2006/07). New questions were added to the survey this year to capture how the AVL device is used. Of the buses in England with an AVL device in 2016/17, 96% were being used to monitor punctuality and 91% used the AVL device to provide real time service information to customers.
Other questions were added to the survey this year on buses with contactless payment and free WiFi. In 2016/17, 25% of buses in England
Vehicles and staff
34,900 buses used by local operators in England in 2016/17
Of which... 91% had CCTV
97% had an AVL device
43% were enabled for payment by contactless bank card
25% had free WiFi
29% were in London
Summary
Chart 8: Proportion of buses used by local bus operators by area type: England, March 2017 (table BUS0602)
London 29%
Mets 26%
Non-mets 45%
AVL and ITSO
Automatic Vehicle Location is used to track vehicle location in order to monitor punctuality and provide real time service information to customers.
ITSO is an organisation which sets a common technical standard for smart ticketing. Further information can be found at: www.itso.org.uk.
of buses in England outside London were ITSO smart enabled91%

Annual bus statistics: England 2016/17 - Page 12
had free WiFi and 43% were enabled for payment by contactless bank card (or mobile phones emulating these e.g. Android Pay or Apple Pay). In 2016/17, 91% of buses used by local bus operators in England outside London were ITSO smart enabled. This is up from 25% of buses which were ITSO enabled in 2010/11 (see chart 10).
Chart 9: Percentage of buses fitted with CCTV or AVL: England, 2016/17 compared with previous years
Chart 10: Percentage of ITSO smart enabled buses: England outside London, 2016/17 compared with previous years (table BUS0607)
Bus accessibility
In March 2017, 98% of buses in England had been issued with an accessibility certificate. Chart 11 shows that the proportion of buses in England with an accessibility certificate has increased each year since 2004/05 and is now at a record high level.
Accessibility regulations The Public Service Vehicle Accessibility Regulations 2000 (PSVAR) set out standards for public service vehicles to ensure they are accessible to disabled people by 1 January 2017 at the latest (depending on bus type). Buses that comply with the accessibility regulations are issued with an accessibility certificate. Some buses are suitable for wheelchair access through low floor designs.
35%
97%
2006/07 2011/12 2016/17
44%
91%
2005/06 2011/12 2016/17
CCTV (table BUS0604)
Automatic vehicle location (table BUS0606)
25%
91%
2010/11 2012/13 2016/17

Annual bus statistics: England 2016/17 - Page 13
Chart 11: Percentage of local buses with low floor access or an accessibility certificate: England, 2006/07 to 2016/17 (table BUS0603)
Bus staff
Local bus operators in England employed an estimated 103,000 full time equivalent staff as at March 2017 (see table BUS0701(area)). This is similar to the level seen since 2004/05. Information on bus and coach drivers from Office for National Statistics data is summarised in the section on bus and coach drivers.
New questions were added to the survey this year to capture information on bus partnership schemes. In 2016/17, 18% of local bus operators in England were part of at least one bus partnership scheme (operators can be involved in more than one). Of the operators involved in a partnership scheme, 62.5% were involved in one only with 37.5% involved in two or more schemes.
In 2016/17, 7% of local bus operators in England were involved in at least one statutory bus partnership scheme with 14% involved in at least one voluntary scheme (operators can be involved in more than one scheme e.g. one statutory and one voluntary).
Bus partnership schemes
About partnership schemes
Bus partnership schemes are agreements between local authorities and local bus operators to improve the quality of services and facilities within the scheme area. They will involve at least one bus company and at least one local authority. The local authority may undertake to provide bus priority measures, new bus stops and/or real time information systems. In return bus operators may provide new vehicles with improved levels of accessibility and environmental performance and/or enhanced driver training. They may also provide an enhanced level of service. A statutory scheme is one made under section 114 of the Transport Act 2000. A voluntary scheme is a non-statutory term used to describe any agreement entered into voluntarily by one or more local authorities and one or more bus operators, and possibly other relevant parties. Further information can be found in the bus11 online tables.
0%
20%
40%
60%
80%
100%
06/07 08/09 10/11 12/13 14/15 16/17
With accessibility certificate
Low flooraccess
No certificateor low flooraccess

Annual bus statistics: England 2016/17 - Page 14
Bus fares
In the past year to March 2017, local bus fares in England have increased by 1.6%, slower than the annual all items Retail Prices Index rate of inflation over the same period (3.1% increase). Between March 2012 and March 2017, the average annual percentage change in bus fares was 2.9%, higher than the average annual rate of inflation (2.3%).
Local bus fares in England increased by 66% on average between March 2005 and March 2017. Chart 12 shows that bus fares have risen at a faster rate in metropolitan areas (80%) than in non-metropolitan areas (53%). The all items Retail Prices Index has risen by 41% over the same period, which means that bus fares have risen in real terms.
Government support
Central and local government support for local bus services consists of payments for supported services, Bus Service Operators Grant (BSOG) and concessionary travel reimbursement (effectively a subsidy to concessionary passengers). In 2016/17, estimated total net support paid in England was £2.21 billion, of which £1.03 billion or 47% was for concessionary travel.
Chart 13 shows that in real terms total net support in metropolitan areas has remained at a similar level since 1996/97. Non-metropolitan areas and London have seen increases in support but both have declined from their respective peaks in 2010/11 and 2008/09.
Financial outlook
BSOG
One form of central government support for buses. The rate at which BSOG is paid was cut by 20% from April 2012. From October 2013, BSOG for London was devolved to Transport for London.
Chart 12: Local bus fares index by metropolitan area status: England, quarterly March 2005 to March 2017, current prices (table BUS0415a)
2005 2006 2007 2008 2009 2010 2011 2012 2013 2014 2015 2016 201780
90
100
110
120
130
140
150
160
170
180
Launch of the English National Concessionary Travel scheme (April 2006)
Metropolitan areasLondon
England
Non-metropolitan areas
All items retail prices index
Index: March 2005 = 100

Annual bus statistics: England 2016/17 - Page 15
Chart 13: Total net support by central and local government for local bus services and concessionary travel by area type: England, 1996/97 to 2016/17 (2016/17 prices) (table BUS0502b)
Operator revenue
In 2016/17, the total estimated operating revenue for local bus services in England was £5.54 billion. Passenger fare receipts made up the largest proportion of operating revenue: £3.22 billion or 58% of operating revenue (see chart 14). Revenue from passenger receipts has increased on average each year by 0.8% in real terms between 2004/05 and 2016/17.
BSOG has decreased by 43% in real terms between 2004/05 and 2016/17. In 2004/05, BSOG made up 9% of operating revenue but in 2016/17 this proportion had fallen to 5%. Some of this decrease will be due to BSOG in London being devolved to Transport for London.
Operating revenue from concessionary fare reimbursement has more than doubled over the same period from £0.49 billion to £1.03 billion. This increase reflects the wider coverage of the concessionary travel scheme (moving from a local authority to a national scheme), increased eligibility and a larger proportion of elderly people in the wider population.
Chart 14: Operating revenue for local bus services by revenue type: England, 2004/05 to 2016/17, current prices (table BUS0501a) Types of revenue
for operators Fare receipts: on and off bus fares Public transport support: payments from local authorities, mostly for running supported services Concessionary reimbursement: from LAs for carrying concessionary passengers BSOG: fuel duty rebate from DfT Other sources of income excluded.
0
1
2
3
4
5
6
2004/05 2006/07 2008/09 2010/11 2012/13 2014/15 2016/17
£ billion
Bus Services Operators Grant
Concessionarytravel
Gross public transport support
Passenger fare receipts
0.0
0.2
0.4
0.6
0.8
1.0
1.2
96/97 01/02 06/07 11/12 16/17
£ billion (2016/17 prices)
0.0
0.2
0.4
0.6
0.8
1.0
1.2
96/97 01/02 06/07 11/12 16/170.0
0.2
0.4
0.6
0.8
1.0
1.2
96/97 01/02 06/07 11/12 16/17
London Met areas Non-met areas

Annual bus statistics: England 2016/17 - Page 16
Operator costs
In England outside London, between 2004/05 and 2016/17, operator costs for local bus services increased from £2.20 billion to £3.03 billion (see chart 15). This is an average annual real terms increase of 0.7%. A more detailed index of bus industry cost is compiled by the Confederation of Passenger Transport.
Chart 15: Operating cost for local bus services: England outside London, 2004/05 to 2016/17, current prices (table BUS0406a)
In 2016/17, 82.7% of non-frequent services in England ran on time. This is very similar to the level seen since 2011/12 (see chart 16). ‘On time’ is defined as one between 1 minute early and 5 minutes 59 seconds late.
Chart 16: Percentage of non-frequent services running ‘on time’:
England, 2007/08 to 2016/17 (table bus0902)
Bus punctuality
Bus punctuality data Bus punctuality statistics provide one measure of the performance of local bus services based on data reported by local authorities who monitor punctuality using manual surveys or data from electronic systems. There are different measures of punctuality for frequent and non-frequent services: a frequent service is one that has six or more buses per hour. Several areas have no frequent services.
Bus timetable data Timetable data provides more detailed information on when and where bus services run, and who operates them than the other sources in this publication. An analysis of bus timetable data from the Traveline National Dataset was included in last year’s publication (see page 12 of the release).
0
1
2
3
2004/05 2006/07 2008/09 2010/11 2012/13 2014/15 2016/17
Operating cost (£ billion)
79.479.8 79.8
81.4
82.883.1 83.1
82.982.6
07/08 08/09 09/10 10/11 11/12 12/13 13/14 14/15 15/16 16/17
% of non-frequent services on time
82.7%on time in 2016/17

Annual bus statistics: England 2016/17 - Page 17
At the regional level bus service punctuality varied between 80.0% and 89.4% (see chart 17). At the local authority level there was greater variation ranging between 60% and 96%.
Chart 17: Percentage of non-frequent services running on time: England, 2016/17 (table bus0902)
The Transport Focus Bus Passenger survey gathers information on levels of satisfaction of bus users.
In 2016, 87% of passengers in England outside London were satisfied with their journey. This is virtually unchanged from 2015 when journey satisfaction was at 86%. On value for money, 65% of fare paying passengers were satisfied that their service provided value for money, up from 63% in 2015. On the punctuality of their service, 73% of passengers were satisfied, a small fall from 75% in 2015. Passenger satisfaction with the length of time taken for their journey remained the same in 2016 as in 2015 at 84%.
Frequent services Data on the average excess waiting time for frequent services by local authority in England can be found in table bus0903.
Bus passenger satisfaction
Bus PassengerSurvey Data from the Bus Passenger Survey (BPS) is managed by the independent transport user watchdog Transport Focus. Note that the statistics from the BPS are not National Statistics.
North East89.4%
South West80.9%
South East82.8%
East84.3%
West Midlands 83.7%
North West83.9%
East Midlands 82.6%
Yorkshire & the Humber 83.6%
London 80%
Annual bus statistics: England 2016/17 - Page 18
The figures for 2016 show that for overall satisfaction, punctuality and length of time for journey, passengers using a free pass had higher levels of satisfaction than fare-paying passengers.
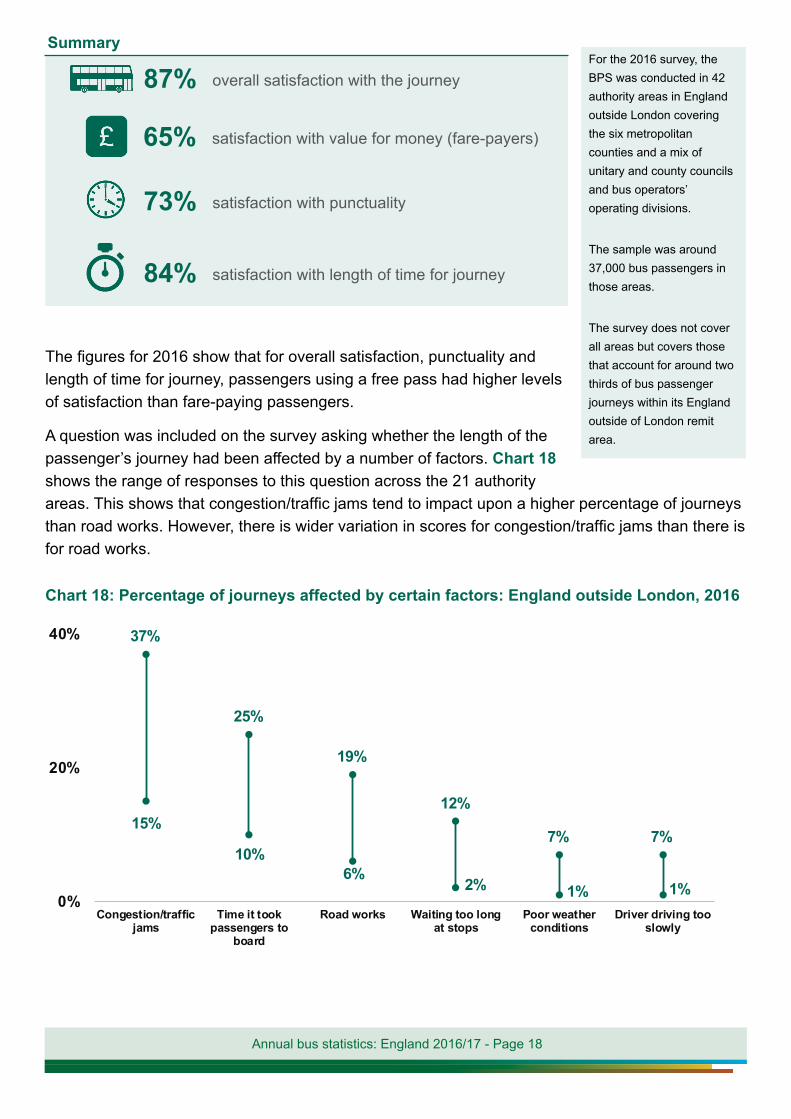
A question was included on the survey asking whether the length of the passenger’s journey had been affected by a number of factors. Chart 18 shows the range of responses to this question across the 21 authority areas. This shows that congestion/traffic jams tend to impact upon a higher percentage of journeys than road works. However, there is wider variation in scores for congestion/traffic jams than there is for road works.
Chart 18: Percentage of journeys affected by certain factors: England outside London, 2016
For the 2016 survey, the BPS was conducted in 42 authority areas in England outside London covering the six metropolitan counties and a mix of unitary and county councils and bus operators’ operating divisions.
The sample was around 37,000 bus passengers in those areas.
The survey does not cover all areas but covers those that account for around two thirds of bus passenger journeys within its England outside of London remit area.
87% overall satisfaction with the journey
65% satisfaction with value for money (fare-payers)
73% satisfaction with punctuality
84% satisfaction with length of time for journey
Summary
37%
25%
19%
12%
7% 7%15%
10%6% 2% 1% 1%
0%
20%
40%
Congestion/trafficjams
Time it tookpassengers to
board
Road works Waiting too longat stops
Poor weatherconditions
Driver driving tooslowly

Annual bus statistics: England 2016/17 - Page 19
The National Travel Survey (NTS) gathers data on personal travel behaviour across England. NTS data can be used to analyse users of local buses.
Why people travelled on local bus
Commuting, leisure and shopping were the most common purposes for journeys by local bus in England in 2016. The split by journey purpose for all public transport was similar to the split for local bus (see chart 19).
Chart 19: Purpose for using local bus and all public transport modes by the proportion of stages: England, 2016
Local bus
All public transport
Differences in why people travel on local bus between England outside London and London include:
► A higher proportion of local bus journeys for people living in London were for commuting than those in England outside London (32% of stages for London and 19% of stages for England outside London).
► A higher proportion of local bus journeys for people living in England outside London were for shopping than those in London (27% of stages in England outside London and 16% of stages in London).
Bus passengers
National Travel Survey The National Travel Survey is a household survey carried out on around 16,000 individuals in England every year. For more information see https://www.gov.uk/government/collections/national-travel-survey-statistics.
In the National Travel Survey local bus includes all ‘local’ services, and is split into London and non-London bus services, but excludes express services, excursions and tours (non-local bus).
What is a stage? Every trip can consist of one or more stages. A new stage is defined when there is a change in the mode of transport.
24%
3%
17% 23% 9% 21%
3%
Commuting Business Education Shopping Leisure OtherPersonal business
31% 6% 12% 16% 8% 25%
Commuting Business Education Shopping Leisure OtherPersonal business
2%
Annual bus statistics: England 2016/17 - Page 20
Who travels on local buses?
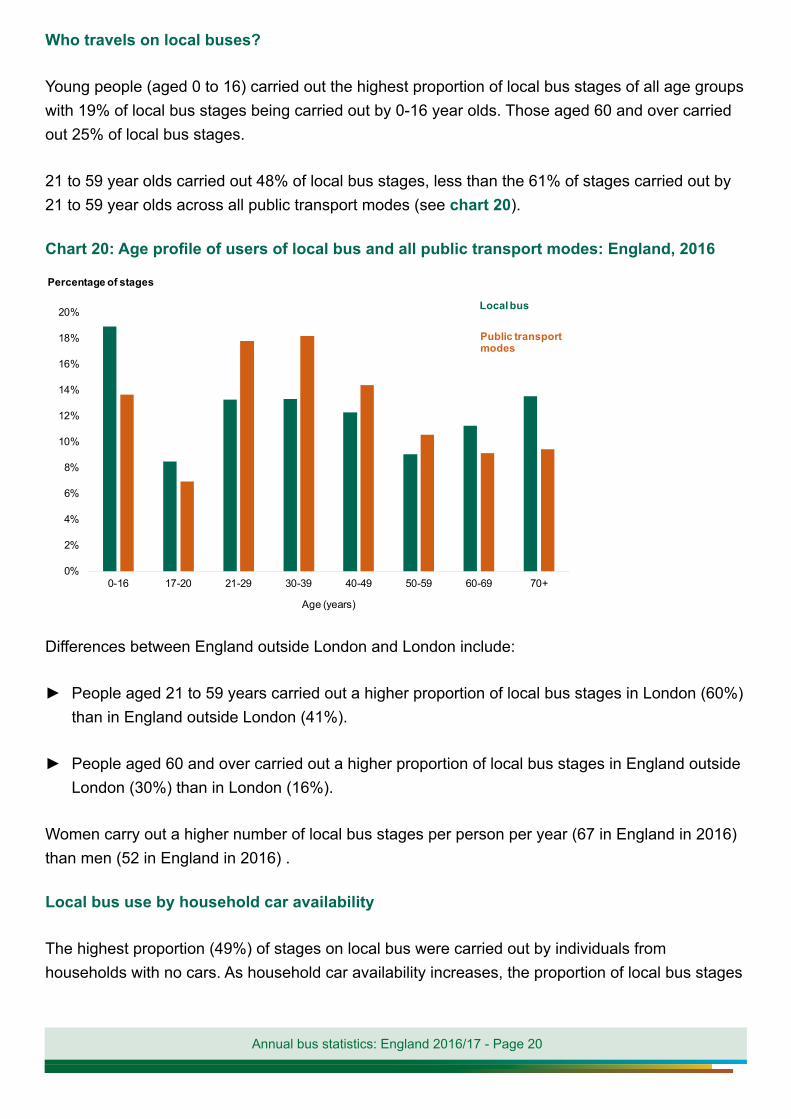
Young people (aged 0 to 16) carried out the highest proportion of local bus stages of all age groups with 19% of local bus stages being carried out by 0-16 year olds. Those aged 60 and over carried out 25% of local bus stages.
21 to 59 year olds carried out 48% of local bus stages, less than the 61% of stages carried out by 21 to 59 year olds across all public transport modes (see chart 20).
Chart 20: Age profile of users of local bus and all public transport modes: England, 2016
Differences between England outside London and London include:
► People aged 21 to 59 years carried out a higher proportion of local bus stages in London (60%) than in England outside London (41%).
► People aged 60 and over carried out a higher proportion of local bus stages in England outside London (30%) than in London (16%).
Women carry out a higher number of local bus stages per person per year (67 in England in 2016) than men (52 in England in 2016) .
Local bus use by household car availability
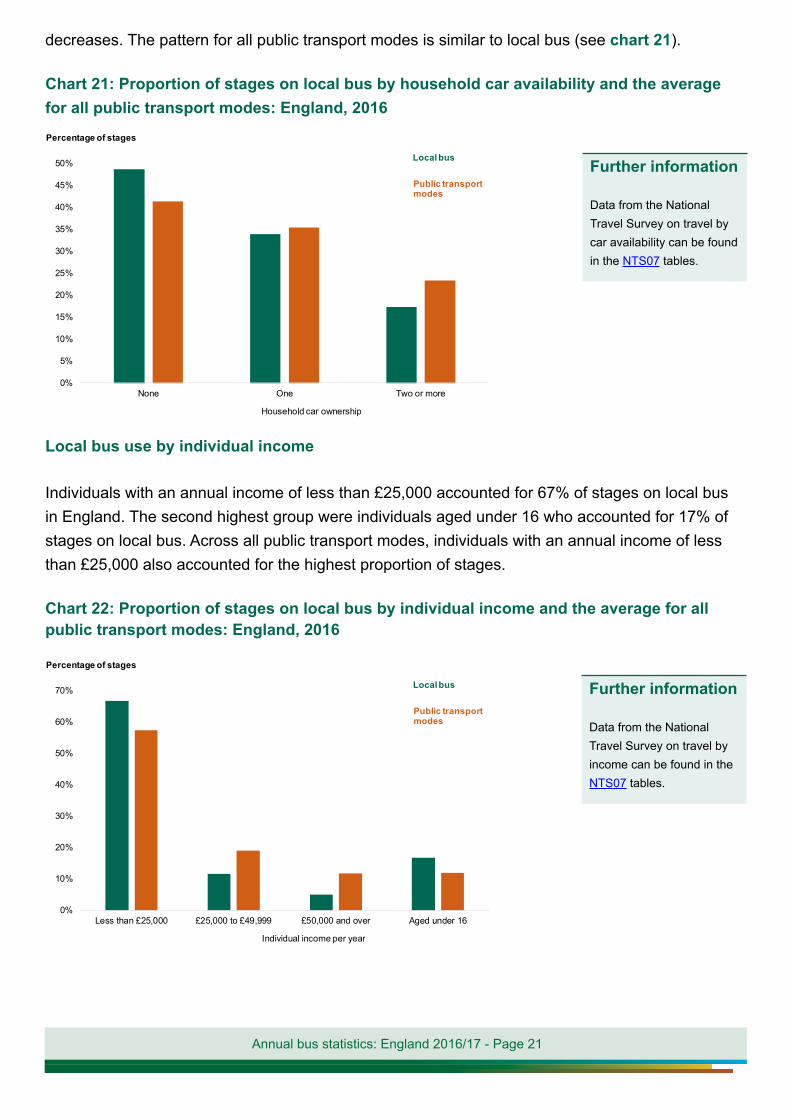
The highest proportion (49%) of stages on local bus were carried out by individuals from households with no cars. As household car availability increases, the proportion of local bus stages
0%
2%
4%
6%
8%
10%
12%
14%
16%
18%
20%
0-16 17-20 21-29 30-39 40-49 50-59 60-69 70+
Age (years)
Percentage of stages
Local bus
Public transport modes
Annual bus statistics: England 2016/17 - Page 21
decreases. The pattern for all public transport modes is similar to local bus (see chart 21).
Chart 21: Proportion of stages on local bus by household car availability and the average for all public transport modes: England, 2016
Local bus use by individual income
Individuals with an annual income of less than £25,000 accounted for 67% of stages on local bus in England. The second highest group were individuals aged under 16 who accounted for 17% of stages on local bus. Across all public transport modes, individuals with an annual income of less than £25,000 also accounted for the highest proportion of stages.
Chart 22: Proportion of stages on local bus by individual income and the average for all public transport modes: England, 2016
0%
5%
10%
15%
20%
25%
30%
35%
40%
45%
50%
None One Two or more
Household car ownership
Percentage of stages
Local bus
Public transport modes
0%
10%
20%
30%
40%
50%
60%
70%
Less than £25,000 £25,000 to £49,999 £50,000 and over Aged under 16
Individual income per year
Percentage of stages
Local bus
Public transport modes
Further information Data from the National Travel Survey on travel by car availability can be found in the NTS07 tables.
Further information Data from the National Travel Survey on travel by income can be found in the NTS07 tables.

Annual bus statistics: England 2016/17 - Page 22
Differences between NTS data and data collected from bus operators
NTS data is derived from a household survey of England residents, whereas the data on passenger journeys, vehicle kilometres etc is sourced directly from local bus operators. There are a number of definitional differences between the NTS data on users of local bus and the data sourced directly from local bus operators. These include:
► The NTS data gives stages per person per year, as the NTS captures travel information of people, and the journeys that they make. The data from local bus operators counts passenger journeys and not the number of individuals. We know from this data that 4.44 billion passenger journeys were undertaken on local bus services in England in 2016/17, but we don’t know the number of individuals that made these journeys (some individuals will have made more than one journey over 2016/17).
► In the NTS, a boarding is when someone changes from one bus to another bus, using the same ticket. If a new ticket is required this would be counted as a new stage of the trip. Therefore, a person who uses one ticket and changes bus once (uses two buses) would be recorded as one stage in the NTS and two boardings. However, in the data provided by local bus operators this would be counted as two passenger journeys.
The Labour Force Survey collects information about individuals in the labour market. The data can be used to provide insight on bus and coach drivers.
There were an estimated 104,000 bus and coach drivers in England during 2016/17, 2% lower than ten years ago (107,000 in 2006/07).
Chart 23: Number of bus and coach drivers, England, 2006/07 to 2016/17 (Labour Force Survey)
Bus and coach driversLabour Force Survey The Labour Force Survey (LFS) is a large study of the employment circumstances of the UK population, ran by the Office for National Statistics (ONS). More information can be found here
0
20,000
40,000
60,000
80,000
100,000
120,000
140,000
2006/07 2008/09 2010/11 2012/13 2014/15 2016/17
Drivers
104,000drivers in 2016/17
Drivers The drivers in this section are defined using the Standard occupational classification system, SOC 2010, as “Bus and coach drivers” (code 8213), which will contain both bus and coach drivers. The respondent reports their occupation to the interviewer and is then classified in this way during the interview, so whether the respondent was a bus or coach driver cannot be determined.

Annual bus statistics: England 2016/17 - Page 23
Who drives buses?
91% of drivers were male in 2016/17.
In 2016/17, the average age of a driver was 49 years old, with 23% of drivers being aged under 40. Those aged 60 or over made up 25% of drivers. There has been a slight shift in the age profile of drivers over the past 10 years, with more drivers aged 60 and over and fewer drivers aged 50 to 59. The proportion aged under 30, 30 to 39 and 40 to 49 has remained similar between 2006/07 and 2016/17 (see chart 24).
The two main ethnic groups of drivers were White and Asian or Asian British in 2016/17, making up 70% and 16% of drivers respectively. Non-UK nationals accounted for 15% of drivers in England in 2016/17, slightly higher than the 12% in 2006/07.
Chart 24: Age profile of bus and coach drivers, England, 2006/07 and 2016/17 (Labour Force Survey)
What are drivers working patterns?
In 2016/17, 4% of drivers were self-employed, which is similar to 2006/07 (5%). In the same period, 19% of drivers worked part time, which has been broadly stable over the last ten years.
In April to June 2016, the majority of drivers usually worked 5 days a week (59%). 17% of drivers worked 4 days or less per week in April to June 2016 (see chart 25).
0%
5%
10%
15%
20%
25%
30%
35%
Under 30 30-39 40-49 50-59 60+
Age (years)
2016/17
2006/07
% of drivers Further information Data on weekly earnings and hours worked from the Annual Survey of Hours and Earnings (ASHE) run by the Office for National Statistics is available for bus and coach drivers in tables bus0703 and bus0704. Further information on the ASHE can be found here.
In April 2016, median gross weekly earnings for full-time bus and coach drivers in the UK were £477. The median number of paid hours worked per week by full-time bus and coach drivers was 42.7 hours.
91% 9%

Annual bus statistics: England 2016/17 - Page 24
Chart 25: Profile of usual number of days worked by bus and coach drivers, England, April to June 2016 (Labour Force Survey)
Users and uses of these statistics
These statistics provide key information on trends in the bus sector. Within the Department for Transport they are used for:
► Ministerial briefing and to answer public enquiries;
► As background to policy development;
► Monitoring trends in the bus sector, for example in relation to accessible buses;
► The bus punctuality figures are used to monitor progress for the DfT business plan indicator related to the proportion of buses running on time (www.gov.uk/government/publications/input-and-impact-indicators); and
► By economists in modelling policy options (for example related to reform of bus subsidy).
Outside DfT known uses include:
► Passenger journeys figures are used as a measure of the overall health/state of the industry, for example by private research organisations, and are occasionally reported in the trade press;
► Local authorities may use these statistics to compare trends in their area with the national picture;
► These statistics have also provided background information for recent reports by the Transport
0%
10%
20%
30%
40%
50%
60%
70%
4 days or less 5 6 7Usual number of days worked
Background information
National Statistics
National Statistics are produced to high professional standards set out in the National Statistics Code of Practice. They undergo regular quality assurance reviews to ensure they meet customer needs: www.statisticsauthority.gov.uk/assessment/code-of-practice/index.html. For details of ministers and officials who receive pre-release access to these statistics up to 24 hours before release: www.gov.uk/government/collections/bus-statistics
Annual bus statistics: England 2016/17 - Page 25
Select Committee and Competition Commission;
► Bus fares data are used by the Office for National Statistics in calculating the Retail and Consumer Price Indices and in the National Accounts.
Strengths and weaknesses of the data
These statistics are derived from a number of sources, with the main source being the DfT annual Public Service Vehicle (PSV) survey of over 500 local bus operators which provides data on passenger journeys, vehicle miles, revenue and costs, and vehicles and staff. However, certain statistics (for example annual statistics on bus fares) are derived from smaller surveys of the larger bus operators, or from local authorities. Information on passenger journeys and bus mileage for London is provided by Transport for London.
Many of these statistics have been collected on a broadly comparable basis from operators for many years. However, following revisions to the methodology used to compile the published figures, 2004/05 is the earliest year for which figures are comparable on exactly the same basis.
The PSV survey uses imputation techniques to derive key figures for operators who were either not selected in the sample for that year, or who did not respond. On occasion, imputations for earlier years can be improved using directly-reported data for later years. Minor revisions to back-data can occur as a result, although trends are rarely affected substantively.
For the key indicators (passenger journeys and vehicle miles operated) the data provided by operators covers around, or above, 90% of the total figure, with the remainder imputed.
Comparison with other sources suggests that, at aggregate (national) level, the statistics are likely to provide a reasonably robust measure of levels and broad trends. However, figures representing smaller groups of operators and single year on year changes should be treated with caution as these are more susceptible to measurement errors (for example, an inaccurate return by an operator, or a change in an operator’s method of producing the figures) which are more likely to even out at the national level. Regional, and particularly local authority, level figures should be interpreted with caution.
Further details of the data sources and methods used in the production of these statistics can be found in the notes and definitions document available via: www.gov.uk/government/publications/buses-statistics-guidance
Next update to bus statistics Quarterly bus statistics for July to September will be released on 19 December 2017. The next annual bus statistics will be published in Autumn 2018.
To hear more about DfT statistics publications as they are released please follow us on Twitter via our @DfTstats account: http://www.twitter.com/DfTstats TWITTER, TWEET, RETWEET and the Twitter logo are trademarks of Twitter, Inc. or its affiliates