improving student outcomes with advanced analytics
TRANSCRIPT

WHITE PAPER
Improving Student Outcomes with Advanced AnalyticsEnsuring growth opportunities for all students

SAS White Paper
Table of Contents
Introduction . . . . . . . . . . . . . . . . . . . . . . . . . . . . . . . . . . . . . . . . . . . . . . 1
Challenges Facing Educators . . . . . . . . . . . . . . . . . . . . . . . . . . . . . . . 2
Immersing in Data . . . . . . . . . . . . . . . . . . . . . . . . . . . . . . . . . . . . . . . . 4
Achievement and Progress . . . . . . . . . . . . . . . . . . . . . . . . . . . . . . . . . 5
Holistic Student Assessment . . . . . . . . . . . . . . . . . . . . . . . . . . . . . . . 6
Student Projections . . . . . . . . . . . . . . . . . . . . . . . . . . . . . . . . . . . . . . . 7
Empowering School Systems . . . . . . . . . . . . . . . . . . . . . . . . . . . . . . . 8
Teachers . . . . . . . . . . . . . . . . . . . . . . . . . . . . . . . . . . . . . . . . . . . . . . . . . . . . . . . 8
Student Development . . . . . . . . . . . . . . . . . . . . . . . . . . . . . . . . . . . . . . . . . . 8
Professional Development . . . . . . . . . . . . . . . . . . . . . . . . . . . . . . . . . . . . . . . 9
Schools . . . . . . . . . . . . . . . . . . . . . . . . . . . . . . . . . . . . . . . . . . . . . . . . 9
Human Capital Development Decisions . . . . . . . . . . . . . . . . . . . . . . . . . . . . . 10
Continuity of Learning . . . . . . . . . . . . . . . . . . . . . . . . . . . . . . . . . . . . . . . . . . 10
Districts . . . . . . . . . . . . . . . . . . . . . . . . . . . . . . . . . . . . . . . . . . . . . . . . 11
Planning Ahead . . . . . . . . . . . . . . . . . . . . . . . . . . . . . . . . . . . . . . . . . . . . . . . 11
Strategic Staffing . . . . . . . . . . . . . . . . . . . . . . . . . . . . . . . . . . . . . . . . . . . . . . 11
Parents . . . . . . . . . . . . . . . . . . . . . . . . . . . . . . . . . . . . . . . . . . . . . . . . 12
Final Thoughts . . . . . . . . . . . . . . . . . . . . . . . . . . . . . . . . . . . . . . . . . . . . 13
About SAS . . . . . . . . . . . . . . . . . . . . . . . . . . . . . . . . . . . . . . . . . . . . . . . 14

1
Improving Student Outcomes with Advanced Analytics
IntroductionThe single largest issue on the minds of Americans today is the state of the economy . Amid budget shortfalls, slow or stagnant growth and declining revenues, states have been prompted to implement reform in several areas of governing . Many are recognizing the increasing need for long-term strategies to prepare our nation for a sustainable future, which begs the question: How can we ensure a sustainable future of economic vitality and competitiveness in the purview of today’s global society?
Perhaps the most influential factor in the future of our economy is public education . Maintaining a globally competitive workforce begins in the classroom and educators must work creatively and effectively for impact . If our citizens and economies are to remain competitive, state leaders must also implement policies and allocate resources to improve the effectiveness of the educational framework in public schools . Public schools are not only the foundation for a thriving economy, but they are in fact paramount to developing our greatest resource – human capital .
A successful education system flourishes in the harmonization of all factors that influence learning . Educators, environments, family backgrounds, health and other determinants all have a part to play in the success of a single student’s education . As a nation we must implement reform comprehensively to address all of these considerations . However, the most important variable to address regarding student growth and progress is that which is at the forefront of the issue: teachers .
Teachers matter more than any other contributing factor inside schools . In fact, 65 percent of student progress can be directly attributed to the teacher, 30 percent to the school, and 5 percent to the district (Sanders, 20071) . With teachers having such a large influence on students’ academic success, it is imperative to understand exactly what highly effective teachers actually do in the classroom . Identifying these teachers, recognizing them, and learning from them are important steps toward ensuring that each student has an effective educator . Equally important is quickly identifying teachers who are struggling in the classroom in order to give them the support and opportunity so that they may follow a successful path, which will, by extension, support the success of their students .
Fundamental to these ideas and to transforming our nation’s schools is the need for accurate information to more precisely measure teachers’ influence on student learning . Without understanding the impact of educators on student outcomes, educators and policymakers may not have the most reliable information with which to make policy and instructional decisions . Using data to understand both students’ and teachers’ strengths and weaknesses can allow classrooms to thrive by implementing strategies that maximize the potential of both parties . It is the impact of this effort that will lead our nation’s schools toward real education transformation, and ultimately, the necessary strong foundation to boost our nation’s economic prosperity .
1 Sanders, William, “Improving Teaching Effectiveness by Focusing on Progress Rates of Individual Students,” Presented at the Power of Two: Progress & Achievement; National Value-Added Conference, Columbus, Ohio 2007.
The most important variable
to address regarding student
growth and progress is that
which is at the forefront of the
issue: teachers.
2
SAS White Paper
Each student enters the classroom with a unique set of qualities and skills . This can make educating challenging and the traditional education model of providing a standard curriculum to each student an ineffective teaching method . In order to achieve transformational results with students, the educators’ goals must be more far-reaching: to empower and strengthen students at all achievement levels and help develop them to be valuable contributors to society . To achieve these goals, educators must recognize the need to treat students holistically through:
• Meeting the academic needs of students regardless of where they are. That is, developing low-achieving students, supporting middle-range students, and challenging high-level students .
• Ensuring progress each year by every student. Growth is not about every student reaching the same level of achievement; it is about every individual student’s advancement and improvement each school year .
• Maximizing opportunities and successes for students in both the short- and long-term. Meeting short-term goals, such as passing the next math test, should not be the ultimate goal . Educators must ensure that students are fully comprehending and applying the material they are learning so that they can build on it from year to year and increase its value . Furthermore, public schools must work toward attaining long-term goals for their students, such as college and career readiness .
Challenges Facing Educators The public education system historically has operated under a quantitative paradigm that measures success with benchmarks like: “How many students were served?” and “How many students received a passing grade?” This approach has not facilitated the ability to truly understand the impacts of educators’ work on students served . Moreover, it has driven educators to often use standard deliveries of instruction, focusing highly on outputs as good measures of teaching effectiveness . This approach has its foundation in two assumptions:
1 . If a student does not reach a certain achievement level, he or she has not made progress. It is vital to recognize that each student is at a different academic level and will make different amounts of progress.
2. If students take the same courses, they will reach the same levels of achievement. Each student enters and leaves the classroom at different points of achievement. Therefore, every student needs differentiated education to maximize his or her own individual potential.
These assumptions have driven school systems to accept a variety of quantitative outputs as optimal estimates of a student’s progress . While these figures are useful and necessary, they do not provide insight on qualitative impacts relative to a student .
Without understanding the
impact of educators on student
outcomes, educators and
policymakers may not have
the most reliable information
with which to make policy and
instructional decisions.

3
Improving Student Outcomes with Advanced Analytics
In addition to simply tracking outputs such as SAT scores and graduation rates, educators must leverage these outputs to identify and measure outcomes, as illustrated in Figure 1 . It is imperative to evaluate the extent to which a student has made progress in a particular classroom, school or district to begin to address important instructional decisions .
Outputs Outcomes
How much growth hasbeen made by a studentin a given time period?
Is this growth enough to reach the student’s future goals?
How does this growth compare to that of previous years?
What factors can this growth be attributed to?
What impact has ateacher, school or district had on this student?
Number of students served
Graduation rates
Annual Yearly Progress (AYP)
Grade point average
End-of-Course or End-of-Grade tests
Transcript information
SAT/ACT score
Advanced Placement test scores
+Student
Data
Student Growth
EmpowerTeachers,Schools,Districts,Parents
OutcomesAnalysis
Time
Achievement
3
4
Achievement
Actual Achievement
Actual Progress
Expected Progress
Expected Achievement
4}In�uence
of educator
Level of Pro�ciency
Math
Language Arts
3 4 5 6 7 8 Grade
Level of Pro�ciency
Math
Language Arts
5 6 7 8 Grade
SAT Exam
AverageScore of STEM Major
Likely to Graduate College
4-Year CollegeReadiness
Student Growth
EmpowerTeachers,Schools,Districts,Parents
College ReadinessCollege GraduationWorkforce ReadinessCareer ReadinessMastery of Skills
=
Figure 1. Beyond tracking outputs, educators can and must leverage outputs to identify and measure outcomes.
How can public school systems look beyond outputs and begin to evaluate outcomes? Outcomes analysis requires that states address all levels of the education spectrum – student, teacher, school and district – to strategically maximize instructional effectiveness . Effective delivery of instruction will not only result in better outcomes for students, but will also support the necessary development of a future workforce .
Student data is the foundational tool in building a successful educational framework that empowers school systems with valuable insight . Data that is continually collected can be assessed and analyzed in multiple ways to generate value for schools . Ultimately, examining the influence of educators on students and utilizing data to the fullest extent will help school systems achieve improved student outcomes .
In addition to simply tracking
outputs such as SAT scores
and graduation rates, educators
must leverage these outputs to
identify and measure outcomes.
Student data is the foundational
tool in building a successful
educational framework that
empowers school systems with
valuable insight. Ultimately,
examining the influence of
educators on students and
utilizing data to the fullest extent
will help school systems achieve
improved student outcomes.

4
SAS White Paper
Outputs Outcomes
How much growth hasbeen made by a studentin a given time period?
Is this growth enough to reach the student’s future goals?
How does this growth compare to that of previous years?
What factors can this growth be attributed to?
What impact has ateacher, school or district had on this student?
Number of students served
Graduation rates
Annual Yearly Progress (AYP)
Grade point average
End-of-Course or End-of-Grade tests
Transcript information
SAT/ACT score
Advanced Placement test scores
+Student
Data
Student Growth
EmpowerTeachers,Schools,Districts,Parents
OutcomesAnalysis
Time
Achievement
3
4
Achievement
Actual Achievement
Actual Progress
Expected Progress
Expected Achievement
4}In�uence
of educator
Level of Pro�ciency
Math
Language Arts
3 4 5 6 7 8 Grade
Level of Pro�ciency
Math
Language Arts
5 6 7 8 Grade
SAT Exam
AverageScore of STEM Major
Likely to Graduate College
4-Year CollegeReadiness
Student Growth
EmpowerTeachers,Schools,Districts,Parents
College ReadinessCollege GraduationWorkforce ReadinessCareer ReadinessMastery of Skills
=
Figure 2. Student data is the foundation for growth and progress.
Empowering all levels of the educational spectrum is the panacea to ensuring every student receives quality education from an effective teacher . Teachers are at the frontline of the issue; if we don’t empower and invest in our educators, we will not see our student population make the significant progress we need for future success .
Immersing in Data Without reliable information about how a teacher is performing, it is not possible to provide the needed support to advance instruction and the resultant student outcomes . The vast amount of data collected through No Child Left Behind opens the door for significant opportunity for assessment and analysis . If school systems innovatively use this data, they will be able to analyze the impact of variables on students, assess the student holistically and project student outcomes .
5
Improving Student Outcomes with Advanced Analytics
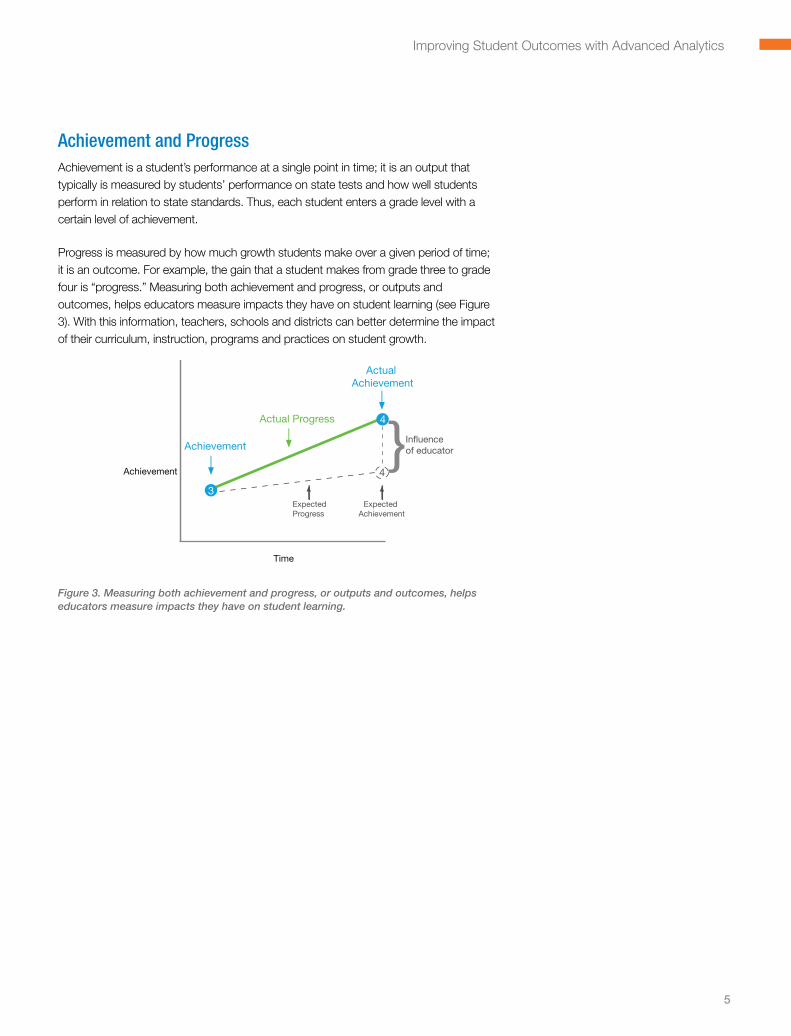
Achievement and ProgressAchievement is a student’s performance at a single point in time; it is an output that typically is measured by students’ performance on state tests and how well students perform in relation to state standards . Thus, each student enters a grade level with a certain level of achievement .
Progress is measured by how much growth students make over a given period of time; it is an outcome . For example, the gain that a student makes from grade three to grade four is “progress .” Measuring both achievement and progress, or outputs and outcomes, helps educators measure impacts they have on student learning (see Figure 3) . With this information, teachers, schools and districts can better determine the impact of their curriculum, instruction, programs and practices on student growth .
Outputs Outcomes
How much growth hasbeen made by a studentin a given time period?
Is this growth enough to reach the student’s future goals?
How does this growth compare to that of previous years?
What factors can this growth be attributed to?
What impact has ateacher, school or district had on this student?
Number of students served
Graduation rates
Annual Yearly Progress (AYP)
Grade point average
End-of-Course or End-of-Grade tests
Transcript information
SAT/ACT score
Advanced Placement test scores
+Student
Data
Student Growth
EmpowerTeachers,Schools,Districts,Parents
OutcomesAnalysis
Time
Achievement
3
4
Achievement
Actual Achievement
Actual Progress
Expected Progress
Expected Achievement
4}In�uence
of educator
Level of Pro�ciency
Math
Language Arts
3 4 5 6 7 8 Grade
Level of Pro�ciency
Math
Language Arts
5 6 7 8 Grade
SAT Exam
AverageScore of STEM Major
Likely to Graduate College
4-Year CollegeReadiness
Student Growth
EmpowerTeachers,Schools,Districts,Parents
College ReadinessCollege GraduationWorkforce ReadinessCareer ReadinessMastery of Skills
=
Figure 3. Measuring both achievement and progress, or outputs and outcomes, helps educators measure impacts they have on student learning.

6
SAS White Paper
Holistic Student Assessment Measuring achievement and progress data allows educators to gain a holistic view of each of their students . A holistic view of a student enables us to visualize the entirety of the student’s learning across subject areas and grade levels to reflect strengths, weaknesses and potential . Educators can also compare multiple students, classrooms, departments, schools and districts . Figure 4 shows how it is possible to visualize achievement and progress in math and language arts across six grades for Student X .
Outputs Outcomes
How much growth hasbeen made by a studentin a given time period?
Is this growth enough to reach the student’s future goals?
How does this growth compare to that of previous years?
What factors can this growth be attributed to?
What impact has ateacher, school or district had on this student?
Number of students served
Graduation rates
Annual Yearly Progress (AYP)
Grade point average
End-of-Course or End-of-Grade tests
Transcript information
SAT/ACT score
Advanced Placement test scores
+Student
Data
Student Growth
EmpowerTeachers,Schools,Districts,Parents
OutcomesAnalysis
Time
Achievement
3
4
Achievement
Actual Achievement
Actual Progress
Expected Progress
Expected Achievement
4}In�uence
of educator
Level of Pro�ciency
Math
Language Arts
3 4 5 6 7 8 Grade
Level of Pro�ciency
Math
Language Arts
5 6 7 8 Grade
SAT Exam
AverageScore of STEM Major
Likely to Graduate College
4-Year CollegeReadiness
Student Growth
EmpowerTeachers,Schools,Districts,Parents
College ReadinessCollege GraduationWorkforce ReadinessCareer ReadinessMastery of Skills
=
Figure 4. Ability to visualize achievement and progress in math and language arts across six grades for Student X.
Viewing a student holistically allows several questions to be considered, such as:
• Howdoesthisstudent’sgrowthcomparetothatofsimilarpeergroups?
• Doesthisstudenthavethepotentialtobesuccessfulinadvancedcourses?
• Howarepre-algebraclassesinthisschoolperforming?Howdoesthiscomparetoother schools in the district?
• Arestudentsatallachievementlevelsmakingadequategrowth?
• Arelow-achievingstudentsmakingsignificantgrowthtowardproficiency?
• Arehighachieversmaintaininghighgrowthoraretheylosinggroundastheyprogress?

7
Improving Student Outcomes with Advanced Analytics
Student Projections Student data can be analyzed even further to visualize what the future outcomes of a student’s trajectory may be . For example, revisiting Student X, Figure 5 shows Student X’s projected level of achievement on the SAT exam in grade 11 . In addition, the projection includes multiple benchmarks of interest such as college readiness, college graduation and readiness for a STEM major . Student X meets all the above benchmarks .
Outputs Outcomes
How much growth hasbeen made by a studentin a given time period?
Is this growth enough to reach the student’s future goals?
How does this growth compare to that of previous years?
What factors can this growth be attributed to?
What impact has ateacher, school or district had on this student?
Number of students served
Graduation rates
Annual Yearly Progress (AYP)
Grade point average
End-of-Course or End-of-Grade tests
Transcript information
SAT/ACT score
Advanced Placement test scores
+Student
Data
Student Growth
EmpowerTeachers,Schools,Districts,Parents
OutcomesAnalysis
Time
Achievement
3
4
Achievement
Actual Achievement
Actual Progress
Expected Progress
Expected Achievement
4}In�uence
of educator
Level of Pro�ciency
Math
Language Arts
3 4 5 6 7 8 Grade
Level of Pro�ciency
Math
Language Arts
5 6 7 8 Grade
SAT Exam
AverageScore of STEM Major
Likely to Graduate College
4-Year CollegeReadiness
Student Growth
EmpowerTeachers,Schools,Districts,Parents
College ReadinessCollege GraduationWorkforce ReadinessCareer ReadinessMastery of Skills
=
Figure 5. Student X’s projected level of achievement on the SAT exam in grade 11 with multiple benchmarks of interest.
Student projections can answer questions about future outcomes, such as:
• WhereisthestudentlikelytoscoreonAPtests?
• HowwellwillthestudentperformontheSAT/ACTtest?
• Willthisstudentbecollege-ready?
• WillthisstudentbepreparedtopursueaSTEMmajor?
• Whatwillthefuturecostimplicationsbetothisstudent?
Student data can be analyzed
even further to visualize what the
future outcomes of a student’s
trajectory may be.
8
SAS White Paper
Empowering School Systems With accurate methods to analyze and assess student data, educators can have a plethora of information at their fingertips . Utilizing this information in novel ways is vastly significant for improving the state of our public schools . How can school systems utilize this data for day-to-day decision making?
Teachers
Empowering the school system has a trickle-down effect on its students, and if teachers can leverage data optimally, the best student outcomes can be met . Using holistic views of students, value-added information and student projections can empower teachers by giving them a road map to guide their instruction . Not only can data help teachers to develop their students, but it can assist them in developing themselves professionally .
Student Development
The number of innovative ways in which teachers can use data in the classroom is infinite . However, two of the key benefits of having data analysis as a resource are the ability to truly differentiate instruction and provide an earlier response to intervention . Value-added analysis can identify teacher effectiveness by student achievement level, shedding light on which teachers are most effective with low, middle and high achievers . While the most highly effective teachers tend to positively affect student growth at all achievement levels, most educators find that they have opportunities for improvement with certain subgroups . Having this comprehensive view of their students enables teachers to visualize where their instruction needs to be better differentiated in order to accelerate student growth at all achievement levels .
While this reflective analysis is critical to improved differentiated instruction, how can teachers know the needs of their next class of students? Forward-looking student projection data can be used before the school year even begins so that teachers know exactly which students are at risk of failing and need early response to intervention (RTI) . RTI is a tiered system of evidence-based interventions that contribute to identifying learning and behavioral problems, and improved instructional quality to provide all students with the best opportunities to succeed . Instead of trying to assess each student’s potential at the onset of the school year, educators can have this information before school begins . Therefore, teachers can optimize the time they have in the classroom and can be proactive from day one . Moreover, identifying this distribution of needs allows teachers to build an effective strategy for their classroom that will encourage, challenge and support their students . This includes more focused approaches to lesson planning, seating charts, student partnering and grouping, and modified projects and assignments .
Empowering the school system
has a trickle-down effect on its
students, and if teachers can
leverage data optimally, the best
student outcomes can be met.
Two of the key benefits of
having data analysis as a
resource are the ability to truly
differentiate instruction and
provide an earlier response
to intervention.
9
Improving Student Outcomes with Advanced Analytics
Data can also help with more abstract challenges, such as discipline infractions in the classroom . Discipline issues affect the entire classroom’s ability to learn, and take away from critical teaching and learning time . Using student assessments and projection data, teachers can better differentiate instruction for individual students and strike the perfect balance of appropriately challenging students while making connections to solid foundational knowledge . This balance is imperative for keeping students engaged because discipline incidents often arise when the curriculum or instruction are either too difficult, or too easy . Minimizing such academically related discipline issues helps students stay focused, and enables instructors to maximize their time in the classroom .
Professional Development
Student data not only facilitates the individual growth of students, but also gives teacherstheabilitytotailortheirownindividualgrowth/professionallearningplanstomeet their career development needs . Data analyses gives teachers a road map to develop their practice, which will by extension cultivate their students . However, given the increasing demands on teachers both inside and outside of the classroom, it is imperative that school leaders give teachers the dedicated time necessary to analyze data alone and in groups . Teachers need time to collaborate with peers in professional learning communities to dissect and understand their data, and reflect on the group’s collective strengths and weaknesses . This supports an environment of self-improvement through sharing and propagating the best practices of highly effective teachers, mentorship and camaraderie in the professional learning community .
Whichever way teachers choose to use the data, having access to it opens the door for creating an environment in which everyone can thrive .
Schools
Embracing data utilization offers an enormous opportunity for schools to support the success of their students and teachers . If teachers are given a road map rather than expectations, schools have the ability to transform their culture and environment to one of stability and progress .
Data helps schools to promote continuous improvement of their teachers, and enables them to provide the structures and support teachers need to succeed . As mentioned earlier, data can facilitate the collaboration of teachers and sharing of best practices . For instance, by understanding collective strengths and weaknesses, schools can provide targeted professional development for their teachers . They can leverage the practices of highly effective teachers across the broader teacher pool and can even promote cross-curricular and vertical discussions by gathering entire departments .
Data can also help with more
abstract challenges, such as
discipline infractions in the
classroom.
Student data not only facilitates
the individual growth of
students, but also gives teachers
the ability to tailor their own
individual growth/professional
learning plans to meet their
career development needs. Data
analyses gives teachers a road
map to develop their practice,
which will by extension cultivate
their students.
Data helps schools to promote
continuous improvement of
their teachers, and enables
them to provide the structures
and support teachers need to
succeed.

10
SAS White Paper
Having conversations around data also helps implement schoolwide mentoring programs for teachers, identify the best candidates within the school for leadership roles, and place teachers where they are needed the most . Rather than basing leadership decisions on seniority, data gives schools the opportunity to recognize teachers based on their successes . Moreover, a school that embraces the use of data can assure that its human resources are deployed in an informed manner; that is, to position teachers where they are most likely to be successful, and maximize the opportunity for teachers to be recognized and rewarded . This approach can contribute to:
• Arenewedschoolculture.
• Adecreaseinteacherturnoverrate.
• Astableandprogressiveschool.
Human Capital Development Decisions
With recent budget cuts highly affecting public schools, it is more imperative than ever that schools maximize the resources that they have . Teachers, like students, each encompass a unique set of skills, which is why schools must be staffed holistically, not as a collection of individual teachers . If schools are able to reflect on all of the skills and experience needed to support student needs, better deployment decisions can be made . When schools recognize which teachers are more effective with certain student populations, there exists an opportunity to distribute – more equitably and efficiently – teaching talent across the school and better match teachers with students .
Continuity of Learning
Oftentimes, student test scores will suffer during transition years, creating a disruption in their continuum of learning . For example, during common transition years, such as sixth or ninth grade, some students face difficulty in comprehending the new material in their classes . A lack of communication and lagging data sharing can contribute to this broken continuity between elementary and middle, or middle and high schools . Sixth grade and ninth grade teachers sometimes have very little information on their student’s potential in their respective subjects, making it difficult to know at which level of rigor, and at which point in the curricula to begin the course . If elementary, middle and high schools can jointly use student data to have conversations before the onset of the school year, teachers can make certain that they align their teaching strategies by reinforcing the appropriate material in the beginning of school year, and differentiating instruction according to their students’ needs .
Rather than basing leadership
decisions on seniority, data
gives schools the opportunity
to recognize teachers based on
their successes.
If elementary, middle and high
schools can jointly use student
data to have conversations
before the onset of the school
year, teachers can make certain
that they align their teaching
strategies by reinforcing the
appropriate material in the
beginning of school year,
and differentiating instruction
according to their students’
needs.
11
Improving Student Outcomes with Advanced Analytics
Districts
Districts are charged with making high-stake decisions that affect their entire public school system, therefore making it even more important that they are able to make well-informed decisions .
Planning Ahead
Districts can use student projections to plan ahead for student needs . For example, one school district may project to have more students prepared for Algebra 1 next year than have been in previous years . Rather than leave it up to particular teachers or schools to plan for the increases, districts can make an impactful decision districtwide that will facilitate and support the influx of Algebra 1 students . With data on projected demand for the course, districts can consider all of the affected variables to make an effective decision, such as:
• Thenumberofteachersneeded.
• Teachertraininganddevelopment.
• Schedulingconsiderations.
• Theavailabilityofcurricularandtechnologicalresources.
In addition to resource and human capital insight, student projections can also provide districts with compelling information for budgetary purposes . Districts can better garner the necessary funding from school boards, tax authorities, county commissioners or city councils when the needs are supported with accurate information .
Strategic Staffing
Just as schools can use data to more equitably and efficiently distribute teaching needs, districts can leverage the data to strategically staff all of their schools . Oftentimes, districts will find that some of their best educators are clustered in affluent schools, and want to draw these effective teachers to schools with higher percentages of low-income students . Rather than offer bonuses to any willing teacher, districts can use the data analyses to identify highly effective teachers and more strategically recruit and retain them . This not only ensures that students are placed with teachers who can effectively meet their needs, but also gives educators the opportunity to make a profound impact on students, schools and districts to improve their overall performance .
Districts can use data analyses
to identify highly effective
teachers and more strategically
recruit and retain them.

12
SAS White Paper
Parents
A parent’s presence in their child’s education and in the school community is unquestionably of significant value . While many types of parental involvement are beneficial to educational growth, students can experience large gains when a healthy partnership exists between schools and parents . Parents, however, commonly find themselves unable to connect with their student and the school as openly as needed . Data awareness can break down many of the barriers between parents and a child’s educators . When teachers have the data to support their students’ progress, they are able to have rich conversations with parents about opportunities for their student . Parent-teacher conferences can be much more productive and insightful for both parents and teachers, as the data gives parents a clearer picture of what it will take for theirchildtoachievehis/hergoals.Thisputstheminanidealpositiontosupportboththeir child and the child’s teacher’s efforts . Additionally, diminishing the barriers through data gives parents the opportunity to be included in and to initiate forward-looking discussions about course placement to make informed decisions for their child’s future . For example, if a student projection shows that the student is ready for an Advanced Placement course, parents can consider factors such as the cost of taking it now versus in college, or the benefit of earning college credit for the course . In other words, parents can be well-informed on the long-term implications of their decisions . This establishes a better environment for participatory decision making between the parents and students with teachers, guidance counselors and administrators .
When teachers have the data
to support their students’
progress, they are able to
have rich conversations with
parents about opportunities
for their student. Additionally,
diminishing the barriers
through data gives parents the
opportunity to be included in
and to initiate forward-looking
discussions about course
placement to make informed
decisions for their child’s future.

13
Improving Student Outcomes with Advanced Analytics
Final Thoughts
Outputs Outcomes
How much growth hasbeen made by a studentin a given time period?
Is this growth enough to reach the student’s future goals?
How does this growth compare to that of previous years?
What factors can this growth be attributed to?
What impact has ateacher, school or district had on this student?
Number of students served
Graduation rates
Annual Yearly Progress (AYP)
Grade point average
End-of-Course or End-of-Grade tests
Transcript information
SAT/ACT score
Advanced Placement test scores
+Student
Data
Student Growth
EmpowerTeachers,Schools,Districts,Parents
OutcomesAnalysis
Time
Achievement
3
4
Achievement
Actual Achievement
Actual Progress
Expected Progress
Expected Achievement
4}In�uence
of educator
Level of Pro�ciency
Math
Language Arts
3 4 5 6 7 8 Grade
Level of Pro�ciency
Math
Language Arts
5 6 7 8 Grade
SAT Exam
AverageScore of STEM Major
Likely to Graduate College
4-Year CollegeReadiness
Student Growth
EmpowerTeachers,Schools,Districts,Parents
College ReadinessCollege GraduationWorkforce ReadinessCareer ReadinessMastery of Skills
=
Figure 6. The impact of student growth.
As education continues to be an utmost priority for economic success, today’s students will require a superior learning experience that will allow them to succeed in the global economy of the 21st century . The public education system is critical in this effort . If students have the support and guidance from empowered educators, the learning process can be transformed into a rewarding experience in which students and teachers can work transparently as a team to meet student goals . This collaboration between students and educators can create the self-awareness among students to strike motivation and enthusiasm about their learning potential . Moreover, students can gain the skills necessary to navigate life and careers in an age of unprecedented global competition .
Empowering our educators through effective use of data can serve as the catalyst for a culture change that will ensure that students make significant growth to develop their readiness for college, the workplace and the global marketplace . Together, empowering the education system through information knowledge, we can reform our schools and secure our nation’s long-term economic prosperity .
Diminishing the barriers
through data gives parents the
opportunity to be included in
and to initiate forward-looking
discussions about course
placement to make informed
decisions for their child’s future.

SAS Institute Inc. World Headquarters +1 919 677 8000To contact your local SAS office, please visit: www.sas.com/offices
SAS and all other SAS Institute Inc. product or service names are registered trademarks or trademarks of SAS Institute Inc. in the USA and other countries. ® indicates USA registration. Other brand and product names are trademarks of their respective companies. Copyright © 2011, SAS Institute Inc. All rights reserved. 105507_S83232_1211
About SASSAS is the leader in business analytics software and services, and the largest independent vendor in the business intelligence market . Through innovative solutions delivered within an integrated framework, SAS helps customers at more than 50,000 sites improve performance and deliver value by making better decisions faster . Since 1976 SAS has been giving customers around the world THE POWER TO KNOW® .